Wells, NV Map & Demographics
Wells Map
Wells Overview
$25,228
PER CAPITA INCOME
$87,596
AVG FAMILY INCOME
$55,917
AVG HOUSEHOLD INCOME
0.53
INEQUALITY / GINI INDEX
1,057
TOTAL POPULATION
489
MALE POPULATION
568
FEMALE POPULATION
86.09
MALES / 100 FEMALES
116.16
FEMALES / 100 MALES
41.6
MEDIAN AGE
5.1
AVG FAMILY SIZE
3.5
AVG HOUSEHOLD SIZE
562
LABOR FORCE [ PEOPLE ]
65.6%
PERCENT IN LABOR FORCE
0.4%
UNEMPLOYMENT RATE
Wells Zip Codes
Wells Area Codes
Income in Wells
Income Overview in Wells
Per Capita Income in Wells is $25,228, while median incomes of families and households are $87,596 and $55,917 respectively.
| Characteristic | Number | Measure |
| Per Capita Income | 1,057 | $25,228 |
| Median Family Income | 178 | $87,596 |
| Mean Family Income | 178 | $100,799 |
| Median Household Income | 303 | $55,917 |
| Mean Household Income | 303 | $72,671 |
| Income Deficit | 178 | $0 |
| Wage / Income Gap (%) | 1,057 | 0.00% |
| Wage / Income Gap ($) | 1,057 | 100.00¢ per $1 |
| Gini / Inequality Index | 1,057 | 0.53 |
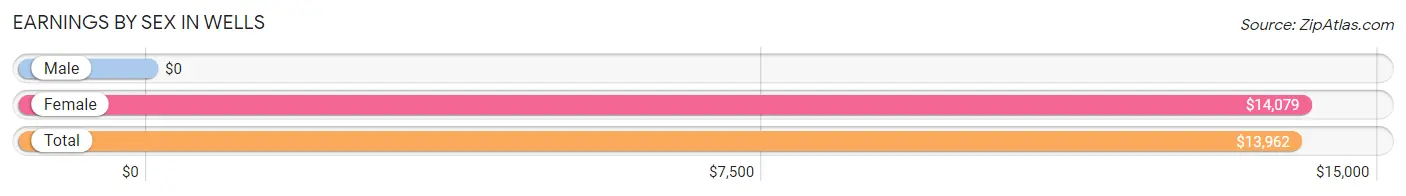
Earnings by Sex in Wells
| Sex | Number | Average Earnings |
| Male | 281 (47.8%) | $0 |
| Female | 307 (52.2%) | $14,079 |
| Total | 588 (100.0%) | $13,962 |
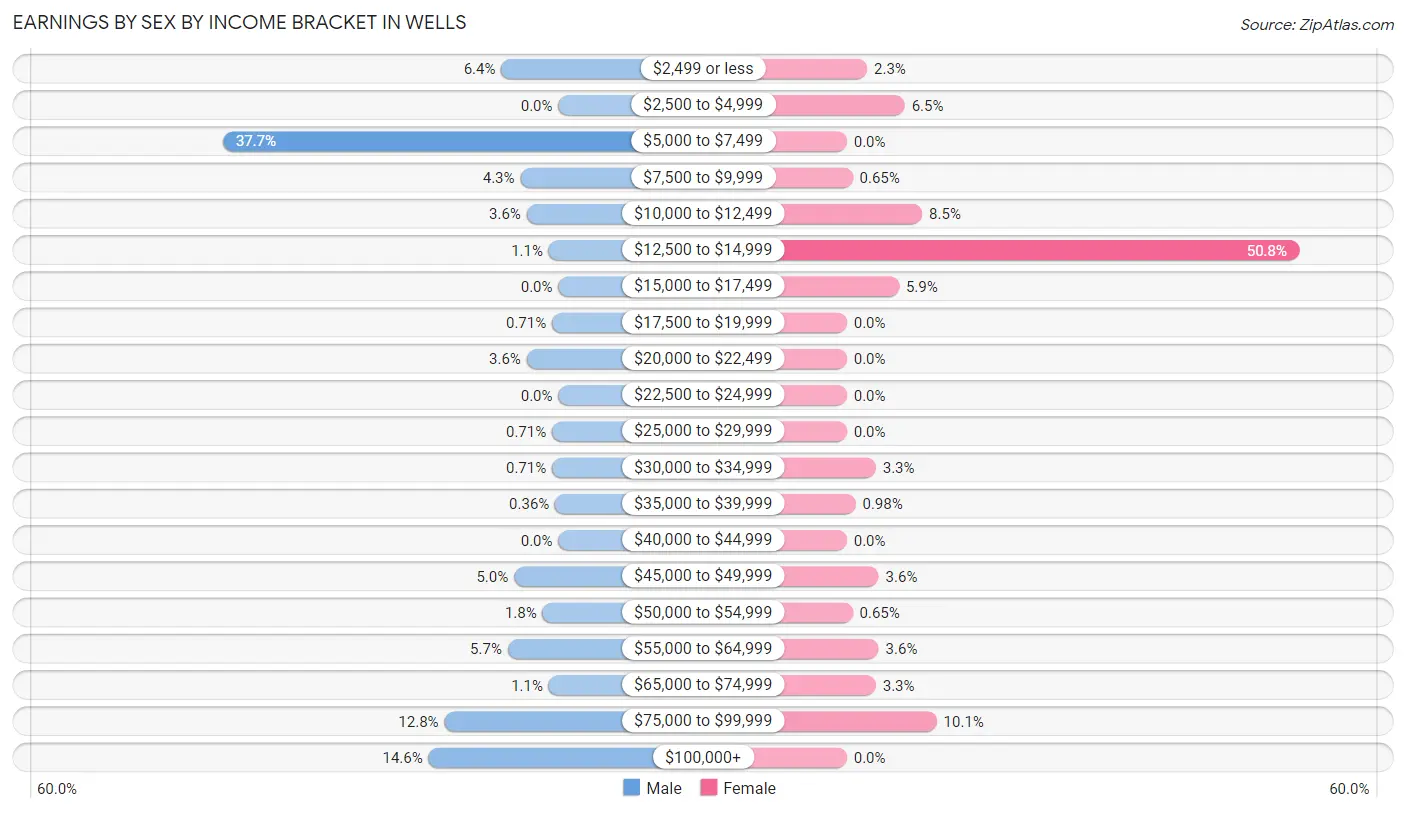
Earnings by Sex by Income Bracket in Wells
The most common earnings brackets in Wells are $5,000 to $7,499 for men (106 | 37.7%) and $12,500 to $14,999 for women (156 | 50.8%).
| Income | Male | Female |
| $2,499 or less | 18 (6.4%) | 7 (2.3%) |
| $2,500 to $4,999 | 0 (0.0%) | 20 (6.5%) |
| $5,000 to $7,499 | 106 (37.7%) | 0 (0.0%) |
| $7,500 to $9,999 | 12 (4.3%) | 2 (0.6%) |
| $10,000 to $12,499 | 10 (3.6%) | 26 (8.5%) |
| $12,500 to $14,999 | 3 (1.1%) | 156 (50.8%) |
| $15,000 to $17,499 | 0 (0.0%) | 18 (5.9%) |
| $17,500 to $19,999 | 2 (0.7%) | 0 (0.0%) |
| $20,000 to $22,499 | 10 (3.6%) | 0 (0.0%) |
| $22,500 to $24,999 | 0 (0.0%) | 0 (0.0%) |
| $25,000 to $29,999 | 2 (0.7%) | 0 (0.0%) |
| $30,000 to $34,999 | 2 (0.7%) | 10 (3.3%) |
| $35,000 to $39,999 | 1 (0.4%) | 3 (1.0%) |
| $40,000 to $44,999 | 0 (0.0%) | 0 (0.0%) |
| $45,000 to $49,999 | 14 (5.0%) | 11 (3.6%) |
| $50,000 to $54,999 | 5 (1.8%) | 2 (0.6%) |
| $55,000 to $64,999 | 16 (5.7%) | 11 (3.6%) |
| $65,000 to $74,999 | 3 (1.1%) | 10 (3.3%) |
| $75,000 to $99,999 | 36 (12.8%) | 31 (10.1%) |
| $100,000+ | 41 (14.6%) | 0 (0.0%) |
| Total | 281 (100.0%) | 307 (100.0%) |
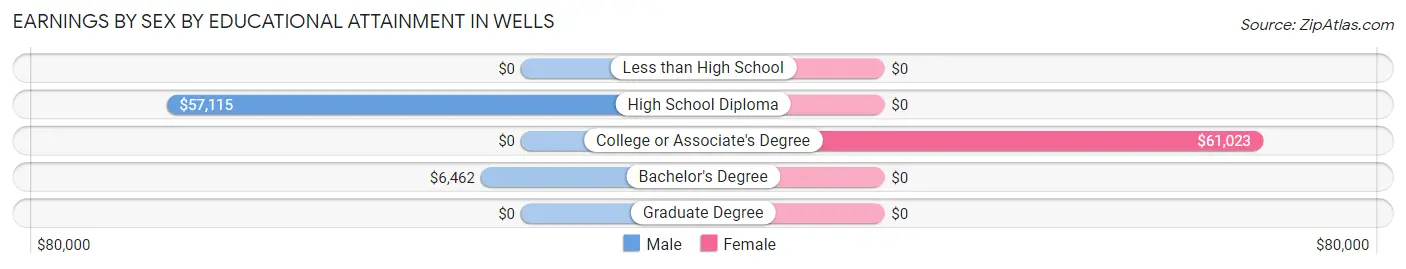
Earnings by Sex by Educational Attainment in Wells
| Educational Attainment | Male Income | Female Income |
| Less than High School | - | - |
| High School Diploma | $57,115 | $0 |
| College or Associate's Degree | - | - |
| Bachelor's Degree | $6,462 | $0 |
| Graduate Degree | - | - |
| Total | - | - |
Family Income in Wells
Family Income Brackets in Wells
According to the Wells family income data, there are 51 families falling into the $75,000 to $99,999 income range, which is the most common income bracket and makes up 28.6% of all families.
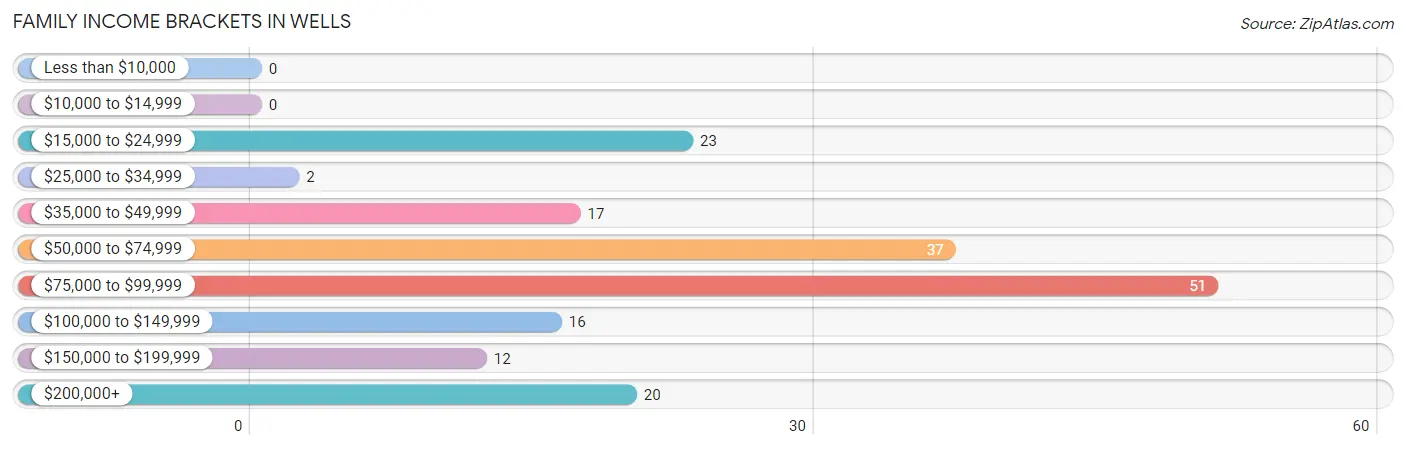
| Income Bracket | # Families | % Families |
| Less than $10,000 | 0 | 0.0% |
| $10,000 to $14,999 | 0 | 0.0% |
| $15,000 to $24,999 | 23 | 12.9% |
| $25,000 to $34,999 | 2 | 1.1% |
| $35,000 to $49,999 | 17 | 9.6% |
| $50,000 to $74,999 | 37 | 20.8% |
| $75,000 to $99,999 | 51 | 28.7% |
| $100,000 to $149,999 | 16 | 9.0% |
| $150,000 to $199,999 | 12 | 6.7% |
| $200,000+ | 20 | 11.2% |
Family Income by Famaliy Size in Wells
6-person families (20 | 11.2%) account for the highest median family income in Wells with $92,727 per family, while 2-person families (99 | 55.6%) have the highest median income of $43,822 per family member.
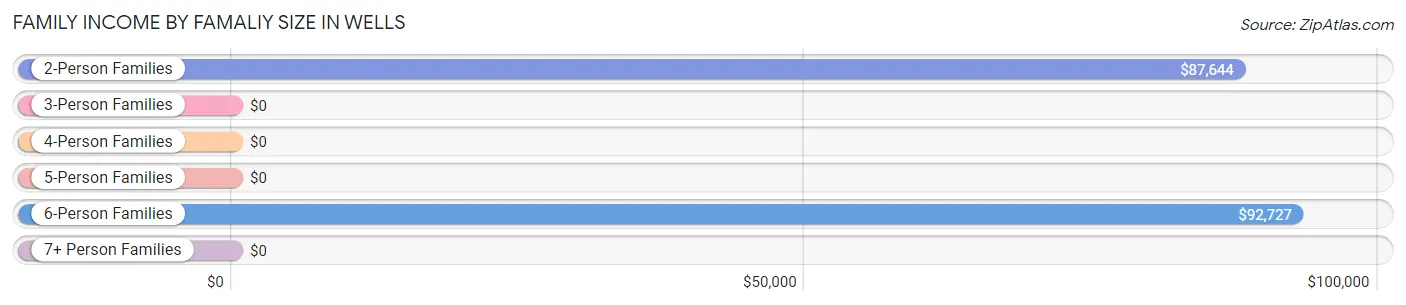
| Income Bracket | # Families | Median Income |
| 2-Person Families | 99 (55.6%) | $87,644 |
| 3-Person Families | 14 (7.9%) | $0 |
| 4-Person Families | 19 (10.7%) | $0 |
| 5-Person Families | 17 (9.6%) | $0 |
| 6-Person Families | 20 (11.2%) | $92,727 |
| 7+ Person Families | 9 (5.1%) | $0 |
| Total | 178 (100.0%) | $87,596 |
Family Income by Number of Earners in Wells
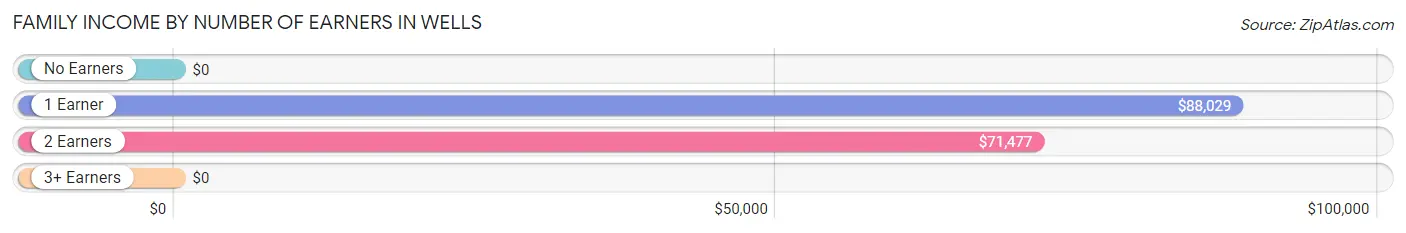
| Number of Earners | # Families | Median Income |
| No Earners | 4 (2.2%) | $0 |
| 1 Earner | 101 (56.7%) | $88,029 |
| 2 Earners | 59 (33.2%) | $71,477 |
| 3+ Earners | 14 (7.9%) | $0 |
| Total | 178 (100.0%) | $87,596 |
Household Income in Wells
Household Income Brackets in Wells
With 60 households falling in the category, the less than $10,000 income range is the most frequent in Wells, accounting for 19.8% of all households. In contrast, only 3 households (1.0%) fall into the $10,000 to $14,999 income bracket, making it the least populous group.
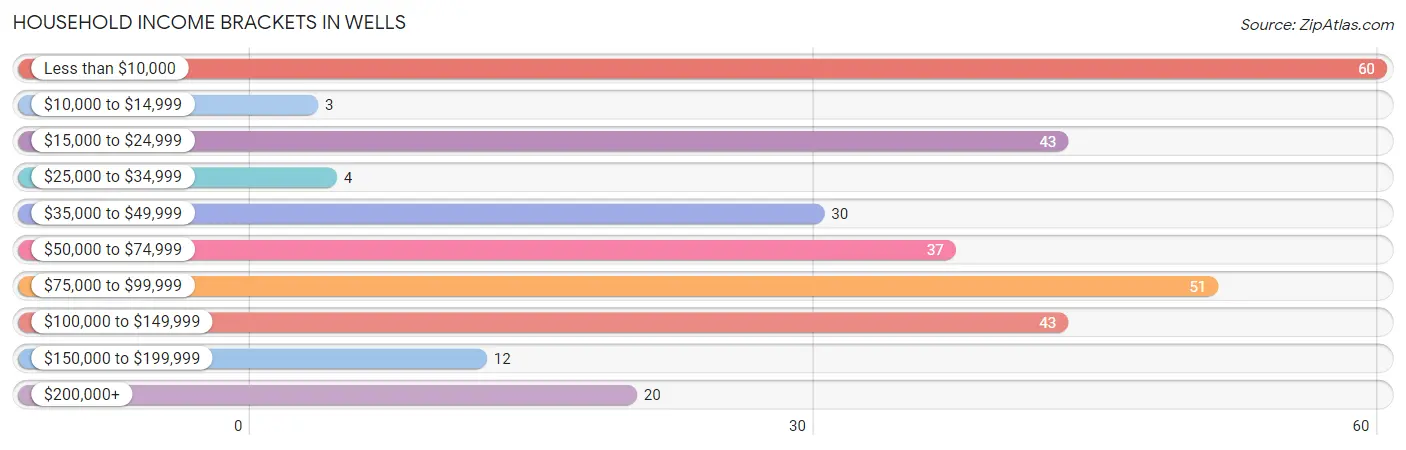
| Income Bracket | # Households | % Households |
| Less than $10,000 | 60 | 19.8% |
| $10,000 to $14,999 | 3 | 1.0% |
| $15,000 to $24,999 | 43 | 14.2% |
| $25,000 to $34,999 | 4 | 1.3% |
| $35,000 to $49,999 | 30 | 9.9% |
| $50,000 to $74,999 | 37 | 12.2% |
| $75,000 to $99,999 | 51 | 16.8% |
| $100,000 to $149,999 | 43 | 14.2% |
| $150,000 to $199,999 | 12 | 4.0% |
| $200,000+ | 20 | 6.6% |
Household Income by Householder Age in Wells
The median household income in Wells is $55,917, with the highest median household income of $93,636 found in the 25 to 44 years age bracket for the primary householder. A total of 98 households (32.3%) fall into this category. Meanwhile, the 15 to 24 years age bracket for the primary householder has the lowest median household income of $0, with 1 households (0.3%) in this group.
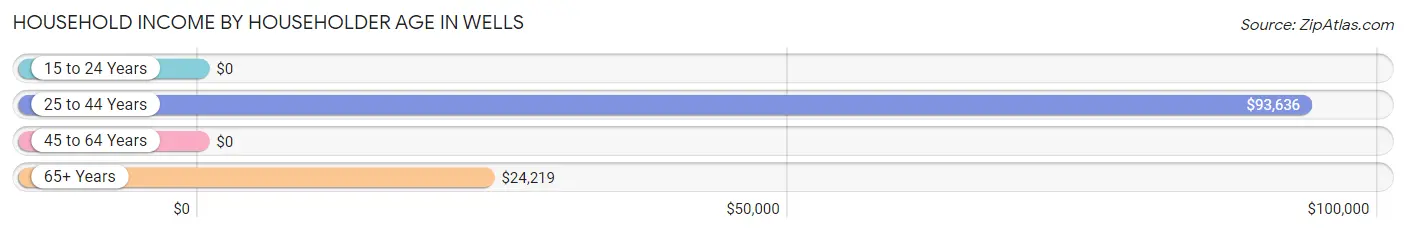
| Income Bracket | # Households | Median Income |
| 15 to 24 Years | 1 (0.3%) | $0 |
| 25 to 44 Years | 98 (32.3%) | $93,636 |
| 45 to 64 Years | 163 (53.8%) | $0 |
| 65+ Years | 41 (13.5%) | $24,219 |
| Total | 303 (100.0%) | $55,917 |
Poverty in Wells
Income Below Poverty by Sex and Age in Wells
With 38.5% poverty level for males and 47.5% for females among the residents of Wells, 45 to 54 year old males and 35 to 44 year old females are the most vulnerable to poverty, with 127 males (78.4%) and 171 females (81.8%) in their respective age groups living below the poverty level.
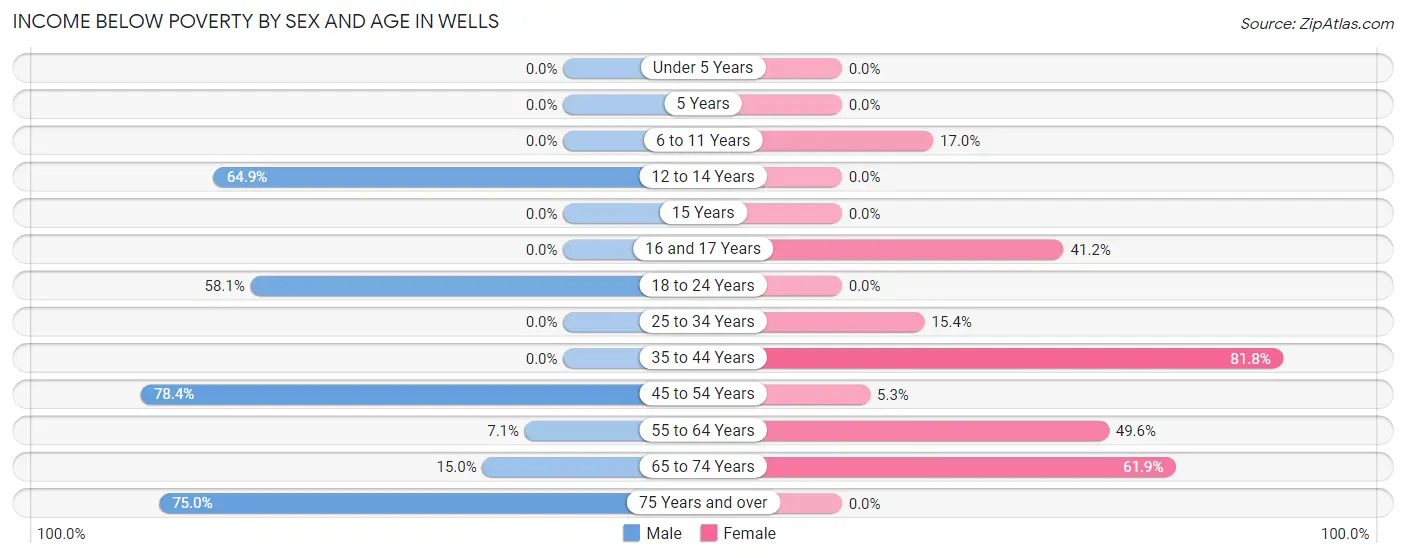
| Age Bracket | Male | Female |
| Under 5 Years | 0 (0.0%) | 0 (0.0%) |
| 5 Years | 0 (0.0%) | 0 (0.0%) |
| 6 to 11 Years | 0 (0.0%) | 10 (17.0%) |
| 12 to 14 Years | 24 (64.9%) | 0 (0.0%) |
| 15 Years | 0 (0.0%) | 0 (0.0%) |
| 16 and 17 Years | 0 (0.0%) | 14 (41.2%) |
| 18 to 24 Years | 18 (58.1%) | 0 (0.0%) |
| 25 to 34 Years | 0 (0.0%) | 4 (15.4%) |
| 35 to 44 Years | 0 (0.0%) | 171 (81.8%) |
| 45 to 54 Years | 127 (78.4%) | 2 (5.3%) |
| 55 to 64 Years | 7 (7.1%) | 56 (49.6%) |
| 65 to 74 Years | 3 (15.0%) | 13 (61.9%) |
| 75 Years and over | 9 (75.0%) | 0 (0.0%) |
| Total | 188 (38.5%) | 270 (47.5%) |
Income Above Poverty by Sex and Age in Wells
According to the poverty statistics in Wells, males aged under 5 years and females aged under 5 years are the age groups that are most secure financially, with 100.0% of males and 100.0% of females in these age groups living above the poverty line.
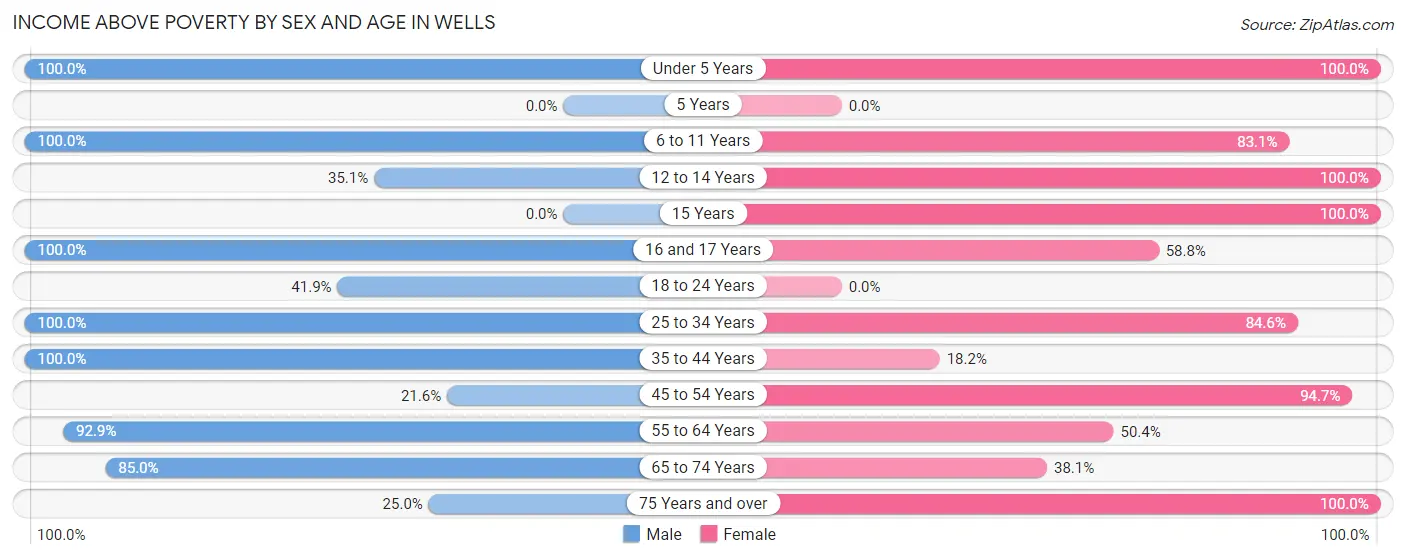
| Age Bracket | Male | Female |
| Under 5 Years | 10 (100.0%) | 10 (100.0%) |
| 5 Years | 0 (0.0%) | 0 (0.0%) |
| 6 to 11 Years | 30 (100.0%) | 49 (83.1%) |
| 12 to 14 Years | 13 (35.1%) | 42 (100.0%) |
| 15 Years | 0 (0.0%) | 12 (100.0%) |
| 16 and 17 Years | 35 (100.0%) | 20 (58.8%) |
| 18 to 24 Years | 13 (41.9%) | 0 (0.0%) |
| 25 to 34 Years | 33 (100.0%) | 22 (84.6%) |
| 35 to 44 Years | 21 (100.0%) | 38 (18.2%) |
| 45 to 54 Years | 35 (21.6%) | 36 (94.7%) |
| 55 to 64 Years | 91 (92.9%) | 57 (50.4%) |
| 65 to 74 Years | 17 (85.0%) | 8 (38.1%) |
| 75 Years and over | 3 (25.0%) | 4 (100.0%) |
| Total | 301 (61.6%) | 298 (52.5%) |
Income Below Poverty Among Married-Couple Families in Wells
The poverty statistics for married-couple families in Wells show that 5.2% or 7 of the total 135 families live below the poverty line. Families with 1 or 2 children have the highest poverty rate of 33.3%, comprising of 7 families. On the other hand, families with no children have the lowest poverty rate of 0.0%, which includes 0 families.
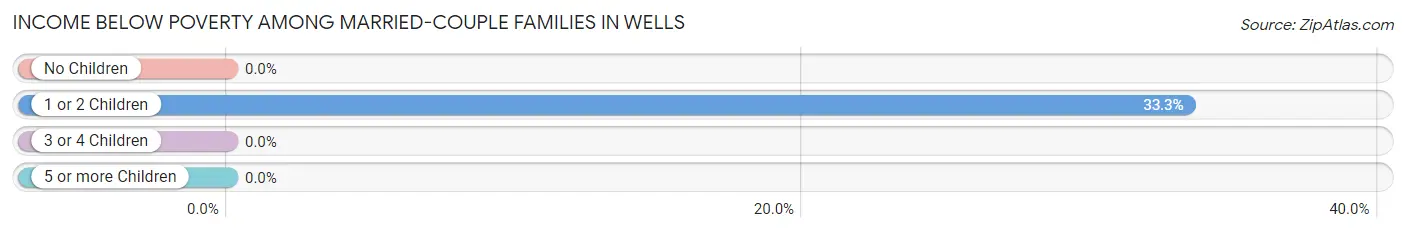
| Children | Above Poverty | Below Poverty |
| No Children | 75 (100.0%) | 0 (0.0%) |
| 1 or 2 Children | 14 (66.7%) | 7 (33.3%) |
| 3 or 4 Children | 30 (100.0%) | 0 (0.0%) |
| 5 or more Children | 9 (100.0%) | 0 (0.0%) |
| Total | 128 (94.8%) | 7 (5.2%) |
Income Below Poverty Among Single-Parent Households in Wells
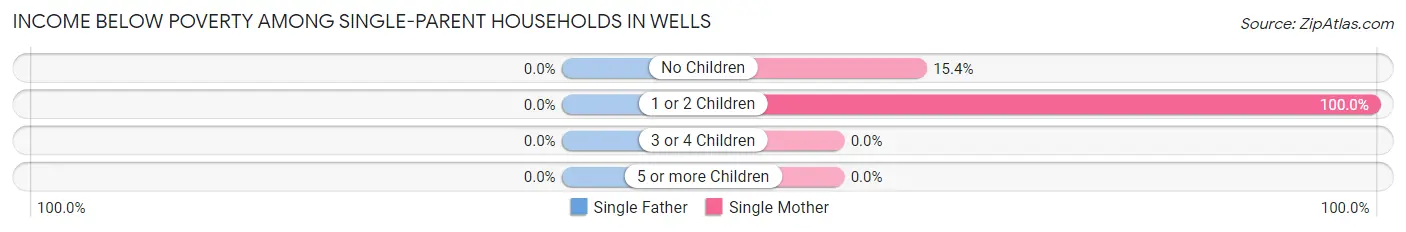
| Children | Single Father | Single Mother |
| No Children | 0 (0.0%) | 2 (15.4%) |
| 1 or 2 Children | 0 (0.0%) | 17 (100.0%) |
| 3 or 4 Children | 0 (0.0%) | 0 (0.0%) |
| 5 or more Children | 0 (0.0%) | 0 (0.0%) |
| Total | 0 (0.0%) | 19 (63.3%) |
Income Below Poverty Among Married-Couple vs Single-Parent Households in Wells
The poverty data for Wells shows that 7 of the married-couple family households (5.2%) and 19 of the single-parent households (44.2%) are living below the poverty level. Within the married-couple family households, those with 1 or 2 children have the highest poverty rate, with 7 households (33.3%) falling below the poverty line. Among the single-parent households, those with 1 or 2 children have the highest poverty rate, with 17 household (56.7%) living below poverty.
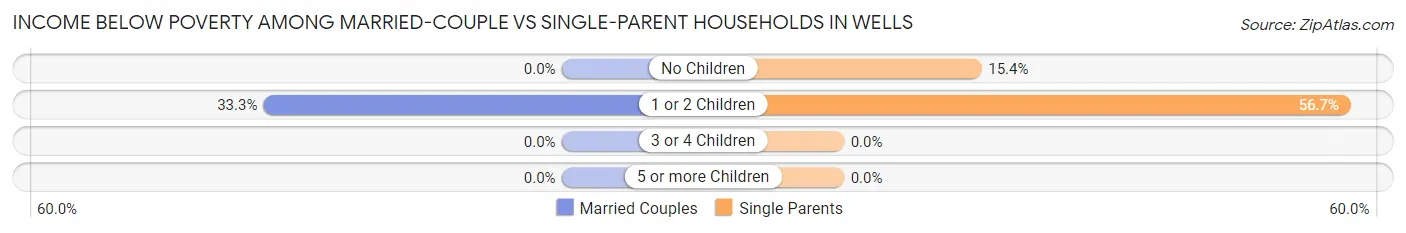
| Children | Married-Couple Families | Single-Parent Households |
| No Children | 0 (0.0%) | 2 (15.4%) |
| 1 or 2 Children | 7 (33.3%) | 17 (56.7%) |
| 3 or 4 Children | 0 (0.0%) | 0 (0.0%) |
| 5 or more Children | 0 (0.0%) | 0 (0.0%) |
| Total | 7 (5.2%) | 19 (44.2%) |
Race in Wells
The most populous races in Wells are White / Caucasian (595 | 56.3%), Hispanic or Latino (219 | 20.7%), and Two or more Races (169 | 16.0%).
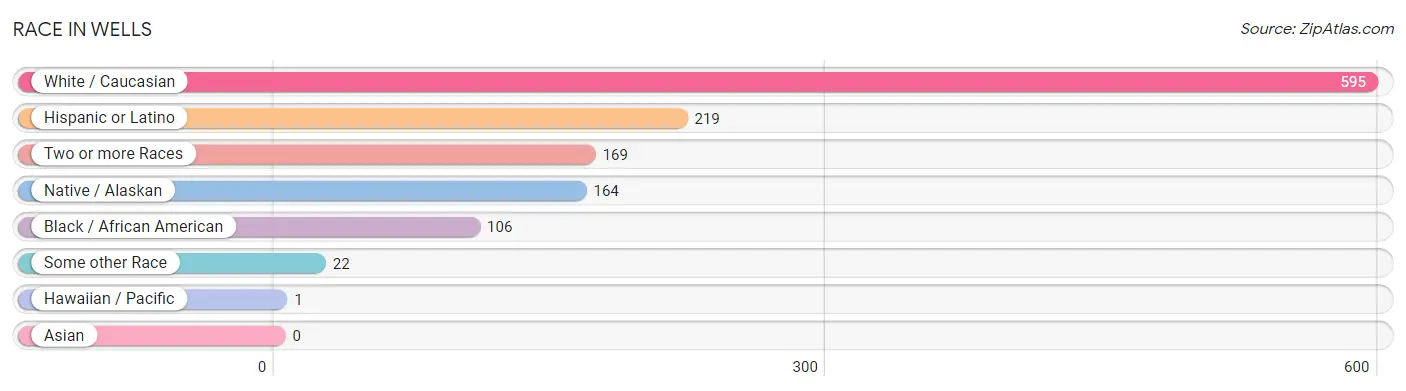
| Race | # Population | % Population |
| Asian | 0 | 0.0% |
| Black / African American | 106 | 10.0% |
| Hawaiian / Pacific | 1 | 0.1% |
| Hispanic or Latino | 219 | 20.7% |
| Native / Alaskan | 164 | 15.5% |
| White / Caucasian | 595 | 56.3% |
| Two or more Races | 169 | 16.0% |
| Some other Race | 22 | 2.1% |
| Total | 1,057 | 100.0% |
Ancestry in Wells
The most populous ancestries reported in Wells are Mexican (219 | 20.7%), English (77 | 7.3%), European (66 | 6.2%), Scottish (56 | 5.3%), and American (36 | 3.4%), together accounting for 43.0% of all Wells residents.
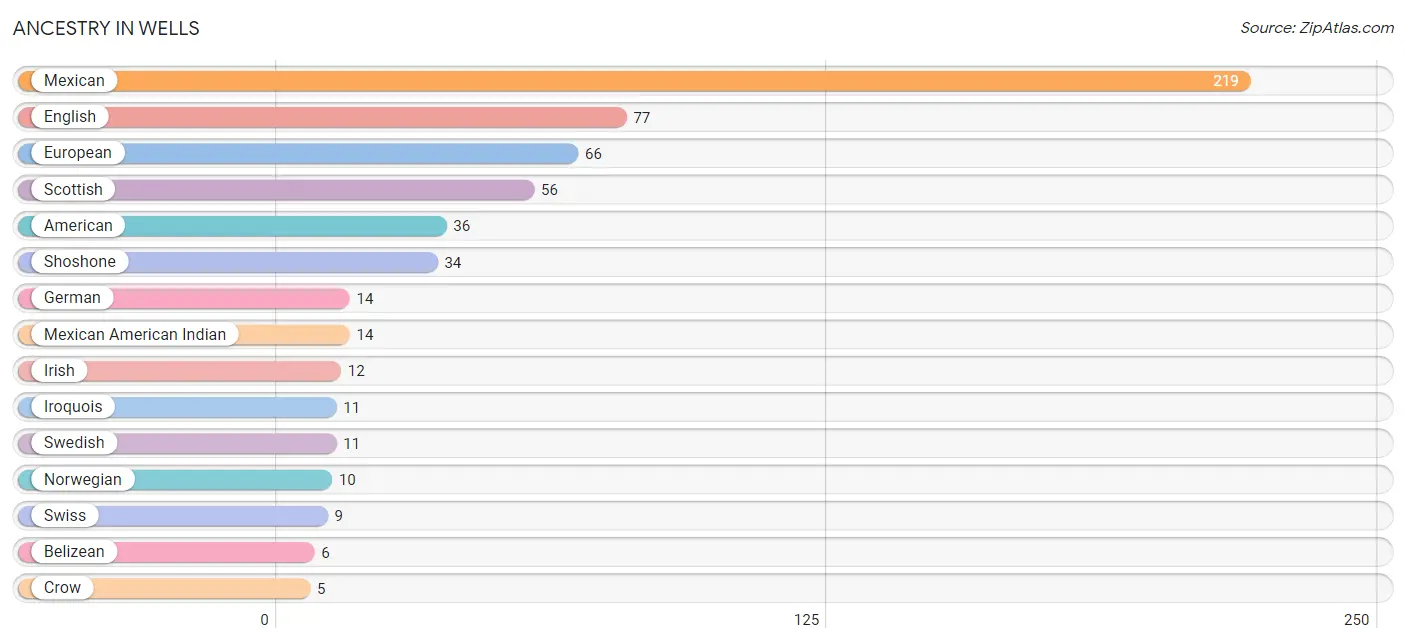
| Ancestry | # Population | % Population |
| American | 36 | 3.4% |
| Basque | 3 | 0.3% |
| Belizean | 6 | 0.6% |
| Crow | 5 | 0.5% |
| English | 77 | 7.3% |
| European | 66 | 6.2% |
| German | 14 | 1.3% |
| Irish | 12 | 1.1% |
| Iroquois | 11 | 1.0% |
| Mexican | 219 | 20.7% |
| Mexican American Indian | 14 | 1.3% |
| Native Hawaiian | 1 | 0.1% |
| Norwegian | 10 | 0.9% |
| Scottish | 56 | 5.3% |
| Shoshone | 34 | 3.2% |
| Swedish | 11 | 1.0% |
| Swiss | 9 | 0.9% |
| Ute | 1 | 0.1% | View All 18 Rows |
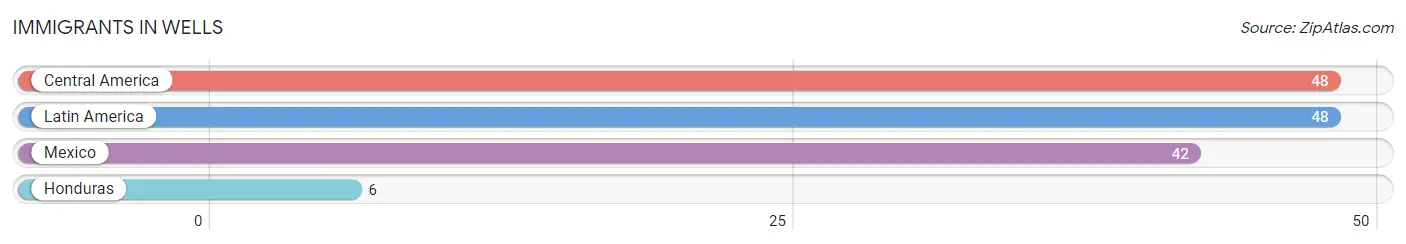
Immigrants in Wells
The most numerous immigrant groups reported in Wells came from Central America (48 | 4.5%), Latin America (48 | 4.5%), Mexico (42 | 4.0%), and Honduras (6 | 0.6%), together accounting for 13.6% of all Wells residents.
| Immigration Origin | # Population | % Population |
| Central America | 48 | 4.5% |
| Honduras | 6 | 0.6% |
| Latin America | 48 | 4.5% |
| Mexico | 42 | 4.0% | View All 4 Rows |
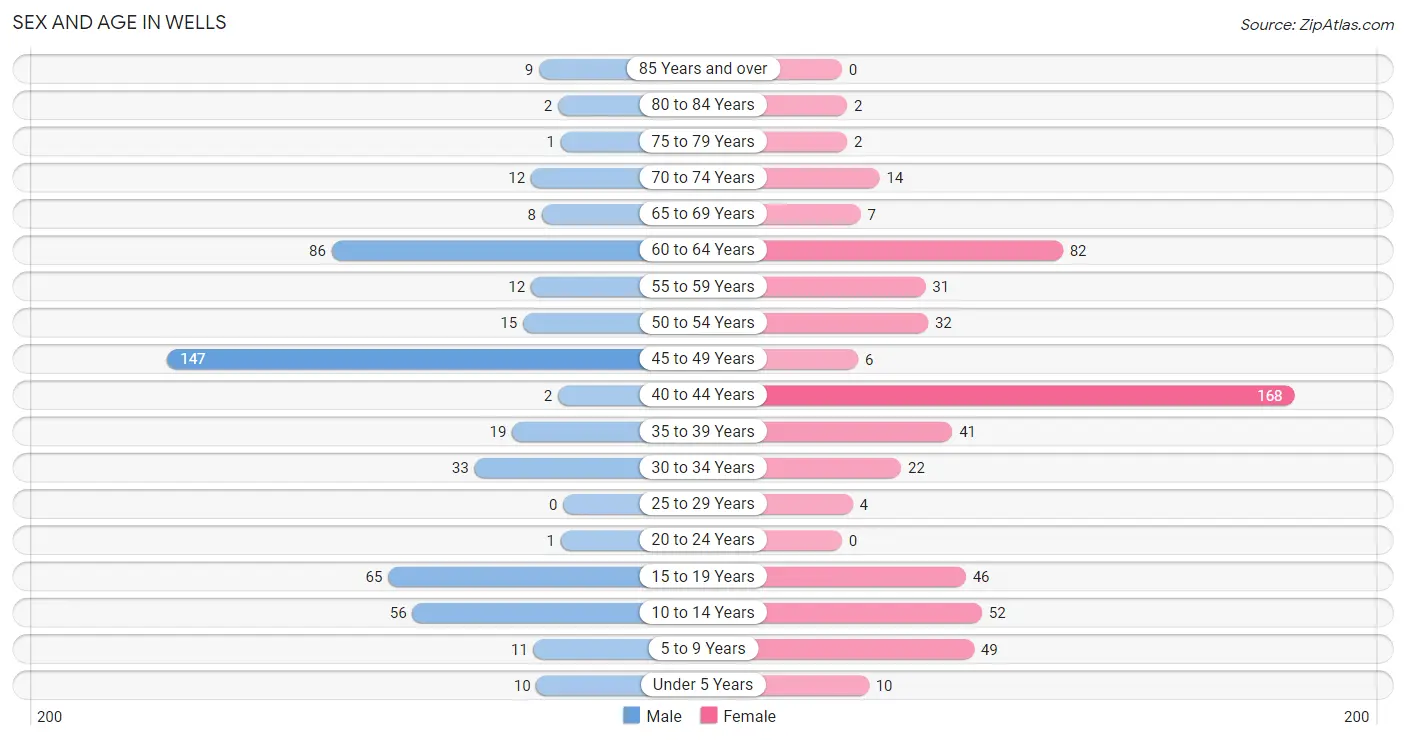
Sex and Age in Wells
Sex and Age in Wells
The most populous age groups in Wells are 45 to 49 Years (147 | 30.1%) for men and 40 to 44 Years (168 | 29.6%) for women.
| Age Bracket | Male | Female |
| Under 5 Years | 10 (2.0%) | 10 (1.8%) |
| 5 to 9 Years | 11 (2.2%) | 49 (8.6%) |
| 10 to 14 Years | 56 (11.5%) | 52 (9.1%) |
| 15 to 19 Years | 65 (13.3%) | 46 (8.1%) |
| 20 to 24 Years | 1 (0.2%) | 0 (0.0%) |
| 25 to 29 Years | 0 (0.0%) | 4 (0.7%) |
| 30 to 34 Years | 33 (6.8%) | 22 (3.9%) |
| 35 to 39 Years | 19 (3.9%) | 41 (7.2%) |
| 40 to 44 Years | 2 (0.4%) | 168 (29.6%) |
| 45 to 49 Years | 147 (30.1%) | 6 (1.1%) |
| 50 to 54 Years | 15 (3.1%) | 32 (5.6%) |
| 55 to 59 Years | 12 (2.5%) | 31 (5.5%) |
| 60 to 64 Years | 86 (17.6%) | 82 (14.4%) |
| 65 to 69 Years | 8 (1.6%) | 7 (1.2%) |
| 70 to 74 Years | 12 (2.5%) | 14 (2.5%) |
| 75 to 79 Years | 1 (0.2%) | 2 (0.4%) |
| 80 to 84 Years | 2 (0.4%) | 2 (0.4%) |
| 85 Years and over | 9 (1.8%) | 0 (0.0%) |
| Total | 489 (100.0%) | 568 (100.0%) |
Families and Households in Wells
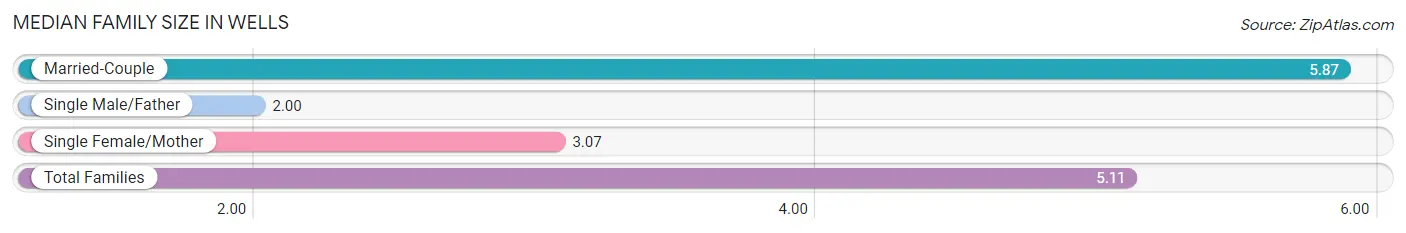
Median Family Size in Wells
The median family size in Wells is 5.11 persons per family, with married-couple families (135 | 75.8%) accounting for the largest median family size of 5.87 persons per family. On the other hand, single male/father families (13 | 7.3%) represent the smallest median family size with 2.00 persons per family.
| Family Type | # Families | Family Size |
| Married-Couple | 135 (75.8%) | 5.87 |
| Single Male/Father | 13 (7.3%) | 2.00 |
| Single Female/Mother | 30 (16.9%) | 3.07 |
| Total Families | 178 (100.0%) | 5.11 |
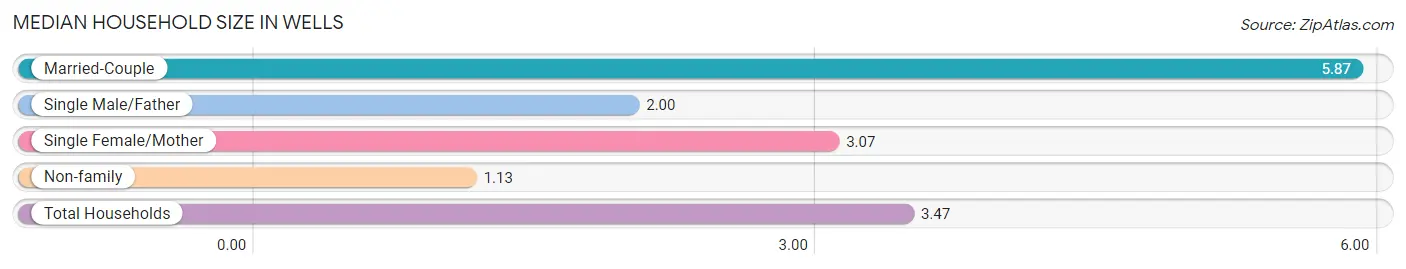
Median Household Size in Wells
The median household size in Wells is 3.47 persons per household, with married-couple households (135 | 44.6%) accounting for the largest median household size of 5.87 persons per household. non-family households (125 | 41.2%) represent the smallest median household size with 1.13 persons per household.
| Household Type | # Households | Household Size |
| Married-Couple | 135 (44.6%) | 5.87 |
| Single Male/Father | 13 (4.3%) | 2.00 |
| Single Female/Mother | 30 (9.9%) | 3.07 |
| Non-family | 125 (41.2%) | 1.13 |
| Total Households | 303 (100.0%) | 3.47 |
Household Size by Marriage Status in Wells
Out of a total of 303 households in Wells, 178 (58.8%) are family households, while 125 (41.2%) are nonfamily households. The most numerous type of family households are 2-person households, comprising 99, and the most common type of nonfamily households are 1-person households, comprising 113.
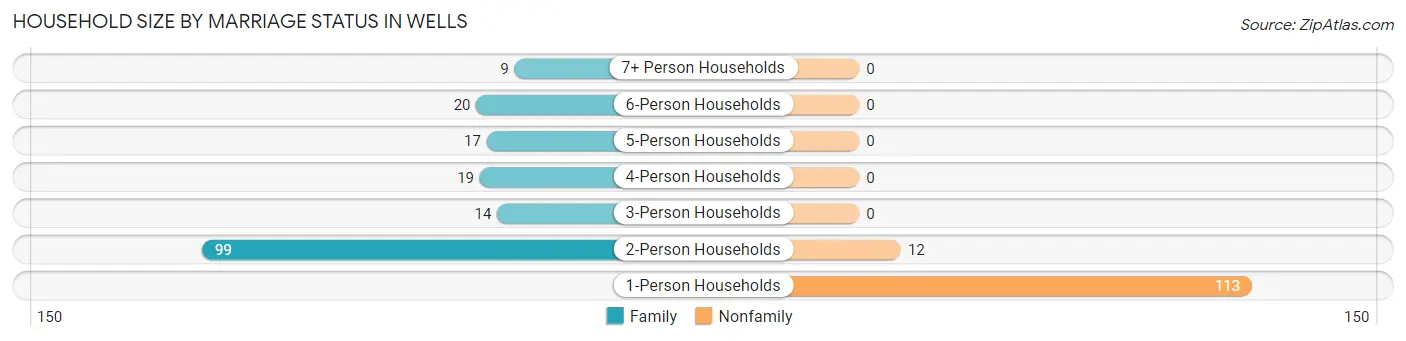
| Household Size | Family Households | Nonfamily Households |
| 1-Person Households | - | 113 (37.3%) |
| 2-Person Households | 99 (32.7%) | 12 (4.0%) |
| 3-Person Households | 14 (4.6%) | 0 (0.0%) |
| 4-Person Households | 19 (6.3%) | 0 (0.0%) |
| 5-Person Households | 17 (5.6%) | 0 (0.0%) |
| 6-Person Households | 20 (6.6%) | 0 (0.0%) |
| 7+ Person Households | 9 (3.0%) | 0 (0.0%) |
| Total | 178 (58.8%) | 125 (41.2%) |
Female Fertility in Wells
Fertility by Age in Wells
| Age Bracket | Women with Births | Births / 1,000 Women |
| 15 to 19 years | 0 (0.0%) | 0.0 |
| 20 to 34 years | 0 (0.0%) | 0.0 |
| 35 to 50 years | 0 (0.0%) | 0.0 |
| Total | 0 (0.0%) | 0.0 |
Fertility by Age by Marriage Status in Wells
| Age Bracket | Married | Unmarried |
| 15 to 19 years | 0 (0.0%) | 0 (0.0%) |
| 20 to 34 years | 0 (0.0%) | 0 (0.0%) |
| 35 to 50 years | 0 (0.0%) | 0 (0.0%) |
| Total | 0 (0.0%) | 0 (0.0%) |
Fertility by Education in Wells
| Educational Attainment | Women with Births | Births / 1,000 Women |
| Less than High School | 0 (0.0%) | 0.0 |
| High School Diploma | 0 (0.0%) | 0.0 |
| College or Associate's Degree | 0 (0.0%) | 0.0 |
| Bachelor's Degree | 0 (0.0%) | 0.0 |
| Graduate Degree | 0 (0.0%) | 0.0 |
| Total | 0 (0.0%) | 0.0 |
Fertility by Education by Marriage Status in Wells
| Educational Attainment | Married | Unmarried |
| Less than High School | 0 (0.0%) | 0 (0.0%) |
| High School Diploma | 0 (0.0%) | 0 (0.0%) |
| College or Associate's Degree | 0 (0.0%) | 0 (0.0%) |
| Bachelor's Degree | 0 (0.0%) | 0 (0.0%) |
| Graduate Degree | 0 (0.0%) | 0 (0.0%) |
| Total | 0 (0.0%) | 0 (0.0%) |
Employment Characteristics in Wells
Employment by Class of Employer in Wells
Among the 560 employed individuals in Wells, private company employees (385 | 68.8%), not-for-profit organizations (61 | 10.9%), and federal government employees (57 | 10.2%) make up the most common classes of employment.
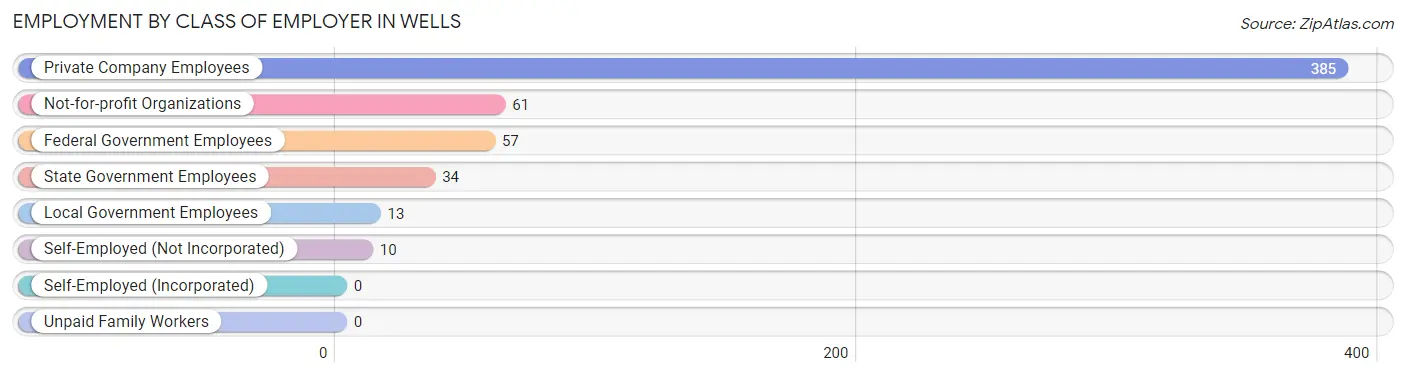
| Employer Class | # Employees | % Employees |
| Private Company Employees | 385 | 68.8% |
| Self-Employed (Incorporated) | 0 | 0.0% |
| Self-Employed (Not Incorporated) | 10 | 1.8% |
| Not-for-profit Organizations | 61 | 10.9% |
| Local Government Employees | 13 | 2.3% |
| State Government Employees | 34 | 6.1% |
| Federal Government Employees | 57 | 10.2% |
| Unpaid Family Workers | 0 | 0.0% |
| Total | 560 | 100.0% |
Employment Status by Age in Wells
According to the labor force statistics for Wells, out of the total population over 16 years of age (857), 65.6% or 562 individuals are in the labor force, with 0.4% or 2 of them unemployed. The age group with the highest labor force participation rate is 20 to 24 years, with 100.0% or 1 individuals in the labor force. Within the labor force, the 75 years and over age range has the highest percentage of unemployed individuals, with 100.0% or 2 of them being unemployed.
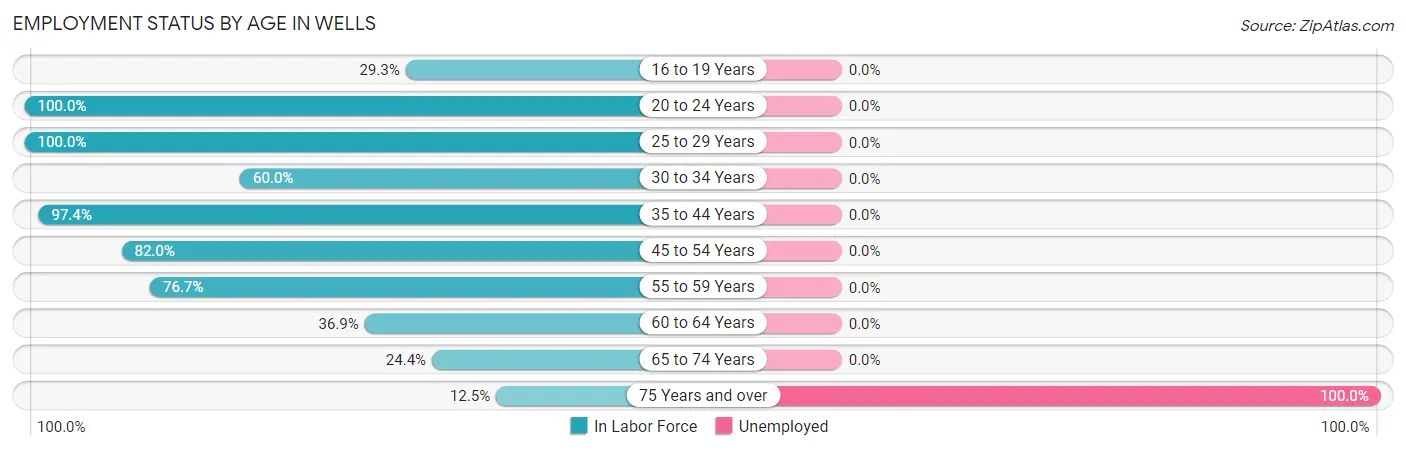
| Age Bracket | In Labor Force | Unemployed |
| 16 to 19 Years | 29 (29.3%) | 0 (0.0%) |
| 20 to 24 Years | 1 (100.0%) | 0 (0.0%) |
| 25 to 29 Years | 4 (100.0%) | 0 (0.0%) |
| 30 to 34 Years | 33 (60.0%) | 0 (0.0%) |
| 35 to 44 Years | 224 (97.4%) | 0 (0.0%) |
| 45 to 54 Years | 164 (82.0%) | 0 (0.0%) |
| 55 to 59 Years | 33 (76.7%) | 0 (0.0%) |
| 60 to 64 Years | 62 (36.9%) | 0 (0.0%) |
| 65 to 74 Years | 10 (24.4%) | 0 (0.0%) |
| 75 Years and over | 2 (12.5%) | 2 (100.0%) |
| Total | 562 (65.6%) | 2 (0.4%) |
Employment Status by Educational Attainment in Wells
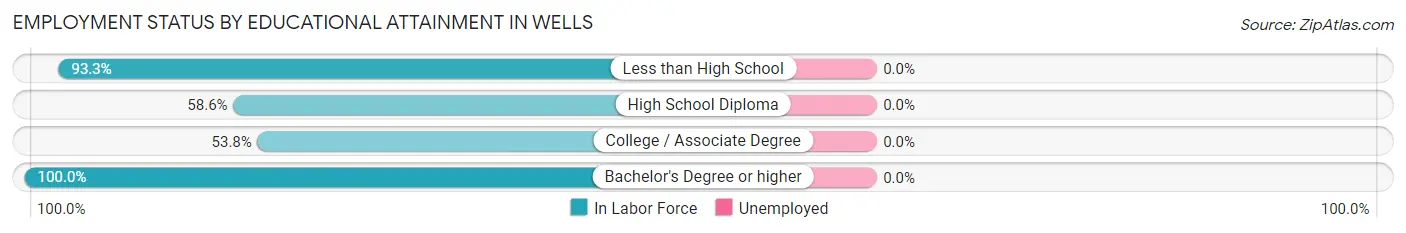
| Educational Attainment | In Labor Force | Unemployed |
| Less than High School | 167 (93.3%) | 0 (0.0%) |
| High School Diploma | 126 (58.6%) | 0 (0.0%) |
| College / Associate Degree | 92 (53.8%) | 0 (0.0%) |
| Bachelor's Degree or higher | 135 (100.0%) | 0 (0.0%) |
| Total | 520 (74.3%) | 0 (0.0%) |
Employment Occupations by Sex in Wells
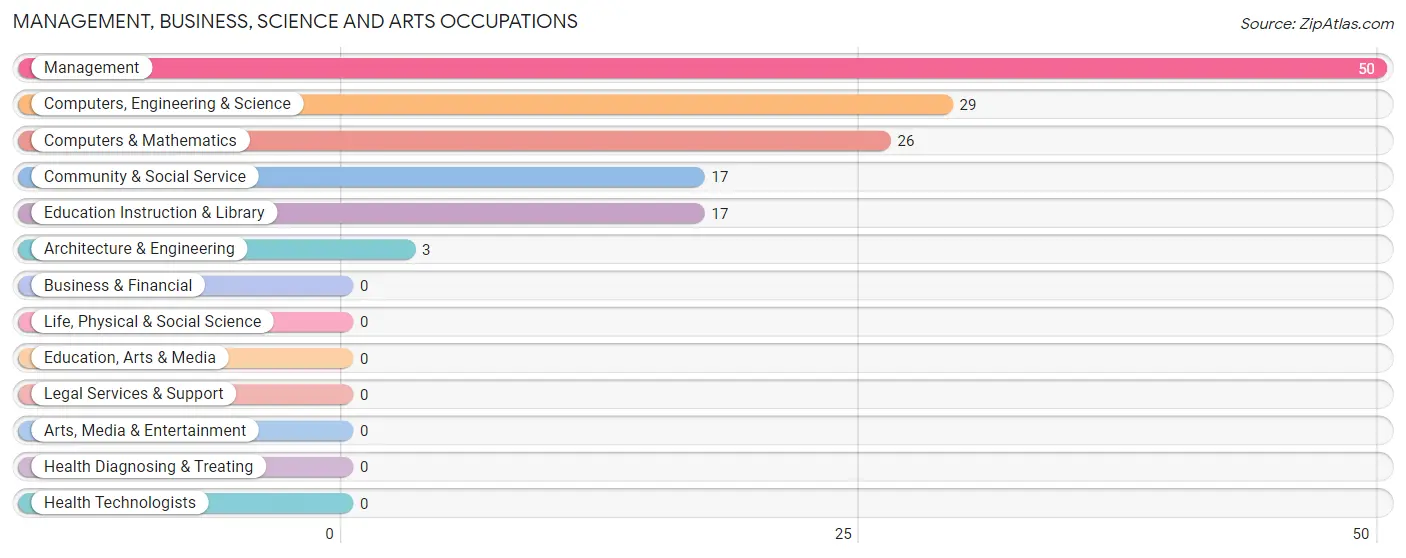
Management, Business, Science and Arts Occupations
The most common Management, Business, Science and Arts occupations in Wells are Management (50 | 9.1%), Computers, Engineering & Science (29 | 5.3%), Computers & Mathematics (26 | 4.7%), Community & Social Service (17 | 3.1%), and Education Instruction & Library (17 | 3.1%).
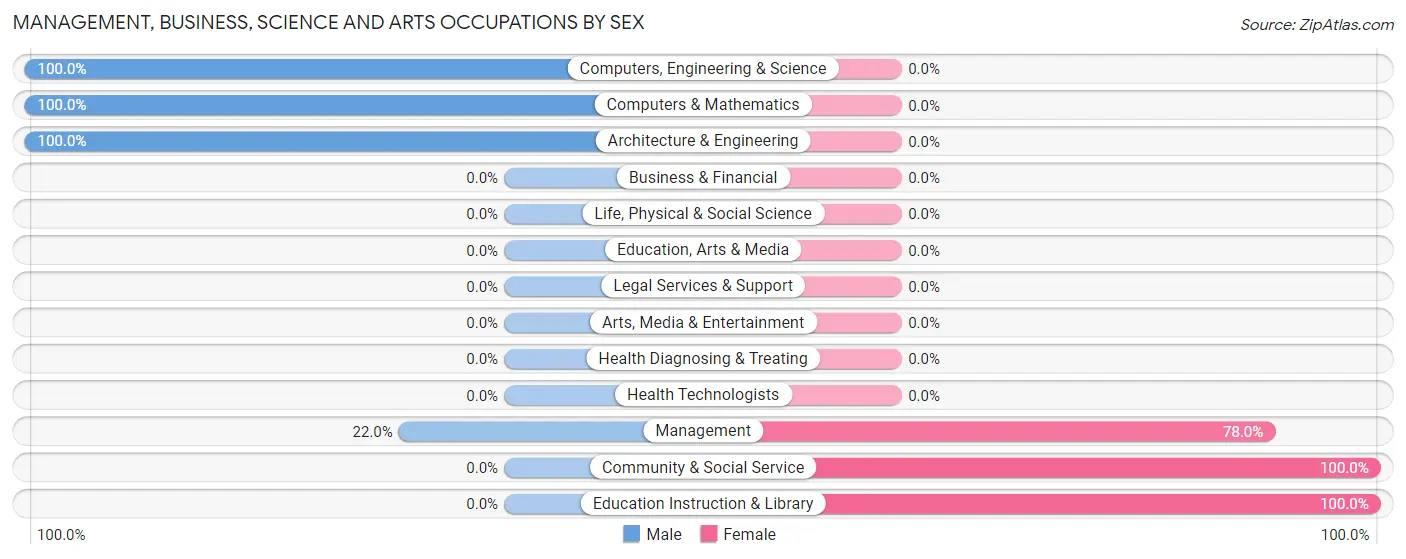
Management, Business, Science and Arts Occupations by Sex
Within the Management, Business, Science and Arts occupations in Wells, the most male-oriented occupations are Computers, Engineering & Science (100.0%), Computers & Mathematics (100.0%), and Architecture & Engineering (100.0%), while the most female-oriented occupations are Community & Social Service (100.0%), Education Instruction & Library (100.0%), and Management (78.0%).
| Occupation | Male | Female |
| Management | 11 (22.0%) | 39 (78.0%) |
| Business & Financial | 0 (0.0%) | 0 (0.0%) |
| Computers, Engineering & Science | 29 (100.0%) | 0 (0.0%) |
| Computers & Mathematics | 26 (100.0%) | 0 (0.0%) |
| Architecture & Engineering | 3 (100.0%) | 0 (0.0%) |
| Life, Physical & Social Science | 0 (0.0%) | 0 (0.0%) |
| Community & Social Service | 0 (0.0%) | 17 (100.0%) |
| Education, Arts & Media | 0 (0.0%) | 0 (0.0%) |
| Legal Services & Support | 0 (0.0%) | 0 (0.0%) |
| Education Instruction & Library | 0 (0.0%) | 17 (100.0%) |
| Arts, Media & Entertainment | 0 (0.0%) | 0 (0.0%) |
| Health Diagnosing & Treating | 0 (0.0%) | 0 (0.0%) |
| Health Technologists | 0 (0.0%) | 0 (0.0%) |
| Total (Category) | 40 (41.7%) | 56 (58.3%) |
| Total (Overall) | 263 (47.9%) | 286 (52.1%) |
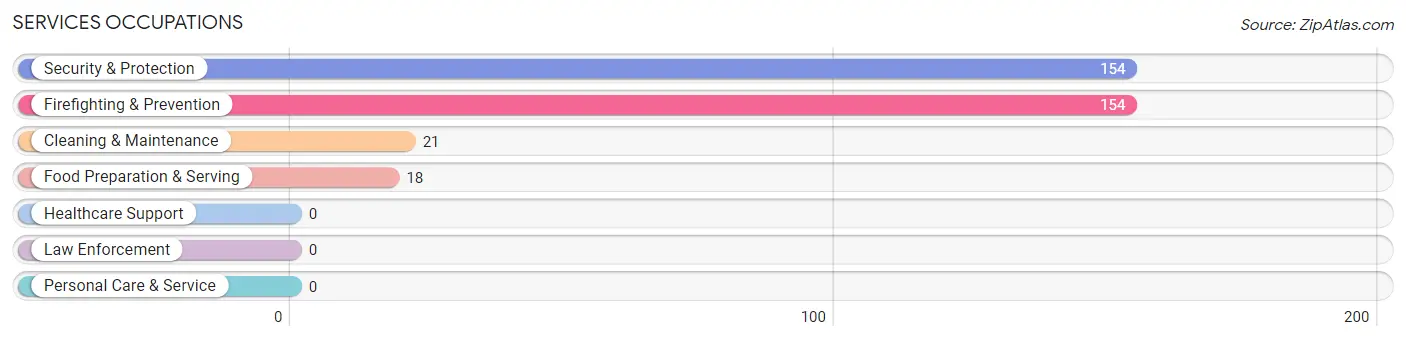
Services Occupations
The most common Services occupations in Wells are Security & Protection (154 | 28.1%), Firefighting & Prevention (154 | 28.1%), Cleaning & Maintenance (21 | 3.8%), and Food Preparation & Serving (18 | 3.3%).
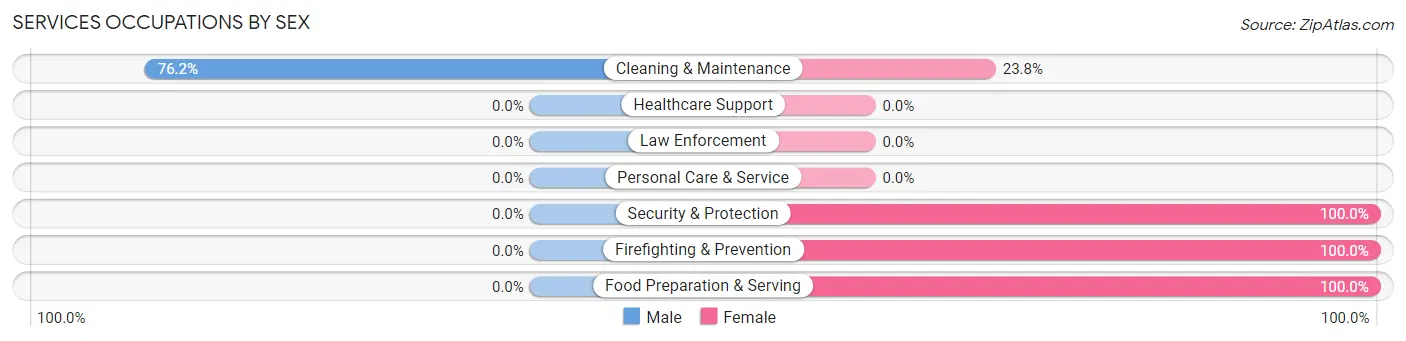
Services Occupations by Sex
| Occupation | Male | Female |
| Healthcare Support | 0 (0.0%) | 0 (0.0%) |
| Security & Protection | 0 (0.0%) | 154 (100.0%) |
| Firefighting & Prevention | 0 (0.0%) | 154 (100.0%) |
| Law Enforcement | 0 (0.0%) | 0 (0.0%) |
| Food Preparation & Serving | 0 (0.0%) | 18 (100.0%) |
| Cleaning & Maintenance | 16 (76.2%) | 5 (23.8%) |
| Personal Care & Service | 0 (0.0%) | 0 (0.0%) |
| Total (Category) | 16 (8.3%) | 177 (91.7%) |
| Total (Overall) | 263 (47.9%) | 286 (52.1%) |
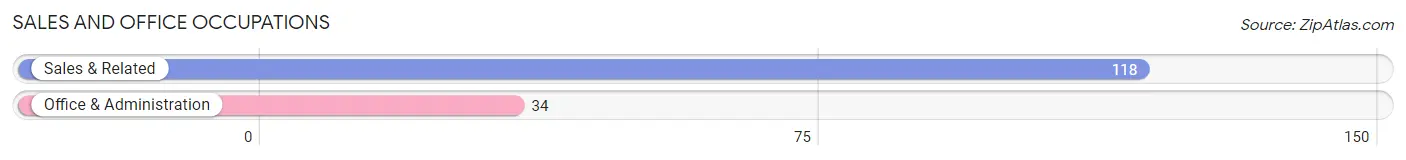
Sales and Office Occupations
The most common Sales and Office occupations in Wells are Sales & Related (118 | 21.5%), and Office & Administration (34 | 6.2%).
Sales and Office Occupations by Sex
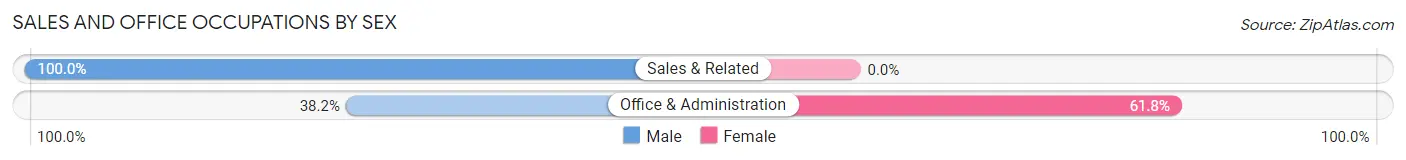
| Occupation | Male | Female |
| Sales & Related | 118 (100.0%) | 0 (0.0%) |
| Office & Administration | 13 (38.2%) | 21 (61.8%) |
| Total (Category) | 131 (86.2%) | 21 (13.8%) |
| Total (Overall) | 263 (47.9%) | 286 (52.1%) |
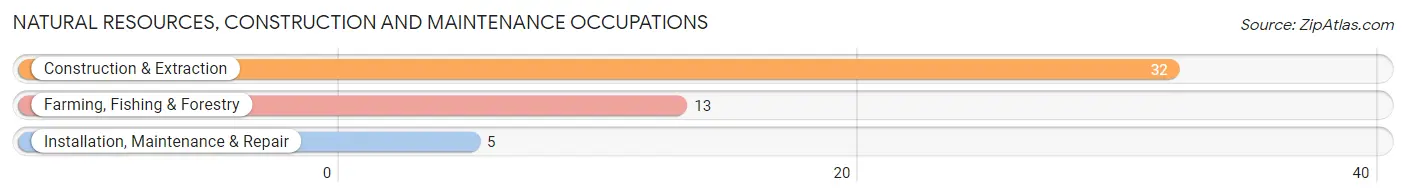
Natural Resources, Construction and Maintenance Occupations
The most common Natural Resources, Construction and Maintenance occupations in Wells are Construction & Extraction (32 | 5.8%), Farming, Fishing & Forestry (13 | 2.4%), and Installation, Maintenance & Repair (5 | 0.9%).
Natural Resources, Construction and Maintenance Occupations by Sex
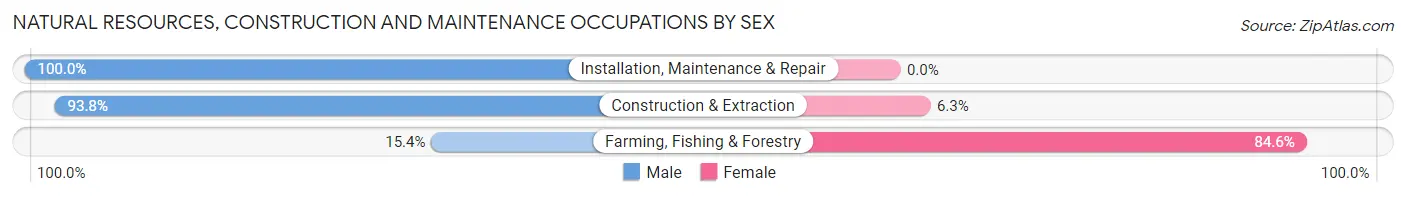
| Occupation | Male | Female |
| Farming, Fishing & Forestry | 2 (15.4%) | 11 (84.6%) |
| Construction & Extraction | 30 (93.8%) | 2 (6.2%) |
| Installation, Maintenance & Repair | 5 (100.0%) | 0 (0.0%) |
| Total (Category) | 37 (74.0%) | 13 (26.0%) |
| Total (Overall) | 263 (47.9%) | 286 (52.1%) |
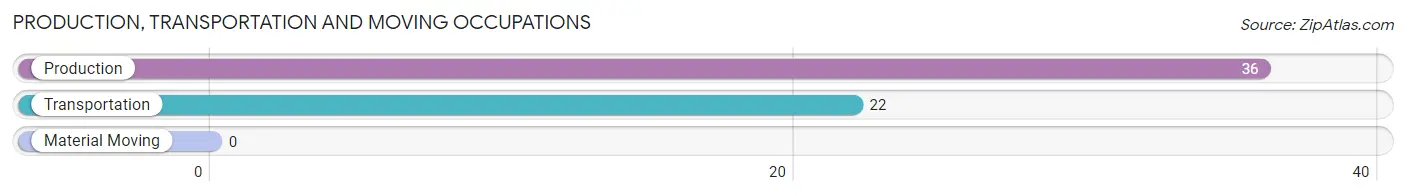
Production, Transportation and Moving Occupations
The most common Production, Transportation and Moving occupations in Wells are Production (36 | 6.6%), and Transportation (22 | 4.0%).
Production, Transportation and Moving Occupations by Sex
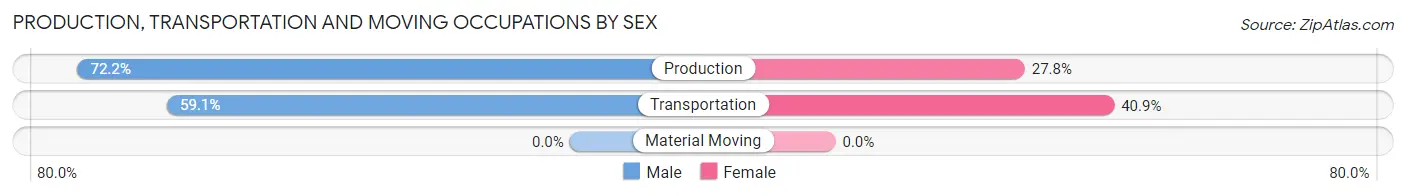
| Occupation | Male | Female |
| Production | 26 (72.2%) | 10 (27.8%) |
| Transportation | 13 (59.1%) | 9 (40.9%) |
| Material Moving | 0 (0.0%) | 0 (0.0%) |
| Total (Category) | 39 (67.2%) | 19 (32.8%) |
| Total (Overall) | 263 (47.9%) | 286 (52.1%) |
Employment Industries by Sex in Wells
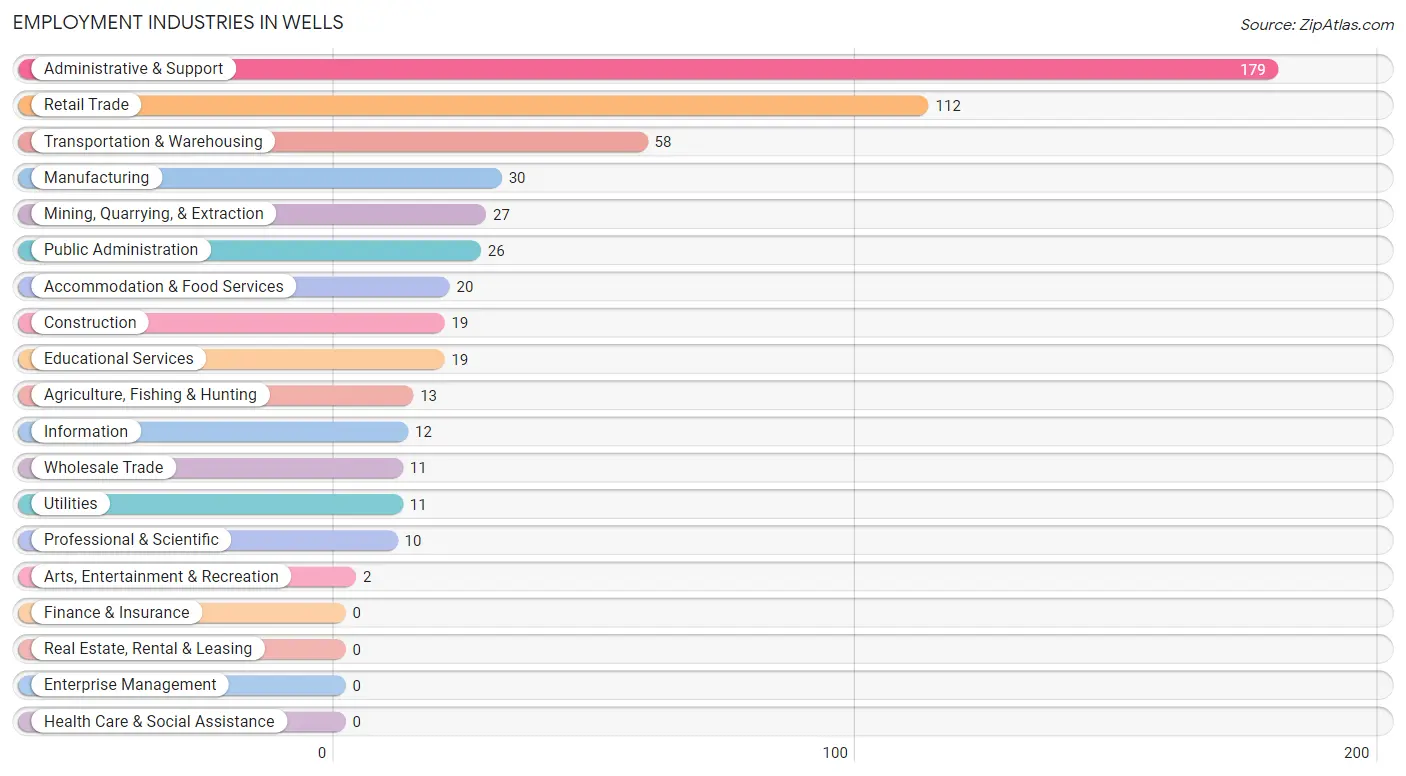
Employment Industries in Wells
The major employment industries in Wells include Administrative & Support (179 | 32.6%), Retail Trade (112 | 20.4%), Transportation & Warehousing (58 | 10.6%), Manufacturing (30 | 5.5%), and Mining, Quarrying, & Extraction (27 | 4.9%).
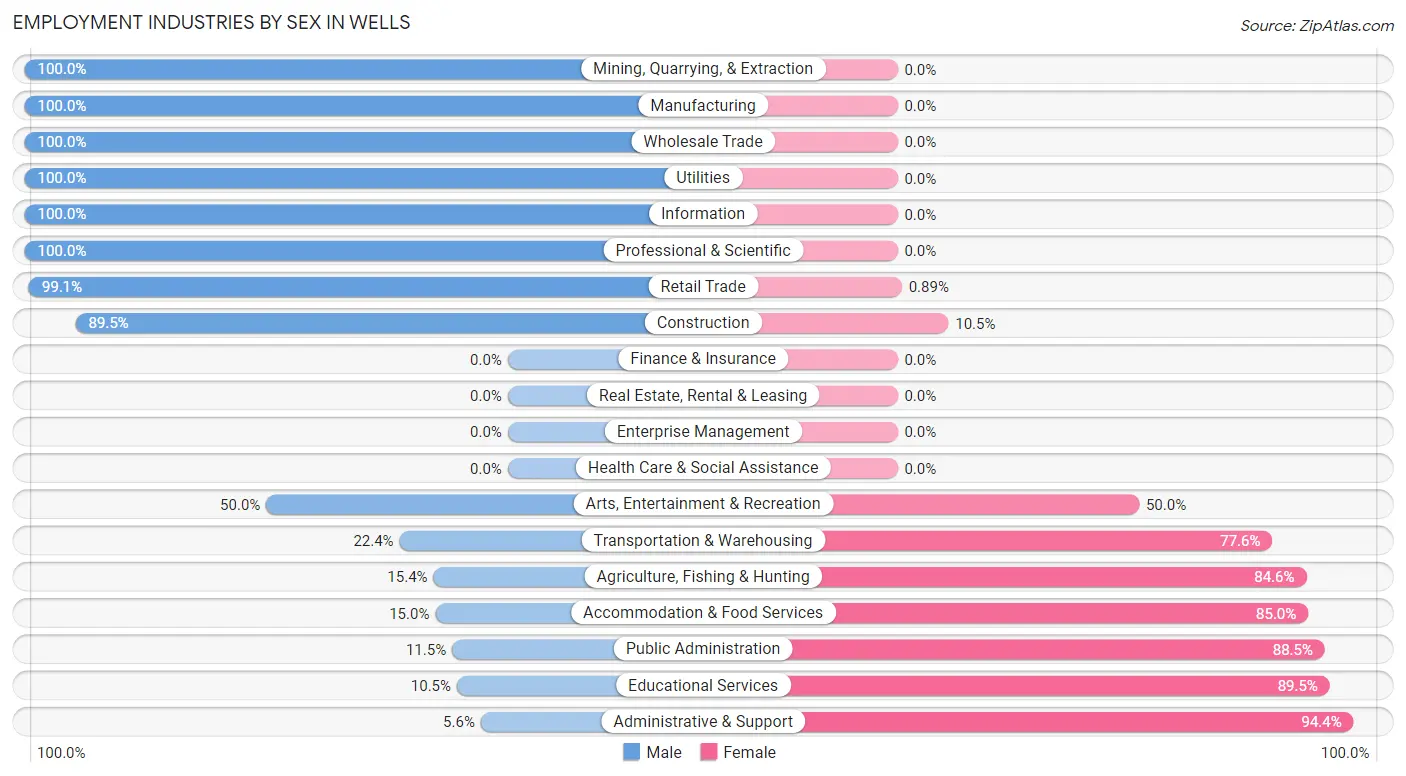
Employment Industries by Sex in Wells
The Wells industries that see more men than women are Mining, Quarrying, & Extraction (100.0%), Manufacturing (100.0%), and Wholesale Trade (100.0%), whereas the industries that tend to have a higher number of women are Administrative & Support (94.4%), Educational Services (89.5%), and Public Administration (88.5%).
| Industry | Male | Female |
| Agriculture, Fishing & Hunting | 2 (15.4%) | 11 (84.6%) |
| Mining, Quarrying, & Extraction | 27 (100.0%) | 0 (0.0%) |
| Construction | 17 (89.5%) | 2 (10.5%) |
| Manufacturing | 30 (100.0%) | 0 (0.0%) |
| Wholesale Trade | 11 (100.0%) | 0 (0.0%) |
| Retail Trade | 111 (99.1%) | 1 (0.9%) |
| Transportation & Warehousing | 13 (22.4%) | 45 (77.6%) |
| Utilities | 11 (100.0%) | 0 (0.0%) |
| Information | 12 (100.0%) | 0 (0.0%) |
| Finance & Insurance | 0 (0.0%) | 0 (0.0%) |
| Real Estate, Rental & Leasing | 0 (0.0%) | 0 (0.0%) |
| Professional & Scientific | 10 (100.0%) | 0 (0.0%) |
| Enterprise Management | 0 (0.0%) | 0 (0.0%) |
| Administrative & Support | 10 (5.6%) | 169 (94.4%) |
| Educational Services | 2 (10.5%) | 17 (89.5%) |
| Health Care & Social Assistance | 0 (0.0%) | 0 (0.0%) |
| Arts, Entertainment & Recreation | 1 (50.0%) | 1 (50.0%) |
| Accommodation & Food Services | 3 (15.0%) | 17 (85.0%) |
| Public Administration | 3 (11.5%) | 23 (88.5%) |
| Total | 263 (47.9%) | 286 (52.1%) |
Education in Wells
School Enrollment in Wells
The most common levels of schooling among the 267 students in Wells are high school (118 | 44.2%), elementary school (79 | 29.6%), and middle school (70 | 26.2%).
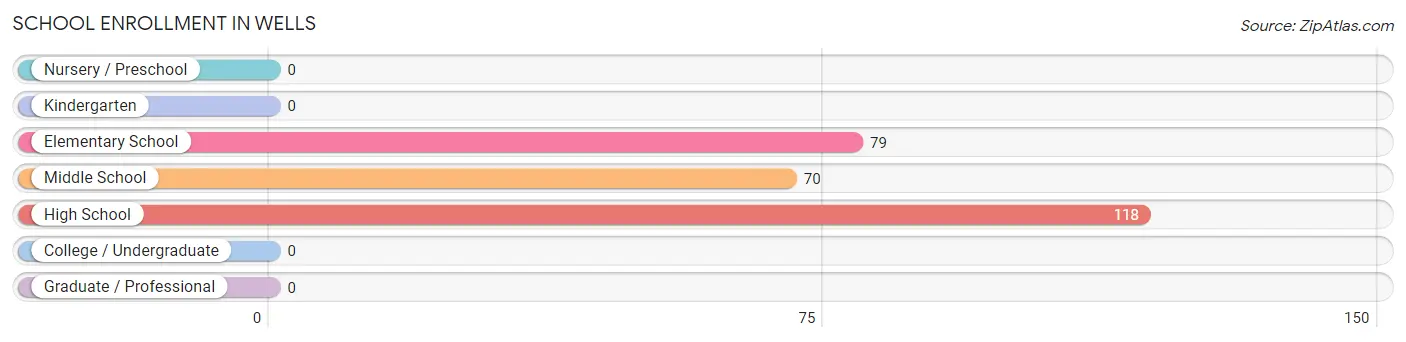
| School Level | # Students | % Students |
| Nursery / Preschool | 0 | 0.0% |
| Kindergarten | 0 | 0.0% |
| Elementary School | 79 | 29.6% |
| Middle School | 70 | 26.2% |
| High School | 118 | 44.2% |
| College / Undergraduate | 0 | 0.0% |
| Graduate / Professional | 0 | 0.0% |
| Total | 267 | 100.0% |
School Enrollment by Age by Funding Source in Wells
Out of a total of 267 students who are enrolled in schools in Wells, 27 (10.1%) attend a private institution, while the remaining 240 (89.9%) are enrolled in public schools. The age group of 15 to 17 year olds has the highest likelihood of being enrolled in private schools, with 17 (21.0% in the age bracket) enrolled. Conversely, the age group of 5 to 9 year old has the lowest likelihood of being enrolled in a private school, with 60 (100.0% in the age bracket) attending a public institution.
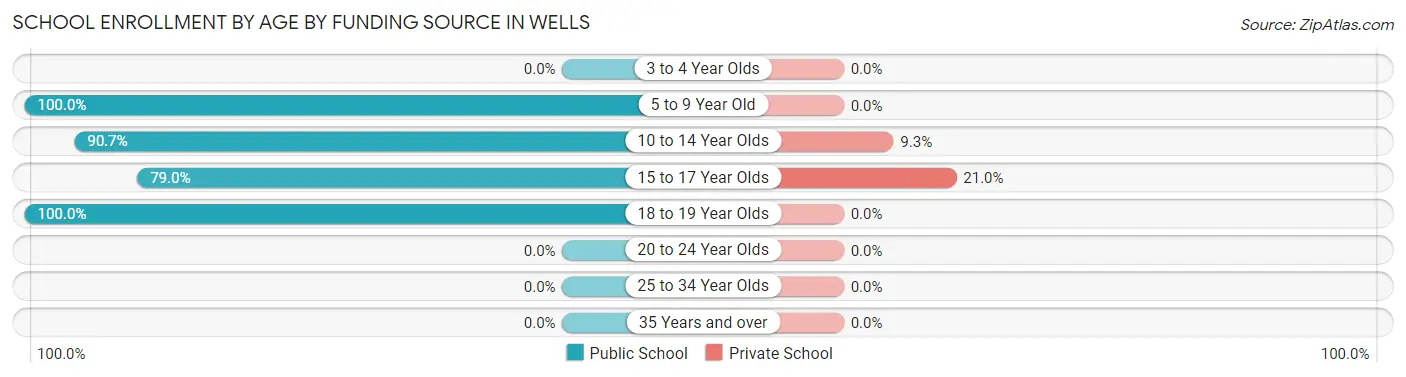
| Age Bracket | Public School | Private School |
| 3 to 4 Year Olds | 0 (0.0%) | 0 (0.0%) |
| 5 to 9 Year Old | 60 (100.0%) | 0 (0.0%) |
| 10 to 14 Year Olds | 98 (90.7%) | 10 (9.3%) |
| 15 to 17 Year Olds | 64 (79.0%) | 17 (21.0%) |
| 18 to 19 Year Olds | 18 (100.0%) | 0 (0.0%) |
| 20 to 24 Year Olds | 0 (0.0%) | 0 (0.0%) |
| 25 to 34 Year Olds | 0 (0.0%) | 0 (0.0%) |
| 35 Years and over | 0 (0.0%) | 0 (0.0%) |
| Total | 240 (89.9%) | 27 (10.1%) |
Educational Attainment by Field of Study in Wells
Business (117 | 81.2%), computers & mathematics (16 | 11.1%), physical & health sciences (9 | 6.2%), and communications (2 | 1.4%) are the most common fields of study among 144 individuals in Wells who have obtained a bachelor's degree or higher.
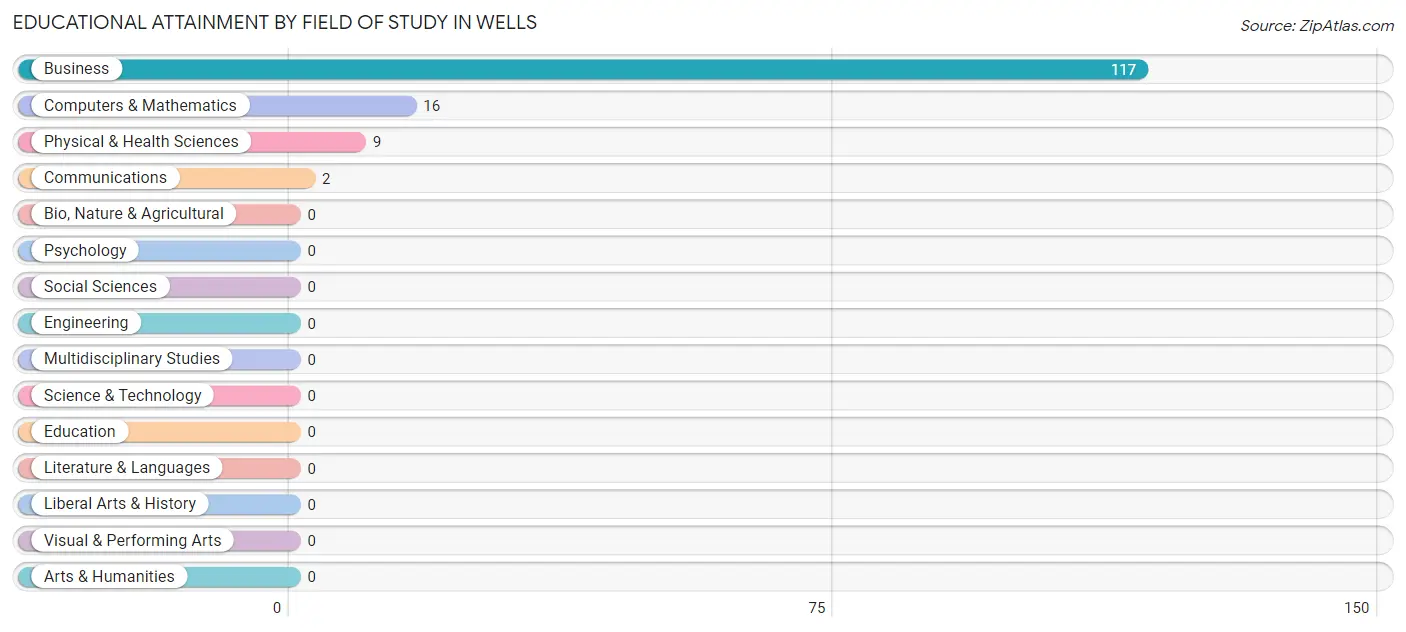
| Field of Study | # Graduates | % Graduates |
| Computers & Mathematics | 16 | 11.1% |
| Bio, Nature & Agricultural | 0 | 0.0% |
| Physical & Health Sciences | 9 | 6.2% |
| Psychology | 0 | 0.0% |
| Social Sciences | 0 | 0.0% |
| Engineering | 0 | 0.0% |
| Multidisciplinary Studies | 0 | 0.0% |
| Science & Technology | 0 | 0.0% |
| Business | 117 | 81.2% |
| Education | 0 | 0.0% |
| Literature & Languages | 0 | 0.0% |
| Liberal Arts & History | 0 | 0.0% |
| Visual & Performing Arts | 0 | 0.0% |
| Communications | 2 | 1.4% |
| Arts & Humanities | 0 | 0.0% |
| Total | 144 | 100.0% |
Transportation & Commute in Wells
Vehicle Availability by Sex in Wells
The most prevalent vehicle ownership categories in Wells are males with 2 vehicles (181, accounting for 68.8%) and females with 2 vehicles (239, making up 60.9%).
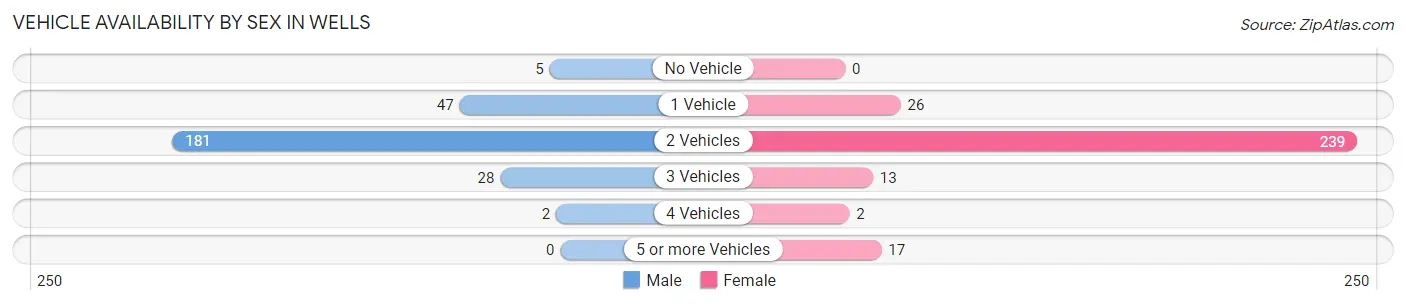
| Vehicles Available | Male | Female |
| No Vehicle | 5 (1.9%) | 0 (0.0%) |
| 1 Vehicle | 47 (17.9%) | 26 (8.7%) |
| 2 Vehicles | 181 (68.8%) | 239 (80.5%) |
| 3 Vehicles | 28 (10.6%) | 13 (4.4%) |
| 4 Vehicles | 2 (0.8%) | 2 (0.7%) |
| 5 or more Vehicles | 0 (0.0%) | 17 (5.7%) |
| Total | 263 (100.0%) | 297 (100.0%) |
Commute Time in Wells
The most frequently occuring commute durations in Wells are 20 to 24 minutes (190 commuters, 36.3%), less than 5 minutes (147 commuters, 28.1%), and 5 to 9 minutes (82 commuters, 15.7%).
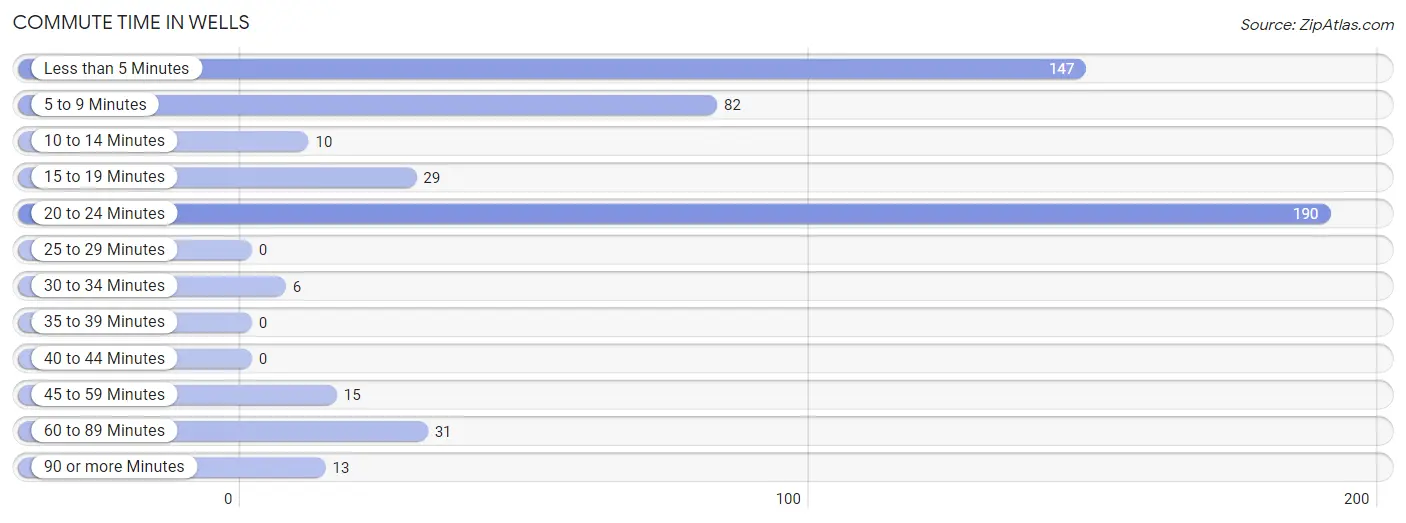
| Commute Time | # Commuters | % Commuters |
| Less than 5 Minutes | 147 | 28.1% |
| 5 to 9 Minutes | 82 | 15.7% |
| 10 to 14 Minutes | 10 | 1.9% |
| 15 to 19 Minutes | 29 | 5.5% |
| 20 to 24 Minutes | 190 | 36.3% |
| 25 to 29 Minutes | 0 | 0.0% |
| 30 to 34 Minutes | 6 | 1.1% |
| 35 to 39 Minutes | 0 | 0.0% |
| 40 to 44 Minutes | 0 | 0.0% |
| 45 to 59 Minutes | 15 | 2.9% |
| 60 to 89 Minutes | 31 | 5.9% |
| 90 or more Minutes | 13 | 2.5% |
Commute Time by Sex in Wells
The most common commute times in Wells are less than 5 minutes (145 commuters, 58.7%) for males and 20 to 24 minutes (190 commuters, 68.8%) for females.
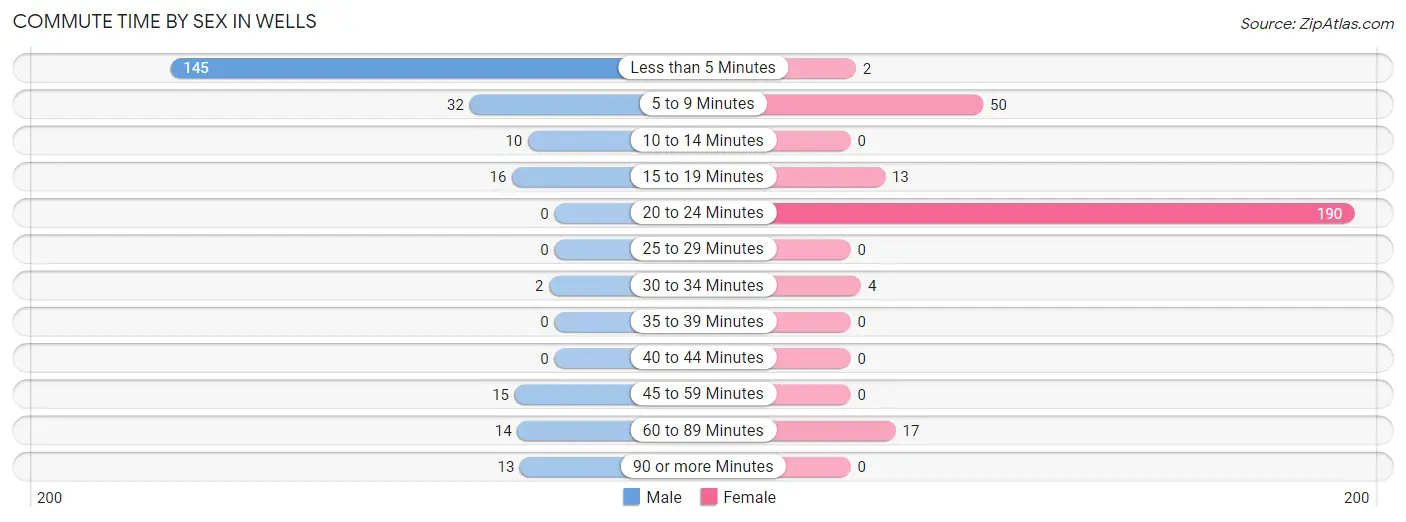
| Commute Time | Male | Female |
| Less than 5 Minutes | 145 (58.7%) | 2 (0.7%) |
| 5 to 9 Minutes | 32 (13.0%) | 50 (18.1%) |
| 10 to 14 Minutes | 10 (4.1%) | 0 (0.0%) |
| 15 to 19 Minutes | 16 (6.5%) | 13 (4.7%) |
| 20 to 24 Minutes | 0 (0.0%) | 190 (68.8%) |
| 25 to 29 Minutes | 0 (0.0%) | 0 (0.0%) |
| 30 to 34 Minutes | 2 (0.8%) | 4 (1.5%) |
| 35 to 39 Minutes | 0 (0.0%) | 0 (0.0%) |
| 40 to 44 Minutes | 0 (0.0%) | 0 (0.0%) |
| 45 to 59 Minutes | 15 (6.1%) | 0 (0.0%) |
| 60 to 89 Minutes | 14 (5.7%) | 17 (6.2%) |
| 90 or more Minutes | 13 (5.3%) | 0 (0.0%) |
Time of Departure to Work by Sex in Wells
The most frequent times of departure to work in Wells are 7:30 AM to 7:59 AM (117, 47.4%) for males and 6:30 AM to 6:59 AM (154, 55.8%) for females.
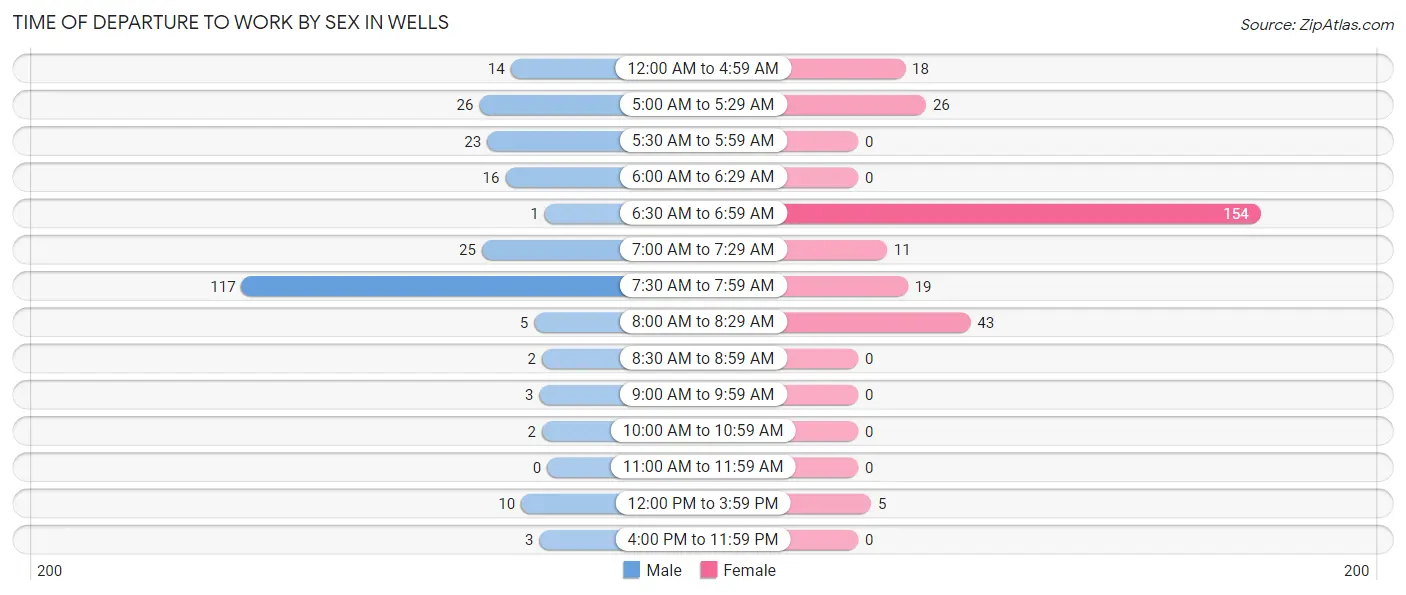
| Time of Departure | Male | Female |
| 12:00 AM to 4:59 AM | 14 (5.7%) | 18 (6.5%) |
| 5:00 AM to 5:29 AM | 26 (10.5%) | 26 (9.4%) |
| 5:30 AM to 5:59 AM | 23 (9.3%) | 0 (0.0%) |
| 6:00 AM to 6:29 AM | 16 (6.5%) | 0 (0.0%) |
| 6:30 AM to 6:59 AM | 1 (0.4%) | 154 (55.8%) |
| 7:00 AM to 7:29 AM | 25 (10.1%) | 11 (4.0%) |
| 7:30 AM to 7:59 AM | 117 (47.4%) | 19 (6.9%) |
| 8:00 AM to 8:29 AM | 5 (2.0%) | 43 (15.6%) |
| 8:30 AM to 8:59 AM | 2 (0.8%) | 0 (0.0%) |
| 9:00 AM to 9:59 AM | 3 (1.2%) | 0 (0.0%) |
| 10:00 AM to 10:59 AM | 2 (0.8%) | 0 (0.0%) |
| 11:00 AM to 11:59 AM | 0 (0.0%) | 0 (0.0%) |
| 12:00 PM to 3:59 PM | 10 (4.1%) | 5 (1.8%) |
| 4:00 PM to 11:59 PM | 3 (1.2%) | 0 (0.0%) |
| Total | 247 (100.0%) | 276 (100.0%) |
Housing Occupancy in Wells
Occupancy by Ownership in Wells
Of the total 303 dwellings in Wells, owner-occupied units account for 205 (67.7%), while renter-occupied units make up 98 (32.3%).
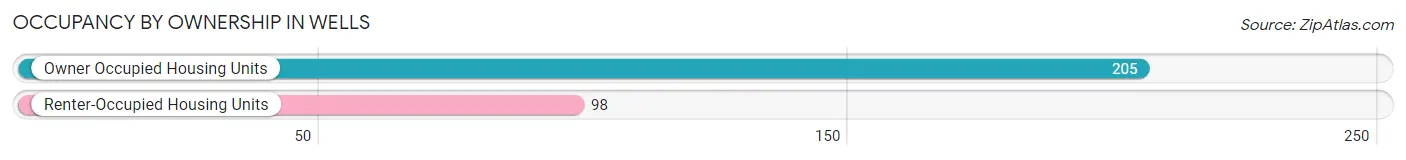
| Occupancy | # Housing Units | % Housing Units |
| Owner Occupied Housing Units | 205 | 67.7% |
| Renter-Occupied Housing Units | 98 | 32.3% |
| Total Occupied Housing Units | 303 | 100.0% |
Occupancy by Household Size in Wells
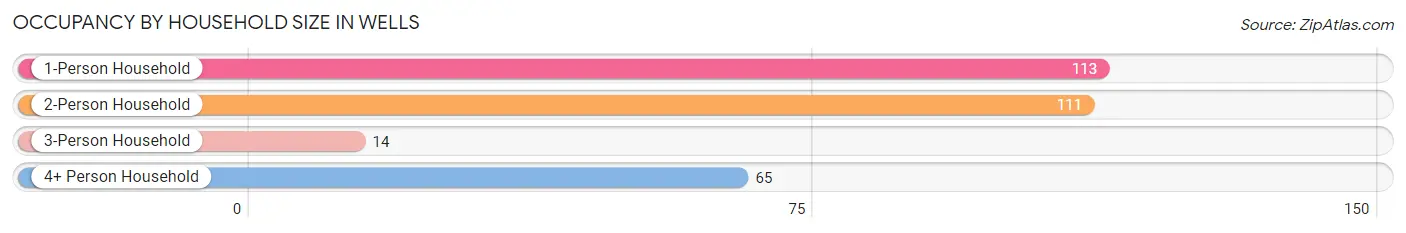
| Household Size | # Housing Units | % Housing Units |
| 1-Person Household | 113 | 37.3% |
| 2-Person Household | 111 | 36.6% |
| 3-Person Household | 14 | 4.6% |
| 4+ Person Household | 65 | 21.4% |
| Total Housing Units | 303 | 100.0% |
Occupancy by Ownership by Household Size in Wells
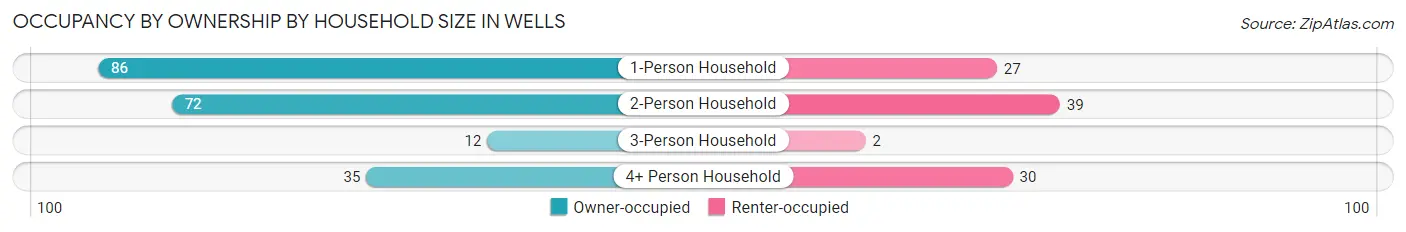
| Household Size | Owner-occupied | Renter-occupied |
| 1-Person Household | 86 (76.1%) | 27 (23.9%) |
| 2-Person Household | 72 (64.9%) | 39 (35.1%) |
| 3-Person Household | 12 (85.7%) | 2 (14.3%) |
| 4+ Person Household | 35 (53.8%) | 30 (46.2%) |
| Total Housing Units | 205 (67.7%) | 98 (32.3%) |
Occupancy by Educational Attainment in Wells
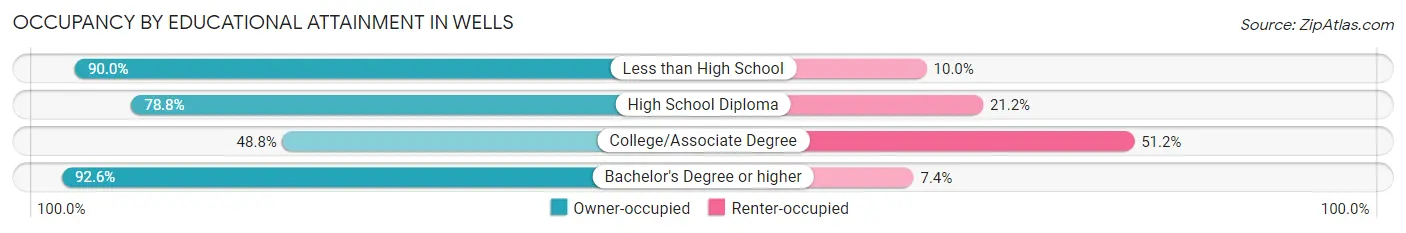
| Household Size | Owner-occupied | Renter-occupied |
| Less than High School | 9 (90.0%) | 1 (10.0%) |
| High School Diploma | 108 (78.8%) | 29 (21.2%) |
| College/Associate Degree | 63 (48.8%) | 66 (51.2%) |
| Bachelor's Degree or higher | 25 (92.6%) | 2 (7.4%) |
Occupancy by Age of Householder in Wells
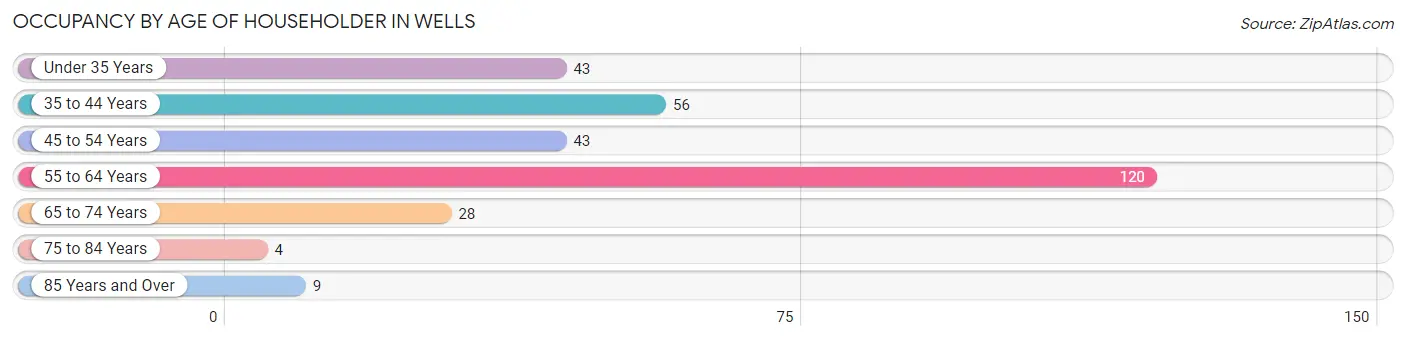
| Age Bracket | # Households | % Households |
| Under 35 Years | 43 | 14.2% |
| 35 to 44 Years | 56 | 18.5% |
| 45 to 54 Years | 43 | 14.2% |
| 55 to 64 Years | 120 | 39.6% |
| 65 to 74 Years | 28 | 9.2% |
| 75 to 84 Years | 4 | 1.3% |
| 85 Years and Over | 9 | 3.0% |
| Total | 303 | 100.0% |
Housing Finances in Wells
Median Income by Occupancy in Wells
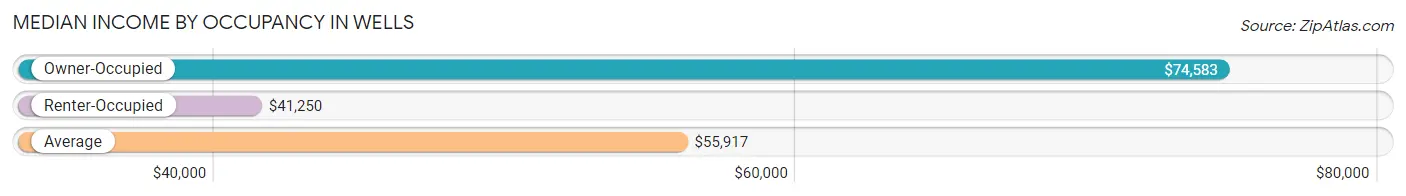
| Occupancy Type | # Households | Median Income |
| Owner-Occupied | 205 (67.7%) | $74,583 |
| Renter-Occupied | 98 (32.3%) | $41,250 |
| Average | 303 (100.0%) | $55,917 |
Occupancy by Householder Income Bracket in Wells
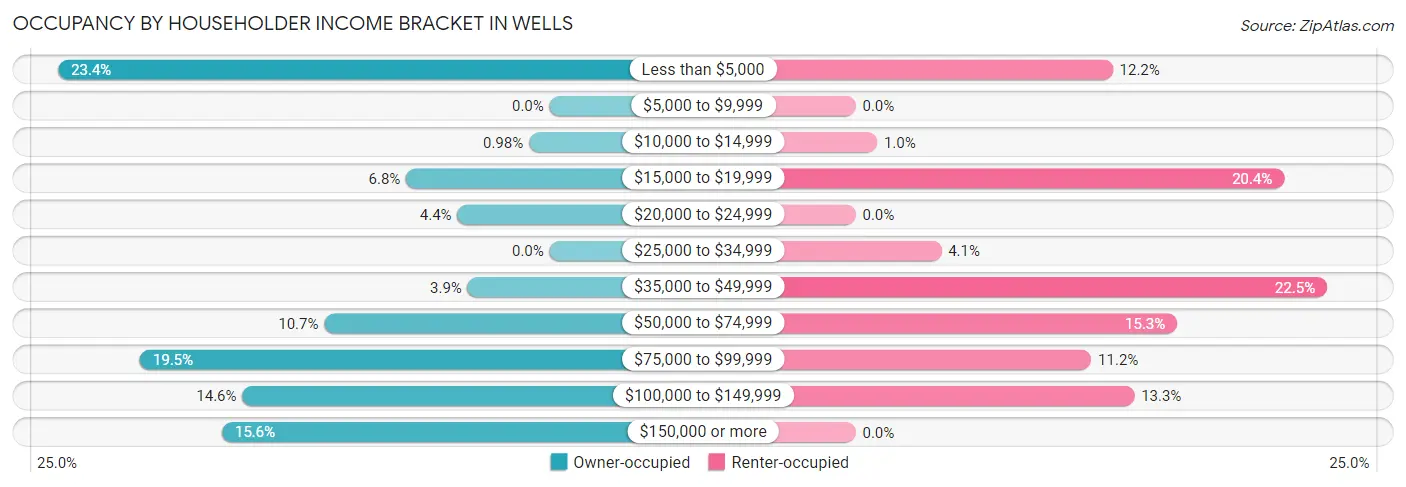
| Income Bracket | Owner-occupied | Renter-occupied |
| Less than $5,000 | 48 (23.4%) | 12 (12.2%) |
| $5,000 to $9,999 | 0 (0.0%) | 0 (0.0%) |
| $10,000 to $14,999 | 2 (1.0%) | 1 (1.0%) |
| $15,000 to $19,999 | 14 (6.8%) | 20 (20.4%) |
| $20,000 to $24,999 | 9 (4.4%) | 0 (0.0%) |
| $25,000 to $34,999 | 0 (0.0%) | 4 (4.1%) |
| $35,000 to $49,999 | 8 (3.9%) | 22 (22.5%) |
| $50,000 to $74,999 | 22 (10.7%) | 15 (15.3%) |
| $75,000 to $99,999 | 40 (19.5%) | 11 (11.2%) |
| $100,000 to $149,999 | 30 (14.6%) | 13 (13.3%) |
| $150,000 or more | 32 (15.6%) | 0 (0.0%) |
| Total | 205 (100.0%) | 98 (100.0%) |
Monthly Housing Cost Tiers in Wells
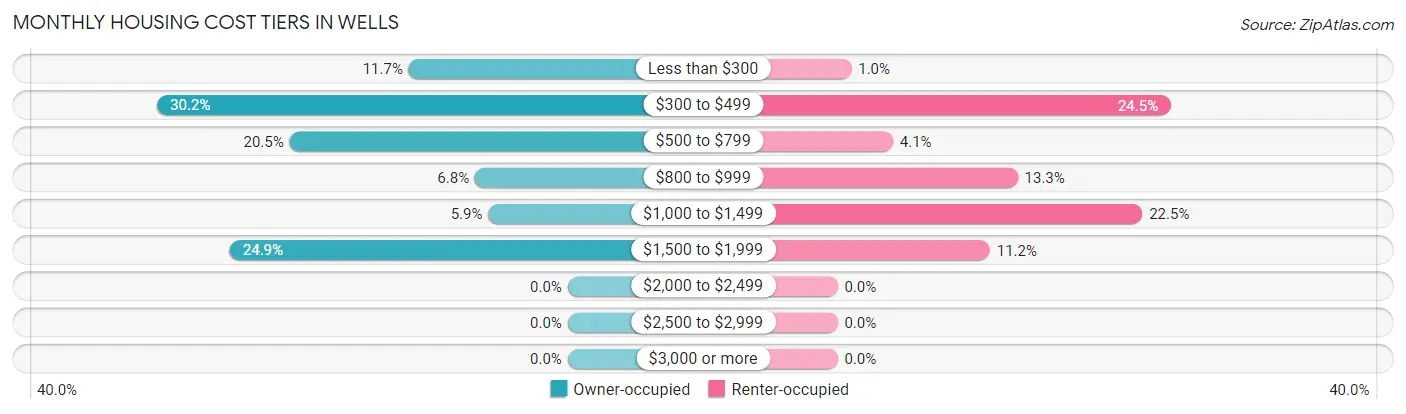
| Monthly Cost | Owner-occupied | Renter-occupied |
| Less than $300 | 24 (11.7%) | 1 (1.0%) |
| $300 to $499 | 62 (30.2%) | 24 (24.5%) |
| $500 to $799 | 42 (20.5%) | 4 (4.1%) |
| $800 to $999 | 14 (6.8%) | 13 (13.3%) |
| $1,000 to $1,499 | 12 (5.9%) | 22 (22.5%) |
| $1,500 to $1,999 | 51 (24.9%) | 11 (11.2%) |
| $2,000 to $2,499 | 0 (0.0%) | 0 (0.0%) |
| $2,500 to $2,999 | 0 (0.0%) | 0 (0.0%) |
| $3,000 or more | 0 (0.0%) | 0 (0.0%) |
| Total | 205 (100.0%) | 98 (100.0%) |
Physical Housing Characteristics in Wells
Housing Structures in Wells
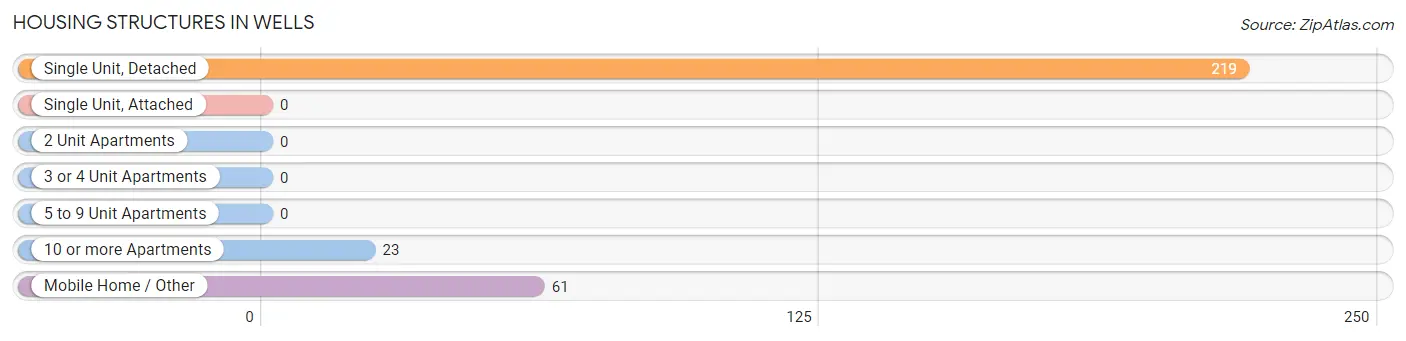
| Structure Type | # Housing Units | % Housing Units |
| Single Unit, Detached | 219 | 72.3% |
| Single Unit, Attached | 0 | 0.0% |
| 2 Unit Apartments | 0 | 0.0% |
| 3 or 4 Unit Apartments | 0 | 0.0% |
| 5 to 9 Unit Apartments | 0 | 0.0% |
| 10 or more Apartments | 23 | 7.6% |
| Mobile Home / Other | 61 | 20.1% |
| Total | 303 | 100.0% |
Housing Structures by Occupancy in Wells
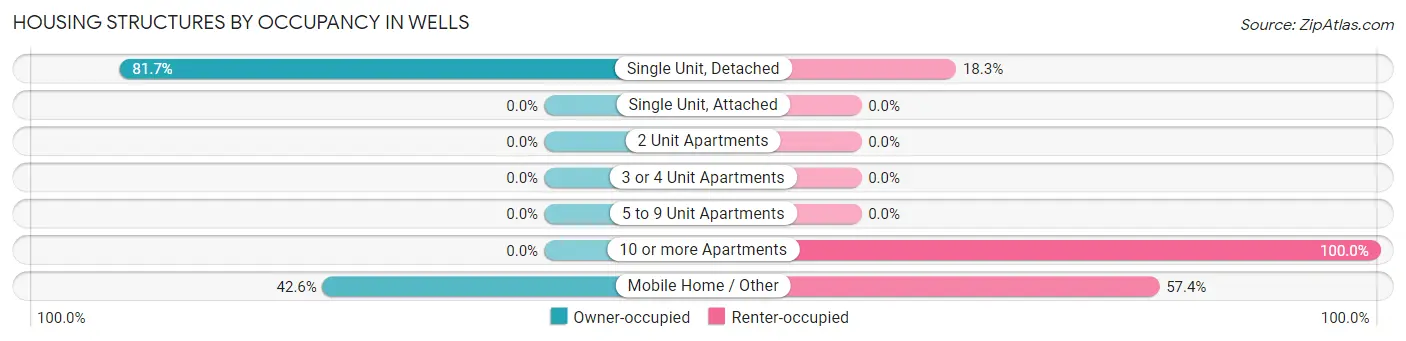
| Structure Type | Owner-occupied | Renter-occupied |
| Single Unit, Detached | 179 (81.7%) | 40 (18.3%) |
| Single Unit, Attached | 0 (0.0%) | 0 (0.0%) |
| 2 Unit Apartments | 0 (0.0%) | 0 (0.0%) |
| 3 or 4 Unit Apartments | 0 (0.0%) | 0 (0.0%) |
| 5 to 9 Unit Apartments | 0 (0.0%) | 0 (0.0%) |
| 10 or more Apartments | 0 (0.0%) | 23 (100.0%) |
| Mobile Home / Other | 26 (42.6%) | 35 (57.4%) |
| Total | 205 (67.7%) | 98 (32.3%) |
Housing Structures by Number of Rooms in Wells
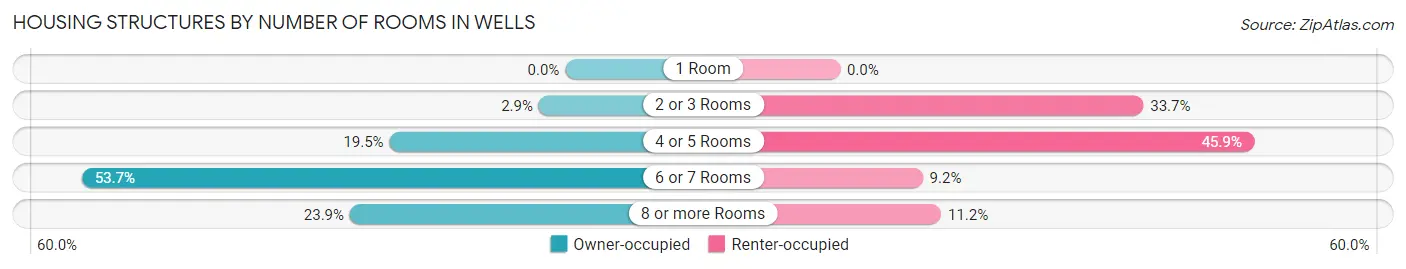
| Number of Rooms | Owner-occupied | Renter-occupied |
| 1 Room | 0 (0.0%) | 0 (0.0%) |
| 2 or 3 Rooms | 6 (2.9%) | 33 (33.7%) |
| 4 or 5 Rooms | 40 (19.5%) | 45 (45.9%) |
| 6 or 7 Rooms | 110 (53.7%) | 9 (9.2%) |
| 8 or more Rooms | 49 (23.9%) | 11 (11.2%) |
| Total | 205 (100.0%) | 98 (100.0%) |
Housing Structure by Heating Type in Wells
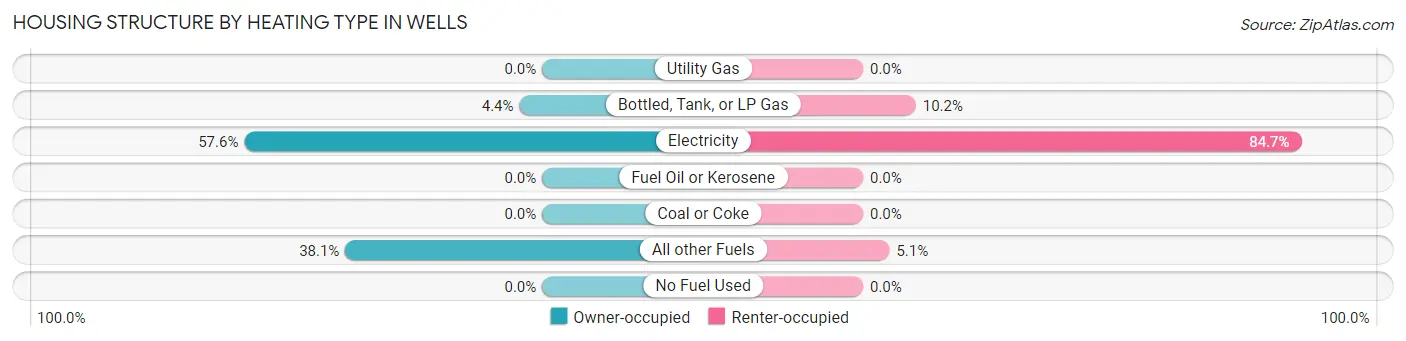
| Heating Type | Owner-occupied | Renter-occupied |
| Utility Gas | 0 (0.0%) | 0 (0.0%) |
| Bottled, Tank, or LP Gas | 9 (4.4%) | 10 (10.2%) |
| Electricity | 118 (57.6%) | 83 (84.7%) |
| Fuel Oil or Kerosene | 0 (0.0%) | 0 (0.0%) |
| Coal or Coke | 0 (0.0%) | 0 (0.0%) |
| All other Fuels | 78 (38.1%) | 5 (5.1%) |
| No Fuel Used | 0 (0.0%) | 0 (0.0%) |
| Total | 205 (100.0%) | 98 (100.0%) |
Household Vehicle Usage in Wells
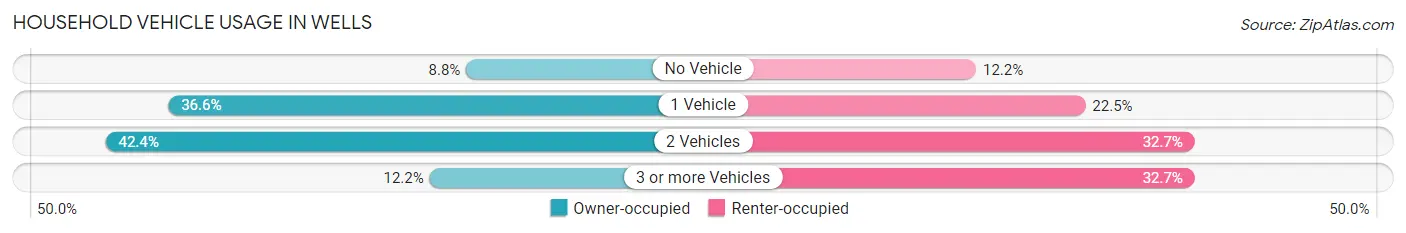
| Vehicles per Household | Owner-occupied | Renter-occupied |
| No Vehicle | 18 (8.8%) | 12 (12.2%) |
| 1 Vehicle | 75 (36.6%) | 22 (22.5%) |
| 2 Vehicles | 87 (42.4%) | 32 (32.7%) |
| 3 or more Vehicles | 25 (12.2%) | 32 (32.7%) |
| Total | 205 (100.0%) | 98 (100.0%) |
Real Estate & Mortgages in Wells
Real Estate and Mortgage Overview in Wells
| Characteristic | Without Mortgage | With Mortgage |
| Housing Units | 84 | 121 |
| Median Property Value | $155,600 | $195,800 |
| Median Household Income | $70,909 | $11 |
| Monthly Housing Costs | $345 | $0 |
| Real Estate Taxes | $846 | $2 |
Property Value by Mortgage Status in Wells
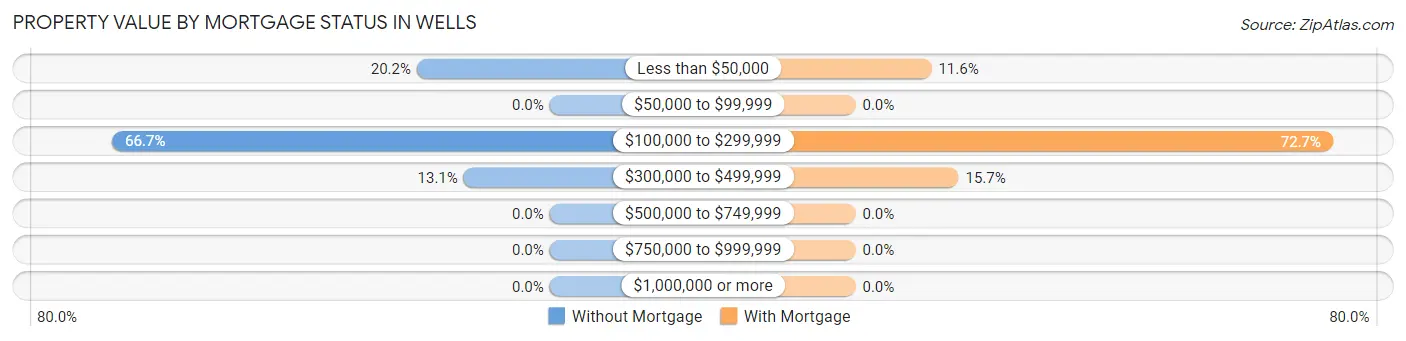
| Property Value | Without Mortgage | With Mortgage |
| Less than $50,000 | 17 (20.2%) | 14 (11.6%) |
| $50,000 to $99,999 | 0 (0.0%) | 0 (0.0%) |
| $100,000 to $299,999 | 56 (66.7%) | 88 (72.7%) |
| $300,000 to $499,999 | 11 (13.1%) | 19 (15.7%) |
| $500,000 to $749,999 | 0 (0.0%) | 0 (0.0%) |
| $750,000 to $999,999 | 0 (0.0%) | 0 (0.0%) |
| $1,000,000 or more | 0 (0.0%) | 0 (0.0%) |
| Total | 84 (100.0%) | 121 (100.0%) |
Household Income by Mortgage Status in Wells
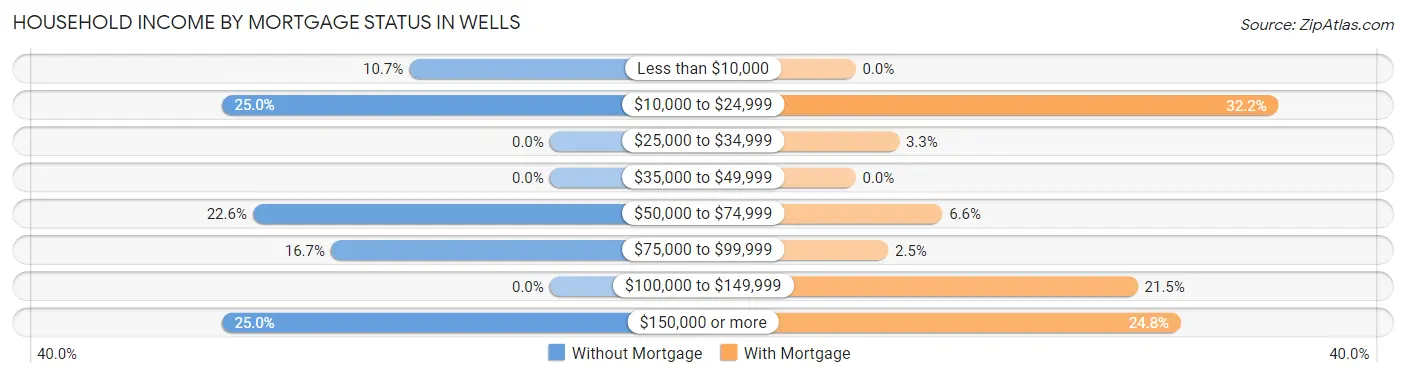
| Household Income | Without Mortgage | With Mortgage |
| Less than $10,000 | 9 (10.7%) | 0 (0.0%) |
| $10,000 to $24,999 | 21 (25.0%) | 39 (32.2%) |
| $25,000 to $34,999 | 0 (0.0%) | 4 (3.3%) |
| $35,000 to $49,999 | 0 (0.0%) | 0 (0.0%) |
| $50,000 to $74,999 | 19 (22.6%) | 8 (6.6%) |
| $75,000 to $99,999 | 14 (16.7%) | 3 (2.5%) |
| $100,000 to $149,999 | 0 (0.0%) | 26 (21.5%) |
| $150,000 or more | 21 (25.0%) | 30 (24.8%) |
| Total | 84 (100.0%) | 121 (100.0%) |
Property Value to Household Income Ratio in Wells
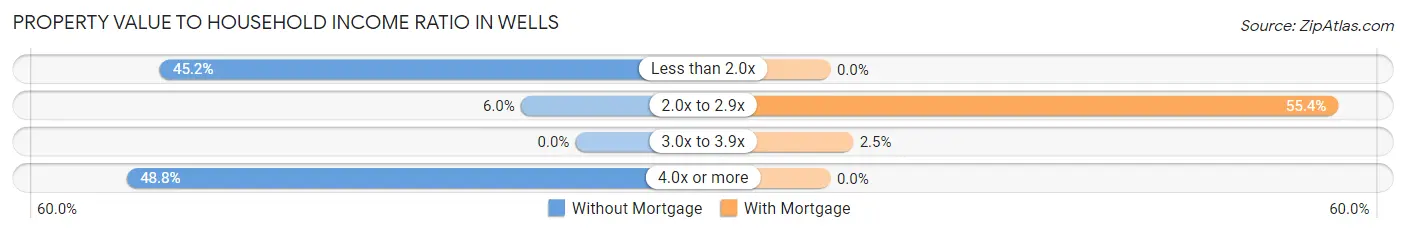
| Value-to-Income Ratio | Without Mortgage | With Mortgage |
| Less than 2.0x | 38 (45.2%) | 0 (0.0%) |
| 2.0x to 2.9x | 5 (5.9%) | 67 (55.4%) |
| 3.0x to 3.9x | 0 (0.0%) | 3 (2.5%) |
| 4.0x or more | 41 (48.8%) | 0 (0.0%) |
| Total | 84 (100.0%) | 121 (100.0%) |
Real Estate Taxes by Mortgage Status in Wells
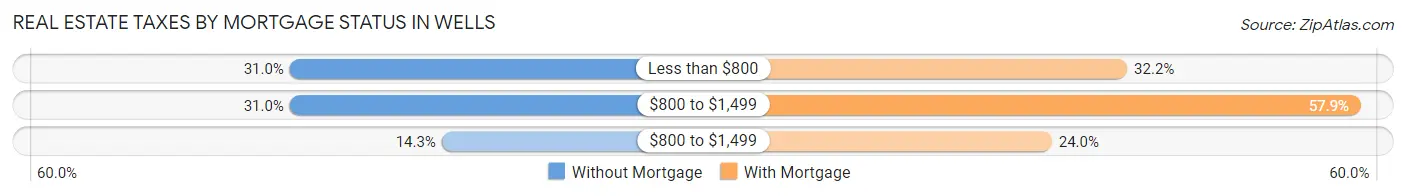
| Property Taxes | Without Mortgage | With Mortgage |
| Less than $800 | 26 (30.9%) | 39 (32.2%) |
| $800 to $1,499 | 26 (30.9%) | 70 (57.9%) |
| $800 to $1,499 | 12 (14.3%) | 29 (24.0%) |
| Total | 84 (100.0%) | 121 (100.0%) |
Health & Disability in Wells
Health Insurance Coverage by Age in Wells
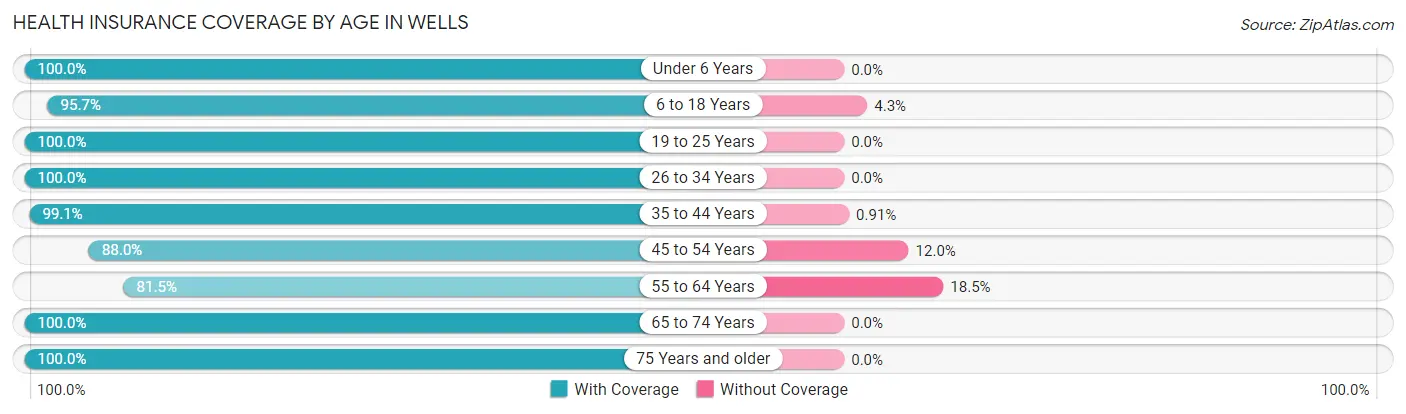
| Age Bracket | With Coverage | Without Coverage |
| Under 6 Years | 20 (100.0%) | 0 (0.0%) |
| 6 to 18 Years | 267 (95.7%) | 12 (4.3%) |
| 19 to 25 Years | 5 (100.0%) | 0 (0.0%) |
| 26 to 34 Years | 55 (100.0%) | 0 (0.0%) |
| 35 to 44 Years | 217 (99.1%) | 2 (0.9%) |
| 45 to 54 Years | 176 (88.0%) | 24 (12.0%) |
| 55 to 64 Years | 172 (81.5%) | 39 (18.5%) |
| 65 to 74 Years | 41 (100.0%) | 0 (0.0%) |
| 75 Years and older | 16 (100.0%) | 0 (0.0%) |
| Total | 969 (92.6%) | 77 (7.4%) |
Health Insurance Coverage by Citizenship Status in Wells
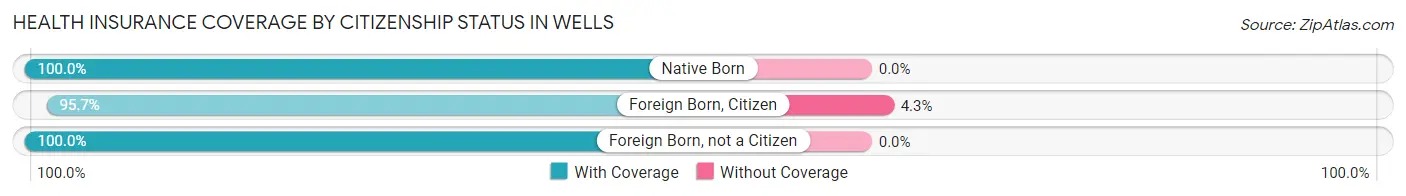
| Citizenship Status | With Coverage | Without Coverage |
| Native Born | 20 (100.0%) | 0 (0.0%) |
| Foreign Born, Citizen | 267 (95.7%) | 12 (4.3%) |
| Foreign Born, not a Citizen | 5 (100.0%) | 0 (0.0%) |
Health Insurance Coverage by Household Income in Wells
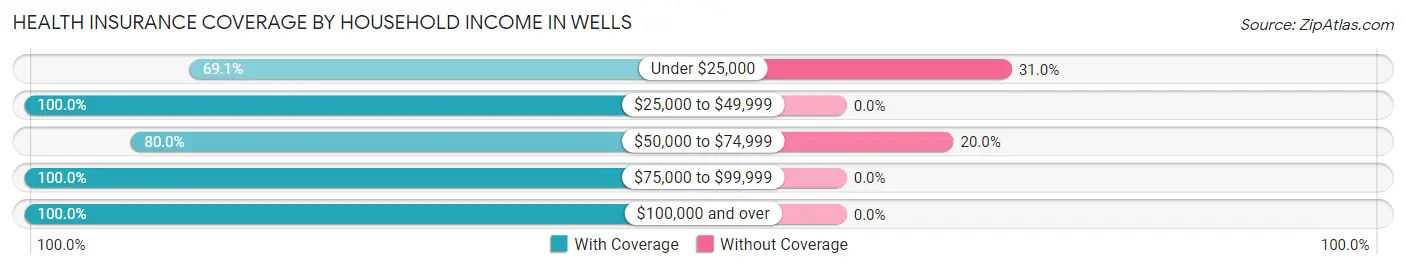
| Household Income | With Coverage | Without Coverage |
| Under $25,000 | 116 (69.1%) | 52 (30.9%) |
| $25,000 to $49,999 | 351 (100.0%) | 0 (0.0%) |
| $50,000 to $74,999 | 76 (80.0%) | 19 (20.0%) |
| $75,000 to $99,999 | 242 (100.0%) | 0 (0.0%) |
| $100,000 and over | 184 (100.0%) | 0 (0.0%) |
Public vs Private Health Insurance Coverage by Age in Wells
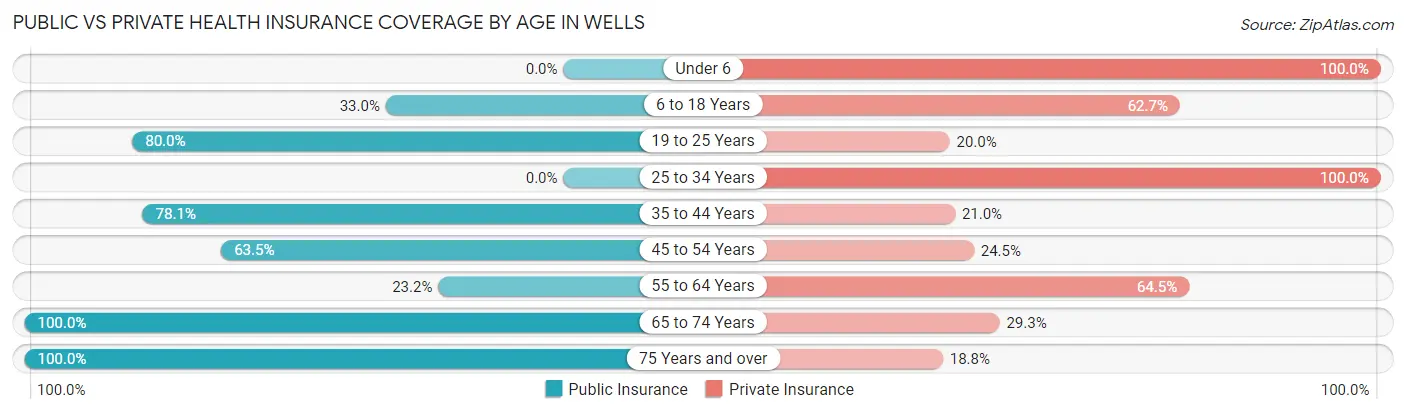
| Age Bracket | Public Insurance | Private Insurance |
| Under 6 | 0 (0.0%) | 20 (100.0%) |
| 6 to 18 Years | 92 (33.0%) | 175 (62.7%) |
| 19 to 25 Years | 4 (80.0%) | 1 (20.0%) |
| 25 to 34 Years | 0 (0.0%) | 55 (100.0%) |
| 35 to 44 Years | 171 (78.1%) | 46 (21.0%) |
| 45 to 54 Years | 127 (63.5%) | 49 (24.5%) |
| 55 to 64 Years | 49 (23.2%) | 136 (64.4%) |
| 65 to 74 Years | 41 (100.0%) | 12 (29.3%) |
| 75 Years and over | 16 (100.0%) | 3 (18.8%) |
| Total | 500 (47.8%) | 497 (47.5%) |
Disability Status by Sex by Age in Wells
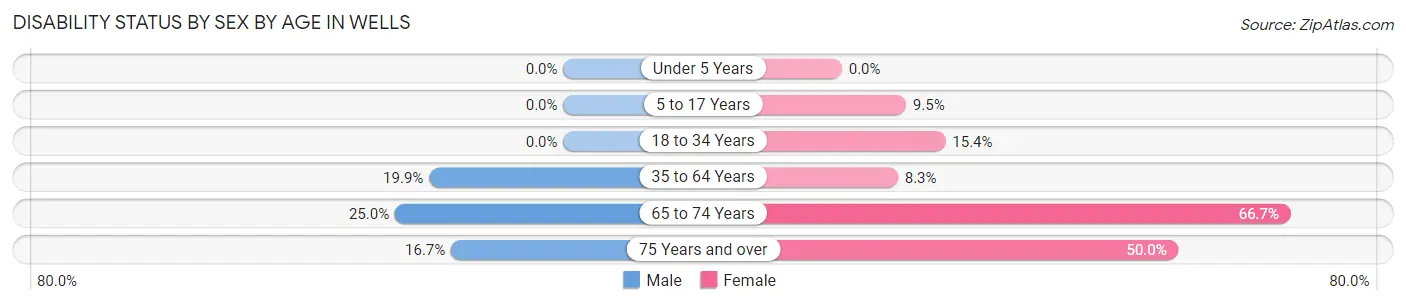
| Age Bracket | Male | Female |
| Under 5 Years | 0 (0.0%) | 0 (0.0%) |
| 5 to 17 Years | 0 (0.0%) | 14 (9.5%) |
| 18 to 34 Years | 0 (0.0%) | 4 (15.4%) |
| 35 to 64 Years | 56 (19.9%) | 29 (8.3%) |
| 65 to 74 Years | 5 (25.0%) | 14 (66.7%) |
| 75 Years and over | 2 (16.7%) | 2 (50.0%) |
Disability Class by Sex by Age in Wells
Disability Class: Hearing Difficulty
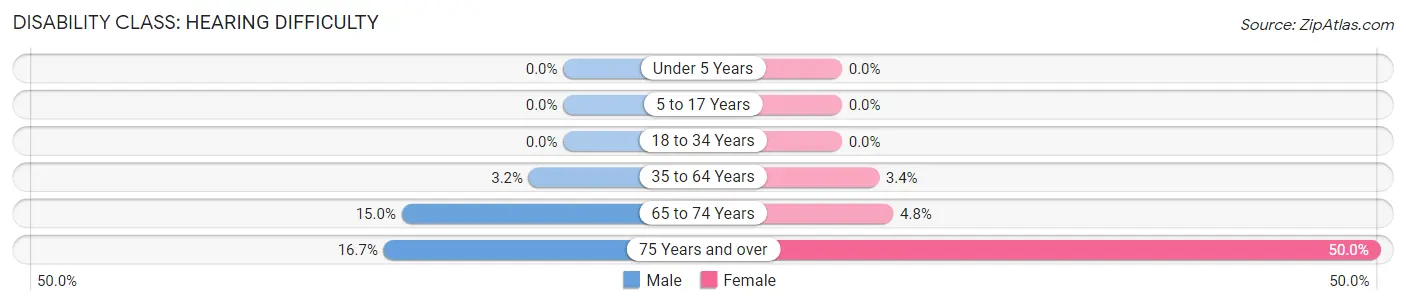
| Age Bracket | Male | Female |
| Under 5 Years | 0 (0.0%) | 0 (0.0%) |
| 5 to 17 Years | 0 (0.0%) | 0 (0.0%) |
| 18 to 34 Years | 0 (0.0%) | 0 (0.0%) |
| 35 to 64 Years | 9 (3.2%) | 12 (3.4%) |
| 65 to 74 Years | 3 (15.0%) | 1 (4.8%) |
| 75 Years and over | 2 (16.7%) | 2 (50.0%) |
Disability Class: Vision Difficulty
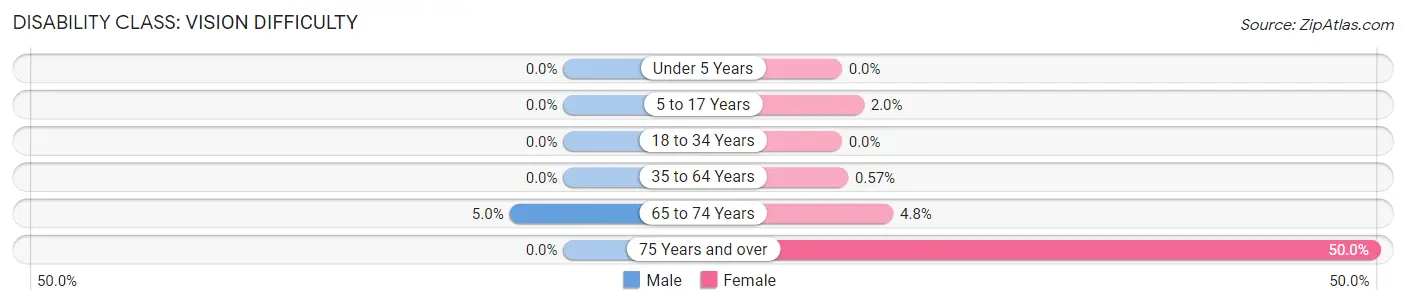
| Age Bracket | Male | Female |
| Under 5 Years | 0 (0.0%) | 0 (0.0%) |
| 5 to 17 Years | 0 (0.0%) | 3 (2.0%) |
| 18 to 34 Years | 0 (0.0%) | 0 (0.0%) |
| 35 to 64 Years | 0 (0.0%) | 2 (0.6%) |
| 65 to 74 Years | 1 (5.0%) | 1 (4.8%) |
| 75 Years and over | 0 (0.0%) | 2 (50.0%) |
Disability Class: Cognitive Difficulty
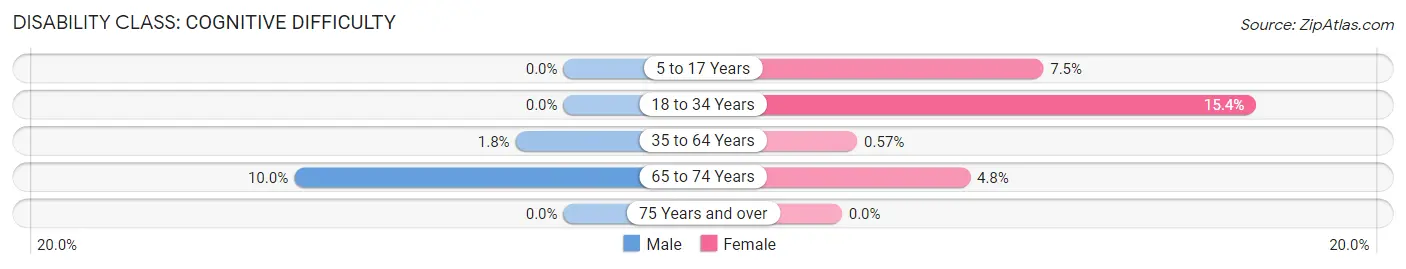
| Age Bracket | Male | Female |
| 5 to 17 Years | 0 (0.0%) | 11 (7.5%) |
| 18 to 34 Years | 0 (0.0%) | 4 (15.4%) |
| 35 to 64 Years | 5 (1.8%) | 2 (0.6%) |
| 65 to 74 Years | 2 (10.0%) | 1 (4.8%) |
| 75 Years and over | 0 (0.0%) | 0 (0.0%) |
Disability Class: Ambulatory Difficulty
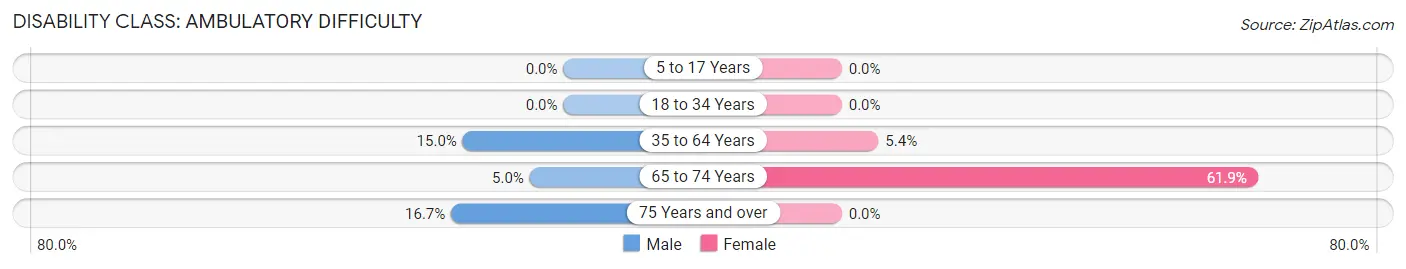
| Age Bracket | Male | Female |
| 5 to 17 Years | 0 (0.0%) | 0 (0.0%) |
| 18 to 34 Years | 0 (0.0%) | 0 (0.0%) |
| 35 to 64 Years | 42 (14.9%) | 19 (5.4%) |
| 65 to 74 Years | 1 (5.0%) | 13 (61.9%) |
| 75 Years and over | 2 (16.7%) | 0 (0.0%) |
Disability Class: Self-Care Difficulty
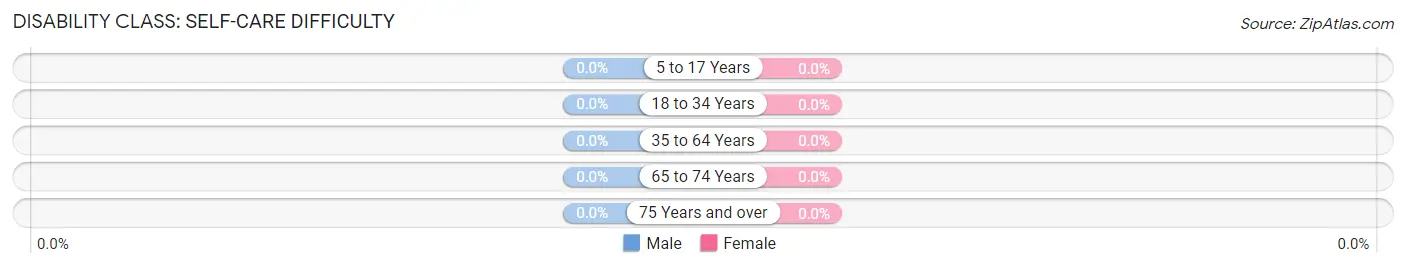
| Age Bracket | Male | Female |
| 5 to 17 Years | 0 (0.0%) | 0 (0.0%) |
| 18 to 34 Years | 0 (0.0%) | 0 (0.0%) |
| 35 to 64 Years | 0 (0.0%) | 0 (0.0%) |
| 65 to 74 Years | 0 (0.0%) | 0 (0.0%) |
| 75 Years and over | 0 (0.0%) | 0 (0.0%) |
Technology Access in Wells
Computing Device Access in Wells
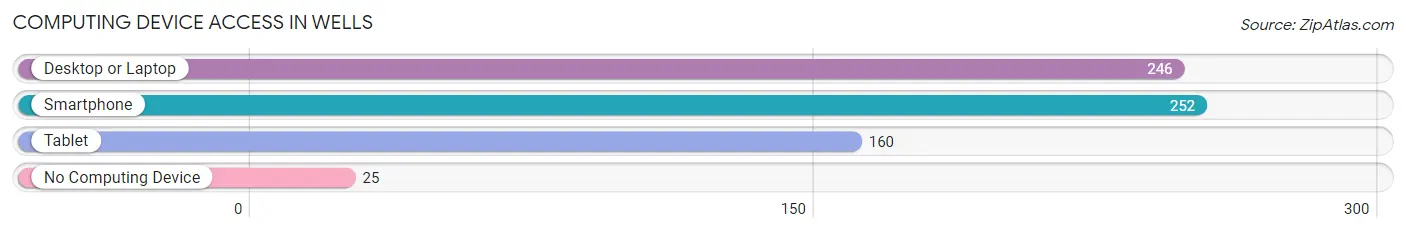
| Device Type | # Households | % Households |
| Desktop or Laptop | 246 | 81.2% |
| Smartphone | 252 | 83.2% |
| Tablet | 160 | 52.8% |
| No Computing Device | 25 | 8.3% |
| Total | 303 | 100.0% |
Internet Access in Wells
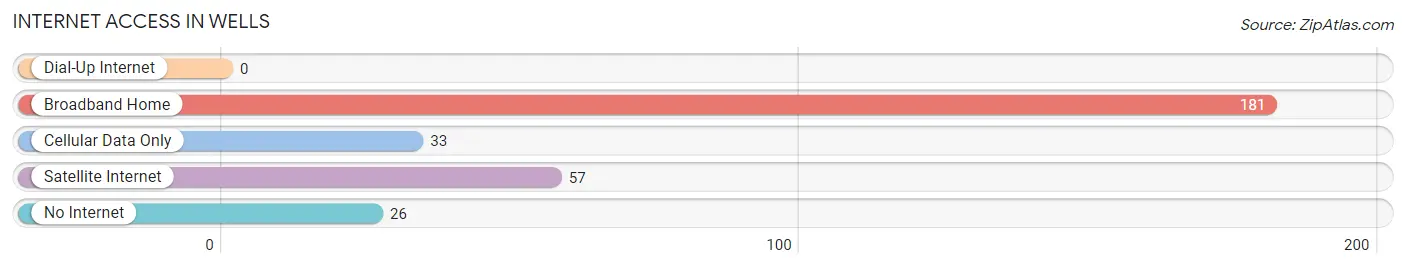
| Internet Type | # Households | % Households |
| Dial-Up Internet | 0 | 0.0% |
| Broadband Home | 181 | 59.7% |
| Cellular Data Only | 33 | 10.9% |
| Satellite Internet | 57 | 18.8% |
| No Internet | 26 | 8.6% |
| Total | 303 | 100.0% |
Wells Summary
Wells, Nevada is a small city located in Elko County, in the northeastern part of the state. It is situated at the intersection of Interstate 80 and U.S. Highway 93, and is the largest city in Elko County. The city was founded in 1869 as a stagecoach station, and has since grown to become a major hub for transportation, commerce, and industry in the region.
History
Wells was founded in 1869 as a stagecoach station, and was named after the nearby Wells Overland Stage Station. The station was established by the Central Pacific Railroad, and was used to transport passengers and freight between Salt Lake City and San Francisco. The city was incorporated in 1908, and has since grown to become a major hub for transportation, commerce, and industry in the region.
Geography
Wells is located in Elko County, in the northeastern part of the state. It is situated at the intersection of Interstate 80 and U.S. Highway 93, and is the largest city in Elko County. The city is located in the Great Basin Desert, and is surrounded by mountains and desert terrain. The city has a total area of 4.3 square miles, and has an elevation of 5,845 feet.
Economy
Wells is a major hub for transportation, commerce, and industry in the region. The city is home to several major employers, including the Wells Fargo Bank, the Elko County School District, and the Elko County Sheriff’s Office. The city is also home to several major trucking companies, including Swift Transportation, Schneider National, and J.B. Hunt. The city is also home to several major casinos, including the Red Lion Hotel and Casino, the Gold Country Inn and Casino, and the Elko County Casino.
Demographics
As of the 2010 census, Wells had a population of 1,346. The racial makeup of the city was 87.3% White, 0.7% African American, 0.9% Native American, 0.2% Asian, 0.1% Pacific Islander, 8.2% from other races, and 2.7% from two or more races. Hispanic or Latino of any race were 16.2% of the population. The median household income in Wells was $37,917, and the median family income was $45,625. The per capita income in Wells was $19,945.
Wells is a small city with a rich history and a vibrant economy. It is a major hub for transportation, commerce, and industry in the region, and is home to several major employers. The city is also home to several major casinos, and has a diverse population with a median household income of $37,917. Wells is a great place to live, work, and play, and is a great example of the beauty and diversity of Nevada.
Common Questions
What is Per Capita Income in Wells?
Per Capita income in Wells is $25,228.
What is the Median Family Income in Wells?
Median Family Income in Wells is $87,596.
What is the Median Household income in Wells?
Median Household Income in Wells is $55,917.
What is Inequality or Gini Index in Wells?
Inequality or Gini Index in Wells is 0.53.
What is the Total Population of Wells?
Total Population of Wells is 1,057.
What is the Total Male Population of Wells?
Total Male Population of Wells is 489.
What is the Total Female Population of Wells?
Total Female Population of Wells is 568.
What is the Ratio of Males per 100 Females in Wells?
There are 86.09 Males per 100 Females in Wells.
What is the Ratio of Females per 100 Males in Wells?
There are 116.16 Females per 100 Males in Wells.
What is the Median Population Age in Wells?
Median Population Age in Wells is 41.6 Years.
What is the Average Family Size in Wells
Average Family Size in Wells is 5.1 People.
What is the Average Household Size in Wells
Average Household Size in Wells is 3.5 People.
How Large is the Labor Force in Wells?
There are 562 People in the Labor Forcein in Wells.
What is the Percentage of People in the Labor Force in Wells?
65.6% of People are in the Labor Force in Wells.
What is the Unemployment Rate in Wells?
Unemployment Rate in Wells is 0.4%.