Washoe Valley, NV Map & Demographics
Washoe Valley Map
Washoe Valley Overview
$46,499
PER CAPITA INCOME
$113,393
AVG FAMILY INCOME
$99,018
AVG HOUSEHOLD INCOME
39.5%
WAGE / INCOME GAP [ % ]
60.5¢/ $1
WAGE / INCOME GAP [ $ ]
0.36
INEQUALITY / GINI INDEX
3,235
TOTAL POPULATION
1,746
MALE POPULATION
1,489
FEMALE POPULATION
117.26
MALES / 100 FEMALES
85.28
FEMALES / 100 MALES
58.7
MEDIAN AGE
2.8
AVG FAMILY SIZE
2.5
AVG HOUSEHOLD SIZE
1,568
LABOR FORCE [ PEOPLE ]
52.7%
PERCENT IN LABOR FORCE
4.8%
UNEMPLOYMENT RATE
Washoe Valley Zip Codes
Washoe Valley Area Codes
Income in Washoe Valley
Income Overview in Washoe Valley
Per Capita Income in Washoe Valley is $46,499, while median incomes of families and households are $113,393 and $99,018 respectively.
| Characteristic | Number | Measure |
| Per Capita Income | 3,235 | $46,499 |
| Median Family Income | 989 | $113,393 |
| Mean Family Income | 989 | $107,694 |
| Median Household Income | 1,297 | $99,018 |
| Mean Household Income | 1,297 | $114,200 |
| Income Deficit | 989 | $0 |
| Wage / Income Gap (%) | 3,235 | 39.53% |
| Wage / Income Gap ($) | 3,235 | 60.47¢ per $1 |
| Gini / Inequality Index | 3,235 | 0.36 |
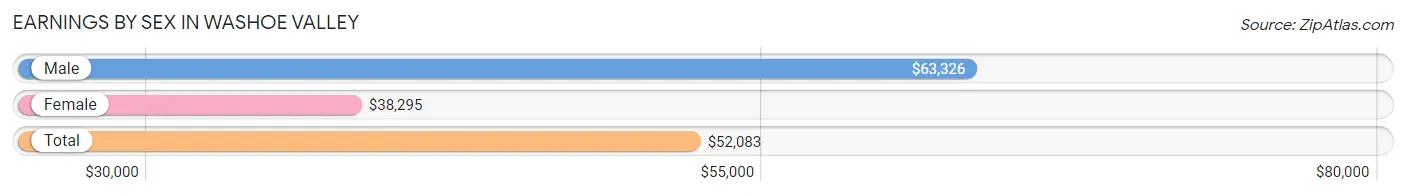
Earnings by Sex in Washoe Valley
Average Earnings in Washoe Valley are $52,083, $63,326 for men and $38,295 for women, a difference of 39.5%.
| Sex | Number | Average Earnings |
| Male | 1,115 (63.9%) | $63,326 |
| Female | 629 (36.1%) | $38,295 |
| Total | 1,744 (100.0%) | $52,083 |
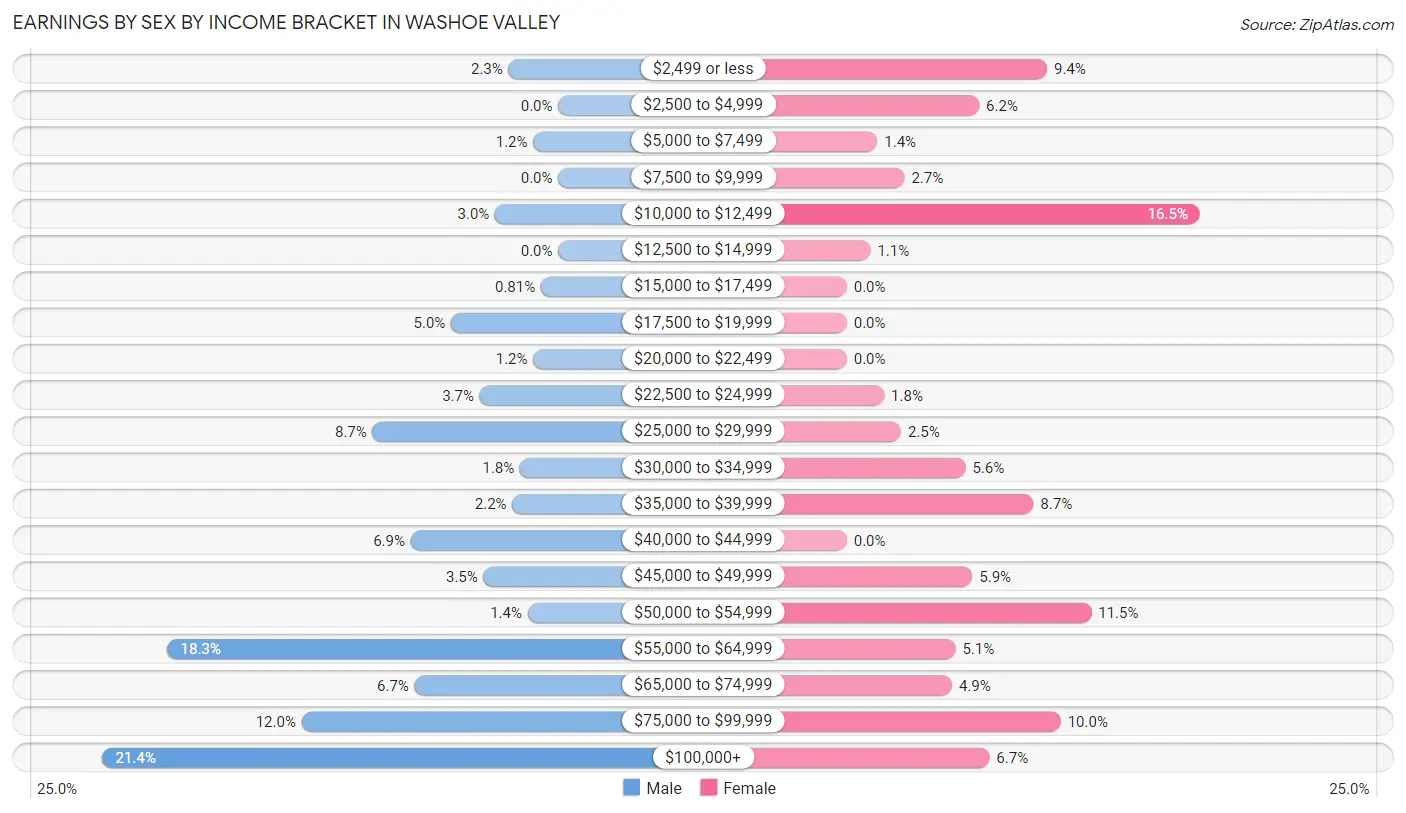
Earnings by Sex by Income Bracket in Washoe Valley
The most common earnings brackets in Washoe Valley are $100,000+ for men (238 | 21.3%) and $10,000 to $12,499 for women (104 | 16.5%).
| Income | Male | Female |
| $2,499 or less | 26 (2.3%) | 59 (9.4%) |
| $2,500 to $4,999 | 0 (0.0%) | 39 (6.2%) |
| $5,000 to $7,499 | 13 (1.2%) | 9 (1.4%) |
| $7,500 to $9,999 | 0 (0.0%) | 17 (2.7%) |
| $10,000 to $12,499 | 33 (3.0%) | 104 (16.5%) |
| $12,500 to $14,999 | 0 (0.0%) | 7 (1.1%) |
| $15,000 to $17,499 | 9 (0.8%) | 0 (0.0%) |
| $17,500 to $19,999 | 56 (5.0%) | 0 (0.0%) |
| $20,000 to $22,499 | 13 (1.2%) | 0 (0.0%) |
| $22,500 to $24,999 | 41 (3.7%) | 11 (1.8%) |
| $25,000 to $29,999 | 97 (8.7%) | 16 (2.5%) |
| $30,000 to $34,999 | 20 (1.8%) | 35 (5.6%) |
| $35,000 to $39,999 | 24 (2.1%) | 55 (8.7%) |
| $40,000 to $44,999 | 77 (6.9%) | 0 (0.0%) |
| $45,000 to $49,999 | 39 (3.5%) | 37 (5.9%) |
| $50,000 to $54,999 | 16 (1.4%) | 72 (11.5%) |
| $55,000 to $64,999 | 204 (18.3%) | 32 (5.1%) |
| $65,000 to $74,999 | 75 (6.7%) | 31 (4.9%) |
| $75,000 to $99,999 | 134 (12.0%) | 63 (10.0%) |
| $100,000+ | 238 (21.3%) | 42 (6.7%) |
| Total | 1,115 (100.0%) | 629 (100.0%) |
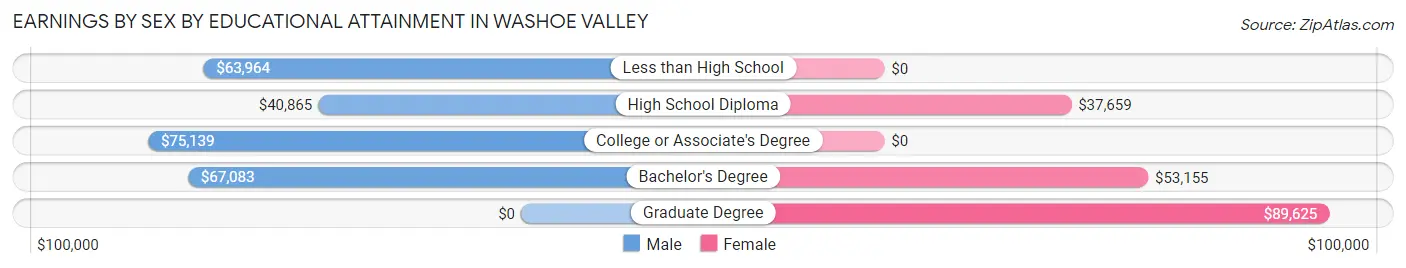
Earnings by Sex by Educational Attainment in Washoe Valley
Average earnings in Washoe Valley are $63,689 for men and $39,682 for women, a difference of 37.7%. Men with an educational attainment of college or associate's degree enjoy the highest average annual earnings of $75,139, while those with high school diploma education earn the least with $40,865. Women with an educational attainment of graduate degree earn the most with the average annual earnings of $89,625, while those with high school diploma education have the smallest earnings of $37,659.
| Educational Attainment | Male Income | Female Income |
| Less than High School | $63,964 | $0 |
| High School Diploma | $40,865 | $37,659 |
| College or Associate's Degree | $75,139 | $0 |
| Bachelor's Degree | $67,083 | $53,155 |
| Graduate Degree | - | - |
| Total | $63,689 | $39,682 |
Family Income in Washoe Valley
Family Income Brackets in Washoe Valley
According to the Washoe Valley family income data, there are 321 families falling into the $100,000 to $149,999 income range, which is the most common income bracket and makes up 32.5% of all families.
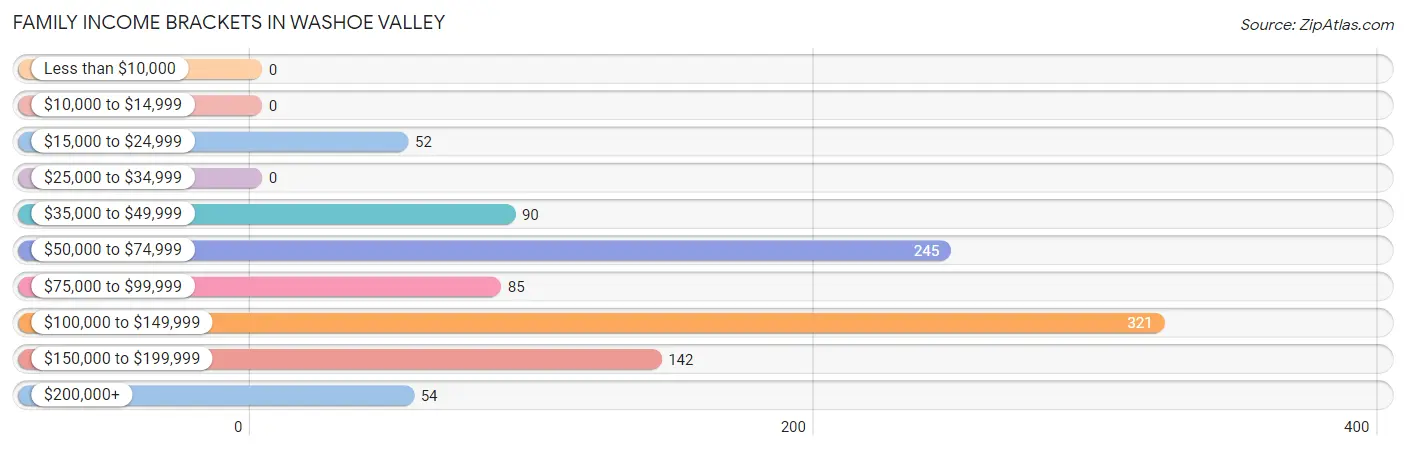
| Income Bracket | # Families | % Families |
| Less than $10,000 | 0 | 0.0% |
| $10,000 to $14,999 | 0 | 0.0% |
| $15,000 to $24,999 | 52 | 5.3% |
| $25,000 to $34,999 | 0 | 0.0% |
| $35,000 to $49,999 | 90 | 9.1% |
| $50,000 to $74,999 | 245 | 24.8% |
| $75,000 to $99,999 | 85 | 8.6% |
| $100,000 to $149,999 | 321 | 32.5% |
| $150,000 to $199,999 | 142 | 14.4% |
| $200,000+ | 54 | 5.5% |
Family Income by Famaliy Size in Washoe Valley
4-person families (29 | 2.9%) account for the highest median family income in Washoe Valley with $193,125 per family, while 4-person families (29 | 2.9%) have the highest median income of $48,281 per family member.
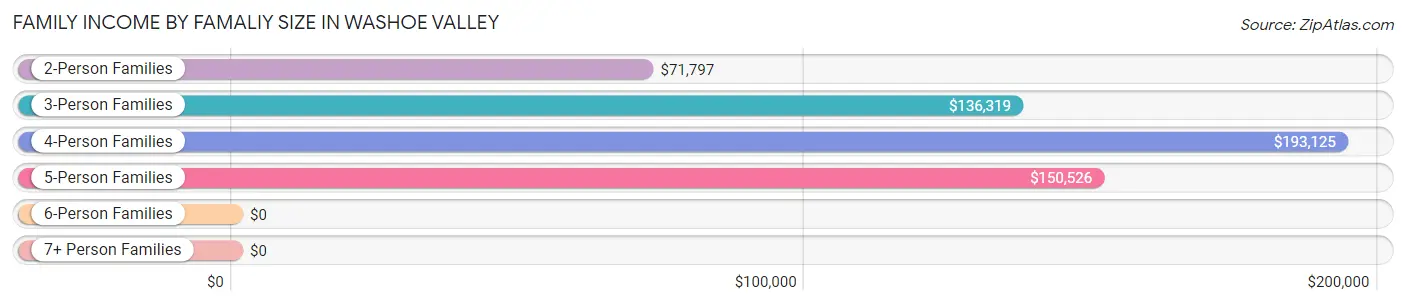
| Income Bracket | # Families | Median Income |
| 2-Person Families | 685 (69.3%) | $71,797 |
| 3-Person Families | 169 (17.1%) | $136,319 |
| 4-Person Families | 29 (2.9%) | $193,125 |
| 5-Person Families | 66 (6.7%) | $150,526 |
| 6-Person Families | 0 (0.0%) | $0 |
| 7+ Person Families | 40 (4.0%) | $0 |
| Total | 989 (100.0%) | $113,393 |
Family Income by Number of Earners in Washoe Valley
The median family income in Washoe Valley is $113,393, with families comprising 3+ earners (98) having the highest median family income of $194,500, while families with no earners (217) have the lowest median family income of $56,442, accounting for 9.9% and 21.9% of families, respectively.
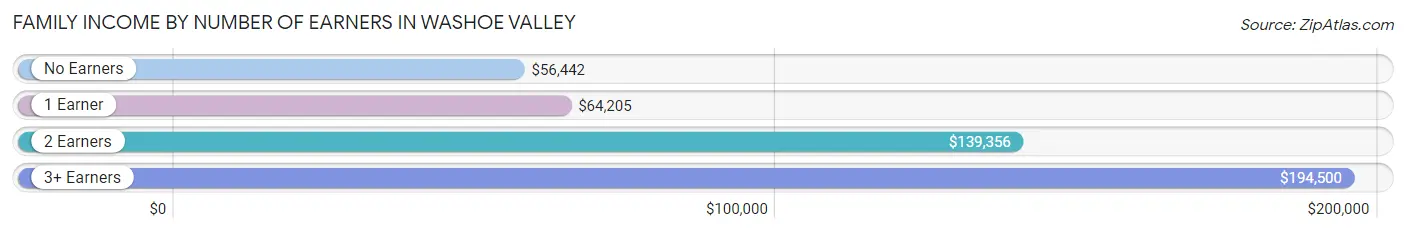
| Number of Earners | # Families | Median Income |
| No Earners | 217 (21.9%) | $56,442 |
| 1 Earner | 298 (30.1%) | $64,205 |
| 2 Earners | 376 (38.0%) | $139,356 |
| 3+ Earners | 98 (9.9%) | $194,500 |
| Total | 989 (100.0%) | $113,393 |
Household Income in Washoe Valley
Household Income Brackets in Washoe Valley
With 340 households falling in the category, the $100,000 to $149,999 income range is the most frequent in Washoe Valley, accounting for 26.2% of all households. In contrast, only 8 households (0.6%) fall into the less than $10,000 income bracket, making it the least populous group.
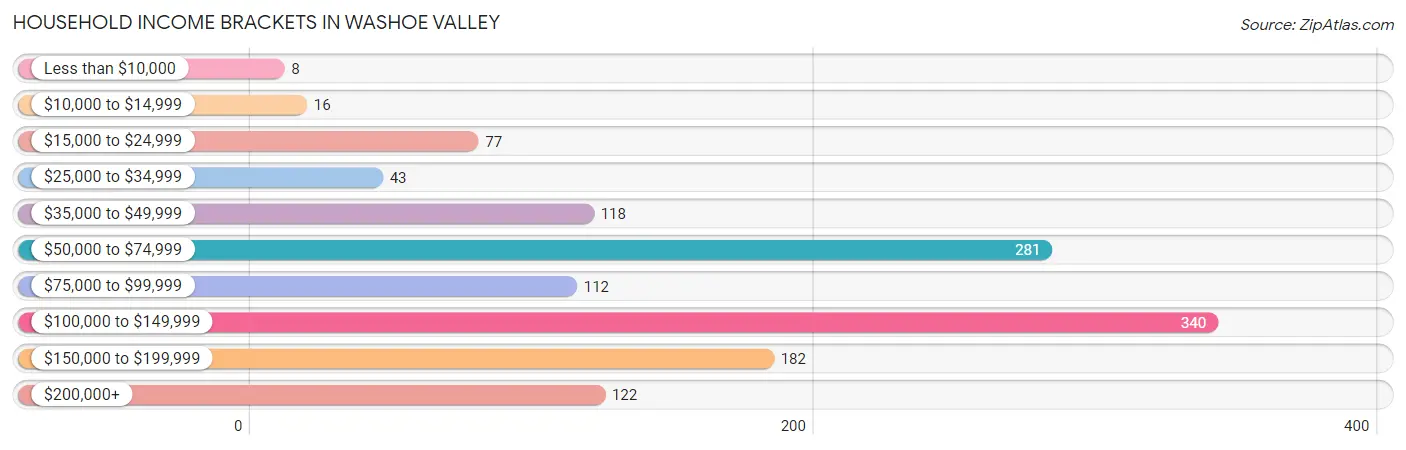
| Income Bracket | # Households | % Households |
| Less than $10,000 | 8 | 0.6% |
| $10,000 to $14,999 | 16 | 1.2% |
| $15,000 to $24,999 | 77 | 5.9% |
| $25,000 to $34,999 | 43 | 3.3% |
| $35,000 to $49,999 | 118 | 9.1% |
| $50,000 to $74,999 | 281 | 21.7% |
| $75,000 to $99,999 | 112 | 8.6% |
| $100,000 to $149,999 | 340 | 26.2% |
| $150,000 to $199,999 | 182 | 14.0% |
| $200,000+ | 122 | 9.4% |
Household Income by Householder Age in Washoe Valley
The median household income in Washoe Valley is $99,018, with the highest median household income of $142,589 found in the 45 to 64 years age bracket for the primary householder. A total of 338 households (26.1%) fall into this category. Meanwhile, the 15 to 24 years age bracket for the primary householder has the lowest median household income of $0, with 16 households (1.2%) in this group.
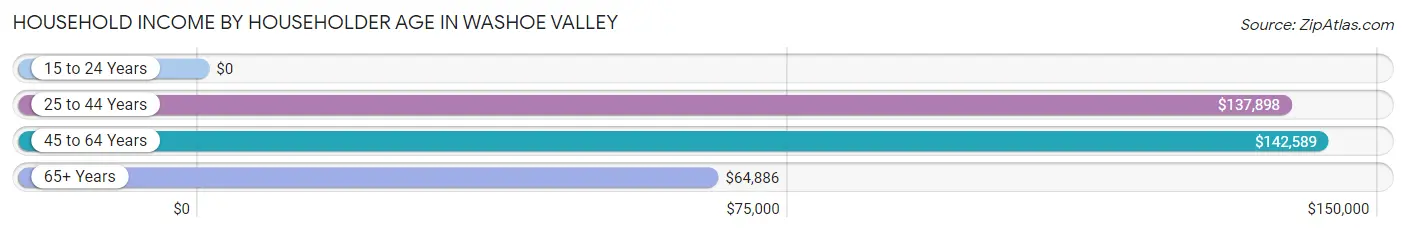
| Income Bracket | # Households | Median Income |
| 15 to 24 Years | 16 (1.2%) | $0 |
| 25 to 44 Years | 209 (16.1%) | $137,898 |
| 45 to 64 Years | 338 (26.1%) | $142,589 |
| 65+ Years | 734 (56.6%) | $64,886 |
| Total | 1,297 (100.0%) | $99,018 |
Poverty in Washoe Valley
Income Below Poverty by Sex and Age in Washoe Valley
With 2.1% poverty level for males and 5.5% for females among the residents of Washoe Valley, 18 to 24 year old males and 18 to 24 year old females are the most vulnerable to poverty, with 6 males (12.5%) and 16 females (26.2%) in their respective age groups living below the poverty level.
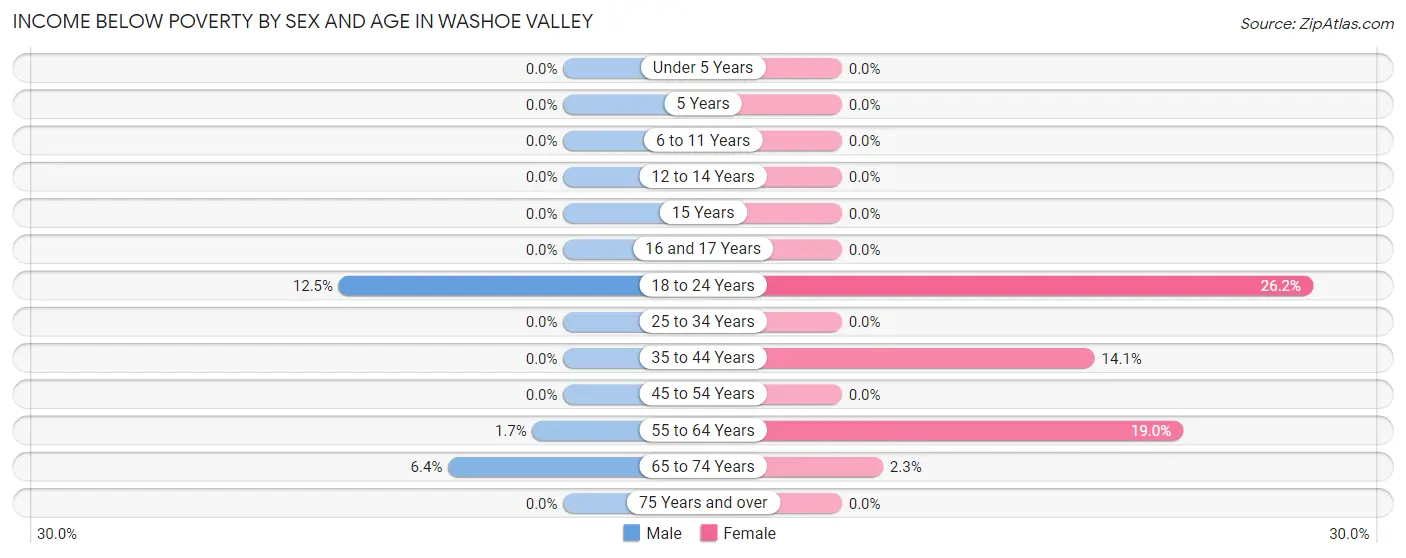
| Age Bracket | Male | Female |
| Under 5 Years | 0 (0.0%) | 0 (0.0%) |
| 5 Years | 0 (0.0%) | 0 (0.0%) |
| 6 to 11 Years | 0 (0.0%) | 0 (0.0%) |
| 12 to 14 Years | 0 (0.0%) | 0 (0.0%) |
| 15 Years | 0 (0.0%) | 0 (0.0%) |
| 16 and 17 Years | 0 (0.0%) | 0 (0.0%) |
| 18 to 24 Years | 6 (12.5%) | 16 (26.2%) |
| 25 to 34 Years | 0 (0.0%) | 0 (0.0%) |
| 35 to 44 Years | 0 (0.0%) | 20 (14.1%) |
| 45 to 54 Years | 0 (0.0%) | 0 (0.0%) |
| 55 to 64 Years | 8 (1.7%) | 38 (19.0%) |
| 65 to 74 Years | 22 (6.4%) | 8 (2.3%) |
| 75 Years and over | 0 (0.0%) | 0 (0.0%) |
| Total | 36 (2.1%) | 82 (5.5%) |
Income Above Poverty by Sex and Age in Washoe Valley
According to the poverty statistics in Washoe Valley, males aged under 5 years and females aged 6 to 11 years are the age groups that are most secure financially, with 100.0% of males and 100.0% of females in these age groups living above the poverty line.
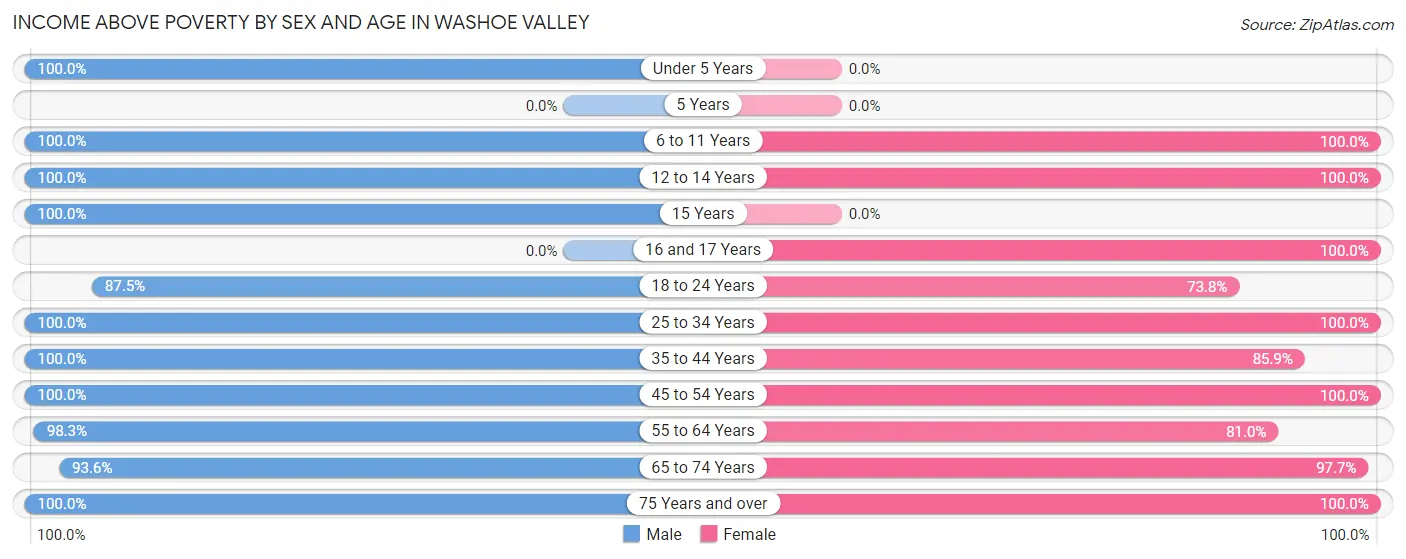
| Age Bracket | Male | Female |
| Under 5 Years | 98 (100.0%) | 0 (0.0%) |
| 5 Years | 0 (0.0%) | 0 (0.0%) |
| 6 to 11 Years | 66 (100.0%) | 42 (100.0%) |
| 12 to 14 Years | 10 (100.0%) | 33 (100.0%) |
| 15 Years | 11 (100.0%) | 0 (0.0%) |
| 16 and 17 Years | 0 (0.0%) | 51 (100.0%) |
| 18 to 24 Years | 42 (87.5%) | 45 (73.8%) |
| 25 to 34 Years | 273 (100.0%) | 79 (100.0%) |
| 35 to 44 Years | 156 (100.0%) | 122 (85.9%) |
| 45 to 54 Years | 143 (100.0%) | 208 (100.0%) |
| 55 to 64 Years | 459 (98.3%) | 162 (81.0%) |
| 65 to 74 Years | 321 (93.6%) | 342 (97.7%) |
| 75 Years and over | 131 (100.0%) | 323 (100.0%) |
| Total | 1,710 (97.9%) | 1,407 (94.5%) |
Income Below Poverty Among Married-Couple Families in Washoe Valley
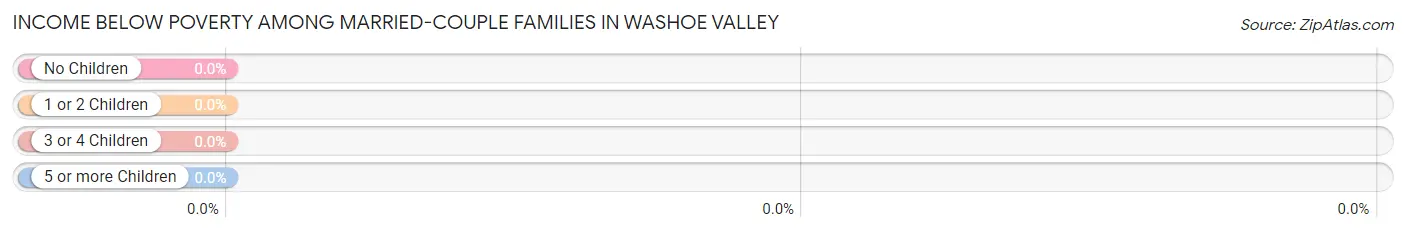
| Children | Above Poverty | Below Poverty |
| No Children | 438 (100.0%) | 0 (0.0%) |
| 1 or 2 Children | 96 (100.0%) | 0 (0.0%) |
| 3 or 4 Children | 37 (100.0%) | 0 (0.0%) |
| 5 or more Children | 0 (0.0%) | 0 (0.0%) |
| Total | 571 (100.0%) | 0 (0.0%) |
Income Below Poverty Among Single-Parent Households in Washoe Valley
| Children | Single Father | Single Mother |
| No Children | 0 (0.0%) | 0 (0.0%) |
| 1 or 2 Children | 0 (0.0%) | 0 (0.0%) |
| 3 or 4 Children | 0 (0.0%) | 0 (0.0%) |
| 5 or more Children | 0 (0.0%) | 0 (0.0%) |
| Total | 0 (0.0%) | 0 (0.0%) |
Income Below Poverty Among Married-Couple vs Single-Parent Households in Washoe Valley
| Children | Married-Couple Families | Single-Parent Households |
| No Children | 0 (0.0%) | 0 (0.0%) |
| 1 or 2 Children | 0 (0.0%) | 0 (0.0%) |
| 3 or 4 Children | 0 (0.0%) | 0 (0.0%) |
| 5 or more Children | 0 (0.0%) | 0 (0.0%) |
| Total | 0 (0.0%) | 0 (0.0%) |
Race in Washoe Valley
The most populous races in Washoe Valley are White / Caucasian (2,832 | 87.5%), Two or more Races (363 | 11.2%), and Hispanic or Latino (89 | 2.8%).
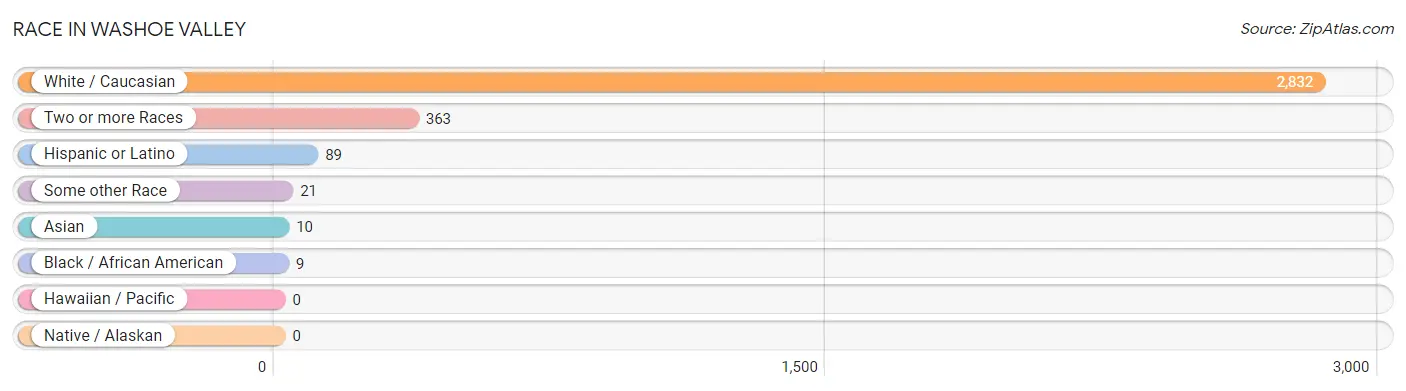
| Race | # Population | % Population |
| Asian | 10 | 0.3% |
| Black / African American | 9 | 0.3% |
| Hawaiian / Pacific | 0 | 0.0% |
| Hispanic or Latino | 89 | 2.8% |
| Native / Alaskan | 0 | 0.0% |
| White / Caucasian | 2,832 | 87.5% |
| Two or more Races | 363 | 11.2% |
| Some other Race | 21 | 0.6% |
| Total | 3,235 | 100.0% |
Ancestry in Washoe Valley
The most populous ancestries reported in Washoe Valley are English (732 | 22.6%), Irish (594 | 18.4%), German (487 | 15.0%), Italian (417 | 12.9%), and Dutch (408 | 12.6%), together accounting for 81.5% of all Washoe Valley residents.
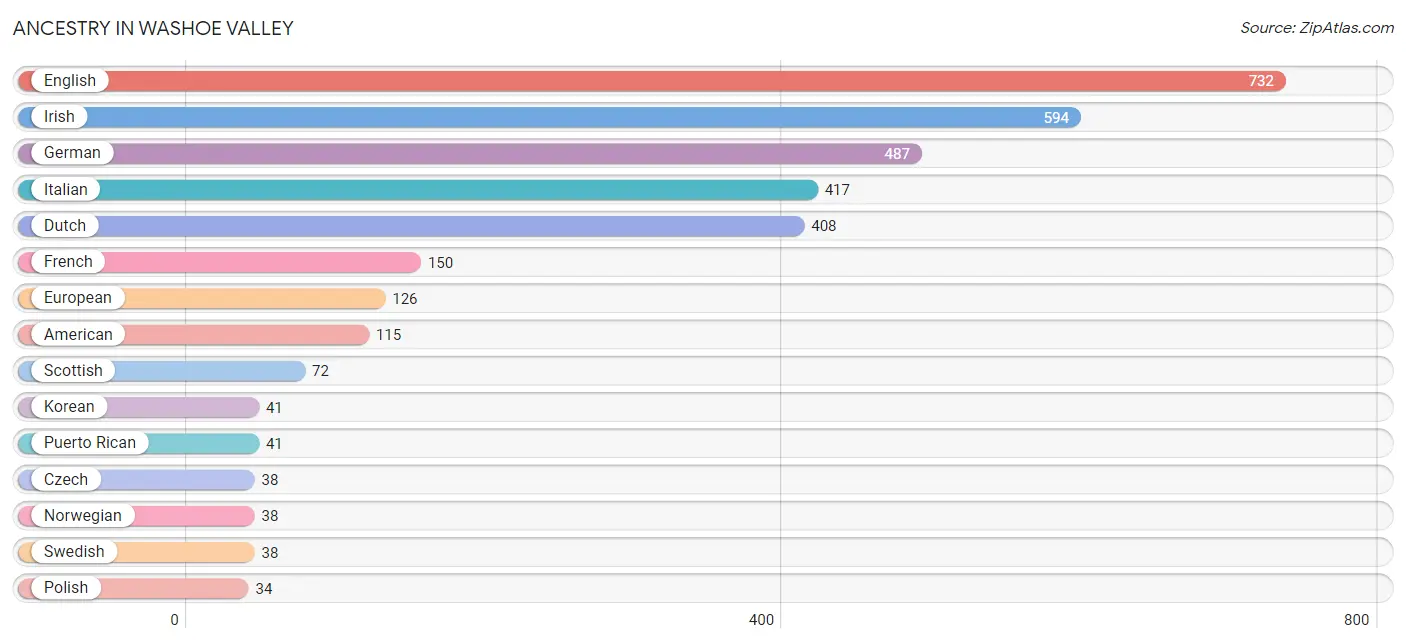
| Ancestry | # Population | % Population |
| American | 115 | 3.5% |
| Australian | 9 | 0.3% |
| Basque | 9 | 0.3% |
| Bhutanese | 23 | 0.7% |
| British | 12 | 0.4% |
| Burmese | 23 | 0.7% |
| Cambodian | 10 | 0.3% |
| Canadian | 7 | 0.2% |
| Cherokee | 21 | 0.6% |
| Chickasaw | 7 | 0.2% |
| Creek | 5 | 0.2% |
| Croatian | 9 | 0.3% |
| Czech | 38 | 1.2% |
| Danish | 25 | 0.8% |
| Dutch | 408 | 12.6% |
| English | 732 | 22.6% |
| European | 126 | 3.9% |
| French | 150 | 4.6% |
| German | 487 | 15.0% |
| Greek | 18 | 0.6% |
| Indian (Asian) | 31 | 1.0% |
| Irish | 594 | 18.4% |
| Italian | 417 | 12.9% |
| Korean | 41 | 1.3% |
| Mexican | 29 | 0.9% |
| Native Hawaiian | 31 | 1.0% |
| Nigerian | 25 | 0.8% |
| Norwegian | 38 | 1.2% |
| Polish | 34 | 1.1% |
| Portuguese | 23 | 0.7% |
| Potawatomi | 34 | 1.1% |
| Puerto Rican | 41 | 1.3% |
| Scottish | 72 | 2.2% |
| Sioux | 20 | 0.6% |
| Sri Lankan | 9 | 0.3% |
| Subsaharan African | 25 | 0.8% |
| Swedish | 38 | 1.2% |
| Swiss | 14 | 0.4% |
| Welsh | 13 | 0.4% | View All 39 Rows |
Immigrants in Washoe Valley
The most numerous immigrant groups reported in Washoe Valley came from Europe (29 | 0.9%), Czechoslovakia (15 | 0.5%), Eastern Europe (15 | 0.5%), Denmark (14 | 0.4%), and Northern Europe (14 | 0.4%), together accounting for 2.7% of all Washoe Valley residents.
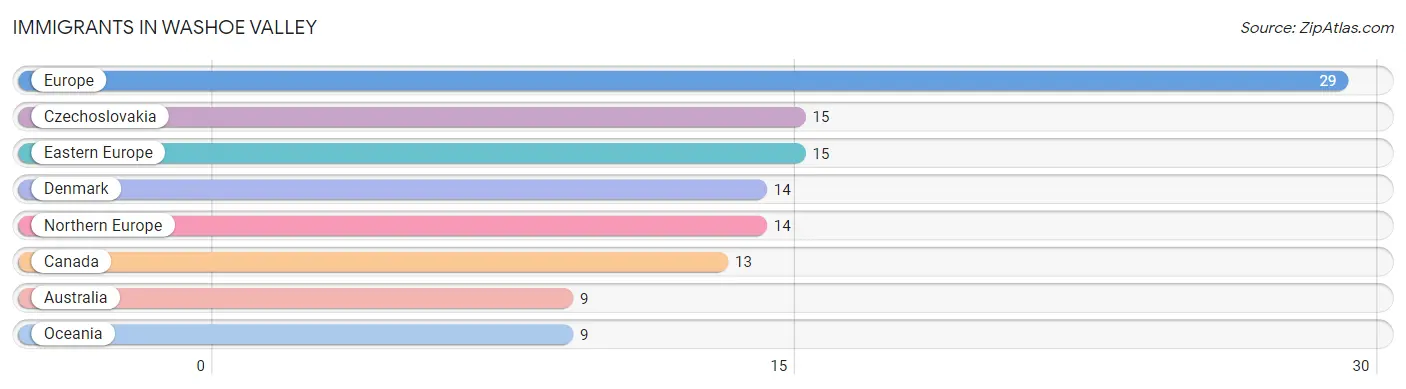
| Immigration Origin | # Population | % Population |
| Australia | 9 | 0.3% |
| Canada | 13 | 0.4% |
| Czechoslovakia | 15 | 0.5% |
| Denmark | 14 | 0.4% |
| Eastern Europe | 15 | 0.5% |
| Europe | 29 | 0.9% |
| Northern Europe | 14 | 0.4% |
| Oceania | 9 | 0.3% | View All 8 Rows |
Sex and Age in Washoe Valley
Sex and Age in Washoe Valley
The most populous age groups in Washoe Valley are 55 to 59 Years (370 | 21.2%) for men and 65 to 69 Years (261 | 17.5%) for women.
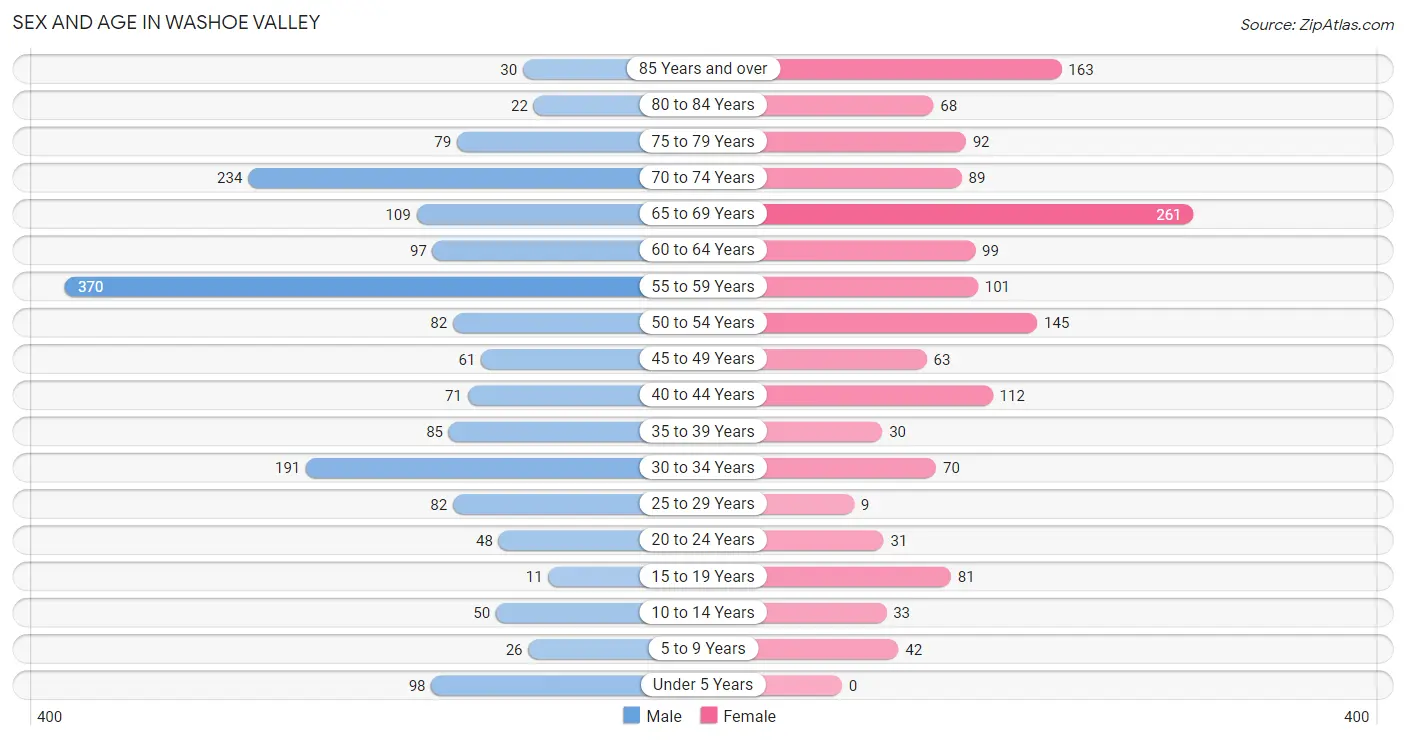
| Age Bracket | Male | Female |
| Under 5 Years | 98 (5.6%) | 0 (0.0%) |
| 5 to 9 Years | 26 (1.5%) | 42 (2.8%) |
| 10 to 14 Years | 50 (2.9%) | 33 (2.2%) |
| 15 to 19 Years | 11 (0.6%) | 81 (5.4%) |
| 20 to 24 Years | 48 (2.8%) | 31 (2.1%) |
| 25 to 29 Years | 82 (4.7%) | 9 (0.6%) |
| 30 to 34 Years | 191 (10.9%) | 70 (4.7%) |
| 35 to 39 Years | 85 (4.9%) | 30 (2.0%) |
| 40 to 44 Years | 71 (4.1%) | 112 (7.5%) |
| 45 to 49 Years | 61 (3.5%) | 63 (4.2%) |
| 50 to 54 Years | 82 (4.7%) | 145 (9.7%) |
| 55 to 59 Years | 370 (21.2%) | 101 (6.8%) |
| 60 to 64 Years | 97 (5.6%) | 99 (6.7%) |
| 65 to 69 Years | 109 (6.2%) | 261 (17.5%) |
| 70 to 74 Years | 234 (13.4%) | 89 (6.0%) |
| 75 to 79 Years | 79 (4.5%) | 92 (6.2%) |
| 80 to 84 Years | 22 (1.3%) | 68 (4.6%) |
| 85 Years and over | 30 (1.7%) | 163 (11.0%) |
| Total | 1,746 (100.0%) | 1,489 (100.0%) |
Families and Households in Washoe Valley
Median Family Size in Washoe Valley
The median family size in Washoe Valley is 2.78 persons per family, with single female/mother families (302 | 30.5%) accounting for the largest median family size of 3.32 persons per family. On the other hand, single male/father families (116 | 11.7%) represent the smallest median family size with 2.33 persons per family.
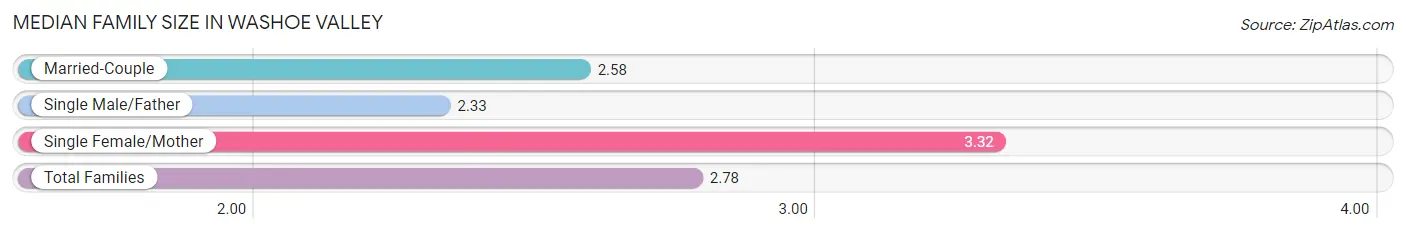
| Family Type | # Families | Family Size |
| Married-Couple | 571 (57.7%) | 2.58 |
| Single Male/Father | 116 (11.7%) | 2.33 |
| Single Female/Mother | 302 (30.5%) | 3.32 |
| Total Families | 989 (100.0%) | 2.78 |
Median Household Size in Washoe Valley
The median household size in Washoe Valley is 2.49 persons per household, with single female/mother households (302 | 23.3%) accounting for the largest median household size of 3.32 persons per household. non-family households (308 | 23.7%) represent the smallest median household size with 1.47 persons per household.
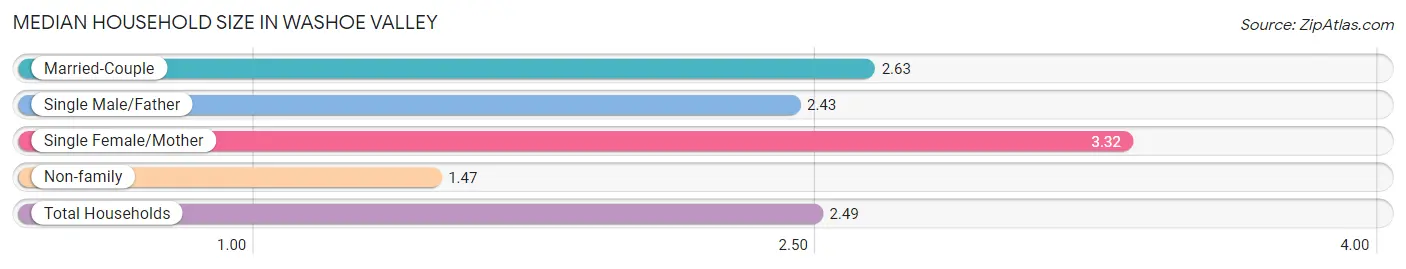
| Household Type | # Households | Household Size |
| Married-Couple | 571 (44.0%) | 2.63 |
| Single Male/Father | 116 (8.9%) | 2.43 |
| Single Female/Mother | 302 (23.3%) | 3.32 |
| Non-family | 308 (23.7%) | 1.47 |
| Total Households | 1,297 (100.0%) | 2.49 |
Household Size by Marriage Status in Washoe Valley
Out of a total of 1,297 households in Washoe Valley, 989 (76.2%) are family households, while 308 (23.7%) are nonfamily households. The most numerous type of family households are 2-person households, comprising 678, and the most common type of nonfamily households are 1-person households, comprising 197.
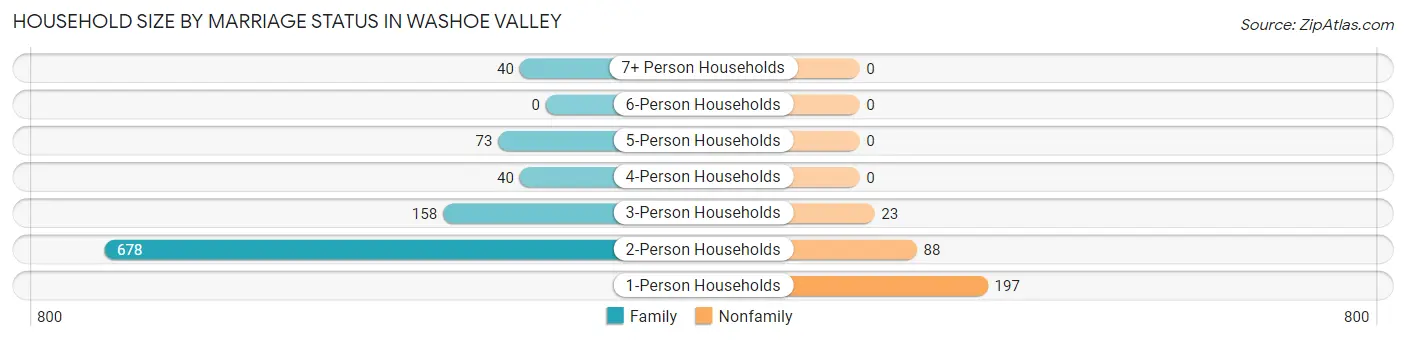
| Household Size | Family Households | Nonfamily Households |
| 1-Person Households | - | 197 (15.2%) |
| 2-Person Households | 678 (52.3%) | 88 (6.8%) |
| 3-Person Households | 158 (12.2%) | 23 (1.8%) |
| 4-Person Households | 40 (3.1%) | 0 (0.0%) |
| 5-Person Households | 73 (5.6%) | 0 (0.0%) |
| 6-Person Households | 0 (0.0%) | 0 (0.0%) |
| 7+ Person Households | 40 (3.1%) | 0 (0.0%) |
| Total | 989 (76.2%) | 308 (23.7%) |
Female Fertility in Washoe Valley
Fertility by Age in Washoe Valley
Average fertility rate in Washoe Valley is 121.0 births per 1,000 women. Women in the age bracket of 20 to 34 years have the highest fertility rate with 173.0 births per 1,000 women. Women in the age bracket of 35 to 50 years acount for 62.7% of all women with births.
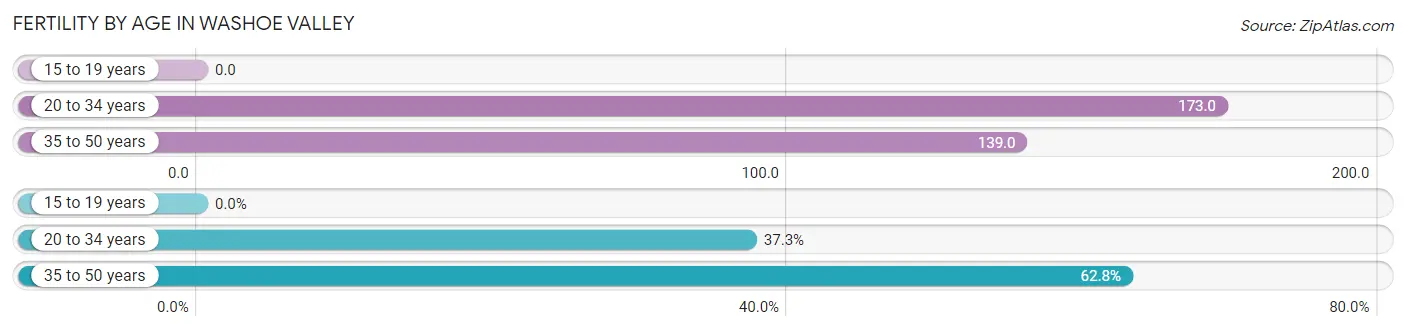
| Age Bracket | Women with Births | Births / 1,000 Women |
| 15 to 19 years | 0 (0.0%) | 0.0 |
| 20 to 34 years | 19 (37.2%) | 173.0 |
| 35 to 50 years | 32 (62.7%) | 139.0 |
| Total | 51 (100.0%) | 121.0 |
Fertility by Age by Marriage Status in Washoe Valley
60.8% of women with births (51) in Washoe Valley are married. The highest percentage of unmarried women with births falls into 35 to 50 years age bracket with 62.5% of them unmarried at the time of birth, while the lowest percentage of unmarried women with births belong to 20 to 34 years age bracket with 0.0% of them unmarried.
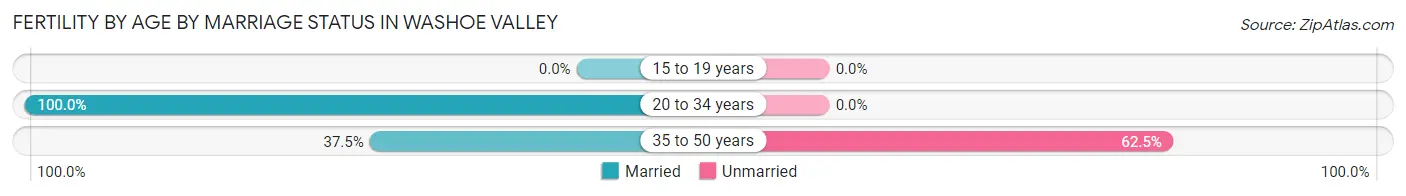
| Age Bracket | Married | Unmarried |
| 15 to 19 years | 0 (0.0%) | 0 (0.0%) |
| 20 to 34 years | 19 (100.0%) | 0 (0.0%) |
| 35 to 50 years | 12 (37.5%) | 20 (62.5%) |
| Total | 31 (60.8%) | 20 (39.2%) |
Fertility by Education in Washoe Valley
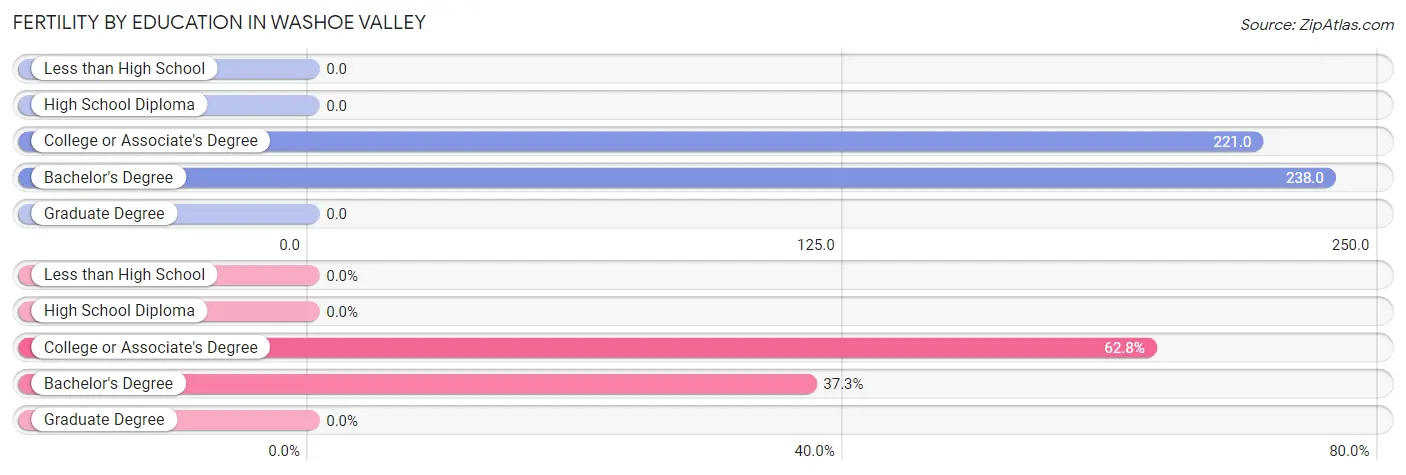
| Educational Attainment | Women with Births | Births / 1,000 Women |
| Less than High School | 0 (0.0%) | 0.0 |
| High School Diploma | 0 (0.0%) | 0.0 |
| College or Associate's Degree | 32 (62.7%) | 221.0 |
| Bachelor's Degree | 19 (37.2%) | 238.0 |
| Graduate Degree | 0 (0.0%) | 0.0 |
| Total | 51 (100.0%) | 121.0 |
Fertility by Education by Marriage Status in Washoe Valley
39.2% of women with births in Washoe Valley are unmarried. Women with the educational attainment of bachelor's degree are most likely to be married with 100.0% of them married at childbirth, while women with the educational attainment of college or associate's degree are least likely to be married with 62.5% of them unmarried at childbirth.
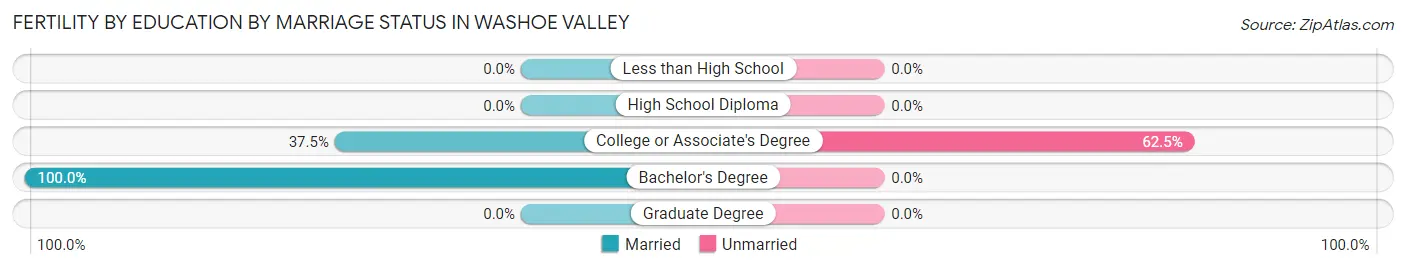
| Educational Attainment | Married | Unmarried |
| Less than High School | 0 (0.0%) | 0 (0.0%) |
| High School Diploma | 0 (0.0%) | 0 (0.0%) |
| College or Associate's Degree | 12 (37.5%) | 20 (62.5%) |
| Bachelor's Degree | 19 (100.0%) | 0 (0.0%) |
| Graduate Degree | 0 (0.0%) | 0 (0.0%) |
| Total | 31 (60.8%) | 20 (39.2%) |
Employment Characteristics in Washoe Valley
Employment by Class of Employer in Washoe Valley
Among the 1,427 employed individuals in Washoe Valley, private company employees (1,057 | 74.1%), local government employees (110 | 7.7%), and self-employed (not incorporated) (77 | 5.4%) make up the most common classes of employment.
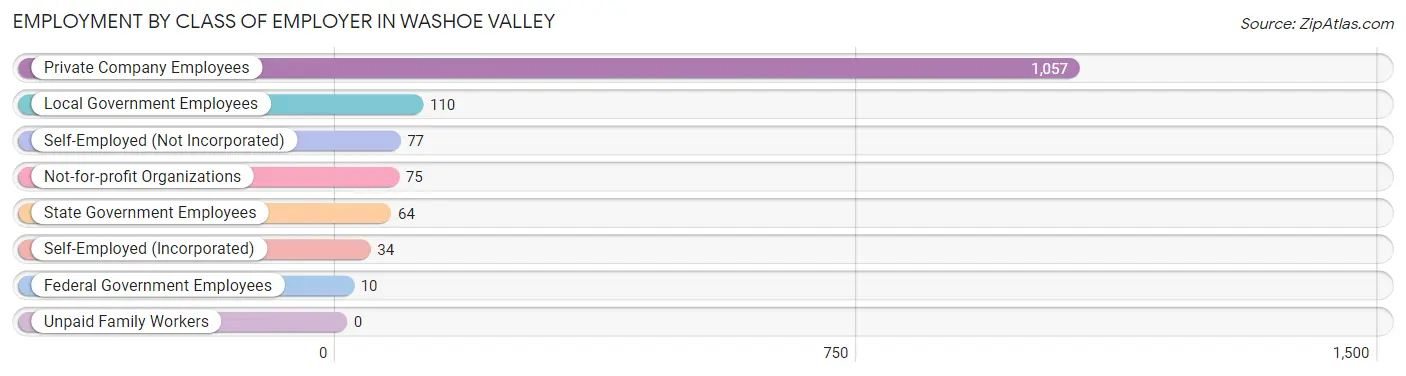
| Employer Class | # Employees | % Employees |
| Private Company Employees | 1,057 | 74.1% |
| Self-Employed (Incorporated) | 34 | 2.4% |
| Self-Employed (Not Incorporated) | 77 | 5.4% |
| Not-for-profit Organizations | 75 | 5.3% |
| Local Government Employees | 110 | 7.7% |
| State Government Employees | 64 | 4.5% |
| Federal Government Employees | 10 | 0.7% |
| Unpaid Family Workers | 0 | 0.0% |
| Total | 1,427 | 100.0% |
Employment Status by Age in Washoe Valley
According to the labor force statistics for Washoe Valley, out of the total population over 16 years of age (2,975), 52.7% or 1,568 individuals are in the labor force, with 4.8% or 75 of them unemployed. The age group with the highest labor force participation rate is 25 to 29 years, with 100.0% or 91 individuals in the labor force. Within the labor force, the 45 to 54 years age range has the highest percentage of unemployed individuals, with 8.9% or 26 of them being unemployed.
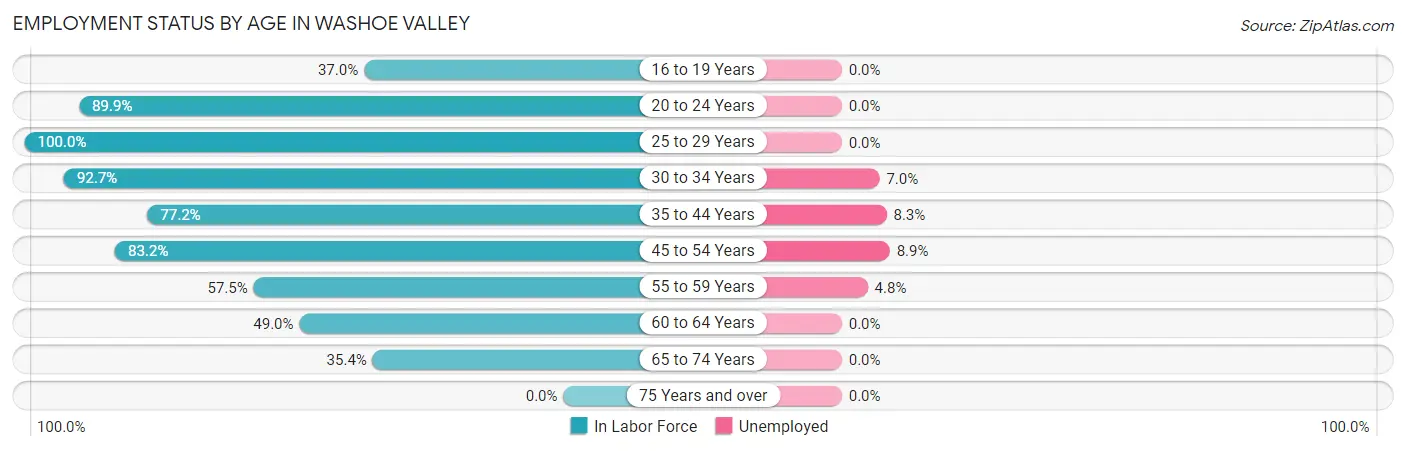
| Age Bracket | In Labor Force | Unemployed |
| 16 to 19 Years | 30 (37.0%) | 0 (0.0%) |
| 20 to 24 Years | 71 (89.9%) | 0 (0.0%) |
| 25 to 29 Years | 91 (100.0%) | 0 (0.0%) |
| 30 to 34 Years | 242 (92.7%) | 17 (7.0%) |
| 35 to 44 Years | 230 (77.2%) | 19 (8.3%) |
| 45 to 54 Years | 292 (83.2%) | 26 (8.9%) |
| 55 to 59 Years | 271 (57.5%) | 13 (4.8%) |
| 60 to 64 Years | 96 (49.0%) | 0 (0.0%) |
| 65 to 74 Years | 245 (35.4%) | 0 (0.0%) |
| 75 Years and over | 0 (0.0%) | 0 (0.0%) |
| Total | 1,568 (52.7%) | 75 (4.8%) |
Employment Status by Educational Attainment in Washoe Valley
According to labor force statistics for Washoe Valley, 73.3% of individuals (1,223) out of the total population between 25 and 64 years of age (1,668) are in the labor force, with 6.1% or 75 of them being unemployed. The group with the highest labor force participation rate are those with the educational attainment of high school diploma, with 92.2% or 400 individuals in the labor force. Within the labor force, individuals with bachelor's degree or higher education have the highest percentage of unemployment, with 10.7% or 32 of them being unemployed.
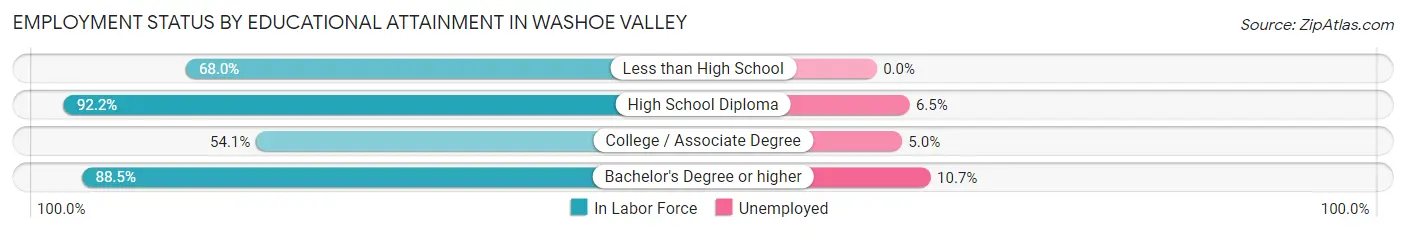
| Educational Attainment | In Labor Force | Unemployed |
| Less than High School | 185 (68.0%) | 0 (0.0%) |
| High School Diploma | 400 (92.2%) | 28 (6.5%) |
| College / Associate Degree | 337 (54.1%) | 31 (5.0%) |
| Bachelor's Degree or higher | 300 (88.5%) | 36 (10.7%) |
| Total | 1,223 (73.3%) | 102 (6.1%) |
Employment Occupations by Sex in Washoe Valley
Management, Business, Science and Arts Occupations
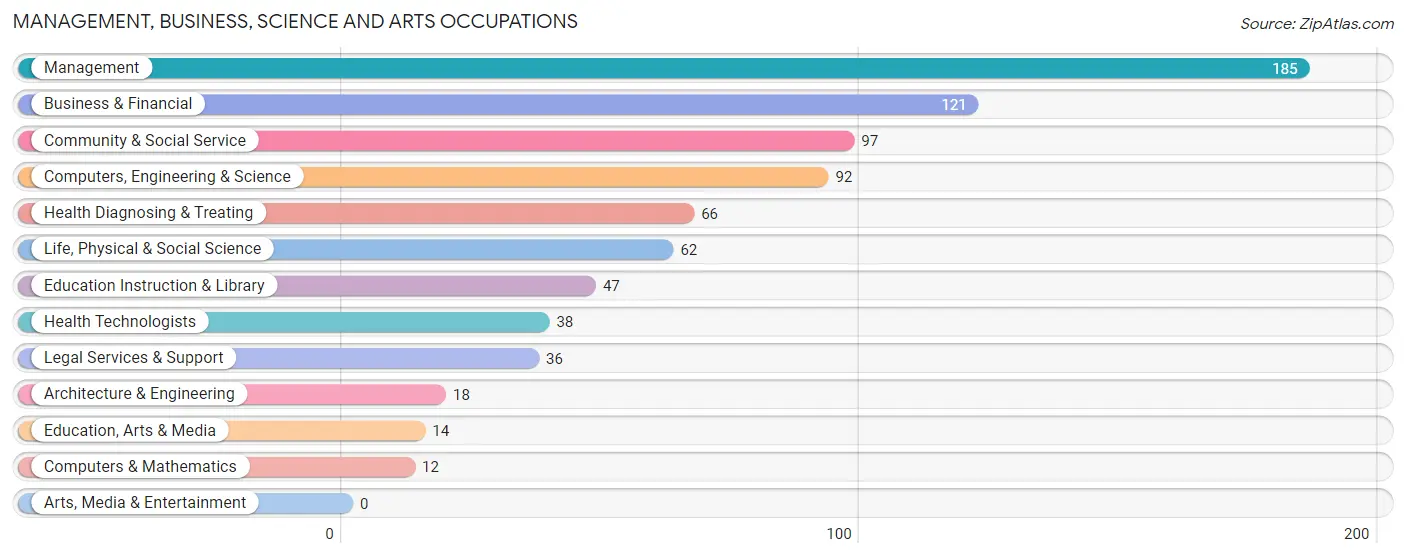
The most common Management, Business, Science and Arts occupations in Washoe Valley are Management (185 | 12.4%), Business & Financial (121 | 8.1%), Community & Social Service (97 | 6.5%), Computers, Engineering & Science (92 | 6.2%), and Health Diagnosing & Treating (66 | 4.4%).
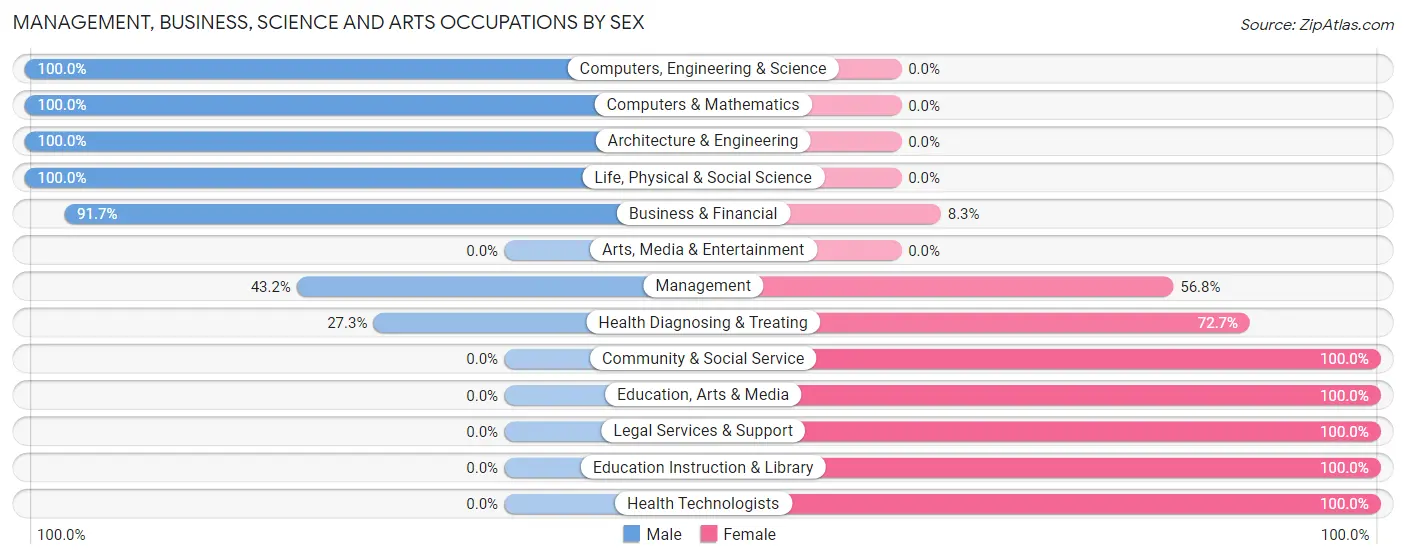
Management, Business, Science and Arts Occupations by Sex
Within the Management, Business, Science and Arts occupations in Washoe Valley, the most male-oriented occupations are Computers, Engineering & Science (100.0%), Computers & Mathematics (100.0%), and Architecture & Engineering (100.0%), while the most female-oriented occupations are Community & Social Service (100.0%), Education, Arts & Media (100.0%), and Legal Services & Support (100.0%).
| Occupation | Male | Female |
| Management | 80 (43.2%) | 105 (56.8%) |
| Business & Financial | 111 (91.7%) | 10 (8.3%) |
| Computers, Engineering & Science | 92 (100.0%) | 0 (0.0%) |
| Computers & Mathematics | 12 (100.0%) | 0 (0.0%) |
| Architecture & Engineering | 18 (100.0%) | 0 (0.0%) |
| Life, Physical & Social Science | 62 (100.0%) | 0 (0.0%) |
| Community & Social Service | 0 (0.0%) | 97 (100.0%) |
| Education, Arts & Media | 0 (0.0%) | 14 (100.0%) |
| Legal Services & Support | 0 (0.0%) | 36 (100.0%) |
| Education Instruction & Library | 0 (0.0%) | 47 (100.0%) |
| Arts, Media & Entertainment | 0 (0.0%) | 0 (0.0%) |
| Health Diagnosing & Treating | 18 (27.3%) | 48 (72.7%) |
| Health Technologists | 0 (0.0%) | 38 (100.0%) |
| Total (Category) | 301 (53.6%) | 260 (46.4%) |
| Total (Overall) | 987 (66.1%) | 506 (33.9%) |
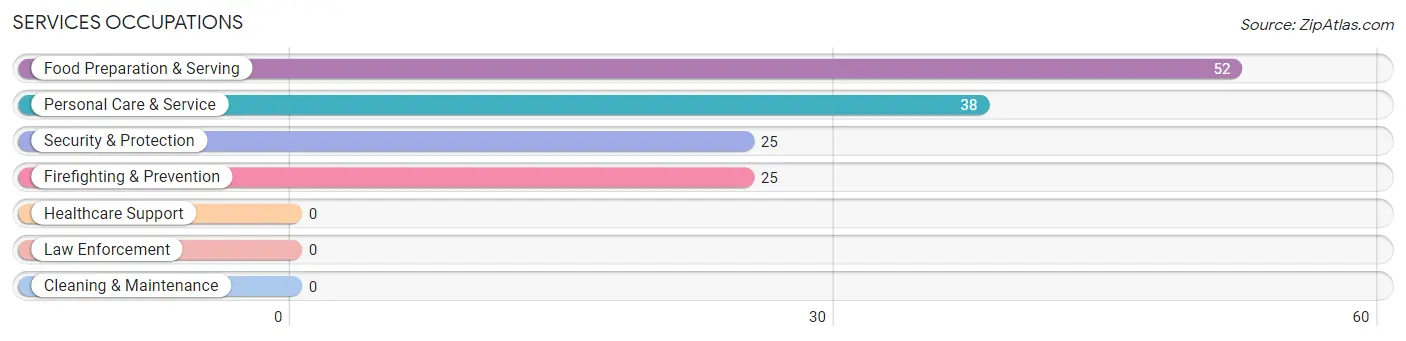
Services Occupations
The most common Services occupations in Washoe Valley are Food Preparation & Serving (52 | 3.5%), Personal Care & Service (38 | 2.5%), Security & Protection (25 | 1.7%), and Firefighting & Prevention (25 | 1.7%).
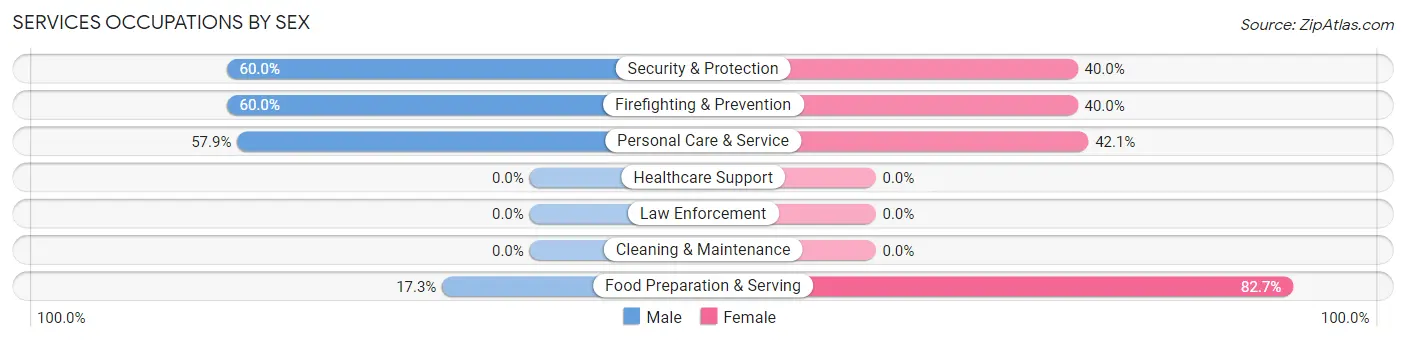
Services Occupations by Sex
Within the Services occupations in Washoe Valley, the most male-oriented occupations are Security & Protection (60.0%), Firefighting & Prevention (60.0%), and Personal Care & Service (57.9%), while the most female-oriented occupations are Food Preparation & Serving (82.7%), Personal Care & Service (42.1%), and Security & Protection (40.0%).
| Occupation | Male | Female |
| Healthcare Support | 0 (0.0%) | 0 (0.0%) |
| Security & Protection | 15 (60.0%) | 10 (40.0%) |
| Firefighting & Prevention | 15 (60.0%) | 10 (40.0%) |
| Law Enforcement | 0 (0.0%) | 0 (0.0%) |
| Food Preparation & Serving | 9 (17.3%) | 43 (82.7%) |
| Cleaning & Maintenance | 0 (0.0%) | 0 (0.0%) |
| Personal Care & Service | 22 (57.9%) | 16 (42.1%) |
| Total (Category) | 46 (40.0%) | 69 (60.0%) |
| Total (Overall) | 987 (66.1%) | 506 (33.9%) |
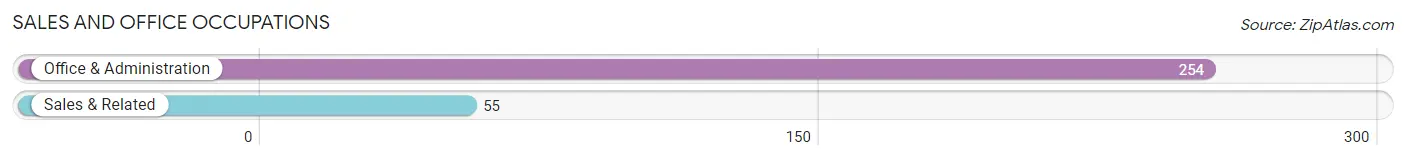
Sales and Office Occupations
The most common Sales and Office occupations in Washoe Valley are Office & Administration (254 | 17.0%), and Sales & Related (55 | 3.7%).
Sales and Office Occupations by Sex
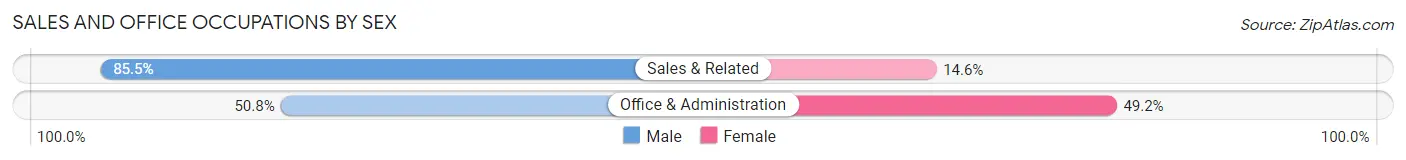
| Occupation | Male | Female |
| Sales & Related | 47 (85.5%) | 8 (14.5%) |
| Office & Administration | 129 (50.8%) | 125 (49.2%) |
| Total (Category) | 176 (57.0%) | 133 (43.0%) |
| Total (Overall) | 987 (66.1%) | 506 (33.9%) |
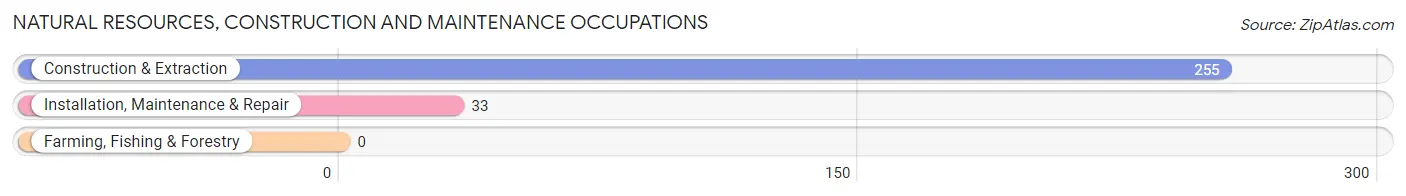
Natural Resources, Construction and Maintenance Occupations
The most common Natural Resources, Construction and Maintenance occupations in Washoe Valley are Construction & Extraction (255 | 17.1%), and Installation, Maintenance & Repair (33 | 2.2%).
Natural Resources, Construction and Maintenance Occupations by Sex
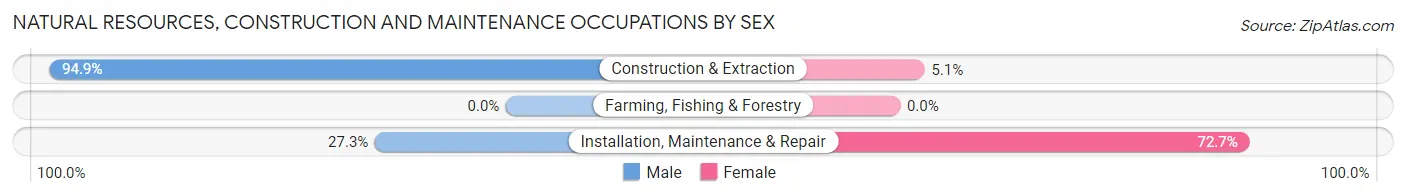
| Occupation | Male | Female |
| Farming, Fishing & Forestry | 0 (0.0%) | 0 (0.0%) |
| Construction & Extraction | 242 (94.9%) | 13 (5.1%) |
| Installation, Maintenance & Repair | 9 (27.3%) | 24 (72.7%) |
| Total (Category) | 251 (87.2%) | 37 (12.9%) |
| Total (Overall) | 987 (66.1%) | 506 (33.9%) |
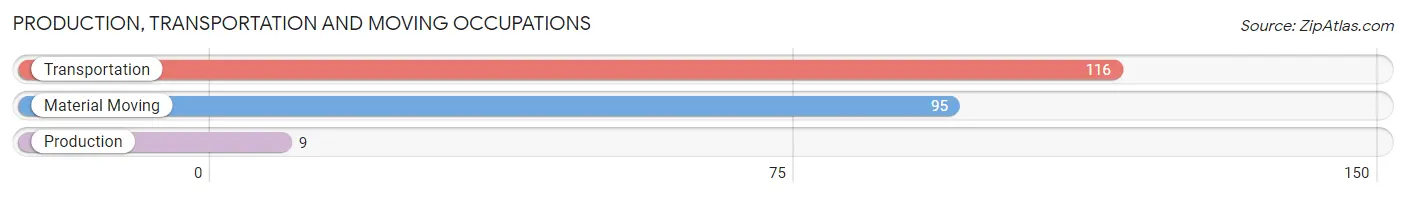
Production, Transportation and Moving Occupations
The most common Production, Transportation and Moving occupations in Washoe Valley are Transportation (116 | 7.8%), Material Moving (95 | 6.4%), and Production (9 | 0.6%).
Production, Transportation and Moving Occupations by Sex
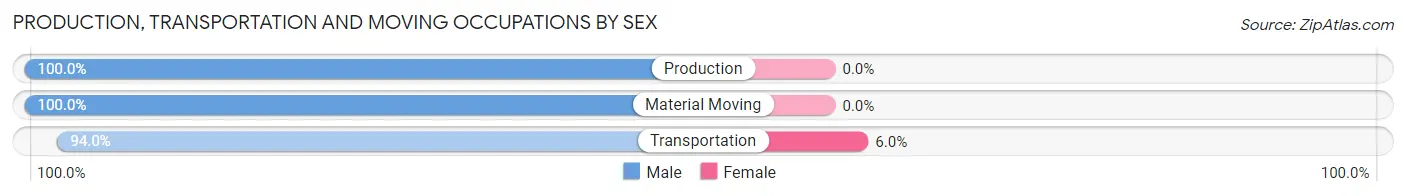
| Occupation | Male | Female |
| Production | 9 (100.0%) | 0 (0.0%) |
| Transportation | 109 (94.0%) | 7 (6.0%) |
| Material Moving | 95 (100.0%) | 0 (0.0%) |
| Total (Category) | 213 (96.8%) | 7 (3.2%) |
| Total (Overall) | 987 (66.1%) | 506 (33.9%) |
Employment Industries by Sex in Washoe Valley
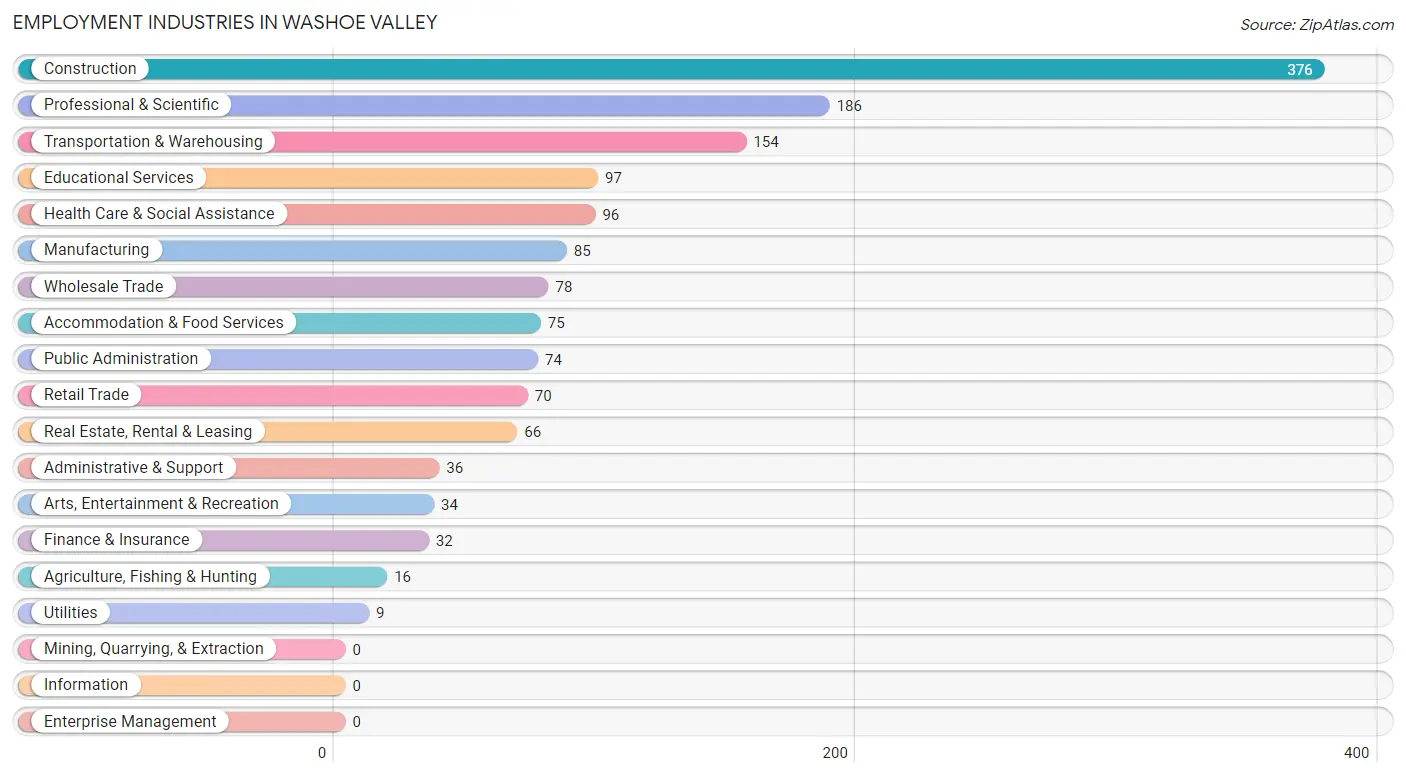
Employment Industries in Washoe Valley
The major employment industries in Washoe Valley include Construction (376 | 25.2%), Professional & Scientific (186 | 12.5%), Transportation & Warehousing (154 | 10.3%), Educational Services (97 | 6.5%), and Health Care & Social Assistance (96 | 6.4%).
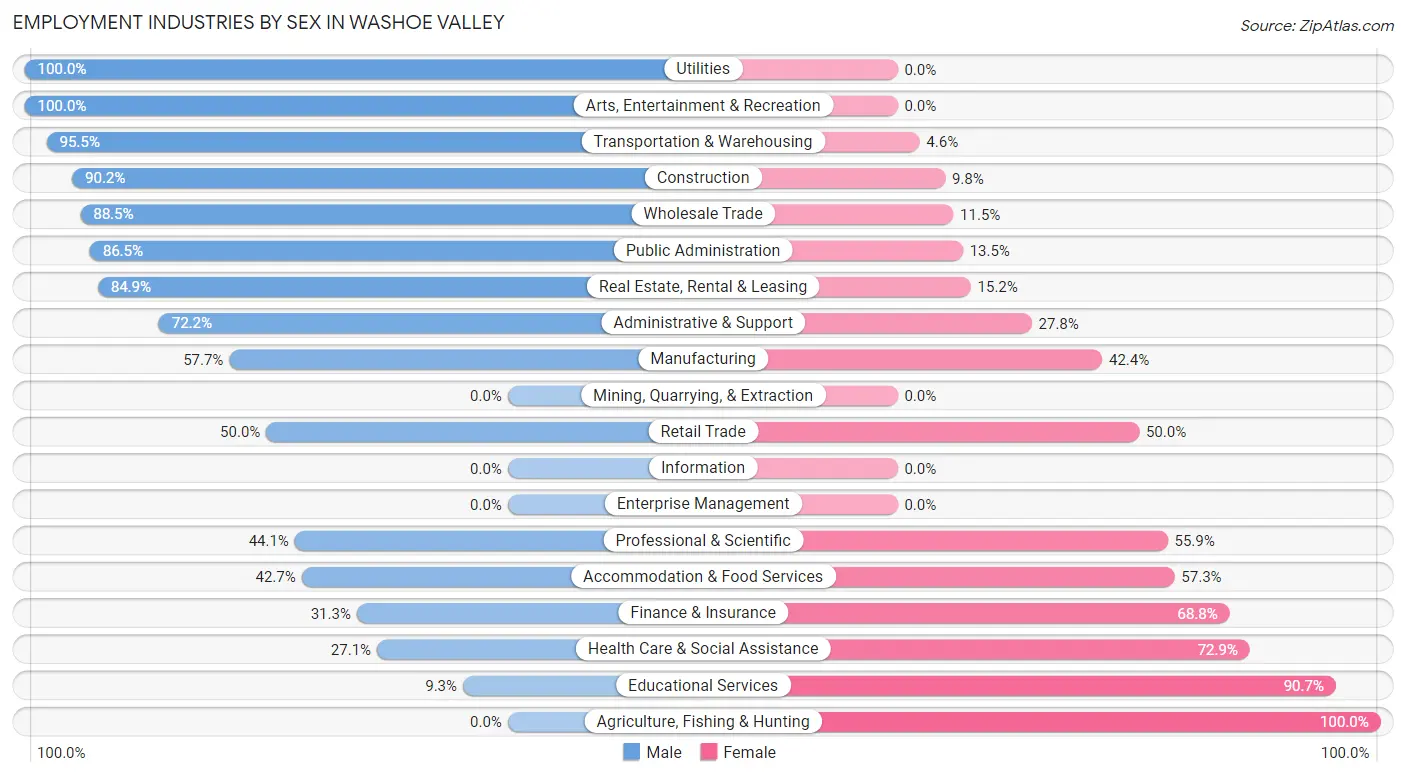
Employment Industries by Sex in Washoe Valley
The Washoe Valley industries that see more men than women are Utilities (100.0%), Arts, Entertainment & Recreation (100.0%), and Transportation & Warehousing (95.5%), whereas the industries that tend to have a higher number of women are Agriculture, Fishing & Hunting (100.0%), Educational Services (90.7%), and Health Care & Social Assistance (72.9%).
| Industry | Male | Female |
| Agriculture, Fishing & Hunting | 0 (0.0%) | 16 (100.0%) |
| Mining, Quarrying, & Extraction | 0 (0.0%) | 0 (0.0%) |
| Construction | 339 (90.2%) | 37 (9.8%) |
| Manufacturing | 49 (57.7%) | 36 (42.3%) |
| Wholesale Trade | 69 (88.5%) | 9 (11.5%) |
| Retail Trade | 35 (50.0%) | 35 (50.0%) |
| Transportation & Warehousing | 147 (95.5%) | 7 (4.5%) |
| Utilities | 9 (100.0%) | 0 (0.0%) |
| Information | 0 (0.0%) | 0 (0.0%) |
| Finance & Insurance | 10 (31.2%) | 22 (68.8%) |
| Real Estate, Rental & Leasing | 56 (84.9%) | 10 (15.1%) |
| Professional & Scientific | 82 (44.1%) | 104 (55.9%) |
| Enterprise Management | 0 (0.0%) | 0 (0.0%) |
| Administrative & Support | 26 (72.2%) | 10 (27.8%) |
| Educational Services | 9 (9.3%) | 88 (90.7%) |
| Health Care & Social Assistance | 26 (27.1%) | 70 (72.9%) |
| Arts, Entertainment & Recreation | 34 (100.0%) | 0 (0.0%) |
| Accommodation & Food Services | 32 (42.7%) | 43 (57.3%) |
| Public Administration | 64 (86.5%) | 10 (13.5%) |
| Total | 987 (66.1%) | 506 (33.9%) |
Education in Washoe Valley
School Enrollment in Washoe Valley
The most common levels of schooling among the 291 students in Washoe Valley are middle school (73 | 25.1%), high school (72 | 24.7%), and elementary school (68 | 23.4%).
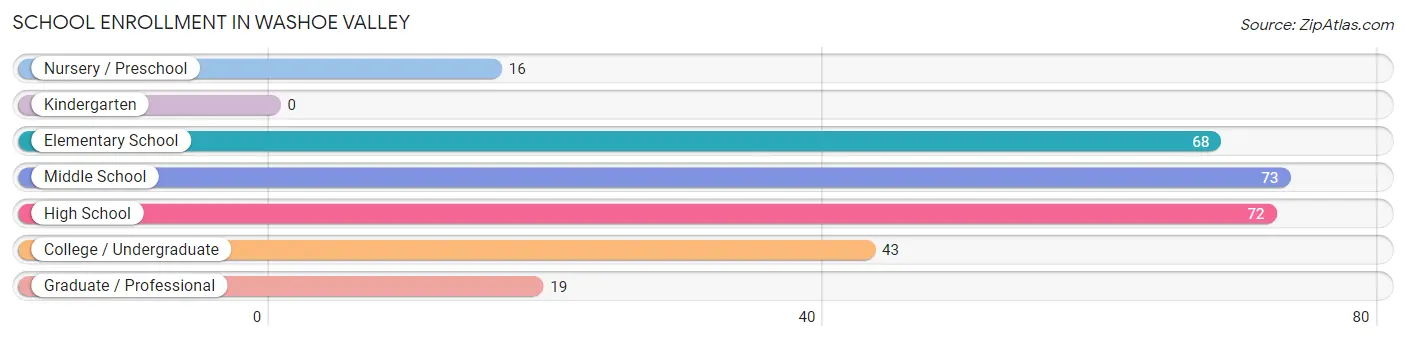
| School Level | # Students | % Students |
| Nursery / Preschool | 16 | 5.5% |
| Kindergarten | 0 | 0.0% |
| Elementary School | 68 | 23.4% |
| Middle School | 73 | 25.1% |
| High School | 72 | 24.7% |
| College / Undergraduate | 43 | 14.8% |
| Graduate / Professional | 19 | 6.5% |
| Total | 291 | 100.0% |
School Enrollment by Age by Funding Source in Washoe Valley
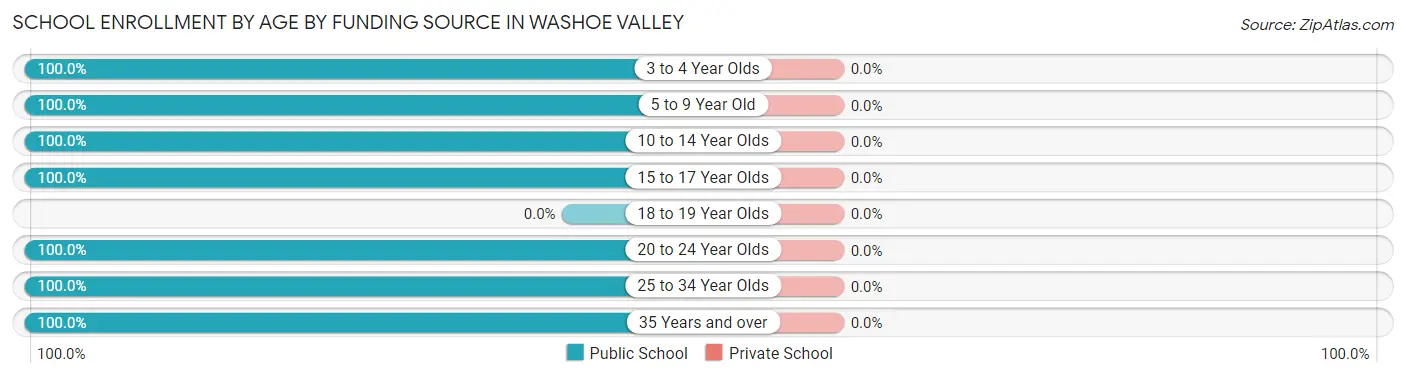
| Age Bracket | Public School | Private School |
| 3 to 4 Year Olds | 16 (100.0%) | 0 (0.0%) |
| 5 to 9 Year Old | 68 (100.0%) | 0 (0.0%) |
| 10 to 14 Year Olds | 83 (100.0%) | 0 (0.0%) |
| 15 to 17 Year Olds | 62 (100.0%) | 0 (0.0%) |
| 18 to 19 Year Olds | 0 (0.0%) | 0 (0.0%) |
| 20 to 24 Year Olds | 8 (100.0%) | 0 (0.0%) |
| 25 to 34 Year Olds | 37 (100.0%) | 0 (0.0%) |
| 35 Years and over | 17 (100.0%) | 0 (0.0%) |
| Total | 291 (100.0%) | 0 (0.0%) |
Educational Attainment by Field of Study in Washoe Valley
Bio, nature & agricultural (140 | 24.7%), literature & languages (69 | 12.2%), arts & humanities (64 | 11.3%), psychology (56 | 9.9%), and science & technology (52 | 9.2%) are the most common fields of study among 566 individuals in Washoe Valley who have obtained a bachelor's degree or higher.
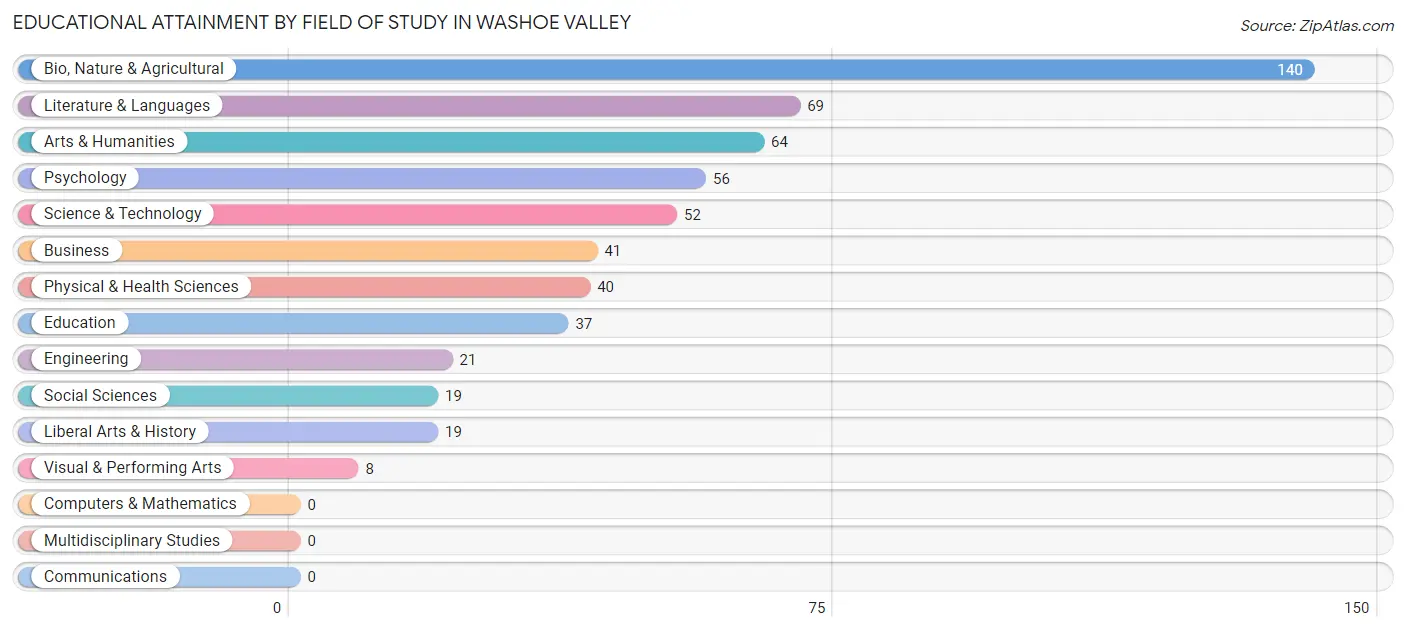
| Field of Study | # Graduates | % Graduates |
| Computers & Mathematics | 0 | 0.0% |
| Bio, Nature & Agricultural | 140 | 24.7% |
| Physical & Health Sciences | 40 | 7.1% |
| Psychology | 56 | 9.9% |
| Social Sciences | 19 | 3.4% |
| Engineering | 21 | 3.7% |
| Multidisciplinary Studies | 0 | 0.0% |
| Science & Technology | 52 | 9.2% |
| Business | 41 | 7.2% |
| Education | 37 | 6.5% |
| Literature & Languages | 69 | 12.2% |
| Liberal Arts & History | 19 | 3.4% |
| Visual & Performing Arts | 8 | 1.4% |
| Communications | 0 | 0.0% |
| Arts & Humanities | 64 | 11.3% |
| Total | 566 | 100.0% |
Transportation & Commute in Washoe Valley
Vehicle Availability by Sex in Washoe Valley
The most prevalent vehicle ownership categories in Washoe Valley are males with 5 or more vehicles (220, accounting for 23.9%) and females with 5 or more vehicles (75, making up 43.5%).
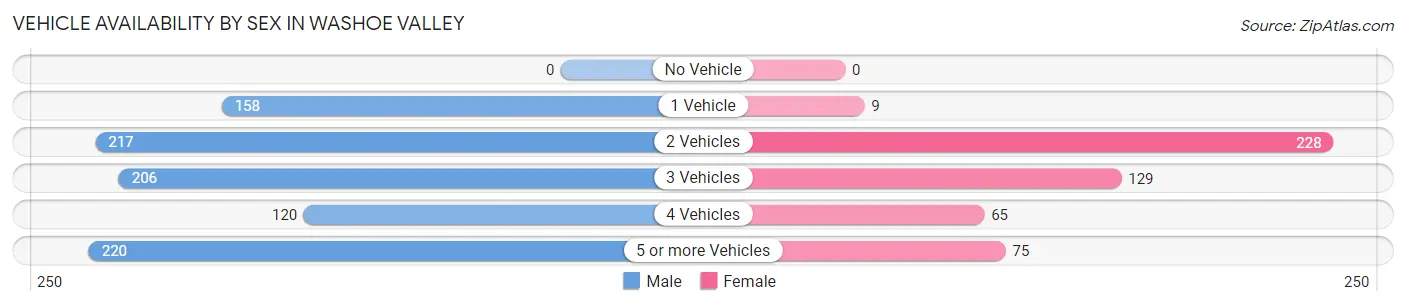
| Vehicles Available | Male | Female |
| No Vehicle | 0 (0.0%) | 0 (0.0%) |
| 1 Vehicle | 158 (17.2%) | 9 (1.8%) |
| 2 Vehicles | 217 (23.6%) | 228 (45.1%) |
| 3 Vehicles | 206 (22.4%) | 129 (25.5%) |
| 4 Vehicles | 120 (13.0%) | 65 (12.9%) |
| 5 or more Vehicles | 220 (23.9%) | 75 (14.8%) |
| Total | 921 (100.0%) | 506 (100.0%) |
Commute Time in Washoe Valley
The most frequently occuring commute durations in Washoe Valley are 30 to 34 minutes (572 commuters, 43.4%), 25 to 29 minutes (292 commuters, 22.2%), and 20 to 24 minutes (251 commuters, 19.0%).

| Commute Time | # Commuters | % Commuters |
| Less than 5 Minutes | 0 | 0.0% |
| 5 to 9 Minutes | 74 | 5.6% |
| 10 to 14 Minutes | 0 | 0.0% |
| 15 to 19 Minutes | 65 | 4.9% |
| 20 to 24 Minutes | 251 | 19.0% |
| 25 to 29 Minutes | 292 | 22.2% |
| 30 to 34 Minutes | 572 | 43.4% |
| 35 to 39 Minutes | 17 | 1.3% |
| 40 to 44 Minutes | 7 | 0.5% |
| 45 to 59 Minutes | 10 | 0.8% |
| 60 to 89 Minutes | 30 | 2.3% |
| 90 or more Minutes | 0 | 0.0% |
Commute Time by Sex in Washoe Valley
The most common commute times in Washoe Valley are 30 to 34 minutes (332 commuters, 38.0%) for males and 30 to 34 minutes (240 commuters, 53.9%) for females.
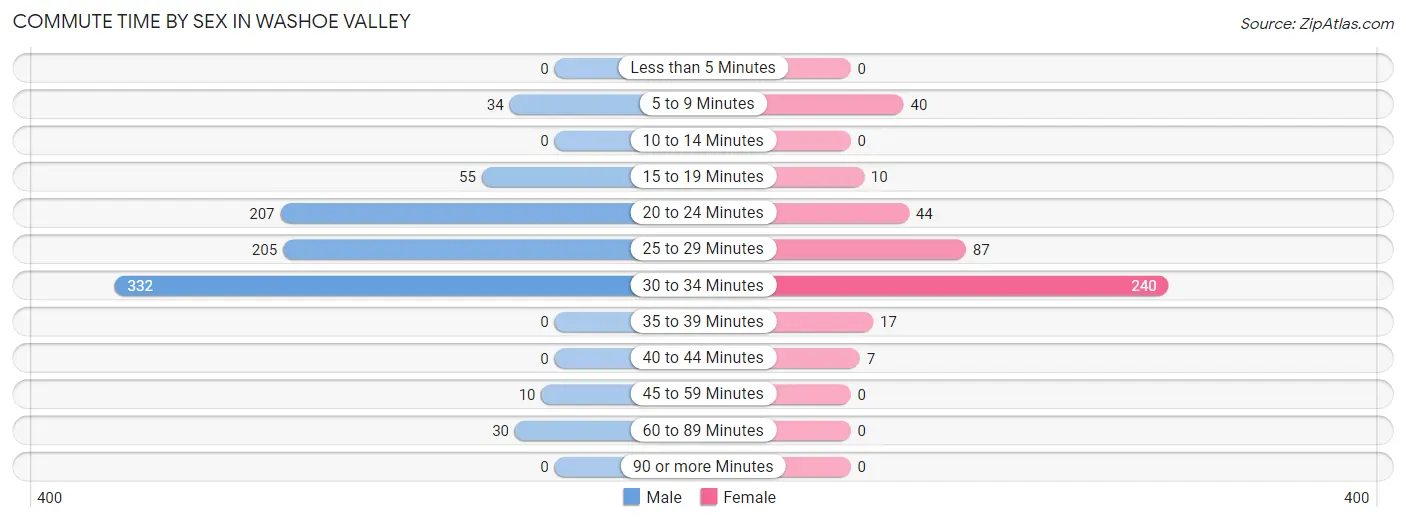
| Commute Time | Male | Female |
| Less than 5 Minutes | 0 (0.0%) | 0 (0.0%) |
| 5 to 9 Minutes | 34 (3.9%) | 40 (9.0%) |
| 10 to 14 Minutes | 0 (0.0%) | 0 (0.0%) |
| 15 to 19 Minutes | 55 (6.3%) | 10 (2.2%) |
| 20 to 24 Minutes | 207 (23.7%) | 44 (9.9%) |
| 25 to 29 Minutes | 205 (23.5%) | 87 (19.6%) |
| 30 to 34 Minutes | 332 (38.0%) | 240 (53.9%) |
| 35 to 39 Minutes | 0 (0.0%) | 17 (3.8%) |
| 40 to 44 Minutes | 0 (0.0%) | 7 (1.6%) |
| 45 to 59 Minutes | 10 (1.1%) | 0 (0.0%) |
| 60 to 89 Minutes | 30 (3.4%) | 0 (0.0%) |
| 90 or more Minutes | 0 (0.0%) | 0 (0.0%) |
Time of Departure to Work by Sex in Washoe Valley
The most frequent times of departure to work in Washoe Valley are 5:00 AM to 5:29 AM (212, 24.3%) for males and 5:30 AM to 5:59 AM (89, 20.0%) for females.
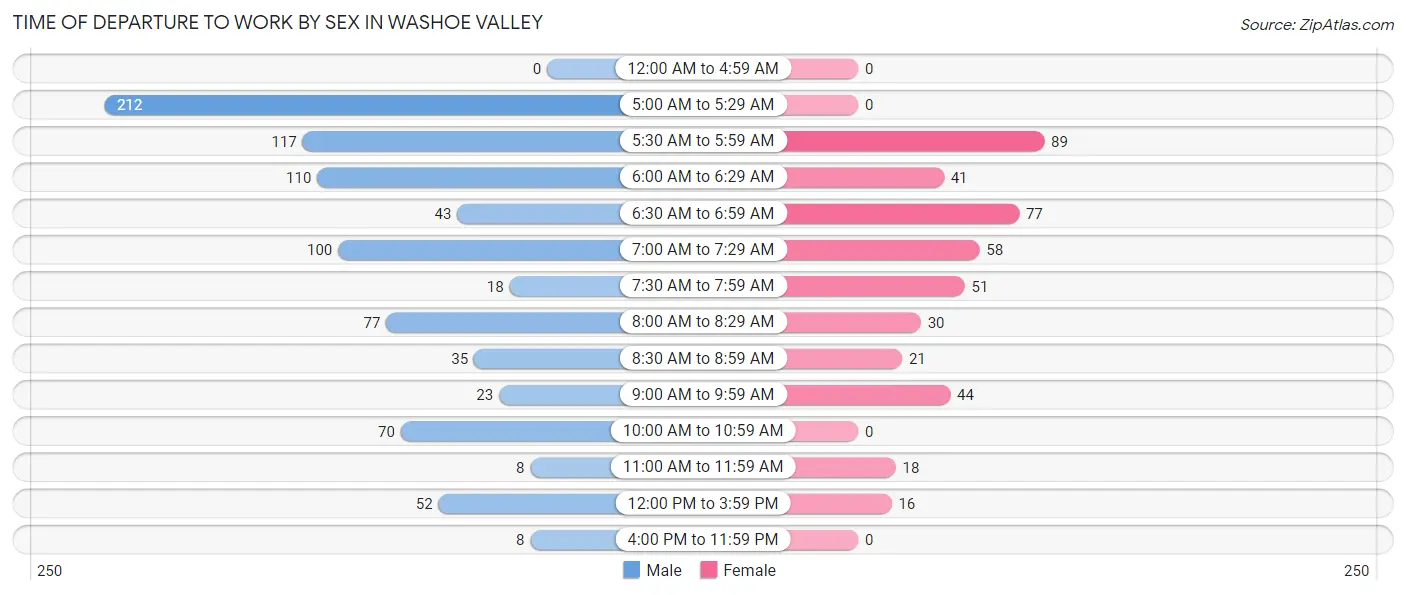
| Time of Departure | Male | Female |
| 12:00 AM to 4:59 AM | 0 (0.0%) | 0 (0.0%) |
| 5:00 AM to 5:29 AM | 212 (24.3%) | 0 (0.0%) |
| 5:30 AM to 5:59 AM | 117 (13.4%) | 89 (20.0%) |
| 6:00 AM to 6:29 AM | 110 (12.6%) | 41 (9.2%) |
| 6:30 AM to 6:59 AM | 43 (4.9%) | 77 (17.3%) |
| 7:00 AM to 7:29 AM | 100 (11.5%) | 58 (13.0%) |
| 7:30 AM to 7:59 AM | 18 (2.1%) | 51 (11.5%) |
| 8:00 AM to 8:29 AM | 77 (8.8%) | 30 (6.7%) |
| 8:30 AM to 8:59 AM | 35 (4.0%) | 21 (4.7%) |
| 9:00 AM to 9:59 AM | 23 (2.6%) | 44 (9.9%) |
| 10:00 AM to 10:59 AM | 70 (8.0%) | 0 (0.0%) |
| 11:00 AM to 11:59 AM | 8 (0.9%) | 18 (4.0%) |
| 12:00 PM to 3:59 PM | 52 (6.0%) | 16 (3.6%) |
| 4:00 PM to 11:59 PM | 8 (0.9%) | 0 (0.0%) |
| Total | 873 (100.0%) | 445 (100.0%) |
Housing Occupancy in Washoe Valley
Occupancy by Ownership in Washoe Valley
Of the total 1,297 dwellings in Washoe Valley, owner-occupied units account for 1,252 (96.5%), while renter-occupied units make up 45 (3.5%).
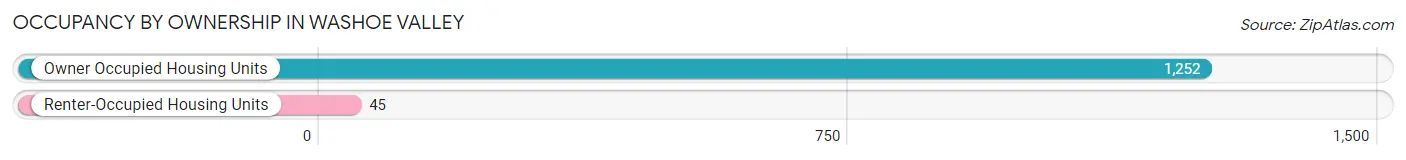
| Occupancy | # Housing Units | % Housing Units |
| Owner Occupied Housing Units | 1,252 | 96.5% |
| Renter-Occupied Housing Units | 45 | 3.5% |
| Total Occupied Housing Units | 1,297 | 100.0% |
Occupancy by Household Size in Washoe Valley
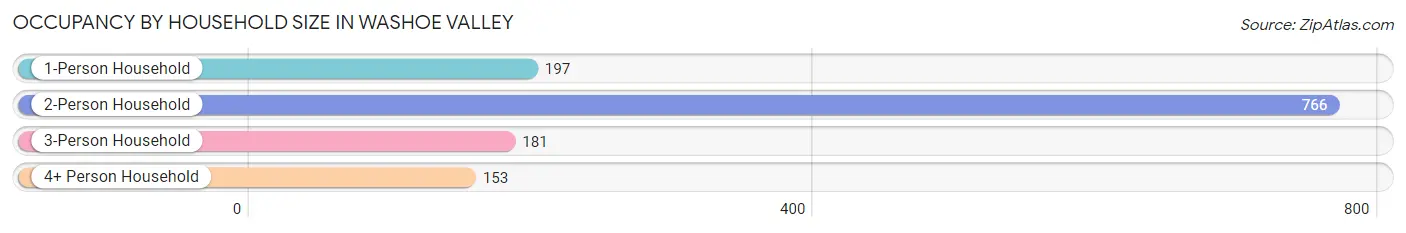
| Household Size | # Housing Units | % Housing Units |
| 1-Person Household | 197 | 15.2% |
| 2-Person Household | 766 | 59.1% |
| 3-Person Household | 181 | 14.0% |
| 4+ Person Household | 153 | 11.8% |
| Total Housing Units | 1,297 | 100.0% |
Occupancy by Ownership by Household Size in Washoe Valley
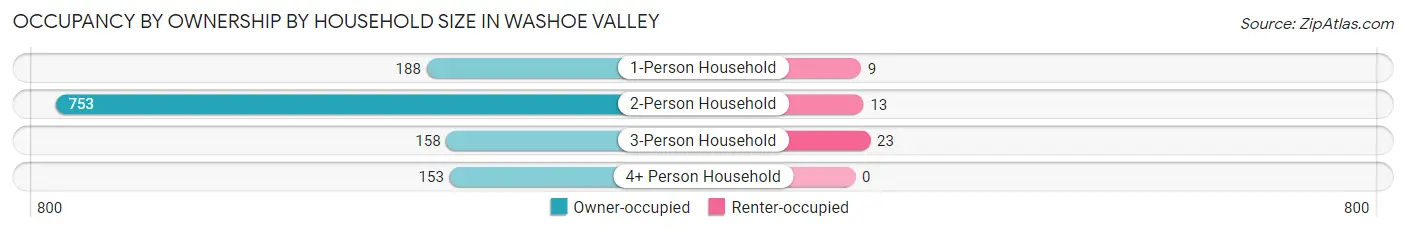
| Household Size | Owner-occupied | Renter-occupied |
| 1-Person Household | 188 (95.4%) | 9 (4.6%) |
| 2-Person Household | 753 (98.3%) | 13 (1.7%) |
| 3-Person Household | 158 (87.3%) | 23 (12.7%) |
| 4+ Person Household | 153 (100.0%) | 0 (0.0%) |
| Total Housing Units | 1,252 (96.5%) | 45 (3.5%) |
Occupancy by Educational Attainment in Washoe Valley
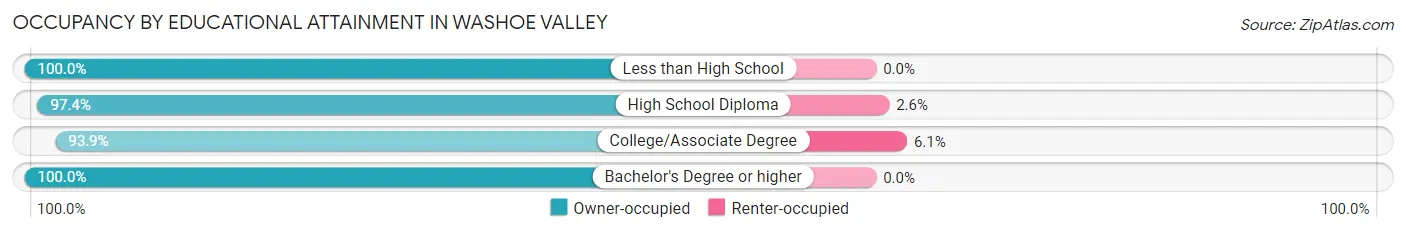
| Household Size | Owner-occupied | Renter-occupied |
| Less than High School | 79 (100.0%) | 0 (0.0%) |
| High School Diploma | 339 (97.4%) | 9 (2.6%) |
| College/Associate Degree | 553 (93.9%) | 36 (6.1%) |
| Bachelor's Degree or higher | 281 (100.0%) | 0 (0.0%) |
Occupancy by Age of Householder in Washoe Valley
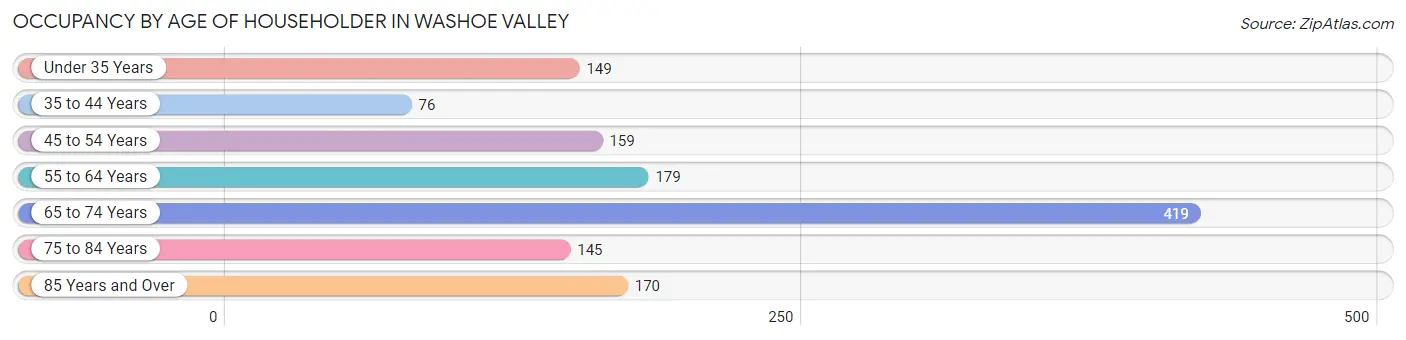
| Age Bracket | # Households | % Households |
| Under 35 Years | 149 | 11.5% |
| 35 to 44 Years | 76 | 5.9% |
| 45 to 54 Years | 159 | 12.3% |
| 55 to 64 Years | 179 | 13.8% |
| 65 to 74 Years | 419 | 32.3% |
| 75 to 84 Years | 145 | 11.2% |
| 85 Years and Over | 170 | 13.1% |
| Total | 1,297 | 100.0% |
Housing Finances in Washoe Valley
Median Income by Occupancy in Washoe Valley
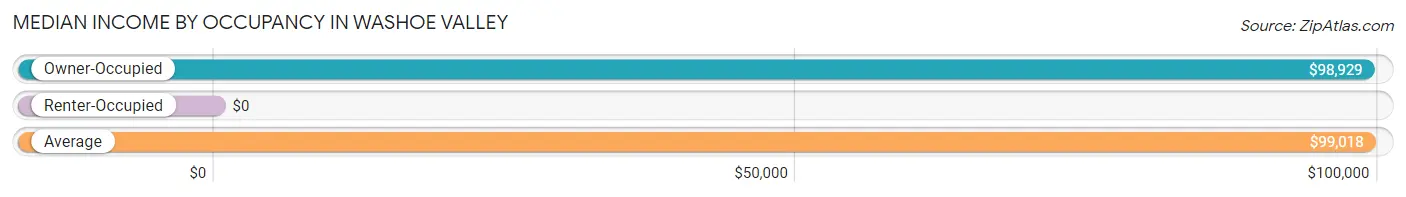
| Occupancy Type | # Households | Median Income |
| Owner-Occupied | 1,252 (96.5%) | $98,929 |
| Renter-Occupied | 45 (3.5%) | $0 |
| Average | 1,297 (100.0%) | $99,018 |
Occupancy by Householder Income Bracket in Washoe Valley
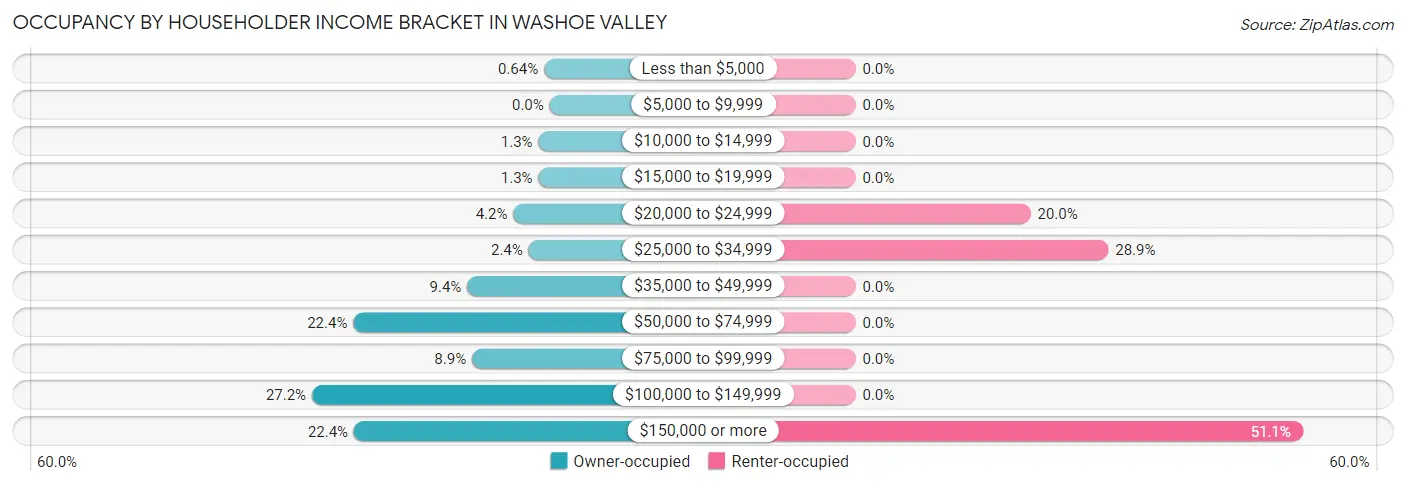
| Income Bracket | Owner-occupied | Renter-occupied |
| Less than $5,000 | 8 (0.6%) | 0 (0.0%) |
| $5,000 to $9,999 | 0 (0.0%) | 0 (0.0%) |
| $10,000 to $14,999 | 16 (1.3%) | 0 (0.0%) |
| $15,000 to $19,999 | 16 (1.3%) | 0 (0.0%) |
| $20,000 to $24,999 | 52 (4.2%) | 9 (20.0%) |
| $25,000 to $34,999 | 30 (2.4%) | 13 (28.9%) |
| $35,000 to $49,999 | 118 (9.4%) | 0 (0.0%) |
| $50,000 to $74,999 | 281 (22.4%) | 0 (0.0%) |
| $75,000 to $99,999 | 111 (8.9%) | 0 (0.0%) |
| $100,000 to $149,999 | 340 (27.2%) | 0 (0.0%) |
| $150,000 or more | 280 (22.4%) | 23 (51.1%) |
| Total | 1,252 (100.0%) | 45 (100.0%) |
Monthly Housing Cost Tiers in Washoe Valley
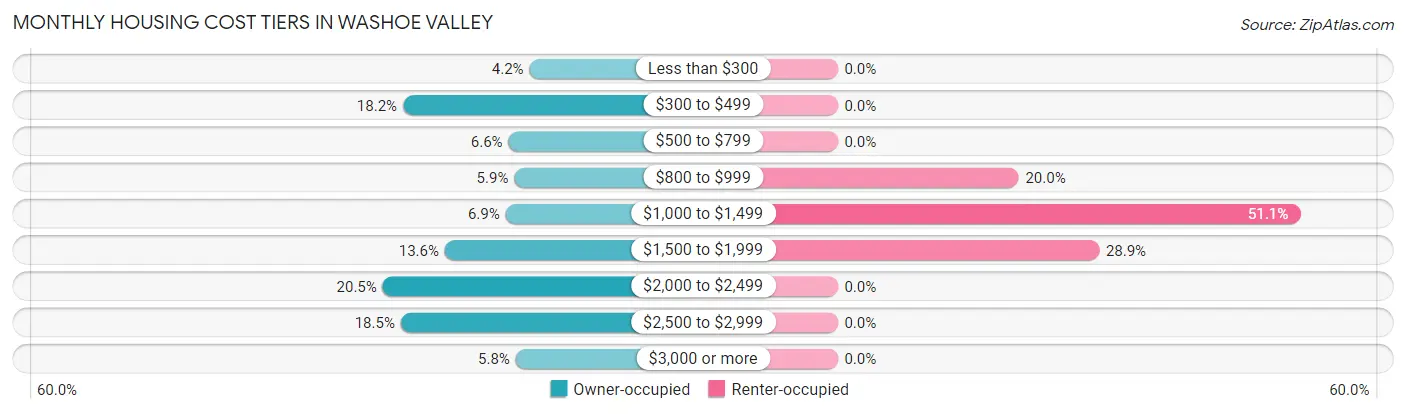
| Monthly Cost | Owner-occupied | Renter-occupied |
| Less than $300 | 53 (4.2%) | 0 (0.0%) |
| $300 to $499 | 228 (18.2%) | 0 (0.0%) |
| $500 to $799 | 82 (6.6%) | 0 (0.0%) |
| $800 to $999 | 74 (5.9%) | 9 (20.0%) |
| $1,000 to $1,499 | 86 (6.9%) | 23 (51.1%) |
| $1,500 to $1,999 | 170 (13.6%) | 13 (28.9%) |
| $2,000 to $2,499 | 256 (20.4%) | 0 (0.0%) |
| $2,500 to $2,999 | 231 (18.4%) | 0 (0.0%) |
| $3,000 or more | 72 (5.8%) | 0 (0.0%) |
| Total | 1,252 (100.0%) | 45 (100.0%) |
Physical Housing Characteristics in Washoe Valley
Housing Structures in Washoe Valley
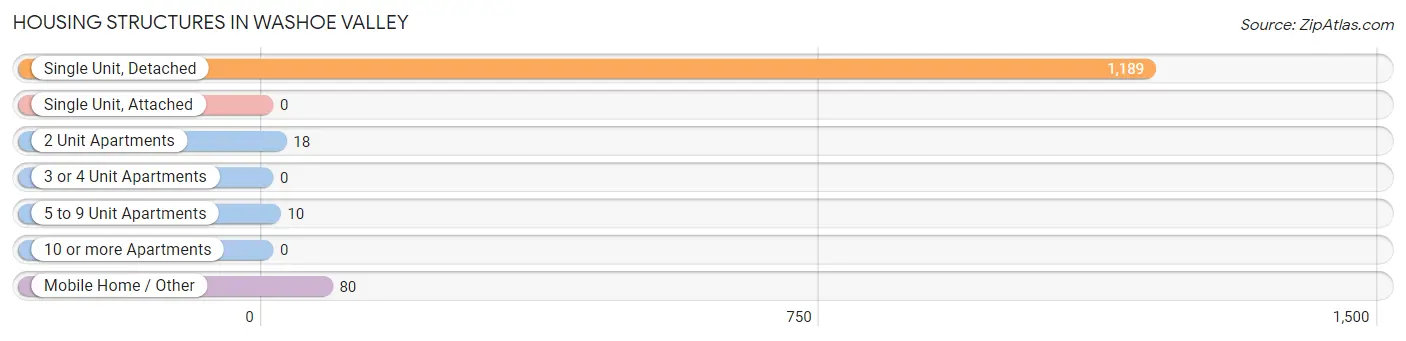
| Structure Type | # Housing Units | % Housing Units |
| Single Unit, Detached | 1,189 | 91.7% |
| Single Unit, Attached | 0 | 0.0% |
| 2 Unit Apartments | 18 | 1.4% |
| 3 or 4 Unit Apartments | 0 | 0.0% |
| 5 to 9 Unit Apartments | 10 | 0.8% |
| 10 or more Apartments | 0 | 0.0% |
| Mobile Home / Other | 80 | 6.2% |
| Total | 1,297 | 100.0% |
Housing Structures by Occupancy in Washoe Valley
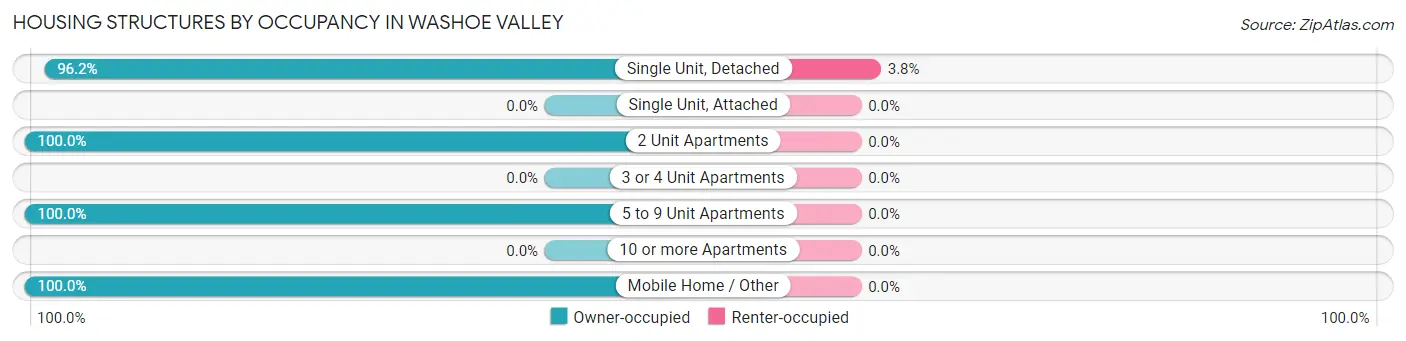
| Structure Type | Owner-occupied | Renter-occupied |
| Single Unit, Detached | 1,144 (96.2%) | 45 (3.8%) |
| Single Unit, Attached | 0 (0.0%) | 0 (0.0%) |
| 2 Unit Apartments | 18 (100.0%) | 0 (0.0%) |
| 3 or 4 Unit Apartments | 0 (0.0%) | 0 (0.0%) |
| 5 to 9 Unit Apartments | 10 (100.0%) | 0 (0.0%) |
| 10 or more Apartments | 0 (0.0%) | 0 (0.0%) |
| Mobile Home / Other | 80 (100.0%) | 0 (0.0%) |
| Total | 1,252 (96.5%) | 45 (3.5%) |
Housing Structures by Number of Rooms in Washoe Valley
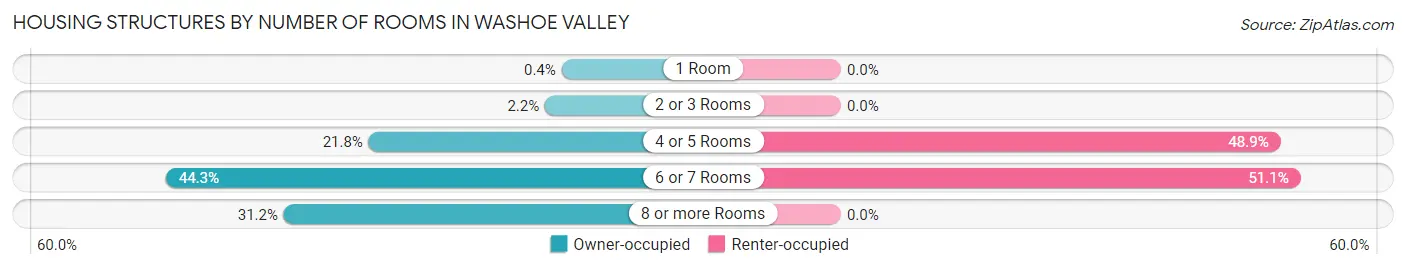
| Number of Rooms | Owner-occupied | Renter-occupied |
| 1 Room | 5 (0.4%) | 0 (0.0%) |
| 2 or 3 Rooms | 28 (2.2%) | 0 (0.0%) |
| 4 or 5 Rooms | 273 (21.8%) | 22 (48.9%) |
| 6 or 7 Rooms | 555 (44.3%) | 23 (51.1%) |
| 8 or more Rooms | 391 (31.2%) | 0 (0.0%) |
| Total | 1,252 (100.0%) | 45 (100.0%) |
Housing Structure by Heating Type in Washoe Valley
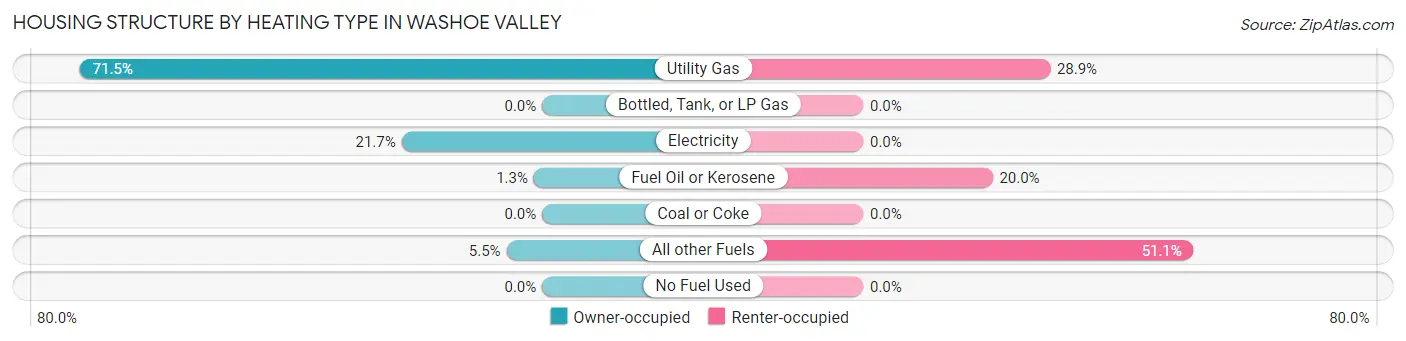
| Heating Type | Owner-occupied | Renter-occupied |
| Utility Gas | 895 (71.5%) | 13 (28.9%) |
| Bottled, Tank, or LP Gas | 0 (0.0%) | 0 (0.0%) |
| Electricity | 272 (21.7%) | 0 (0.0%) |
| Fuel Oil or Kerosene | 16 (1.3%) | 9 (20.0%) |
| Coal or Coke | 0 (0.0%) | 0 (0.0%) |
| All other Fuels | 69 (5.5%) | 23 (51.1%) |
| No Fuel Used | 0 (0.0%) | 0 (0.0%) |
| Total | 1,252 (100.0%) | 45 (100.0%) |
Household Vehicle Usage in Washoe Valley
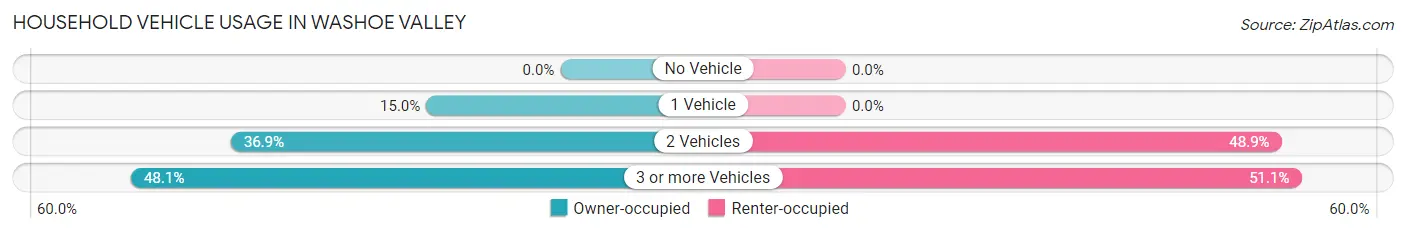
| Vehicles per Household | Owner-occupied | Renter-occupied |
| No Vehicle | 0 (0.0%) | 0 (0.0%) |
| 1 Vehicle | 188 (15.0%) | 0 (0.0%) |
| 2 Vehicles | 462 (36.9%) | 22 (48.9%) |
| 3 or more Vehicles | 602 (48.1%) | 23 (51.1%) |
| Total | 1,252 (100.0%) | 45 (100.0%) |
Real Estate & Mortgages in Washoe Valley
Real Estate and Mortgage Overview in Washoe Valley
| Characteristic | Without Mortgage | With Mortgage |
| Housing Units | 408 | 844 |
| Median Property Value | $493,900 | $461,600 |
| Median Household Income | $82,143 | $156 |
| Monthly Housing Costs | $389 | $72 |
| Real Estate Taxes | $2,188 | $11 |
Property Value by Mortgage Status in Washoe Valley
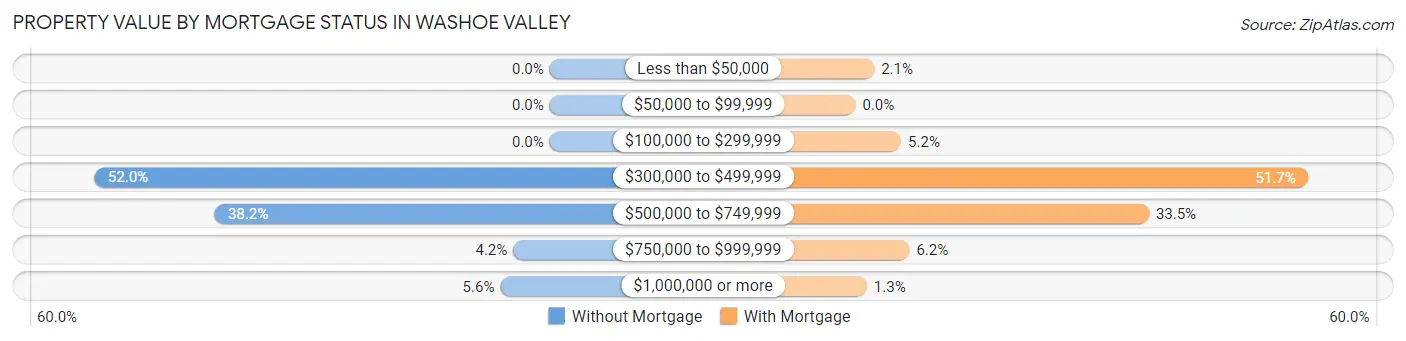
| Property Value | Without Mortgage | With Mortgage |
| Less than $50,000 | 0 (0.0%) | 18 (2.1%) |
| $50,000 to $99,999 | 0 (0.0%) | 0 (0.0%) |
| $100,000 to $299,999 | 0 (0.0%) | 44 (5.2%) |
| $300,000 to $499,999 | 212 (52.0%) | 436 (51.7%) |
| $500,000 to $749,999 | 156 (38.2%) | 283 (33.5%) |
| $750,000 to $999,999 | 17 (4.2%) | 52 (6.2%) |
| $1,000,000 or more | 23 (5.6%) | 11 (1.3%) |
| Total | 408 (100.0%) | 844 (100.0%) |
Household Income by Mortgage Status in Washoe Valley
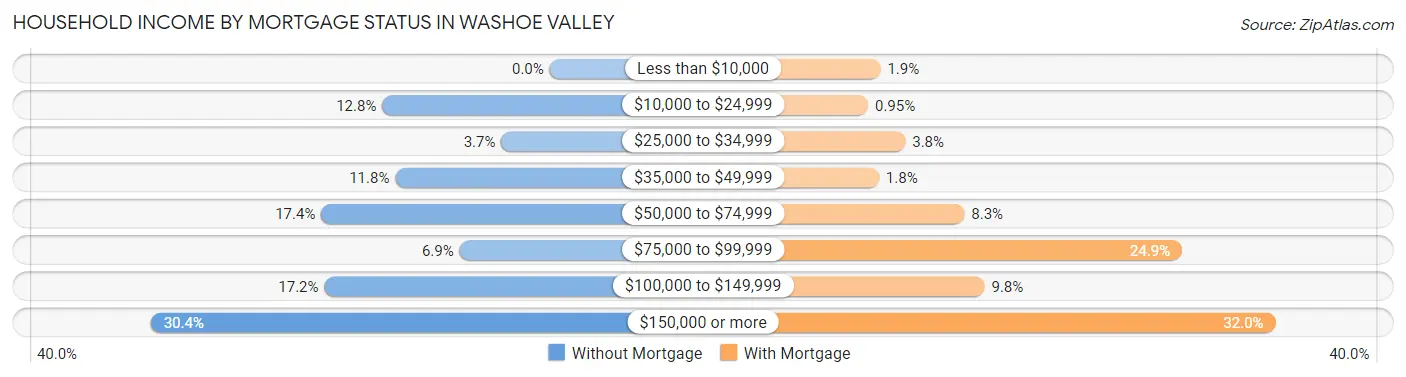
| Household Income | Without Mortgage | With Mortgage |
| Less than $10,000 | 0 (0.0%) | 16 (1.9%) |
| $10,000 to $24,999 | 52 (12.8%) | 8 (0.9%) |
| $25,000 to $34,999 | 15 (3.7%) | 32 (3.8%) |
| $35,000 to $49,999 | 48 (11.8%) | 15 (1.8%) |
| $50,000 to $74,999 | 71 (17.4%) | 70 (8.3%) |
| $75,000 to $99,999 | 28 (6.9%) | 210 (24.9%) |
| $100,000 to $149,999 | 70 (17.2%) | 83 (9.8%) |
| $150,000 or more | 124 (30.4%) | 270 (32.0%) |
| Total | 408 (100.0%) | 844 (100.0%) |
Property Value to Household Income Ratio in Washoe Valley
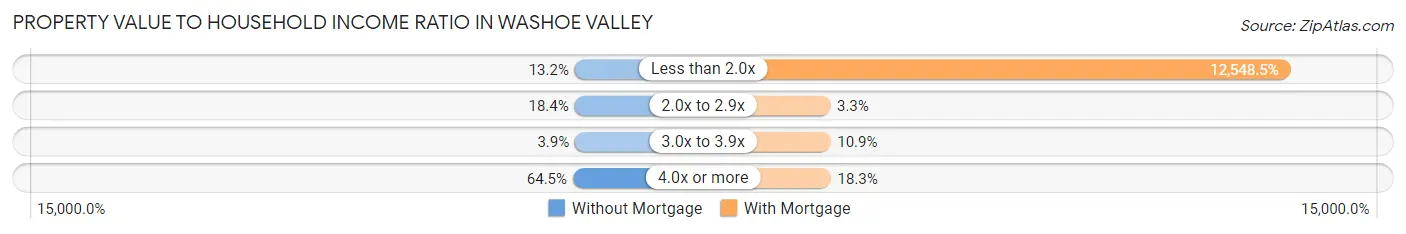
| Value-to-Income Ratio | Without Mortgage | With Mortgage |
| Less than 2.0x | 54 (13.2%) | 105,909 (12,548.5%) |
| 2.0x to 2.9x | 75 (18.4%) | 28 (3.3%) |
| 3.0x to 3.9x | 16 (3.9%) | 92 (10.9%) |
| 4.0x or more | 263 (64.5%) | 154 (18.2%) |
| Total | 408 (100.0%) | 844 (100.0%) |
Real Estate Taxes by Mortgage Status in Washoe Valley
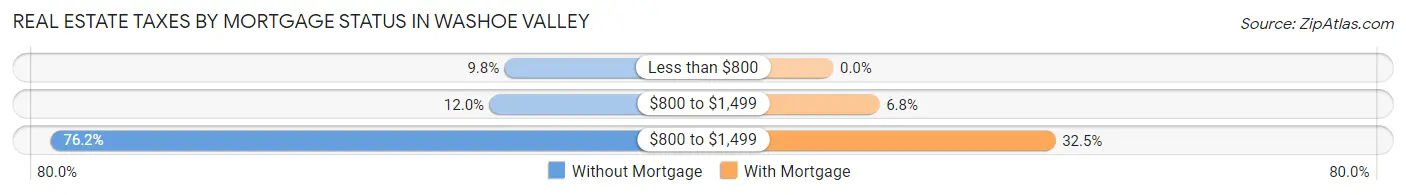
| Property Taxes | Without Mortgage | With Mortgage |
| Less than $800 | 40 (9.8%) | 0 (0.0%) |
| $800 to $1,499 | 49 (12.0%) | 57 (6.8%) |
| $800 to $1,499 | 311 (76.2%) | 274 (32.5%) |
| Total | 408 (100.0%) | 844 (100.0%) |
Health & Disability in Washoe Valley
Health Insurance Coverage by Age in Washoe Valley
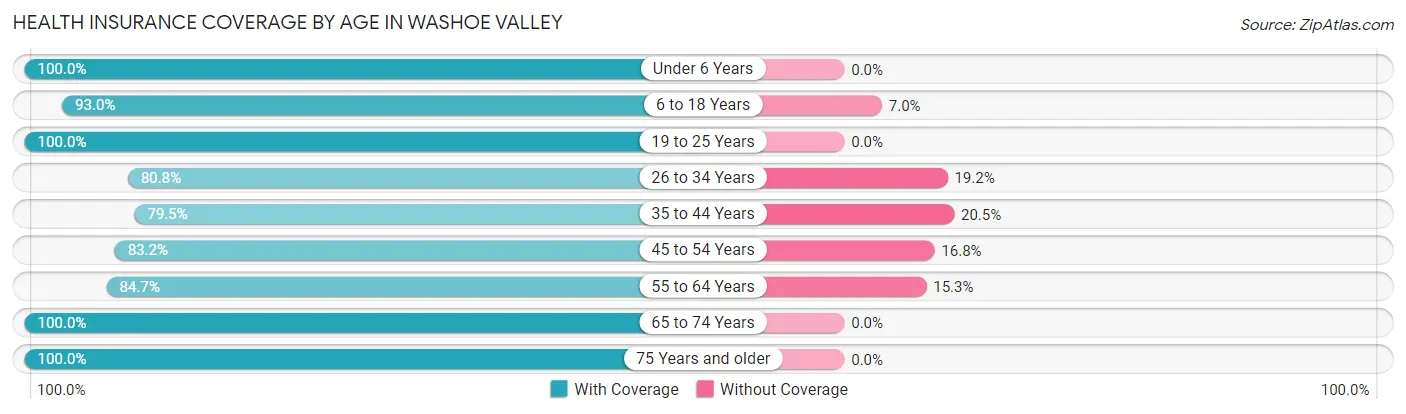
| Age Bracket | With Coverage | Without Coverage |
| Under 6 Years | 98 (100.0%) | 0 (0.0%) |
| 6 to 18 Years | 226 (93.0%) | 17 (7.0%) |
| 19 to 25 Years | 88 (100.0%) | 0 (0.0%) |
| 26 to 34 Years | 277 (80.8%) | 66 (19.2%) |
| 35 to 44 Years | 237 (79.5%) | 61 (20.5%) |
| 45 to 54 Years | 292 (83.2%) | 59 (16.8%) |
| 55 to 64 Years | 565 (84.7%) | 102 (15.3%) |
| 65 to 74 Years | 693 (100.0%) | 0 (0.0%) |
| 75 Years and older | 454 (100.0%) | 0 (0.0%) |
| Total | 2,930 (90.6%) | 305 (9.4%) |
Health Insurance Coverage by Citizenship Status in Washoe Valley
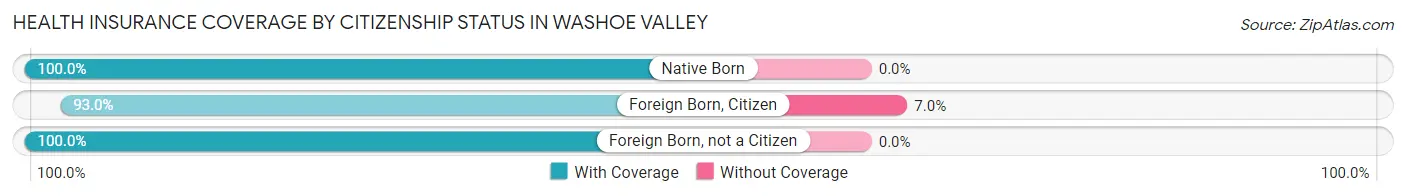
| Citizenship Status | With Coverage | Without Coverage |
| Native Born | 98 (100.0%) | 0 (0.0%) |
| Foreign Born, Citizen | 226 (93.0%) | 17 (7.0%) |
| Foreign Born, not a Citizen | 88 (100.0%) | 0 (0.0%) |
Health Insurance Coverage by Household Income in Washoe Valley
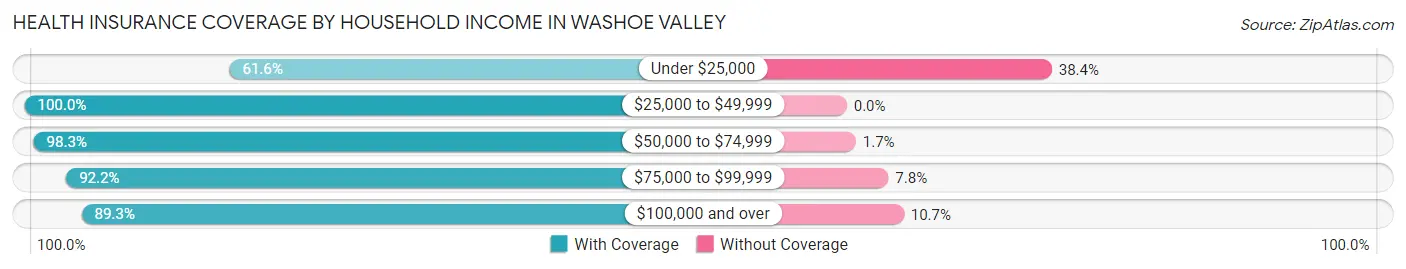
| Household Income | With Coverage | Without Coverage |
| Under $25,000 | 101 (61.6%) | 63 (38.4%) |
| $25,000 to $49,999 | 303 (100.0%) | 0 (0.0%) |
| $50,000 to $74,999 | 519 (98.3%) | 9 (1.7%) |
| $75,000 to $99,999 | 201 (92.2%) | 17 (7.8%) |
| $100,000 and over | 1,806 (89.3%) | 216 (10.7%) |
Public vs Private Health Insurance Coverage by Age in Washoe Valley
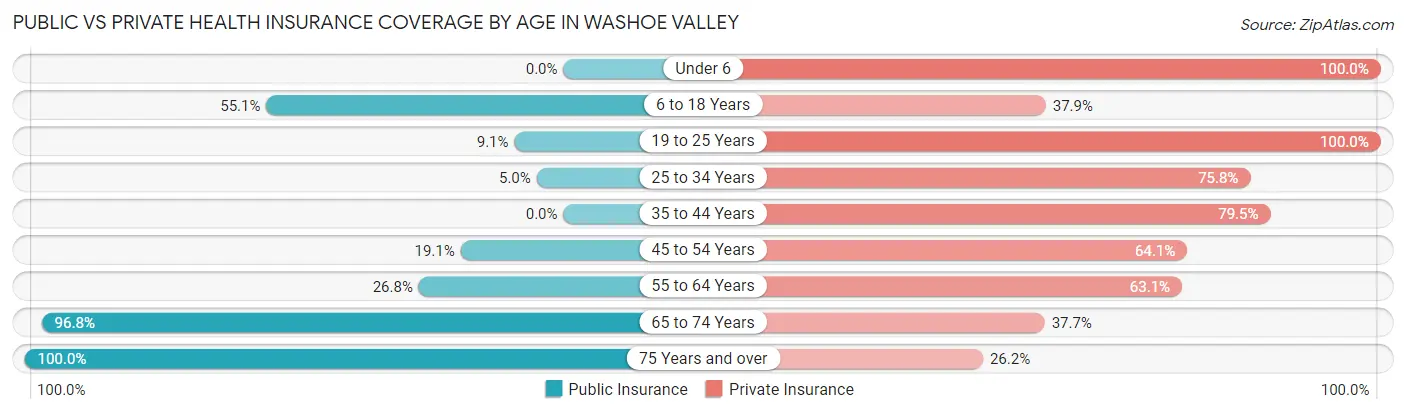
| Age Bracket | Public Insurance | Private Insurance |
| Under 6 | 0 (0.0%) | 98 (100.0%) |
| 6 to 18 Years | 134 (55.1%) | 92 (37.9%) |
| 19 to 25 Years | 8 (9.1%) | 88 (100.0%) |
| 25 to 34 Years | 17 (5.0%) | 260 (75.8%) |
| 35 to 44 Years | 0 (0.0%) | 237 (79.5%) |
| 45 to 54 Years | 67 (19.1%) | 225 (64.1%) |
| 55 to 64 Years | 179 (26.8%) | 421 (63.1%) |
| 65 to 74 Years | 671 (96.8%) | 261 (37.7%) |
| 75 Years and over | 454 (100.0%) | 119 (26.2%) |
| Total | 1,530 (47.3%) | 1,801 (55.7%) |
Disability Status by Sex by Age in Washoe Valley
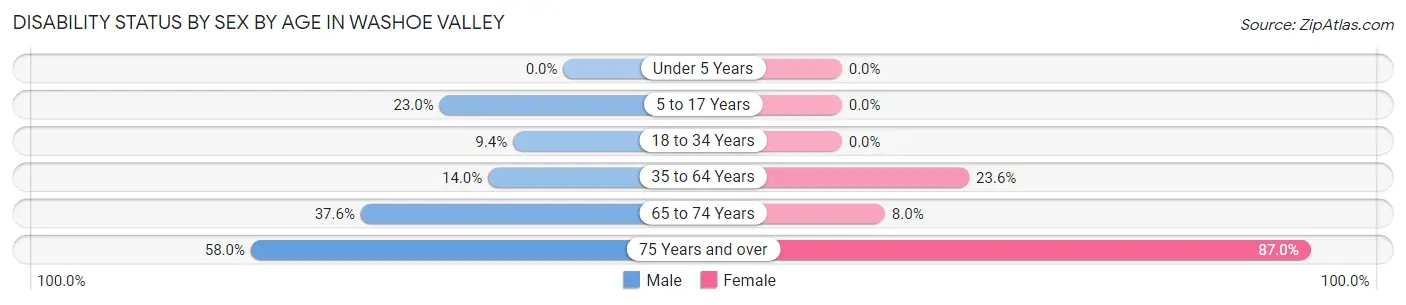
| Age Bracket | Male | Female |
| Under 5 Years | 0 (0.0%) | 0 (0.0%) |
| 5 to 17 Years | 20 (23.0%) | 0 (0.0%) |
| 18 to 34 Years | 30 (9.3%) | 0 (0.0%) |
| 35 to 64 Years | 107 (14.0%) | 130 (23.6%) |
| 65 to 74 Years | 129 (37.6%) | 28 (8.0%) |
| 75 Years and over | 76 (58.0%) | 281 (87.0%) |
Disability Class by Sex by Age in Washoe Valley
Disability Class: Hearing Difficulty
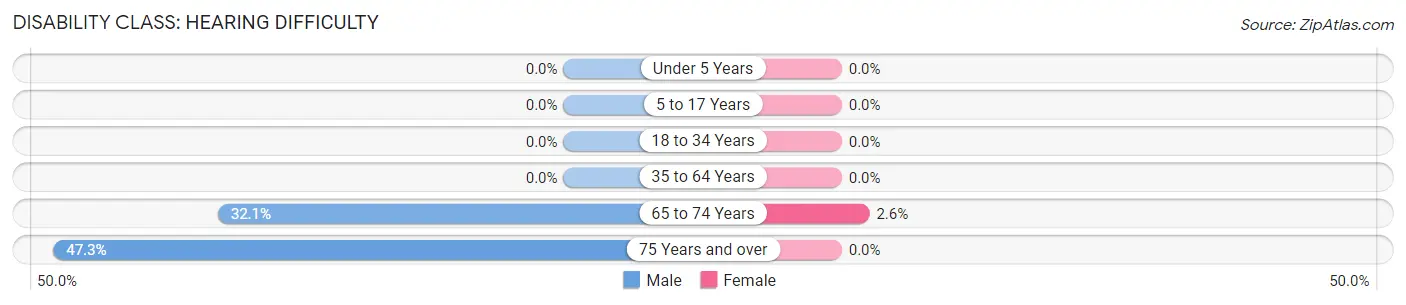
| Age Bracket | Male | Female |
| Under 5 Years | 0 (0.0%) | 0 (0.0%) |
| 5 to 17 Years | 0 (0.0%) | 0 (0.0%) |
| 18 to 34 Years | 0 (0.0%) | 0 (0.0%) |
| 35 to 64 Years | 0 (0.0%) | 0 (0.0%) |
| 65 to 74 Years | 110 (32.1%) | 9 (2.6%) |
| 75 Years and over | 62 (47.3%) | 0 (0.0%) |
Disability Class: Vision Difficulty
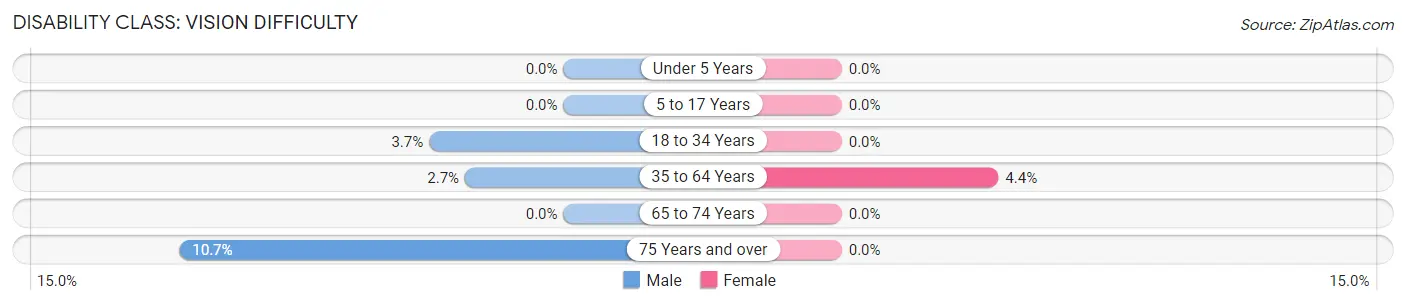
| Age Bracket | Male | Female |
| Under 5 Years | 0 (0.0%) | 0 (0.0%) |
| 5 to 17 Years | 0 (0.0%) | 0 (0.0%) |
| 18 to 34 Years | 12 (3.7%) | 0 (0.0%) |
| 35 to 64 Years | 21 (2.7%) | 24 (4.4%) |
| 65 to 74 Years | 0 (0.0%) | 0 (0.0%) |
| 75 Years and over | 14 (10.7%) | 0 (0.0%) |
Disability Class: Cognitive Difficulty
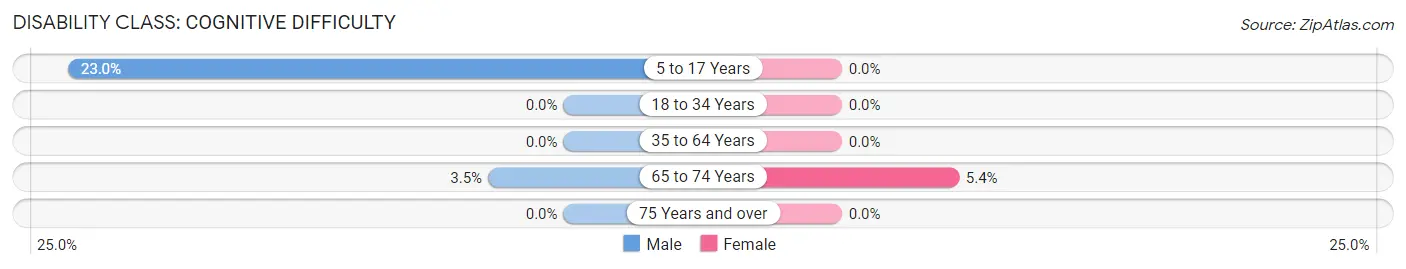
| Age Bracket | Male | Female |
| 5 to 17 Years | 20 (23.0%) | 0 (0.0%) |
| 18 to 34 Years | 0 (0.0%) | 0 (0.0%) |
| 35 to 64 Years | 0 (0.0%) | 0 (0.0%) |
| 65 to 74 Years | 12 (3.5%) | 19 (5.4%) |
| 75 Years and over | 0 (0.0%) | 0 (0.0%) |
Disability Class: Ambulatory Difficulty
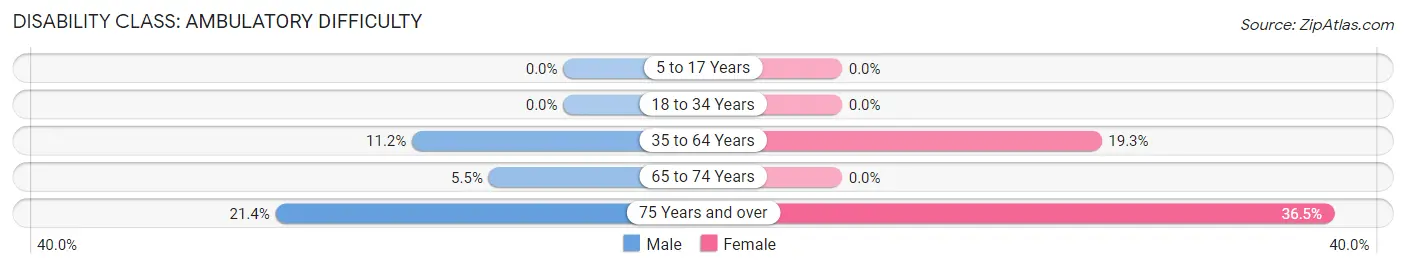
| Age Bracket | Male | Female |
| 5 to 17 Years | 0 (0.0%) | 0 (0.0%) |
| 18 to 34 Years | 0 (0.0%) | 0 (0.0%) |
| 35 to 64 Years | 86 (11.2%) | 106 (19.3%) |
| 65 to 74 Years | 19 (5.5%) | 0 (0.0%) |
| 75 Years and over | 28 (21.4%) | 118 (36.5%) |
Disability Class: Self-Care Difficulty
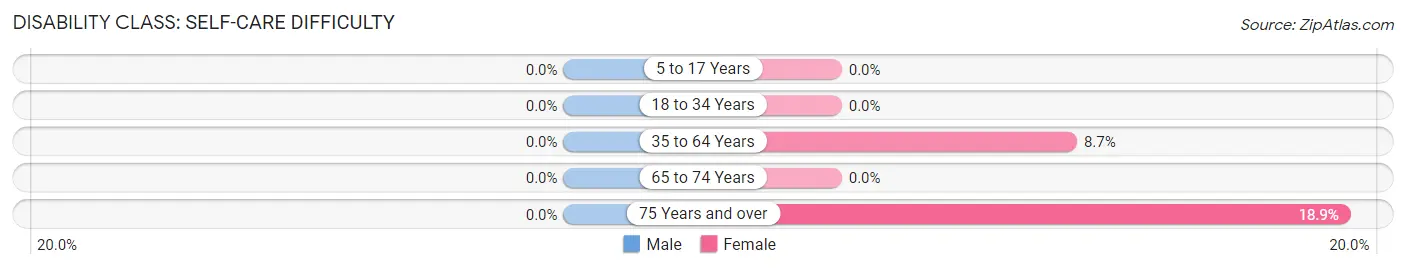
| Age Bracket | Male | Female |
| 5 to 17 Years | 0 (0.0%) | 0 (0.0%) |
| 18 to 34 Years | 0 (0.0%) | 0 (0.0%) |
| 35 to 64 Years | 0 (0.0%) | 48 (8.7%) |
| 65 to 74 Years | 0 (0.0%) | 0 (0.0%) |
| 75 Years and over | 0 (0.0%) | 61 (18.9%) |
Technology Access in Washoe Valley
Computing Device Access in Washoe Valley
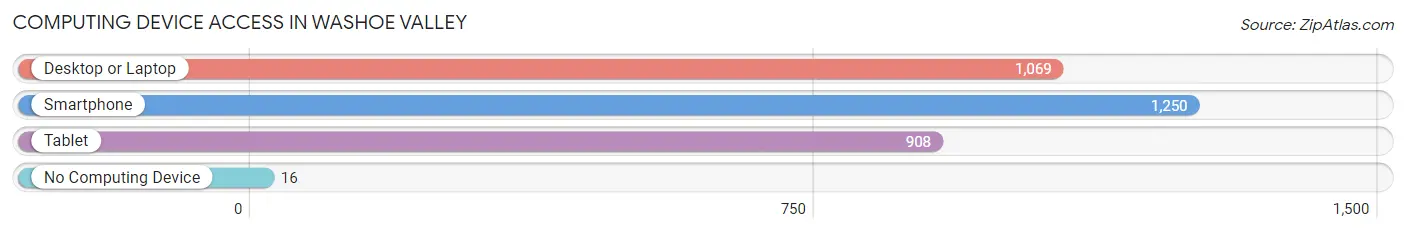
| Device Type | # Households | % Households |
| Desktop or Laptop | 1,069 | 82.4% |
| Smartphone | 1,250 | 96.4% |
| Tablet | 908 | 70.0% |
| No Computing Device | 16 | 1.2% |
| Total | 1,297 | 100.0% |
Internet Access in Washoe Valley
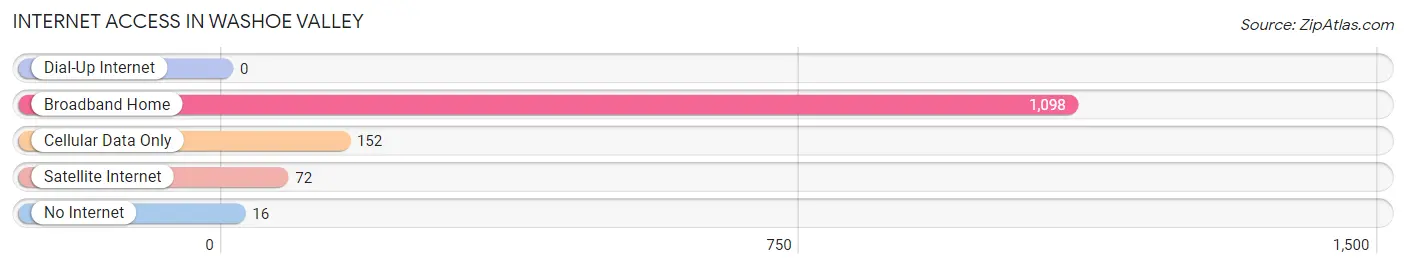
| Internet Type | # Households | % Households |
| Dial-Up Internet | 0 | 0.0% |
| Broadband Home | 1,098 | 84.7% |
| Cellular Data Only | 152 | 11.7% |
| Satellite Internet | 72 | 5.6% |
| No Internet | 16 | 1.2% |
| Total | 1,297 | 100.0% |
Washoe Valley Summary
Washoe Valley is a small valley located in the western part of Nevada, just east of Reno and south of Carson City. It is bordered by the Sierra Nevada mountain range to the west and the Carson Range to the east. The valley is approximately 8 miles long and 4 miles wide, and is home to a population of approximately 5,000 people.
History
The Washoe Valley has a long and varied history. The first inhabitants of the area were the Washoe people, a Native American tribe who lived in the area for thousands of years before the arrival of European settlers. The Washoe people were known for their basket weaving and fishing skills, and were also known for their peaceful nature.
The first Europeans to settle in the area were miners and ranchers in the mid-1800s. The area was attractive to these settlers due to its abundance of natural resources, including timber, water, and minerals. The area was also attractive to settlers due to its proximity to the Comstock Lode, a major silver mining area in the nearby Virginia City.
The area was officially established as Washoe County in 1861, and the town of Washoe Valley was founded in 1864. The town quickly grew, and by the late 1800s it was a bustling center of commerce and industry. The town was home to several businesses, including a sawmill, a flour mill, a blacksmith shop, and a hotel.
Geography
The Washoe Valley is located in the western part of Nevada, just east of Reno and south of Carson City. It is bordered by the Sierra Nevada mountain range to the west and the Carson Range to the east. The valley is approximately 8 miles long and 4 miles wide, and is home to a population of approximately 5,000 people.
The valley is situated at an elevation of 4,500 feet, and is surrounded by mountains on all sides. The valley is home to several small lakes, including Washoe Lake, which is the largest lake in the valley. The valley is also home to several creeks and streams, including the Truckee River, which flows through the valley and is a major source of water for the area.
Economy
The economy of Washoe Valley is largely based on tourism and agriculture. The area is home to several tourist attractions, including the Washoe Lake State Park, which offers camping, fishing, and other recreational activities. The area is also home to several wineries, which attract visitors from all over the region.
Agriculture is also an important part of the economy of Washoe Valley. The area is home to several farms, which produce a variety of crops, including hay, alfalfa, and potatoes. The area is also home to several ranches, which raise cattle and other livestock.
Demographics
As of the 2010 census, the population of Washoe Valley was 5,067. The population is largely white (83.3%), with smaller percentages of Hispanic (7.2%), African American (2.2%), and Native American (1.2%) residents. The median household income in the area is $50,945, and the median age is 44.7 years. The area is home to several schools, including Washoe Valley Elementary School, Washoe Valley Middle School, and Washoe Valley High School.
Common Questions
What is Per Capita Income in Washoe Valley?
Per Capita income in Washoe Valley is $46,499.
What is the Median Family Income in Washoe Valley?
Median Family Income in Washoe Valley is $113,393.
What is the Median Household income in Washoe Valley?
Median Household Income in Washoe Valley is $99,018.
What is Income or Wage Gap in Washoe Valley?
Income or Wage Gap in Washoe Valley is 39.5%.
Women in Washoe Valley earn 60.5 cents for every dollar earned by a man.
What is Inequality or Gini Index in Washoe Valley?
Inequality or Gini Index in Washoe Valley is 0.36.
What is the Total Population of Washoe Valley?
Total Population of Washoe Valley is 3,235.
What is the Total Male Population of Washoe Valley?
Total Male Population of Washoe Valley is 1,746.
What is the Total Female Population of Washoe Valley?
Total Female Population of Washoe Valley is 1,489.
What is the Ratio of Males per 100 Females in Washoe Valley?
There are 117.26 Males per 100 Females in Washoe Valley.
What is the Ratio of Females per 100 Males in Washoe Valley?
There are 85.28 Females per 100 Males in Washoe Valley.
What is the Median Population Age in Washoe Valley?
Median Population Age in Washoe Valley is 58.7 Years.
What is the Average Family Size in Washoe Valley
Average Family Size in Washoe Valley is 2.8 People.
What is the Average Household Size in Washoe Valley
Average Household Size in Washoe Valley is 2.5 People.
How Large is the Labor Force in Washoe Valley?
There are 1,568 People in the Labor Forcein in Washoe Valley.
What is the Percentage of People in the Labor Force in Washoe Valley?
52.7% of People are in the Labor Force in Washoe Valley.
What is the Unemployment Rate in Washoe Valley?
Unemployment Rate in Washoe Valley is 4.8%.