Ely, NV Map & Demographics
Ely Map
Ely Overview
$36,258
PER CAPITA INCOME
$96,667
AVG FAMILY INCOME
$77,076
AVG HOUSEHOLD INCOME
8.3%
WAGE / INCOME GAP [ % ]
91.7¢/ $1
WAGE / INCOME GAP [ $ ]
0.35
INEQUALITY / GINI INDEX
3,957
TOTAL POPULATION
1,970
MALE POPULATION
1,987
FEMALE POPULATION
99.14
MALES / 100 FEMALES
100.86
FEMALES / 100 MALES
38.7
MEDIAN AGE
2.6
AVG FAMILY SIZE
2.2
AVG HOUSEHOLD SIZE
2,155
LABOR FORCE [ PEOPLE ]
69.3%
PERCENT IN LABOR FORCE
3.9%
UNEMPLOYMENT RATE
Ely Area Codes
Income in Ely
Income Overview in Ely
Per Capita Income in Ely is $36,258, while median incomes of families and households are $96,667 and $77,076 respectively.
| Characteristic | Number | Measure |
| Per Capita Income | 3,957 | $36,258 |
| Median Family Income | 1,138 | $96,667 |
| Mean Family Income | 1,138 | $94,028 |
| Median Household Income | 1,743 | $77,076 |
| Mean Household Income | 1,743 | $86,759 |
| Income Deficit | 1,138 | $0 |
| Wage / Income Gap (%) | 3,957 | 8.27% |
| Wage / Income Gap ($) | 3,957 | 91.73¢ per $1 |
| Gini / Inequality Index | 3,957 | 0.35 |
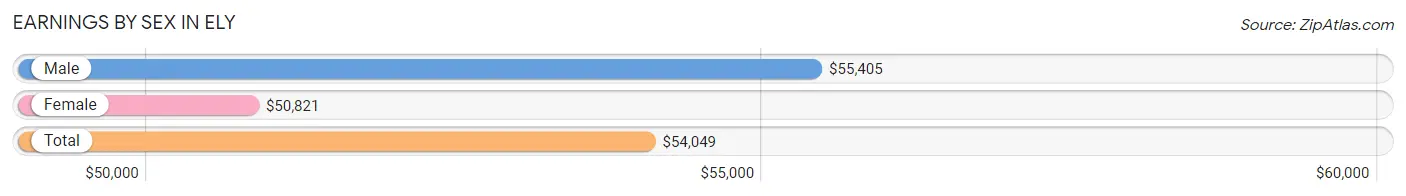
Earnings by Sex in Ely
Average Earnings in Ely are $54,049, $55,405 for men and $50,821 for women, a difference of 8.3%.
| Sex | Number | Average Earnings |
| Male | 1,162 (52.6%) | $55,405 |
| Female | 1,046 (47.4%) | $50,821 |
| Total | 2,208 (100.0%) | $54,049 |
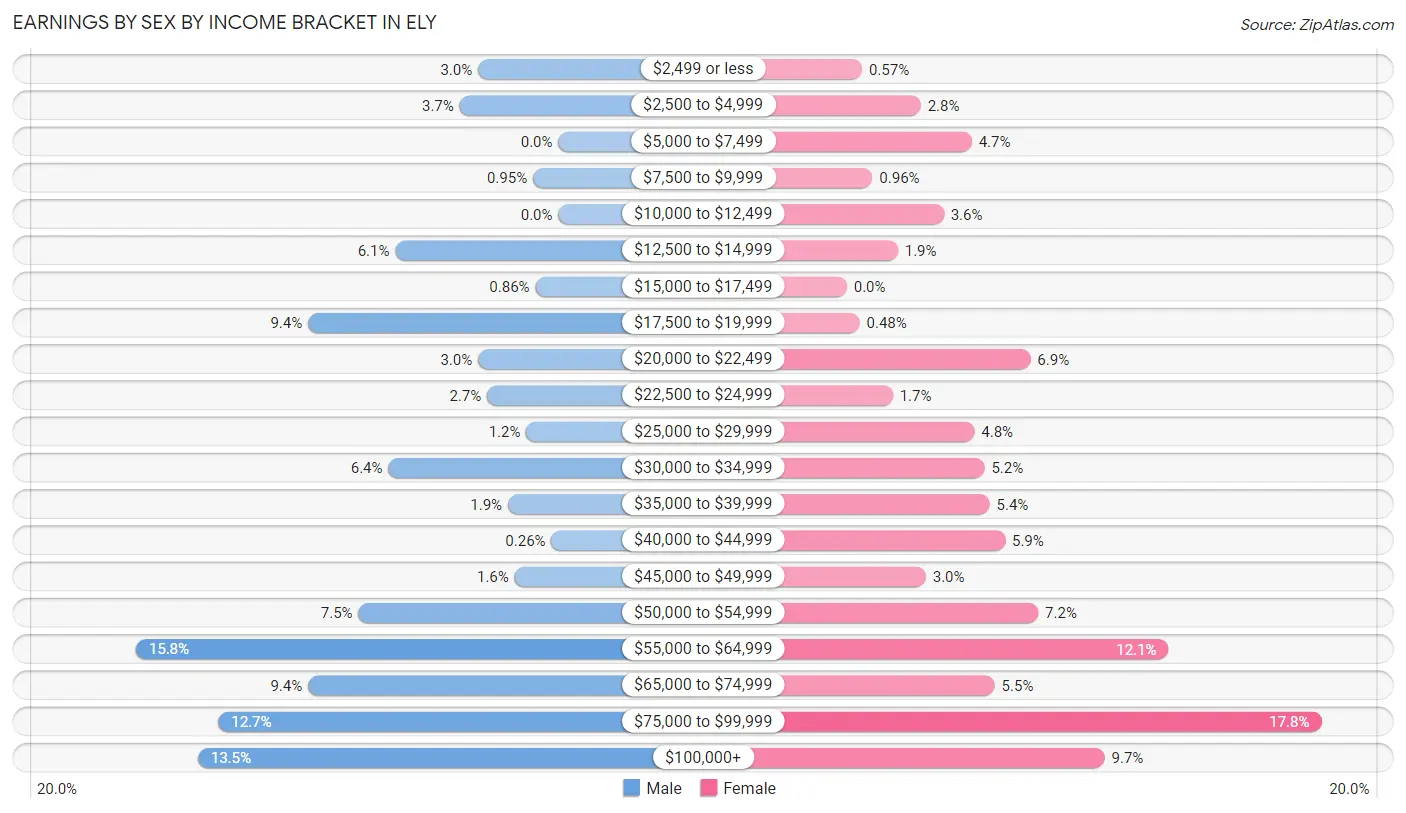
Earnings by Sex by Income Bracket in Ely
The most common earnings brackets in Ely are $55,000 to $64,999 for men (184 | 15.8%) and $75,000 to $99,999 for women (186 | 17.8%).
| Income | Male | Female |
| $2,499 or less | 35 (3.0%) | 6 (0.6%) |
| $2,500 to $4,999 | 43 (3.7%) | 29 (2.8%) |
| $5,000 to $7,499 | 0 (0.0%) | 49 (4.7%) |
| $7,500 to $9,999 | 11 (0.9%) | 10 (1.0%) |
| $10,000 to $12,499 | 0 (0.0%) | 38 (3.6%) |
| $12,500 to $14,999 | 71 (6.1%) | 20 (1.9%) |
| $15,000 to $17,499 | 10 (0.9%) | 0 (0.0%) |
| $17,500 to $19,999 | 109 (9.4%) | 5 (0.5%) |
| $20,000 to $22,499 | 35 (3.0%) | 72 (6.9%) |
| $22,500 to $24,999 | 31 (2.7%) | 18 (1.7%) |
| $25,000 to $29,999 | 14 (1.2%) | 50 (4.8%) |
| $30,000 to $34,999 | 74 (6.4%) | 54 (5.2%) |
| $35,000 to $39,999 | 22 (1.9%) | 56 (5.3%) |
| $40,000 to $44,999 | 3 (0.3%) | 62 (5.9%) |
| $45,000 to $49,999 | 19 (1.6%) | 31 (3.0%) |
| $50,000 to $54,999 | 87 (7.5%) | 75 (7.2%) |
| $55,000 to $64,999 | 184 (15.8%) | 126 (12.0%) |
| $65,000 to $74,999 | 109 (9.4%) | 58 (5.5%) |
| $75,000 to $99,999 | 148 (12.7%) | 186 (17.8%) |
| $100,000+ | 157 (13.5%) | 101 (9.7%) |
| Total | 1,162 (100.0%) | 1,046 (100.0%) |
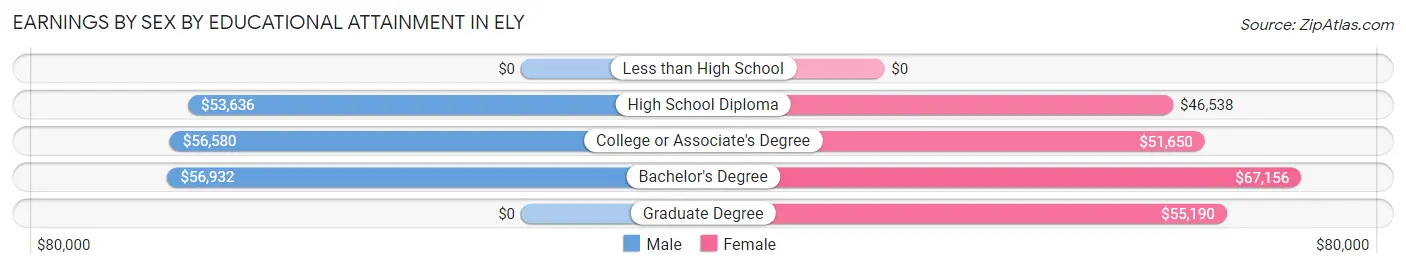
Earnings by Sex by Educational Attainment in Ely
Average earnings in Ely are $55,843 for men and $55,100 for women, a difference of 1.3%. Men with an educational attainment of bachelor's degree enjoy the highest average annual earnings of $56,932, while those with high school diploma education earn the least with $53,636. Women with an educational attainment of bachelor's degree earn the most with the average annual earnings of $67,156, while those with high school diploma education have the smallest earnings of $46,538.
| Educational Attainment | Male Income | Female Income |
| Less than High School | - | - |
| High School Diploma | $53,636 | $46,538 |
| College or Associate's Degree | $56,580 | $51,650 |
| Bachelor's Degree | $56,932 | $67,156 |
| Graduate Degree | - | - |
| Total | $55,843 | $55,100 |
Family Income in Ely
Family Income Brackets in Ely
According to the Ely family income data, there are 417 families falling into the $100,000 to $149,999 income range, which is the most common income bracket and makes up 36.6% of all families.
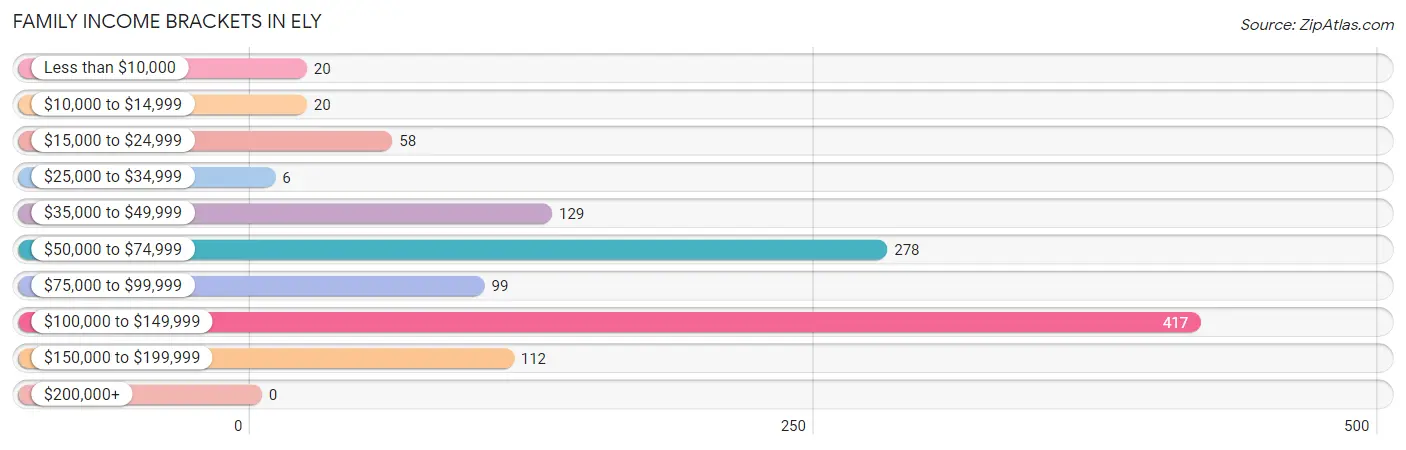
| Income Bracket | # Families | % Families |
| Less than $10,000 | 20 | 1.8% |
| $10,000 to $14,999 | 20 | 1.8% |
| $15,000 to $24,999 | 58 | 5.1% |
| $25,000 to $34,999 | 6 | 0.5% |
| $35,000 to $49,999 | 129 | 11.3% |
| $50,000 to $74,999 | 278 | 24.4% |
| $75,000 to $99,999 | 99 | 8.7% |
| $100,000 to $149,999 | 417 | 36.6% |
| $150,000 to $199,999 | 112 | 9.8% |
| $200,000+ | 0 | 0.0% |
Family Income by Famaliy Size in Ely
7+ person families (86 | 7.6%) account for the highest median family income in Ely with $121,667 per family, while 3-person families (207 | 18.2%) have the highest median income of $37,405 per family member.
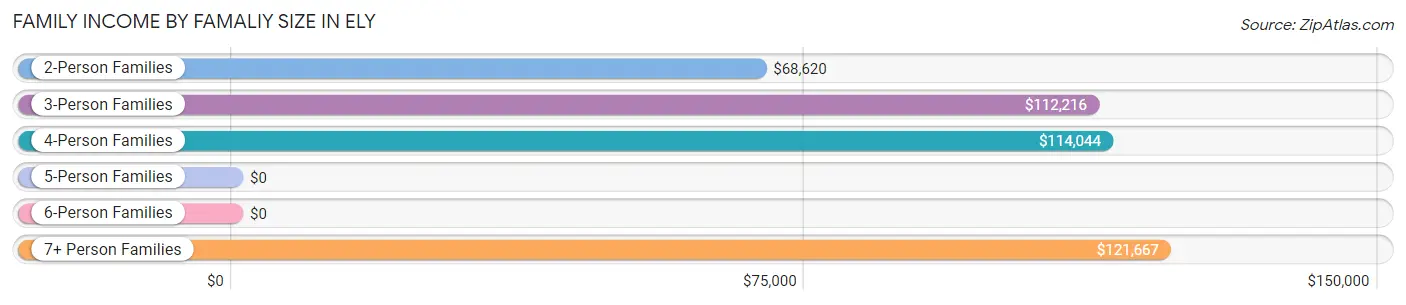
| Income Bracket | # Families | Median Income |
| 2-Person Families | 634 (55.7%) | $68,620 |
| 3-Person Families | 207 (18.2%) | $112,216 |
| 4-Person Families | 191 (16.8%) | $114,044 |
| 5-Person Families | 9 (0.8%) | $0 |
| 6-Person Families | 11 (1.0%) | $0 |
| 7+ Person Families | 86 (7.6%) | $121,667 |
| Total | 1,138 (100.0%) | $96,667 |
Family Income by Number of Earners in Ely
The median family income in Ely is $96,667, with families comprising 2 earners (579) having the highest median family income of $129,688, while families with no earners (180) have the lowest median family income of $46,792, accounting for 50.9% and 15.8% of families, respectively.
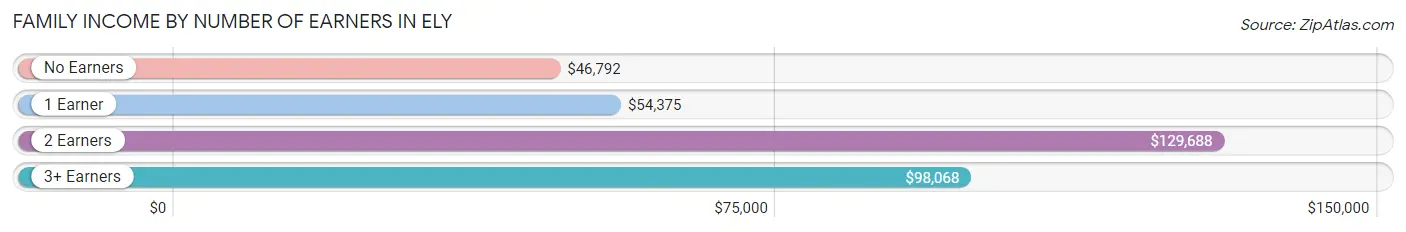
| Number of Earners | # Families | Median Income |
| No Earners | 180 (15.8%) | $46,792 |
| 1 Earner | 296 (26.0%) | $54,375 |
| 2 Earners | 579 (50.9%) | $129,688 |
| 3+ Earners | 83 (7.3%) | $98,068 |
| Total | 1,138 (100.0%) | $96,667 |
Household Income in Ely
Household Income Brackets in Ely
With 485 households falling in the category, the $100,000 to $149,999 income range is the most frequent in Ely, accounting for 27.8% of all households. In contrast, only 49 households (2.8%) fall into the $200,000+ income bracket, making it the least populous group.
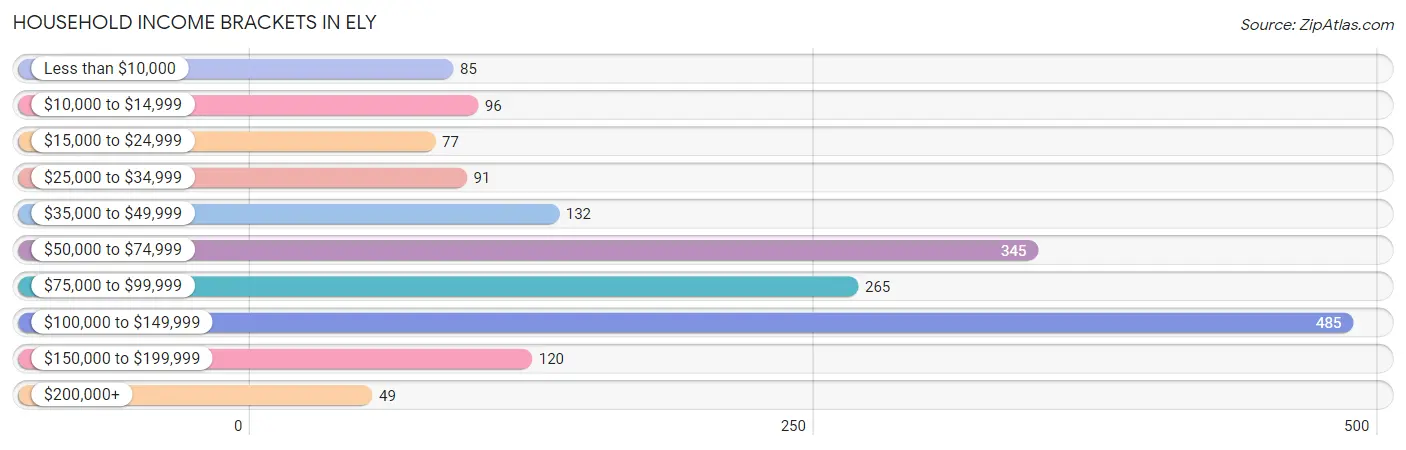
| Income Bracket | # Households | % Households |
| Less than $10,000 | 85 | 4.9% |
| $10,000 to $14,999 | 96 | 5.5% |
| $15,000 to $24,999 | 77 | 4.4% |
| $25,000 to $34,999 | 91 | 5.2% |
| $35,000 to $49,999 | 132 | 7.6% |
| $50,000 to $74,999 | 345 | 19.8% |
| $75,000 to $99,999 | 265 | 15.2% |
| $100,000 to $149,999 | 485 | 27.8% |
| $150,000 to $199,999 | 120 | 6.9% |
| $200,000+ | 49 | 2.8% |
Household Income by Householder Age in Ely
The median household income in Ely is $77,076, with the highest median household income of $104,318 found in the 25 to 44 years age bracket for the primary householder. A total of 754 households (43.3%) fall into this category. Meanwhile, the 15 to 24 years age bracket for the primary householder has the lowest median household income of $0, with 67 households (3.8%) in this group.
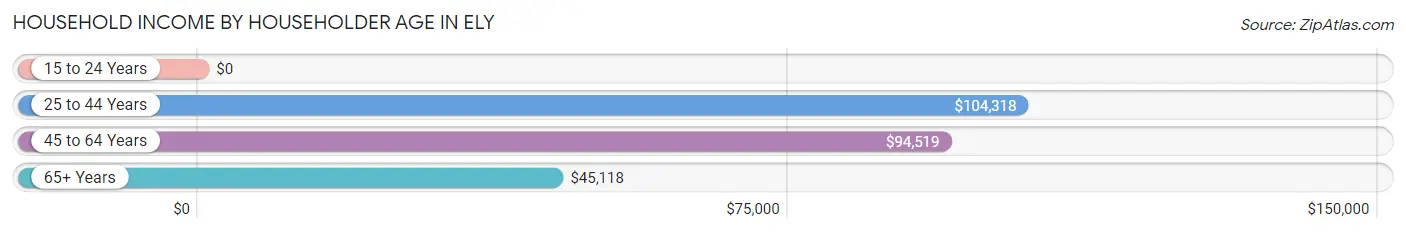
| Income Bracket | # Households | Median Income |
| 15 to 24 Years | 67 (3.8%) | $0 |
| 25 to 44 Years | 754 (43.3%) | $104,318 |
| 45 to 64 Years | 465 (26.7%) | $94,519 |
| 65+ Years | 457 (26.2%) | $45,118 |
| Total | 1,743 (100.0%) | $77,076 |
Poverty in Ely
Income Below Poverty by Sex and Age in Ely
With 6.7% poverty level for males and 12.2% for females among the residents of Ely, 16 and 17 year old males and 75 year old and over females are the most vulnerable to poverty, with 33 males (57.9%) and 37 females (30.3%) in their respective age groups living below the poverty level.
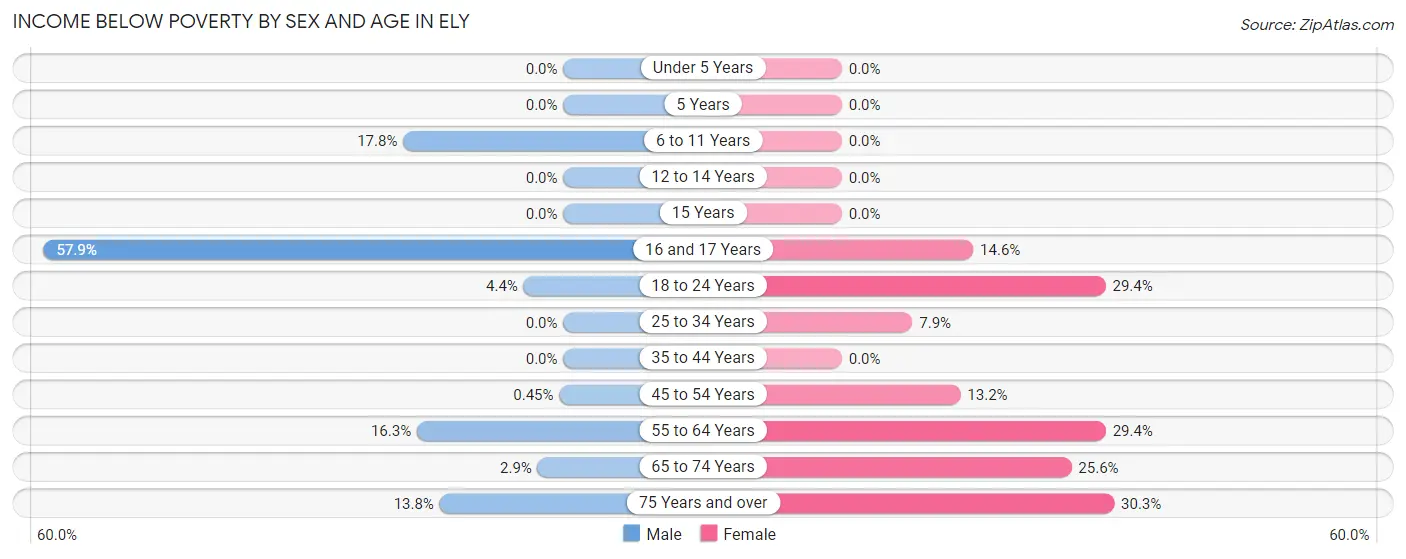
| Age Bracket | Male | Female |
| Under 5 Years | 0 (0.0%) | 0 (0.0%) |
| 5 Years | 0 (0.0%) | 0 (0.0%) |
| 6 to 11 Years | 23 (17.8%) | 0 (0.0%) |
| 12 to 14 Years | 0 (0.0%) | 0 (0.0%) |
| 15 Years | 0 (0.0%) | 0 (0.0%) |
| 16 and 17 Years | 33 (57.9%) | 6 (14.6%) |
| 18 to 24 Years | 5 (4.4%) | 37 (29.4%) |
| 25 to 34 Years | 0 (0.0%) | 18 (7.9%) |
| 35 to 44 Years | 0 (0.0%) | 0 (0.0%) |
| 45 to 54 Years | 1 (0.4%) | 21 (13.2%) |
| 55 to 64 Years | 37 (16.3%) | 72 (29.4%) |
| 65 to 74 Years | 6 (2.9%) | 45 (25.6%) |
| 75 Years and over | 23 (13.8%) | 37 (30.3%) |
| Total | 128 (6.7%) | 236 (12.2%) |
Income Above Poverty by Sex and Age in Ely
According to the poverty statistics in Ely, males aged under 5 years and females aged under 5 years are the age groups that are most secure financially, with 100.0% of males and 100.0% of females in these age groups living above the poverty line.
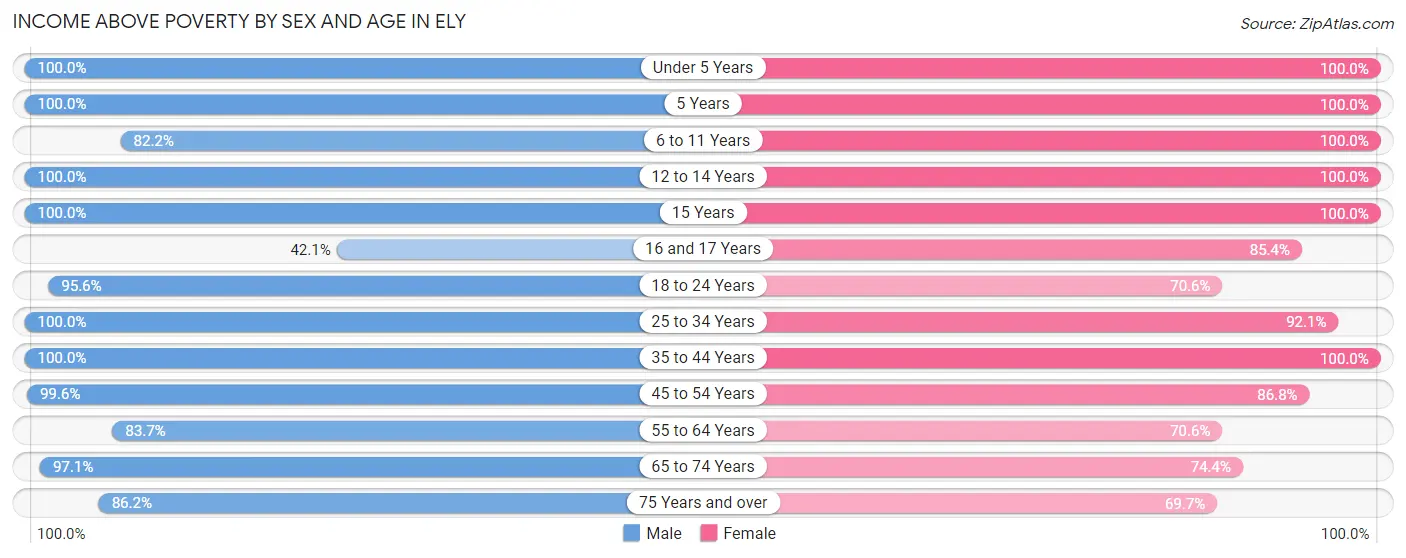
| Age Bracket | Male | Female |
| Under 5 Years | 74 (100.0%) | 156 (100.0%) |
| 5 Years | 34 (100.0%) | 26 (100.0%) |
| 6 to 11 Years | 106 (82.2%) | 133 (100.0%) |
| 12 to 14 Years | 105 (100.0%) | 80 (100.0%) |
| 15 Years | 23 (100.0%) | 41 (100.0%) |
| 16 and 17 Years | 24 (42.1%) | 35 (85.4%) |
| 18 to 24 Years | 108 (95.6%) | 89 (70.6%) |
| 25 to 34 Years | 243 (100.0%) | 211 (92.1%) |
| 35 to 44 Years | 320 (100.0%) | 392 (100.0%) |
| 45 to 54 Years | 221 (99.6%) | 138 (86.8%) |
| 55 to 64 Years | 190 (83.7%) | 173 (70.6%) |
| 65 to 74 Years | 204 (97.1%) | 131 (74.4%) |
| 75 Years and over | 144 (86.2%) | 85 (69.7%) |
| Total | 1,796 (93.3%) | 1,690 (87.7%) |
Income Below Poverty Among Married-Couple Families in Ely
The poverty statistics for married-couple families in Ely show that 2.5% or 21 of the total 830 families live below the poverty line. Families with no children have the highest poverty rate of 3.7%, comprising of 21 families. On the other hand, families with 1 or 2 children have the lowest poverty rate of 0.0%, which includes 0 families.
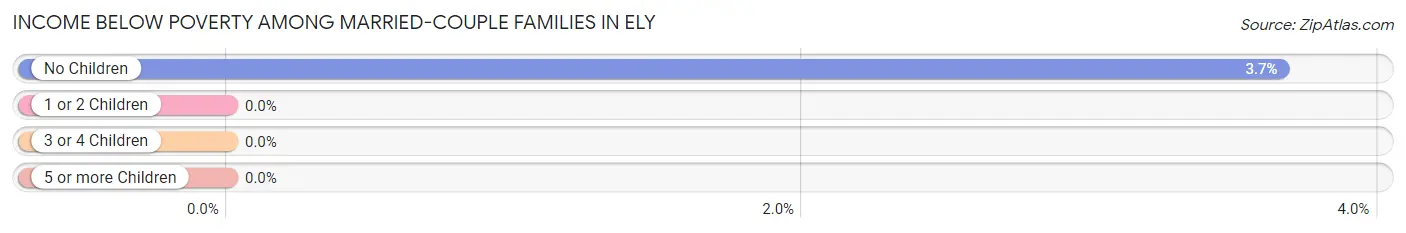
| Children | Above Poverty | Below Poverty |
| No Children | 553 (96.3%) | 21 (3.7%) |
| 1 or 2 Children | 209 (100.0%) | 0 (0.0%) |
| 3 or 4 Children | 22 (100.0%) | 0 (0.0%) |
| 5 or more Children | 25 (100.0%) | 0 (0.0%) |
| Total | 809 (97.5%) | 21 (2.5%) |
Income Below Poverty Among Single-Parent Households in Ely
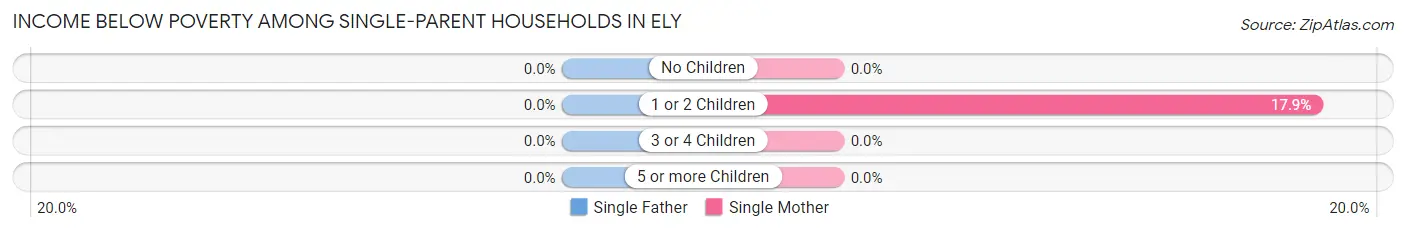
| Children | Single Father | Single Mother |
| No Children | 0 (0.0%) | 0 (0.0%) |
| 1 or 2 Children | 0 (0.0%) | 20 (17.9%) |
| 3 or 4 Children | 0 (0.0%) | 0 (0.0%) |
| 5 or more Children | 0 (0.0%) | 0 (0.0%) |
| Total | 0 (0.0%) | 20 (10.6%) |
Income Below Poverty Among Married-Couple vs Single-Parent Households in Ely
The poverty data for Ely shows that 21 of the married-couple family households (2.5%) and 20 of the single-parent households (6.5%) are living below the poverty level. Within the married-couple family households, those with no children have the highest poverty rate, with 21 households (3.7%) falling below the poverty line. Among the single-parent households, those with 1 or 2 children have the highest poverty rate, with 20 household (11.9%) living below poverty.
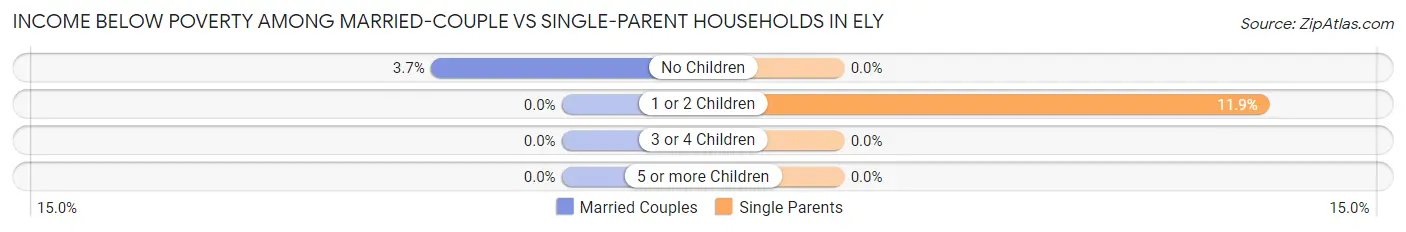
| Children | Married-Couple Families | Single-Parent Households |
| No Children | 21 (3.7%) | 0 (0.0%) |
| 1 or 2 Children | 0 (0.0%) | 20 (11.9%) |
| 3 or 4 Children | 0 (0.0%) | 0 (0.0%) |
| 5 or more Children | 0 (0.0%) | 0 (0.0%) |
| Total | 21 (2.5%) | 20 (6.5%) |
Race in Ely
The most populous races in Ely are White / Caucasian (3,390 | 85.7%), Hispanic or Latino (831 | 21.0%), and Native / Alaskan (232 | 5.9%).
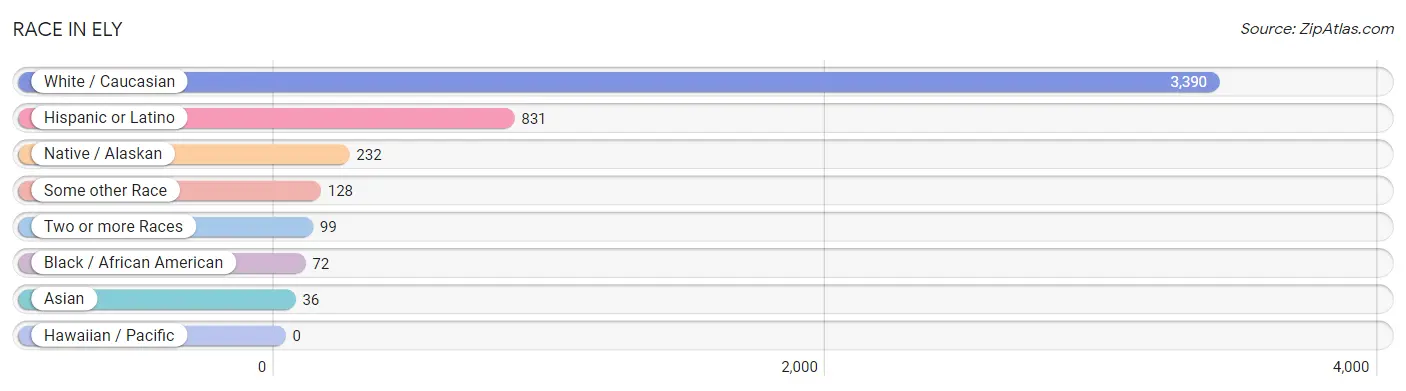
| Race | # Population | % Population |
| Asian | 36 | 0.9% |
| Black / African American | 72 | 1.8% |
| Hawaiian / Pacific | 0 | 0.0% |
| Hispanic or Latino | 831 | 21.0% |
| Native / Alaskan | 232 | 5.9% |
| White / Caucasian | 3,390 | 85.7% |
| Two or more Races | 99 | 2.5% |
| Some other Race | 128 | 3.2% |
| Total | 3,957 | 100.0% |
Ancestry in Ely
The most populous ancestries reported in Ely are English (482 | 12.2%), German (481 | 12.2%), Mexican (385 | 9.7%), American (272 | 6.9%), and Spanish (199 | 5.0%), together accounting for 46.0% of all Ely residents.
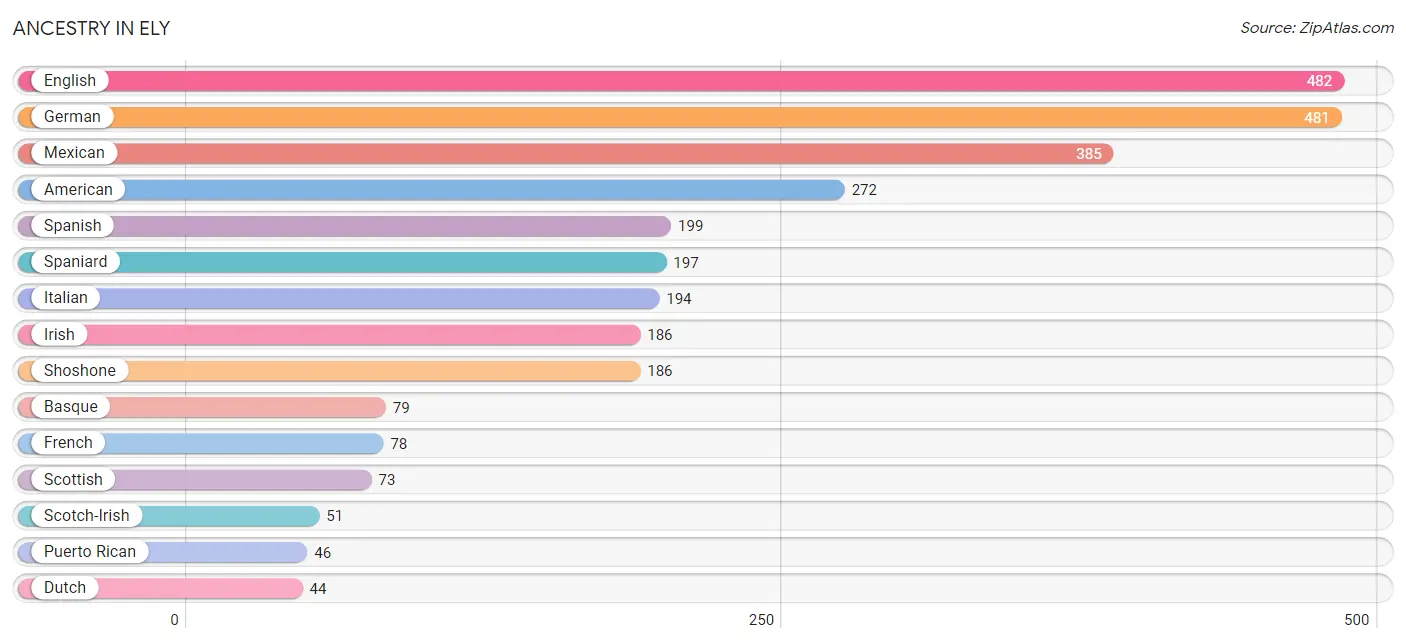
| Ancestry | # Population | % Population |
| American | 272 | 6.9% |
| Apache | 38 | 1.0% |
| Basque | 79 | 2.0% |
| Bhutanese | 6 | 0.2% |
| British | 6 | 0.2% |
| Burmese | 17 | 0.4% |
| Canadian | 2 | 0.1% |
| Colombian | 4 | 0.1% |
| Danish | 28 | 0.7% |
| Dutch | 44 | 1.1% |
| English | 482 | 12.2% |
| European | 38 | 1.0% |
| French | 78 | 2.0% |
| German | 481 | 12.2% |
| Hungarian | 12 | 0.3% |
| Icelander | 1 | 0.0% |
| Indian (Asian) | 13 | 0.3% |
| Irish | 186 | 4.7% |
| Italian | 194 | 4.9% |
| Korean | 6 | 0.2% |
| Mexican | 385 | 9.7% |
| Native Hawaiian | 24 | 0.6% |
| New Zealander | 6 | 0.2% |
| Northern European | 9 | 0.2% |
| Norwegian | 25 | 0.6% |
| Osage | 5 | 0.1% |
| Paiute | 2 | 0.1% |
| Portuguese | 39 | 1.0% |
| Puerto Rican | 46 | 1.2% |
| Puget Sound Salish | 2 | 0.1% |
| Russian | 14 | 0.4% |
| Scandinavian | 29 | 0.7% |
| Scotch-Irish | 51 | 1.3% |
| Scottish | 73 | 1.8% |
| Shoshone | 186 | 4.7% |
| South American | 4 | 0.1% |
| Spaniard | 197 | 5.0% |
| Spanish | 199 | 5.0% |
| Swedish | 25 | 0.6% |
| Welsh | 5 | 0.1% | View All 40 Rows |
Immigrants in Ely
The most numerous immigrant groups reported in Ely came from Latin America (60 | 1.5%), Central America (56 | 1.4%), Mexico (56 | 1.4%), Asia (13 | 0.3%), and China (13 | 0.3%), together accounting for 5.0% of all Ely residents.
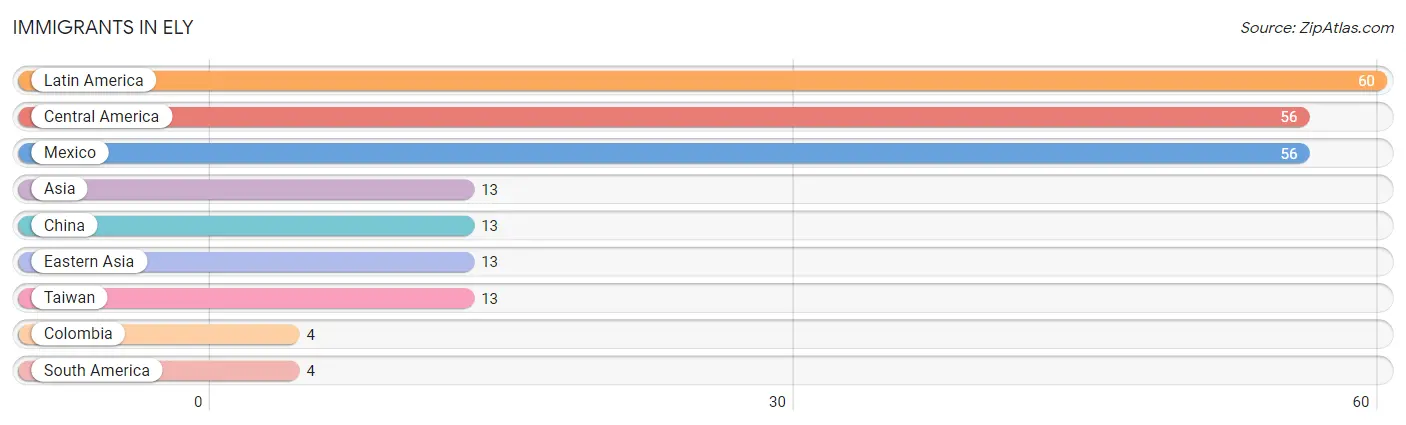
| Immigration Origin | # Population | % Population |
| Asia | 13 | 0.3% |
| Central America | 56 | 1.4% |
| China | 13 | 0.3% |
| Colombia | 4 | 0.1% |
| Eastern Asia | 13 | 0.3% |
| Latin America | 60 | 1.5% |
| Mexico | 56 | 1.4% |
| South America | 4 | 0.1% |
| Taiwan | 13 | 0.3% | View All 9 Rows |
Sex and Age in Ely
Sex and Age in Ely
The most populous age groups in Ely are 35 to 39 Years (192 | 9.8%) for men and Under 5 Years (203 | 10.2%) for women.
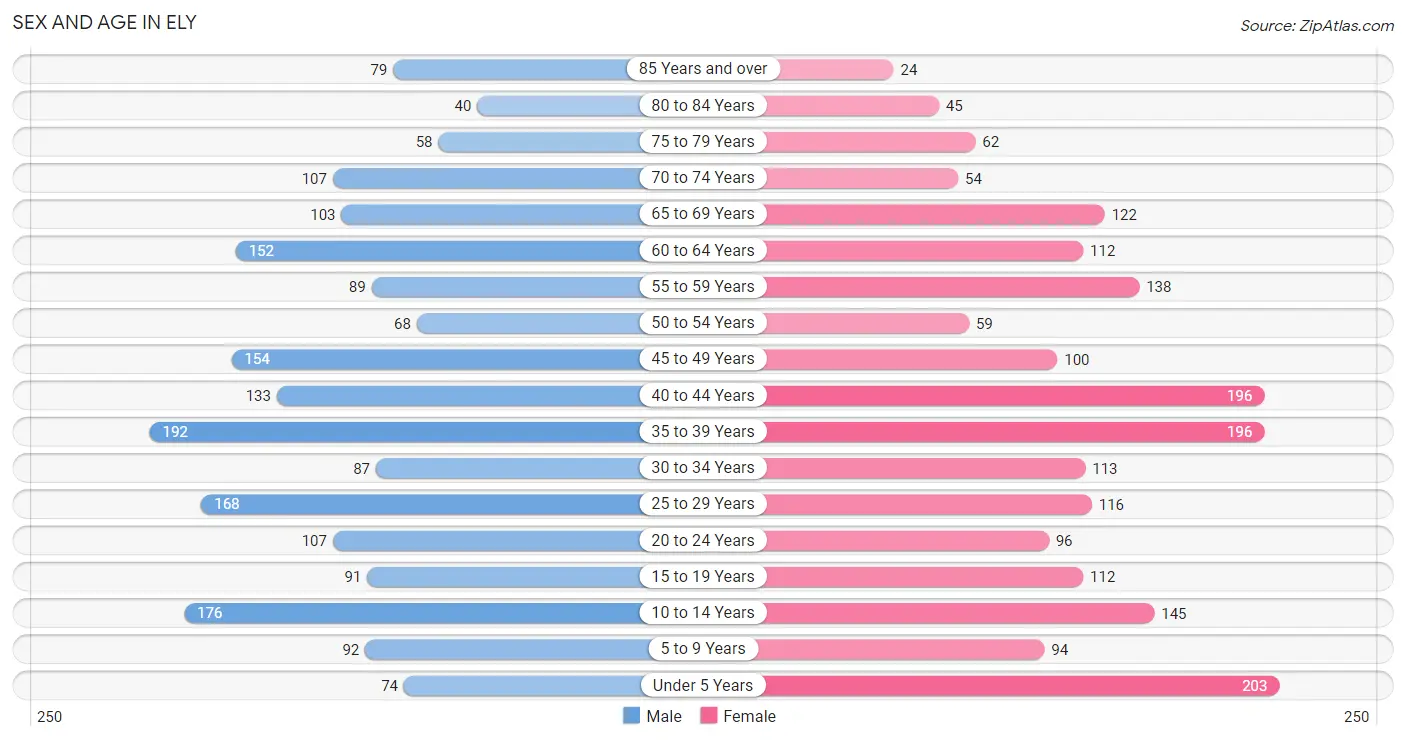
| Age Bracket | Male | Female |
| Under 5 Years | 74 (3.8%) | 203 (10.2%) |
| 5 to 9 Years | 92 (4.7%) | 94 (4.7%) |
| 10 to 14 Years | 176 (8.9%) | 145 (7.3%) |
| 15 to 19 Years | 91 (4.6%) | 112 (5.6%) |
| 20 to 24 Years | 107 (5.4%) | 96 (4.8%) |
| 25 to 29 Years | 168 (8.5%) | 116 (5.8%) |
| 30 to 34 Years | 87 (4.4%) | 113 (5.7%) |
| 35 to 39 Years | 192 (9.8%) | 196 (9.9%) |
| 40 to 44 Years | 133 (6.8%) | 196 (9.9%) |
| 45 to 49 Years | 154 (7.8%) | 100 (5.0%) |
| 50 to 54 Years | 68 (3.5%) | 59 (3.0%) |
| 55 to 59 Years | 89 (4.5%) | 138 (7.0%) |
| 60 to 64 Years | 152 (7.7%) | 112 (5.6%) |
| 65 to 69 Years | 103 (5.2%) | 122 (6.1%) |
| 70 to 74 Years | 107 (5.4%) | 54 (2.7%) |
| 75 to 79 Years | 58 (2.9%) | 62 (3.1%) |
| 80 to 84 Years | 40 (2.0%) | 45 (2.3%) |
| 85 Years and over | 79 (4.0%) | 24 (1.2%) |
| Total | 1,970 (100.0%) | 1,987 (100.0%) |
Families and Households in Ely
Median Family Size in Ely
The median family size in Ely is 2.56 persons per family, with married-couple families (830 | 72.9%) accounting for the largest median family size of 2.63 persons per family. On the other hand, single male/father families (120 | 10.5%) represent the smallest median family size with 2.10 persons per family.
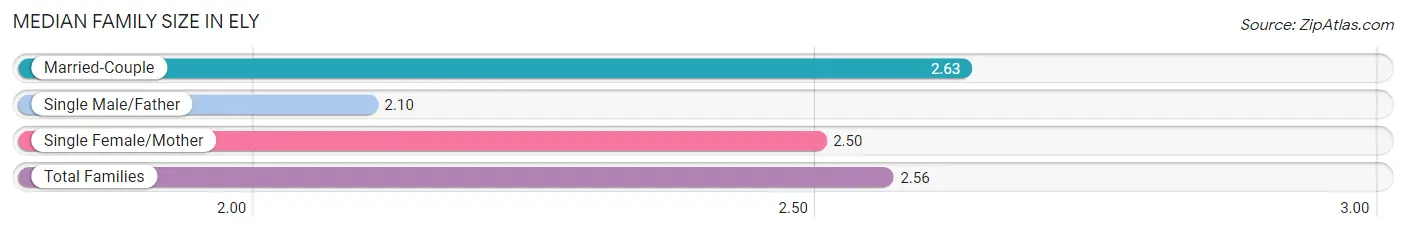
| Family Type | # Families | Family Size |
| Married-Couple | 830 (72.9%) | 2.63 |
| Single Male/Father | 120 (10.5%) | 2.10 |
| Single Female/Mother | 188 (16.5%) | 2.50 |
| Total Families | 1,138 (100.0%) | 2.56 |
Median Household Size in Ely
The median household size in Ely is 2.23 persons per household, with single female/mother households (188 | 10.8%) accounting for the largest median household size of 3.14 persons per household. non-family households (605 | 34.7%) represent the smallest median household size with 1.35 persons per household.
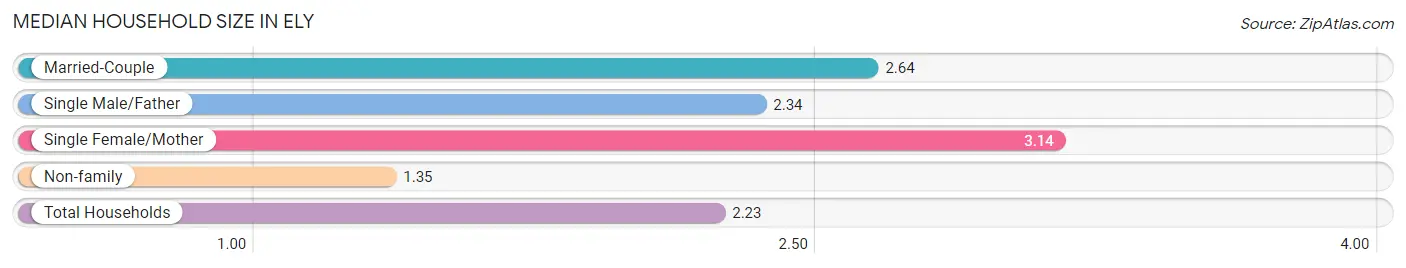
| Household Type | # Households | Household Size |
| Married-Couple | 830 (47.6%) | 2.64 |
| Single Male/Father | 120 (6.9%) | 2.34 |
| Single Female/Mother | 188 (10.8%) | 3.14 |
| Non-family | 605 (34.7%) | 1.35 |
| Total Households | 1,743 (100.0%) | 2.23 |
Household Size by Marriage Status in Ely
Out of a total of 1,743 households in Ely, 1,138 (65.3%) are family households, while 605 (34.7%) are nonfamily households. The most numerous type of family households are 2-person households, comprising 605, and the most common type of nonfamily households are 1-person households, comprising 489.
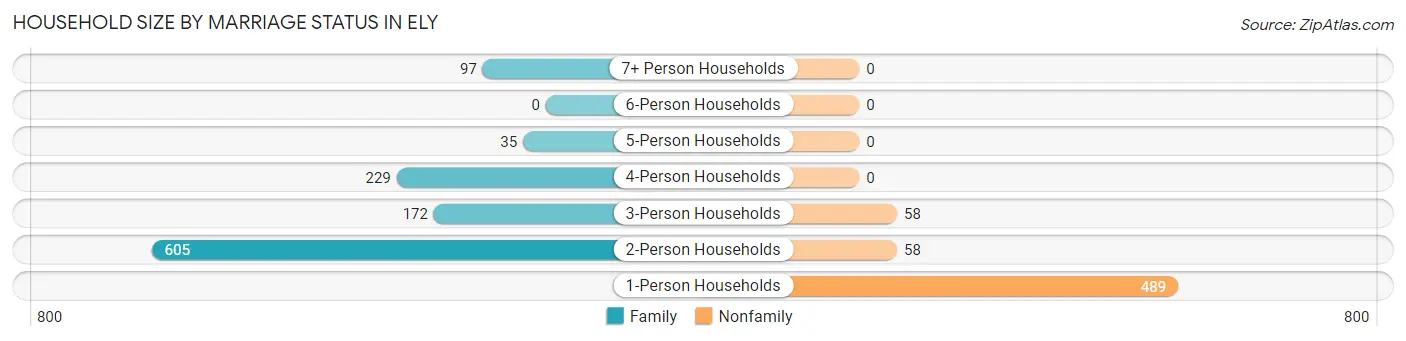
| Household Size | Family Households | Nonfamily Households |
| 1-Person Households | - | 489 (28.1%) |
| 2-Person Households | 605 (34.7%) | 58 (3.3%) |
| 3-Person Households | 172 (9.9%) | 58 (3.3%) |
| 4-Person Households | 229 (13.1%) | 0 (0.0%) |
| 5-Person Households | 35 (2.0%) | 0 (0.0%) |
| 6-Person Households | 0 (0.0%) | 0 (0.0%) |
| 7+ Person Households | 97 (5.6%) | 0 (0.0%) |
| Total | 1,138 (65.3%) | 605 (34.7%) |
Female Fertility in Ely
Fertility by Age in Ely
Average fertility rate in Ely is 12.0 births per 1,000 women. Women in the age bracket of 35 to 50 years have the highest fertility rate with 22.0 births per 1,000 women. Women in the age bracket of 35 to 50 years acount for 100.0% of all women with births.
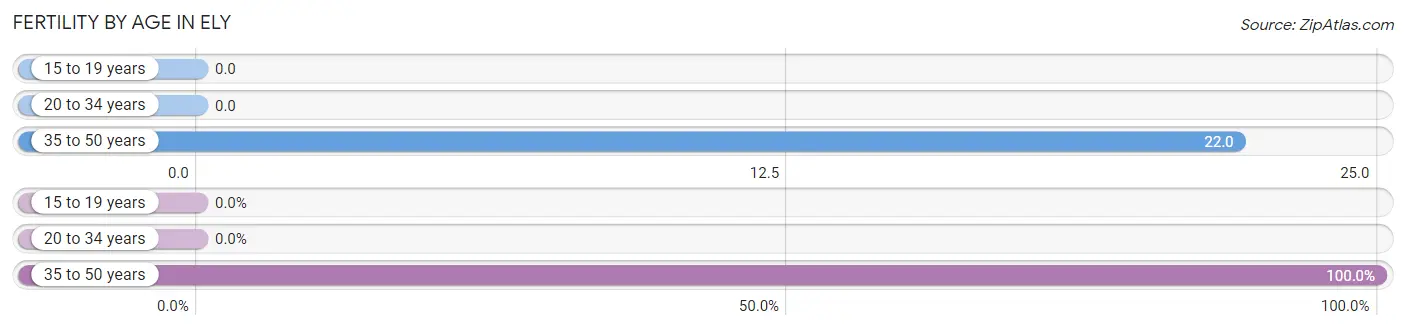
| Age Bracket | Women with Births | Births / 1,000 Women |
| 15 to 19 years | 0 (0.0%) | 0.0 |
| 20 to 34 years | 0 (0.0%) | 0.0 |
| 35 to 50 years | 11 (100.0%) | 22.0 |
| Total | 11 (100.0%) | 12.0 |
Fertility by Age by Marriage Status in Ely
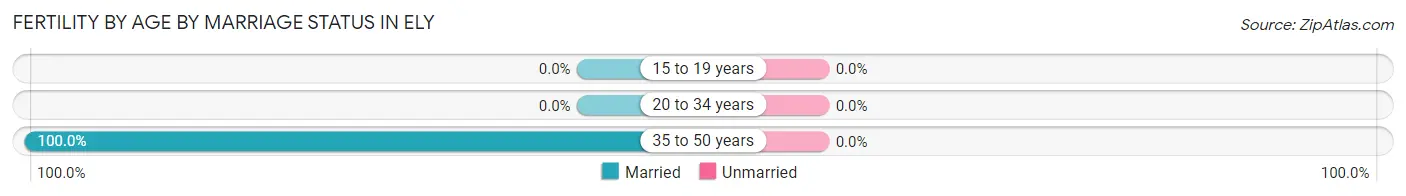
| Age Bracket | Married | Unmarried |
| 15 to 19 years | 0 (0.0%) | 0 (0.0%) |
| 20 to 34 years | 0 (0.0%) | 0 (0.0%) |
| 35 to 50 years | 11 (100.0%) | 0 (0.0%) |
| Total | 11 (100.0%) | 0 (0.0%) |
Fertility by Education in Ely
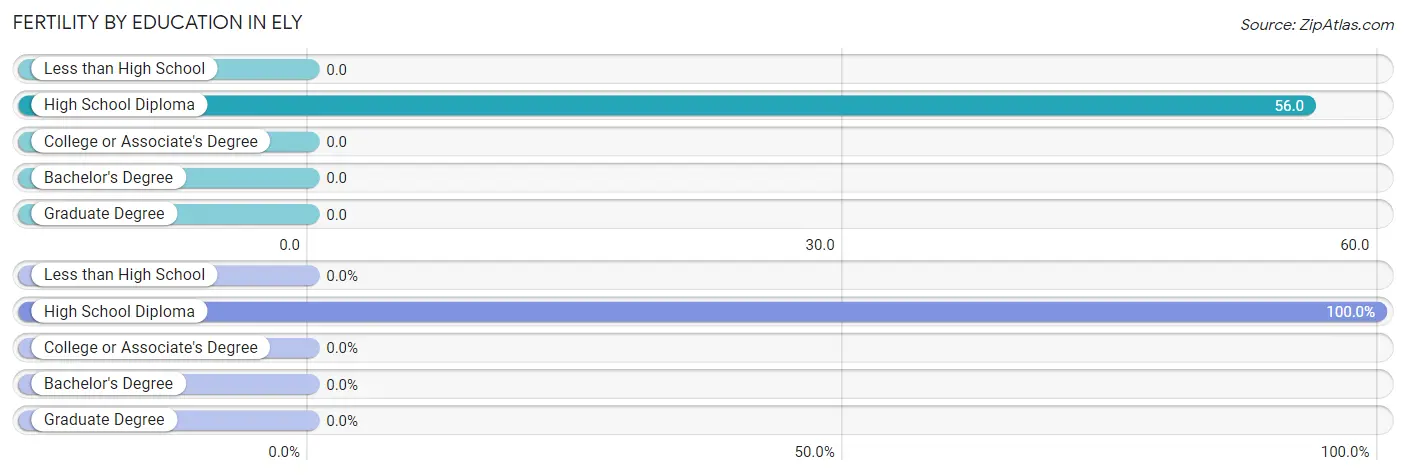
| Educational Attainment | Women with Births | Births / 1,000 Women |
| Less than High School | 0 (0.0%) | 0.0 |
| High School Diploma | 11 (100.0%) | 56.0 |
| College or Associate's Degree | 0 (0.0%) | 0.0 |
| Bachelor's Degree | 0 (0.0%) | 0.0 |
| Graduate Degree | 0 (0.0%) | 0.0 |
| Total | 11 (100.0%) | 12.0 |
Fertility by Education by Marriage Status in Ely
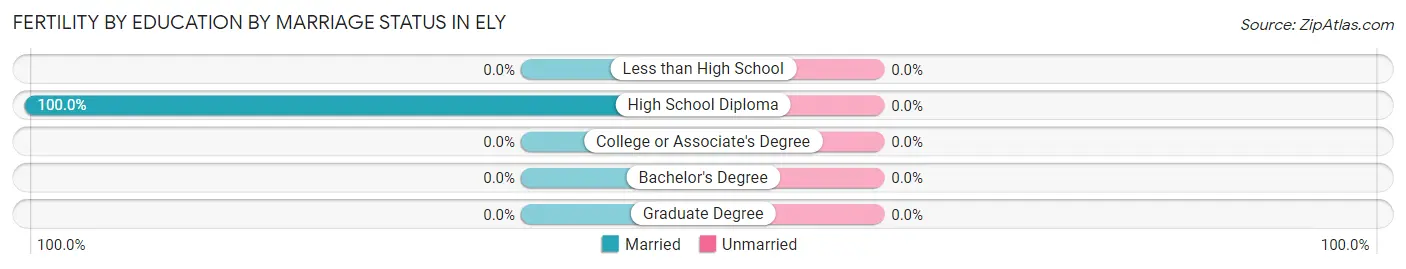
| Educational Attainment | Married | Unmarried |
| Less than High School | 0 (0.0%) | 0 (0.0%) |
| High School Diploma | 11 (100.0%) | 0 (0.0%) |
| College or Associate's Degree | 0 (0.0%) | 0 (0.0%) |
| Bachelor's Degree | 0 (0.0%) | 0 (0.0%) |
| Graduate Degree | 0 (0.0%) | 0 (0.0%) |
| Total | 11 (100.0%) | 0 (0.0%) |
Employment Characteristics in Ely
Employment by Class of Employer in Ely
Among the 2,024 employed individuals in Ely, private company employees (1,163 | 57.5%), state government employees (245 | 12.1%), and not-for-profit organizations (162 | 8.0%) make up the most common classes of employment.
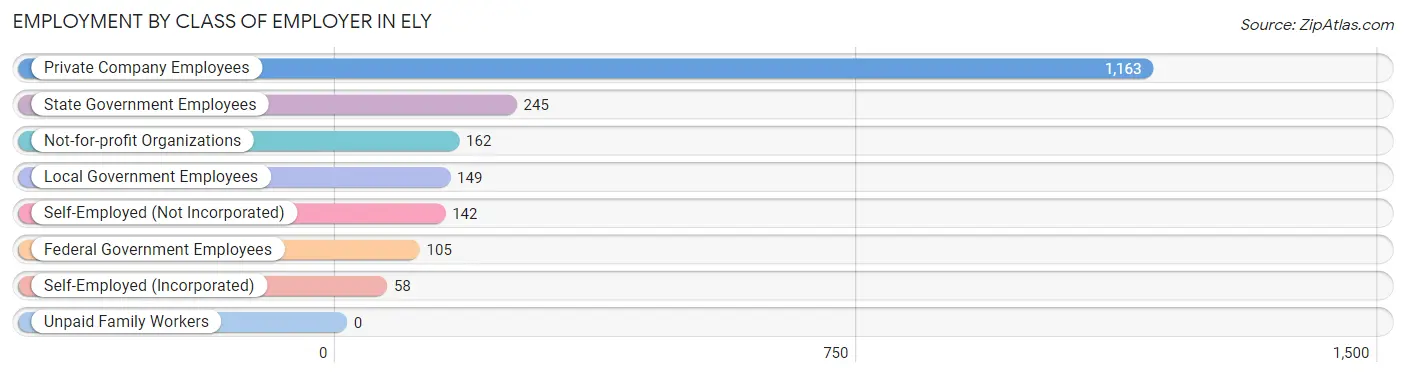
| Employer Class | # Employees | % Employees |
| Private Company Employees | 1,163 | 57.5% |
| Self-Employed (Incorporated) | 58 | 2.9% |
| Self-Employed (Not Incorporated) | 142 | 7.0% |
| Not-for-profit Organizations | 162 | 8.0% |
| Local Government Employees | 149 | 7.4% |
| State Government Employees | 245 | 12.1% |
| Federal Government Employees | 105 | 5.2% |
| Unpaid Family Workers | 0 | 0.0% |
| Total | 2,024 | 100.0% |
Employment Status by Age in Ely
According to the labor force statistics for Ely, out of the total population over 16 years of age (3,109), 69.3% or 2,155 individuals are in the labor force, with 3.9% or 84 of them unemployed. The age group with the highest labor force participation rate is 35 to 44 years, with 99.3% or 712 individuals in the labor force. Within the labor force, the 16 to 19 years age range has the highest percentage of unemployed individuals, with 11.8% or 6 of them being unemployed.
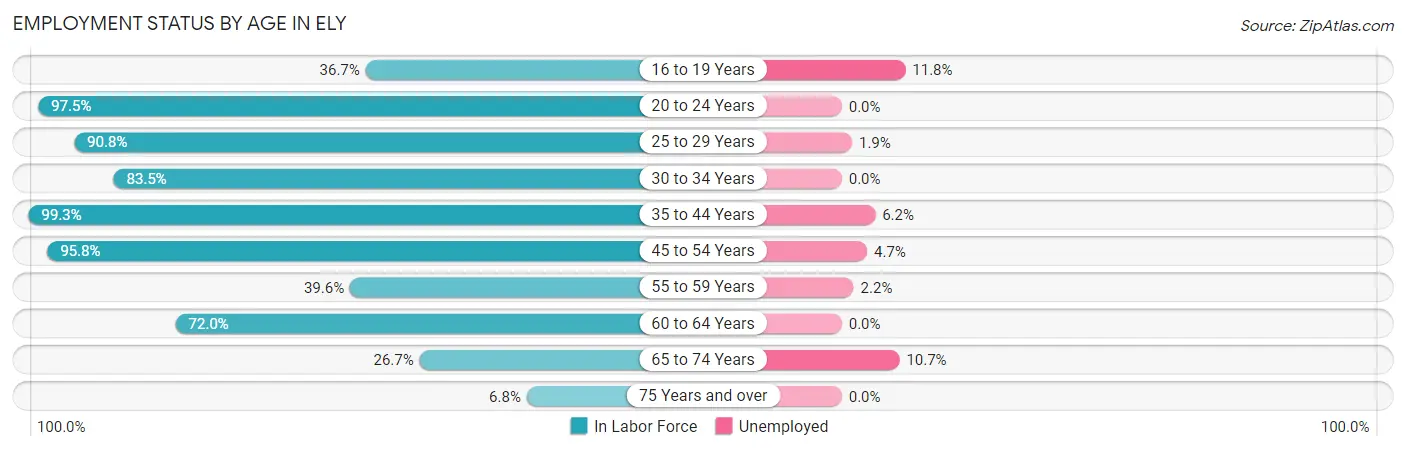
| Age Bracket | In Labor Force | Unemployed |
| 16 to 19 Years | 51 (36.7%) | 6 (11.8%) |
| 20 to 24 Years | 198 (97.5%) | 0 (0.0%) |
| 25 to 29 Years | 258 (90.8%) | 5 (1.9%) |
| 30 to 34 Years | 167 (83.5%) | 0 (0.0%) |
| 35 to 44 Years | 712 (99.3%) | 44 (6.2%) |
| 45 to 54 Years | 365 (95.8%) | 17 (4.7%) |
| 55 to 59 Years | 90 (39.6%) | 2 (2.2%) |
| 60 to 64 Years | 190 (72.0%) | 0 (0.0%) |
| 65 to 74 Years | 103 (26.7%) | 11 (10.7%) |
| 75 Years and over | 21 (6.8%) | 0 (0.0%) |
| Total | 2,155 (69.3%) | 84 (3.9%) |
Employment Status by Educational Attainment in Ely
According to labor force statistics for Ely, 86.0% of individuals (1,783) out of the total population between 25 and 64 years of age (2,073) are in the labor force, with 3.8% or 68 of them being unemployed. The group with the highest labor force participation rate are those with the educational attainment of bachelor's degree or higher, with 97.5% or 383 individuals in the labor force. Within the labor force, individuals with bachelor's degree or higher education have the highest percentage of unemployment, with 8.1% or 31 of them being unemployed.
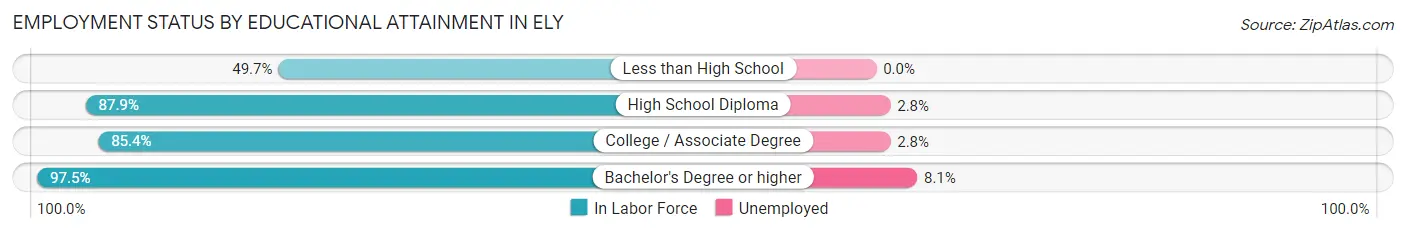
| Educational Attainment | In Labor Force | Unemployed |
| Less than High School | 75 (49.7%) | 0 (0.0%) |
| High School Diploma | 652 (87.9%) | 21 (2.8%) |
| College / Associate Degree | 672 (85.4%) | 22 (2.8%) |
| Bachelor's Degree or higher | 383 (97.5%) | 32 (8.1%) |
| Total | 1,783 (86.0%) | 79 (3.8%) |
Employment Occupations by Sex in Ely
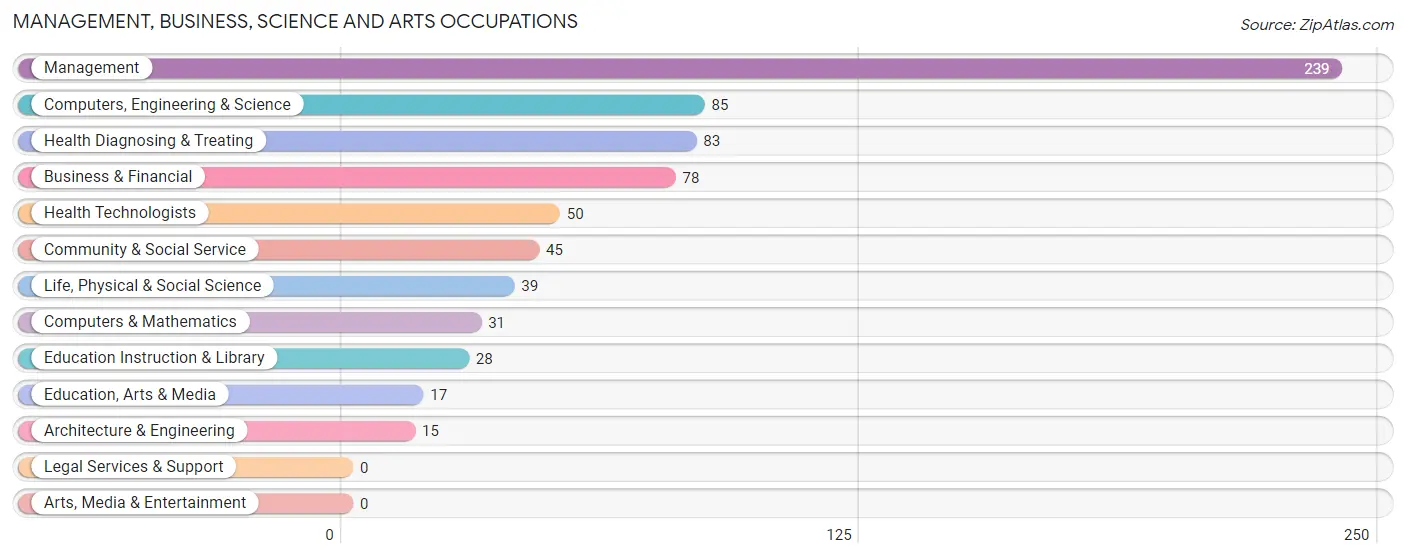
Management, Business, Science and Arts Occupations
The most common Management, Business, Science and Arts occupations in Ely are Management (239 | 11.6%), Computers, Engineering & Science (85 | 4.1%), Health Diagnosing & Treating (83 | 4.0%), Business & Financial (78 | 3.8%), and Health Technologists (50 | 2.4%).
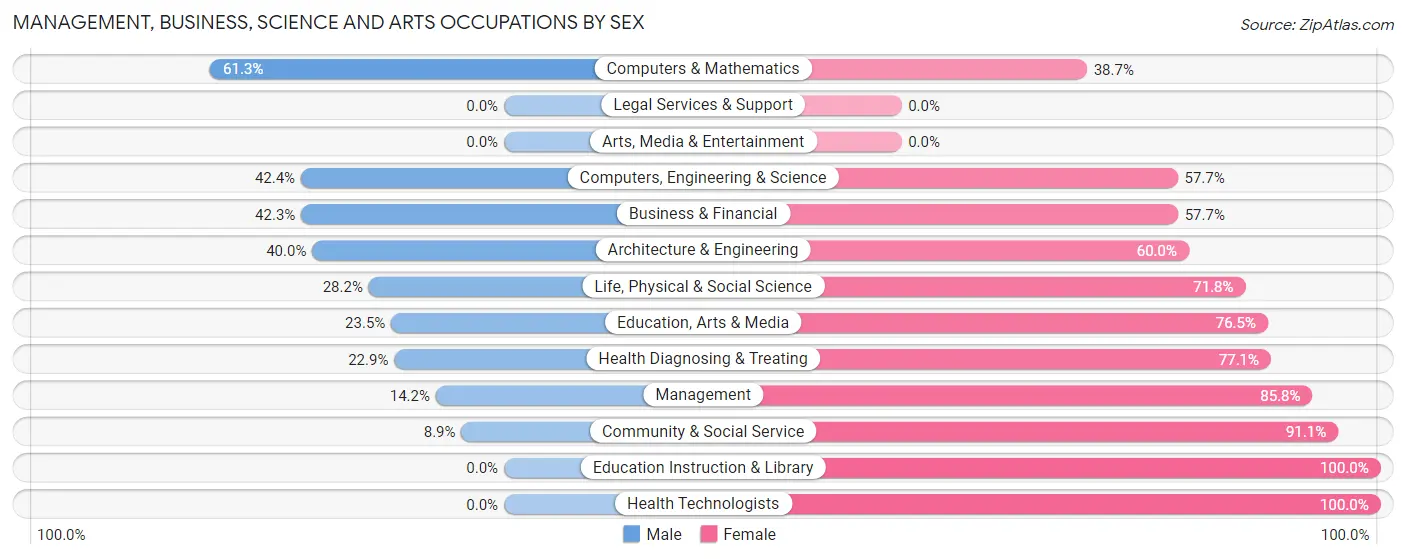
Management, Business, Science and Arts Occupations by Sex
Within the Management, Business, Science and Arts occupations in Ely, the most male-oriented occupations are Computers & Mathematics (61.3%), Computers, Engineering & Science (42.3%), and Business & Financial (42.3%), while the most female-oriented occupations are Education Instruction & Library (100.0%), Health Technologists (100.0%), and Community & Social Service (91.1%).
| Occupation | Male | Female |
| Management | 34 (14.2%) | 205 (85.8%) |
| Business & Financial | 33 (42.3%) | 45 (57.7%) |
| Computers, Engineering & Science | 36 (42.3%) | 49 (57.7%) |
| Computers & Mathematics | 19 (61.3%) | 12 (38.7%) |
| Architecture & Engineering | 6 (40.0%) | 9 (60.0%) |
| Life, Physical & Social Science | 11 (28.2%) | 28 (71.8%) |
| Community & Social Service | 4 (8.9%) | 41 (91.1%) |
| Education, Arts & Media | 4 (23.5%) | 13 (76.5%) |
| Legal Services & Support | 0 (0.0%) | 0 (0.0%) |
| Education Instruction & Library | 0 (0.0%) | 28 (100.0%) |
| Arts, Media & Entertainment | 0 (0.0%) | 0 (0.0%) |
| Health Diagnosing & Treating | 19 (22.9%) | 64 (77.1%) |
| Health Technologists | 0 (0.0%) | 50 (100.0%) |
| Total (Category) | 126 (23.8%) | 404 (76.2%) |
| Total (Overall) | 1,119 (54.1%) | 951 (45.9%) |
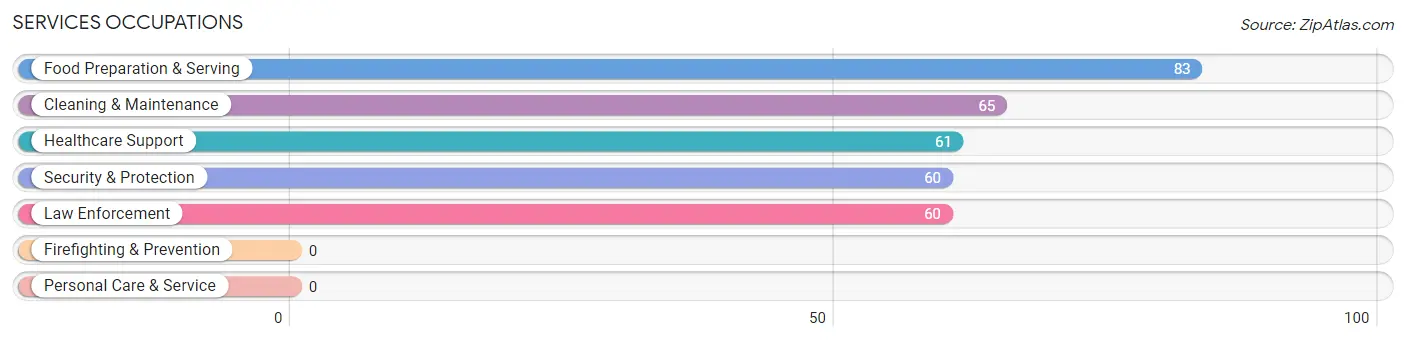
Services Occupations
The most common Services occupations in Ely are Food Preparation & Serving (83 | 4.0%), Cleaning & Maintenance (65 | 3.1%), Healthcare Support (61 | 2.9%), Security & Protection (60 | 2.9%), and Law Enforcement (60 | 2.9%).
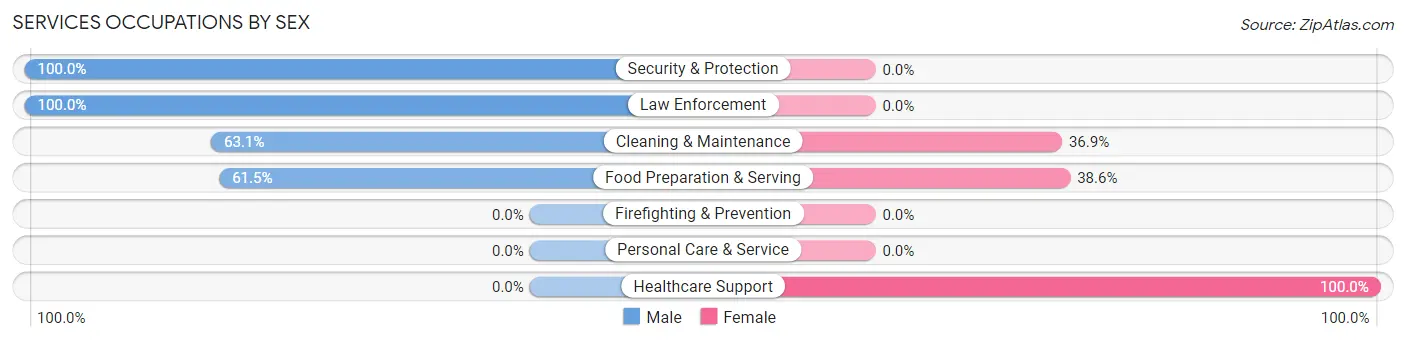
Services Occupations by Sex
Within the Services occupations in Ely, the most male-oriented occupations are Security & Protection (100.0%), Law Enforcement (100.0%), and Cleaning & Maintenance (63.1%), while the most female-oriented occupations are Healthcare Support (100.0%), Food Preparation & Serving (38.6%), and Cleaning & Maintenance (36.9%).
| Occupation | Male | Female |
| Healthcare Support | 0 (0.0%) | 61 (100.0%) |
| Security & Protection | 60 (100.0%) | 0 (0.0%) |
| Firefighting & Prevention | 0 (0.0%) | 0 (0.0%) |
| Law Enforcement | 60 (100.0%) | 0 (0.0%) |
| Food Preparation & Serving | 51 (61.5%) | 32 (38.6%) |
| Cleaning & Maintenance | 41 (63.1%) | 24 (36.9%) |
| Personal Care & Service | 0 (0.0%) | 0 (0.0%) |
| Total (Category) | 152 (56.5%) | 117 (43.5%) |
| Total (Overall) | 1,119 (54.1%) | 951 (45.9%) |
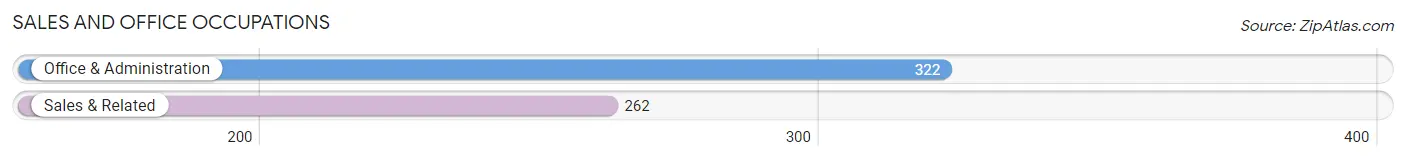
Sales and Office Occupations
The most common Sales and Office occupations in Ely are Office & Administration (322 | 15.6%), and Sales & Related (262 | 12.7%).
Sales and Office Occupations by Sex
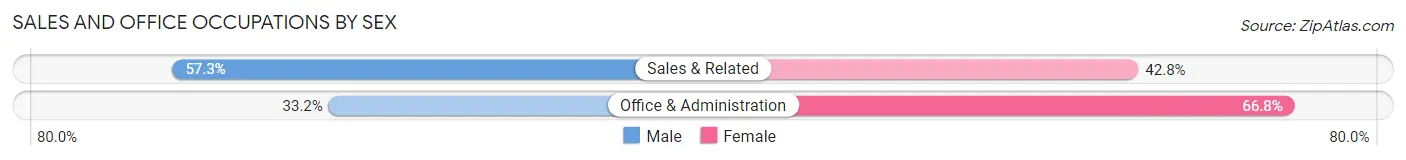
| Occupation | Male | Female |
| Sales & Related | 150 (57.3%) | 112 (42.7%) |
| Office & Administration | 107 (33.2%) | 215 (66.8%) |
| Total (Category) | 257 (44.0%) | 327 (56.0%) |
| Total (Overall) | 1,119 (54.1%) | 951 (45.9%) |
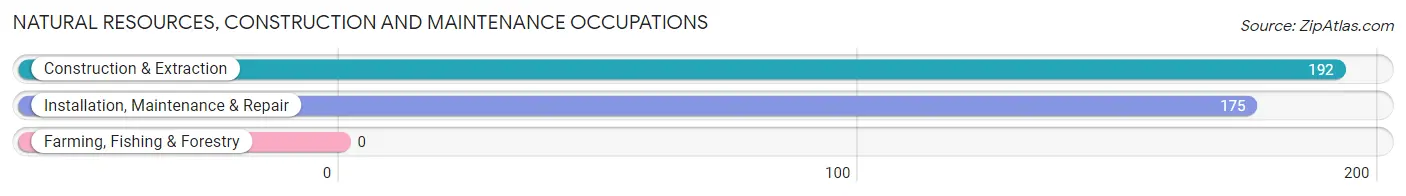
Natural Resources, Construction and Maintenance Occupations
The most common Natural Resources, Construction and Maintenance occupations in Ely are Construction & Extraction (192 | 9.3%), and Installation, Maintenance & Repair (175 | 8.5%).
Natural Resources, Construction and Maintenance Occupations by Sex
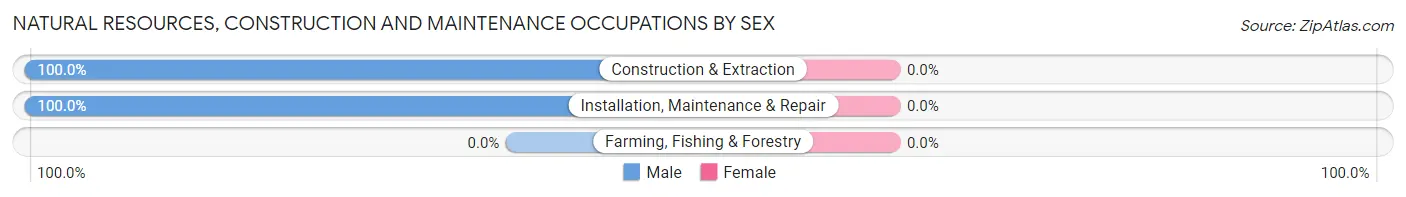
| Occupation | Male | Female |
| Farming, Fishing & Forestry | 0 (0.0%) | 0 (0.0%) |
| Construction & Extraction | 192 (100.0%) | 0 (0.0%) |
| Installation, Maintenance & Repair | 175 (100.0%) | 0 (0.0%) |
| Total (Category) | 367 (100.0%) | 0 (0.0%) |
| Total (Overall) | 1,119 (54.1%) | 951 (45.9%) |
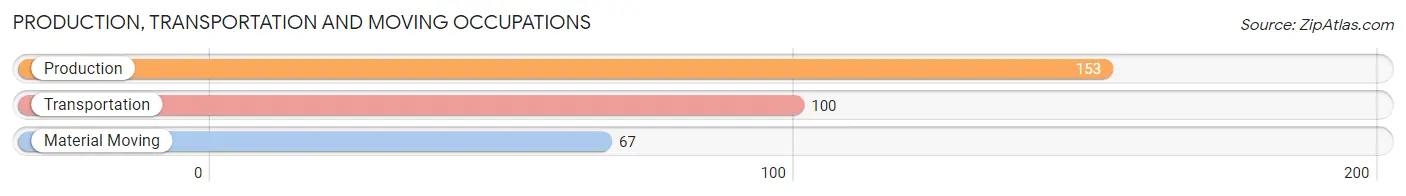
Production, Transportation and Moving Occupations
The most common Production, Transportation and Moving occupations in Ely are Production (153 | 7.4%), Transportation (100 | 4.8%), and Material Moving (67 | 3.2%).
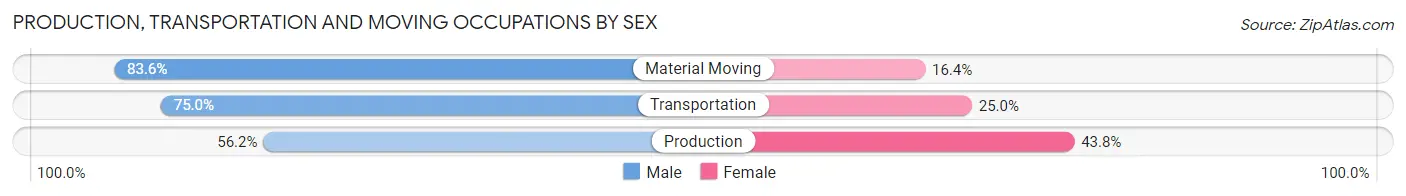
Production, Transportation and Moving Occupations by Sex
| Occupation | Male | Female |
| Production | 86 (56.2%) | 67 (43.8%) |
| Transportation | 75 (75.0%) | 25 (25.0%) |
| Material Moving | 56 (83.6%) | 11 (16.4%) |
| Total (Category) | 217 (67.8%) | 103 (32.2%) |
| Total (Overall) | 1,119 (54.1%) | 951 (45.9%) |
Employment Industries by Sex in Ely
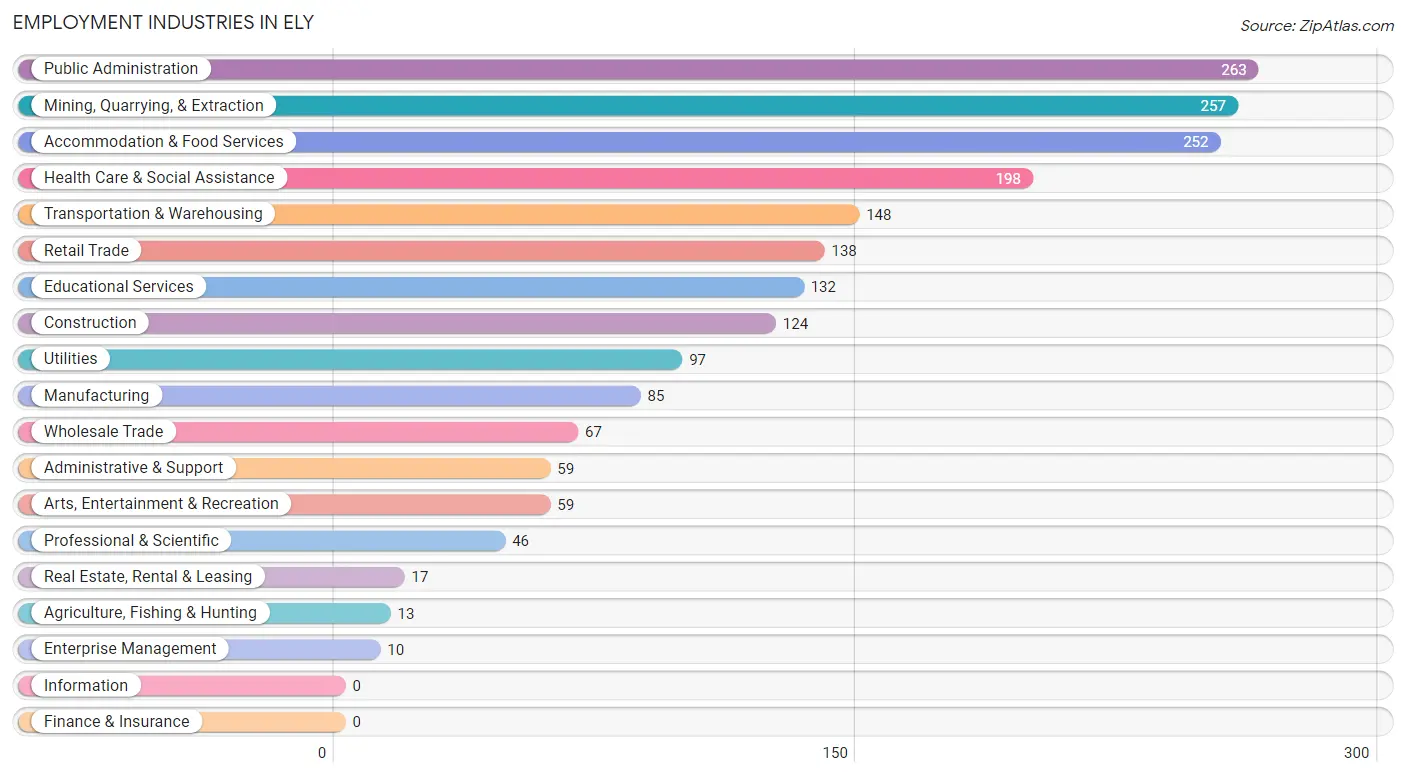
Employment Industries in Ely
The major employment industries in Ely include Public Administration (263 | 12.7%), Mining, Quarrying, & Extraction (257 | 12.4%), Accommodation & Food Services (252 | 12.2%), Health Care & Social Assistance (198 | 9.6%), and Transportation & Warehousing (148 | 7.1%).
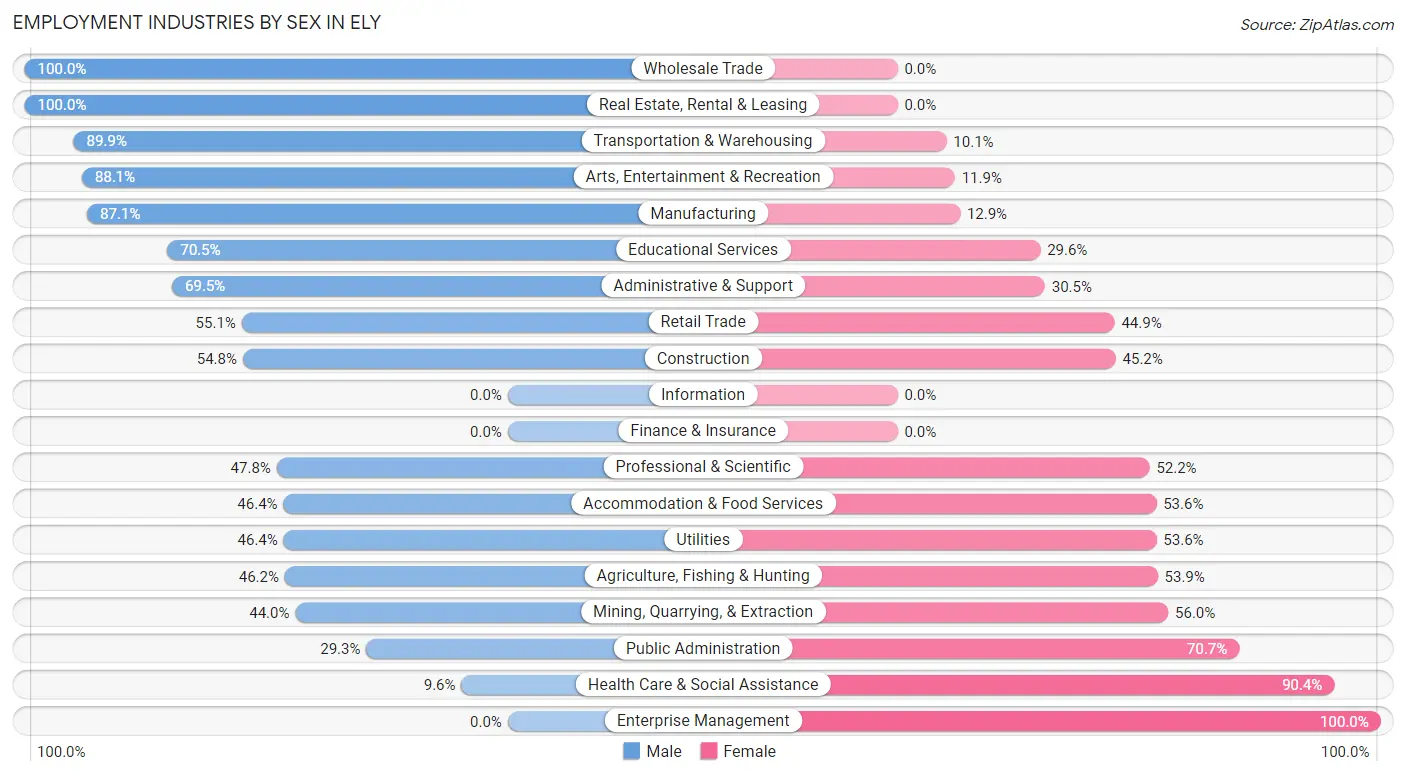
Employment Industries by Sex in Ely
The Ely industries that see more men than women are Wholesale Trade (100.0%), Real Estate, Rental & Leasing (100.0%), and Transportation & Warehousing (89.9%), whereas the industries that tend to have a higher number of women are Enterprise Management (100.0%), Health Care & Social Assistance (90.4%), and Public Administration (70.7%).
| Industry | Male | Female |
| Agriculture, Fishing & Hunting | 6 (46.2%) | 7 (53.8%) |
| Mining, Quarrying, & Extraction | 113 (44.0%) | 144 (56.0%) |
| Construction | 68 (54.8%) | 56 (45.2%) |
| Manufacturing | 74 (87.1%) | 11 (12.9%) |
| Wholesale Trade | 67 (100.0%) | 0 (0.0%) |
| Retail Trade | 76 (55.1%) | 62 (44.9%) |
| Transportation & Warehousing | 133 (89.9%) | 15 (10.1%) |
| Utilities | 45 (46.4%) | 52 (53.6%) |
| Information | 0 (0.0%) | 0 (0.0%) |
| Finance & Insurance | 0 (0.0%) | 0 (0.0%) |
| Real Estate, Rental & Leasing | 17 (100.0%) | 0 (0.0%) |
| Professional & Scientific | 22 (47.8%) | 24 (52.2%) |
| Enterprise Management | 0 (0.0%) | 10 (100.0%) |
| Administrative & Support | 41 (69.5%) | 18 (30.5%) |
| Educational Services | 93 (70.5%) | 39 (29.5%) |
| Health Care & Social Assistance | 19 (9.6%) | 179 (90.4%) |
| Arts, Entertainment & Recreation | 52 (88.1%) | 7 (11.9%) |
| Accommodation & Food Services | 117 (46.4%) | 135 (53.6%) |
| Public Administration | 77 (29.3%) | 186 (70.7%) |
| Total | 1,119 (54.1%) | 951 (45.9%) |
Education in Ely
School Enrollment in Ely
The most common levels of schooling among the 831 students in Ely are middle school (281 | 33.8%), high school (219 | 26.4%), and elementary school (128 | 15.4%).
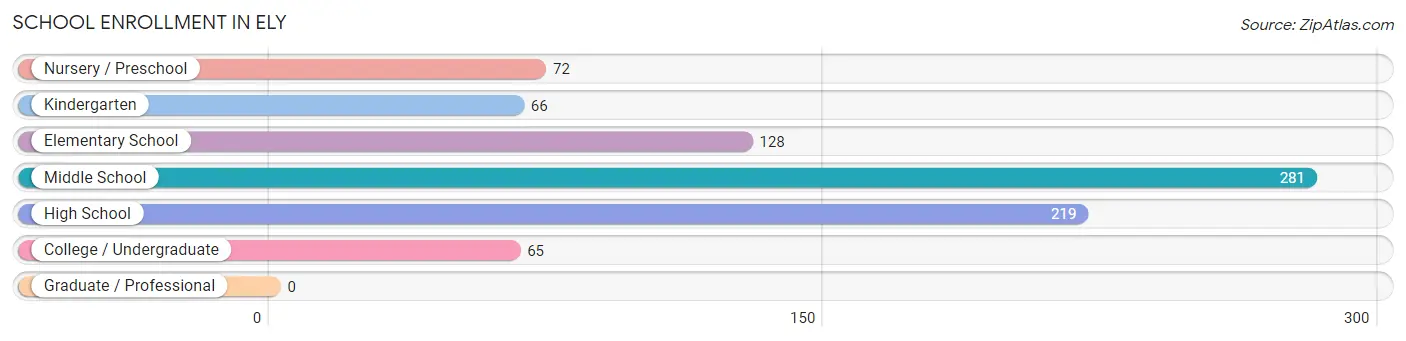
| School Level | # Students | % Students |
| Nursery / Preschool | 72 | 8.7% |
| Kindergarten | 66 | 7.9% |
| Elementary School | 128 | 15.4% |
| Middle School | 281 | 33.8% |
| High School | 219 | 26.4% |
| College / Undergraduate | 65 | 7.8% |
| Graduate / Professional | 0 | 0.0% |
| Total | 831 | 100.0% |
School Enrollment by Age by Funding Source in Ely
Out of a total of 831 students who are enrolled in schools in Ely, 35 (4.2%) attend a private institution, while the remaining 796 (95.8%) are enrolled in public schools. The age group of 5 to 9 year old has the highest likelihood of being enrolled in private schools, with 35 (18.8% in the age bracket) enrolled. Conversely, the age group of 3 to 4 year olds has the lowest likelihood of being enrolled in a private school, with 71 (100.0% in the age bracket) attending a public institution.
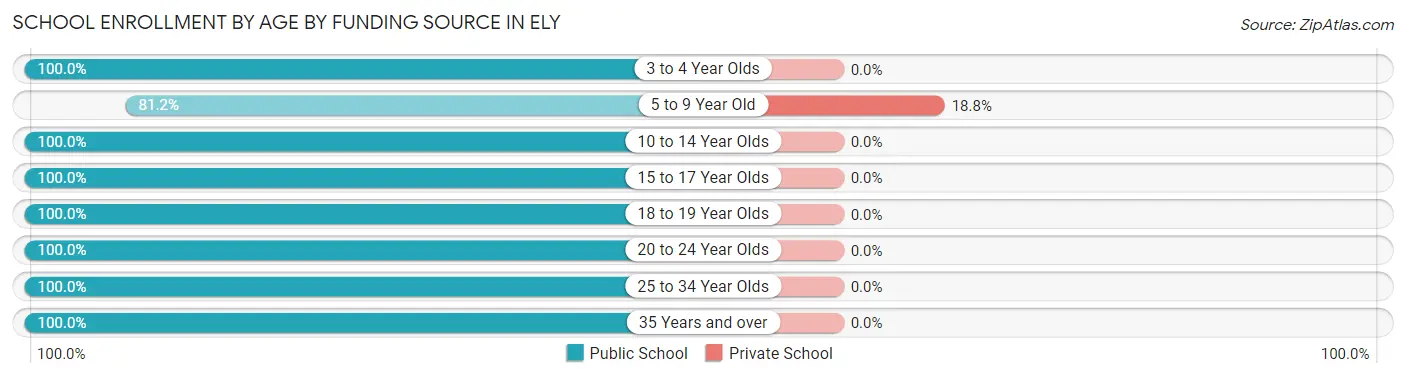
| Age Bracket | Public School | Private School |
| 3 to 4 Year Olds | 71 (100.0%) | 0 (0.0%) |
| 5 to 9 Year Old | 151 (81.2%) | 35 (18.8%) |
| 10 to 14 Year Olds | 321 (100.0%) | 0 (0.0%) |
| 15 to 17 Year Olds | 161 (100.0%) | 0 (0.0%) |
| 18 to 19 Year Olds | 11 (100.0%) | 0 (0.0%) |
| 20 to 24 Year Olds | 1 (100.0%) | 0 (0.0%) |
| 25 to 34 Year Olds | 27 (100.0%) | 0 (0.0%) |
| 35 Years and over | 53 (100.0%) | 0 (0.0%) |
| Total | 796 (95.8%) | 35 (4.2%) |
Educational Attainment by Field of Study in Ely
Science & technology (112 | 22.1%), business (90 | 17.7%), education (55 | 10.8%), liberal arts & history (52 | 10.3%), and arts & humanities (38 | 7.5%) are the most common fields of study among 507 individuals in Ely who have obtained a bachelor's degree or higher.
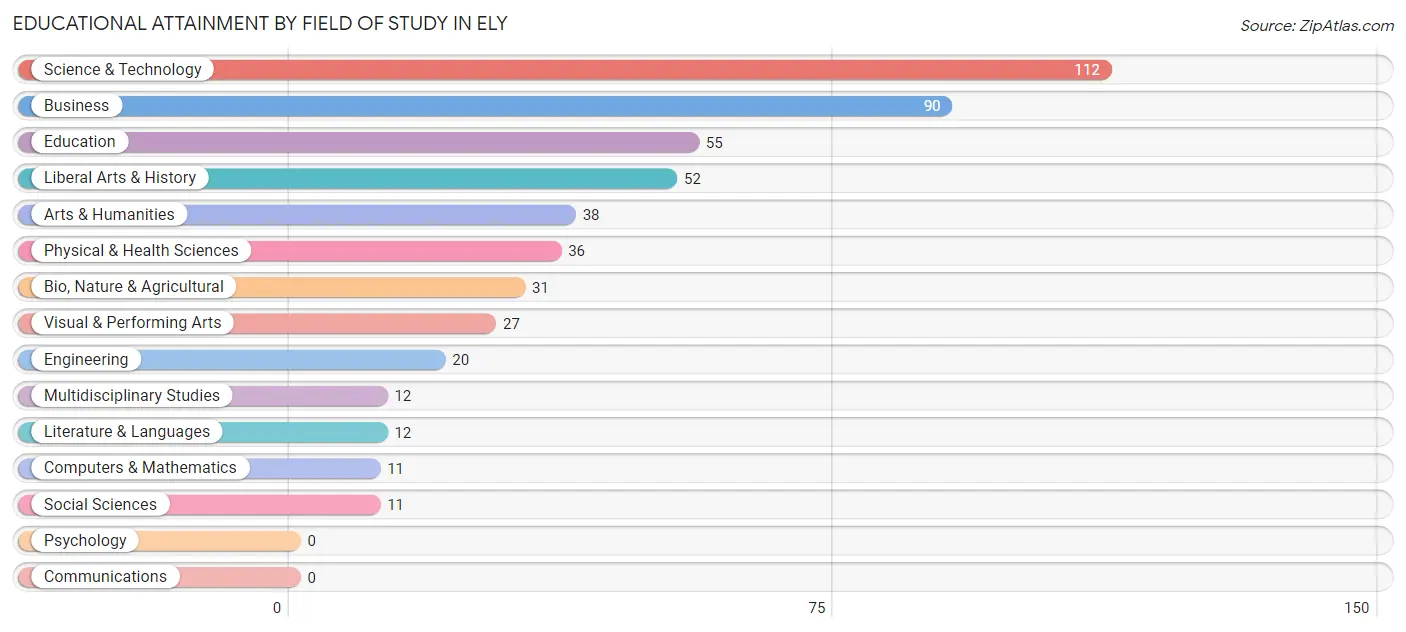
| Field of Study | # Graduates | % Graduates |
| Computers & Mathematics | 11 | 2.2% |
| Bio, Nature & Agricultural | 31 | 6.1% |
| Physical & Health Sciences | 36 | 7.1% |
| Psychology | 0 | 0.0% |
| Social Sciences | 11 | 2.2% |
| Engineering | 20 | 3.9% |
| Multidisciplinary Studies | 12 | 2.4% |
| Science & Technology | 112 | 22.1% |
| Business | 90 | 17.7% |
| Education | 55 | 10.8% |
| Literature & Languages | 12 | 2.4% |
| Liberal Arts & History | 52 | 10.3% |
| Visual & Performing Arts | 27 | 5.3% |
| Communications | 0 | 0.0% |
| Arts & Humanities | 38 | 7.5% |
| Total | 507 | 100.0% |
Transportation & Commute in Ely
Vehicle Availability by Sex in Ely
The most prevalent vehicle ownership categories in Ely are males with 3 vehicles (439, accounting for 40.6%) and females with 3 vehicles (387, making up 46.8%).
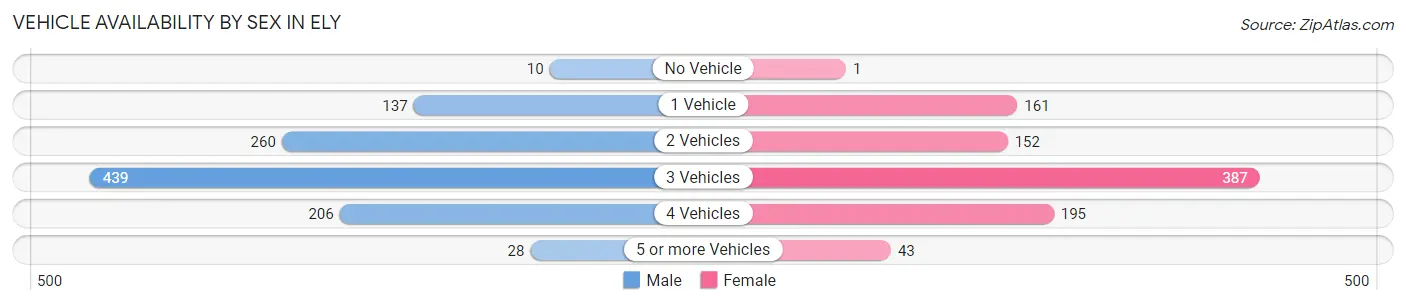
| Vehicles Available | Male | Female |
| No Vehicle | 10 (0.9%) | 1 (0.1%) |
| 1 Vehicle | 137 (12.7%) | 161 (17.2%) |
| 2 Vehicles | 260 (24.1%) | 152 (16.2%) |
| 3 Vehicles | 439 (40.6%) | 387 (41.2%) |
| 4 Vehicles | 206 (19.1%) | 195 (20.8%) |
| 5 or more Vehicles | 28 (2.6%) | 43 (4.6%) |
| Total | 1,080 (100.0%) | 939 (100.0%) |
Commute Time in Ely
The most frequently occuring commute durations in Ely are 5 to 9 minutes (532 commuters, 29.5%), 10 to 14 minutes (422 commuters, 23.4%), and 15 to 19 minutes (321 commuters, 17.8%).
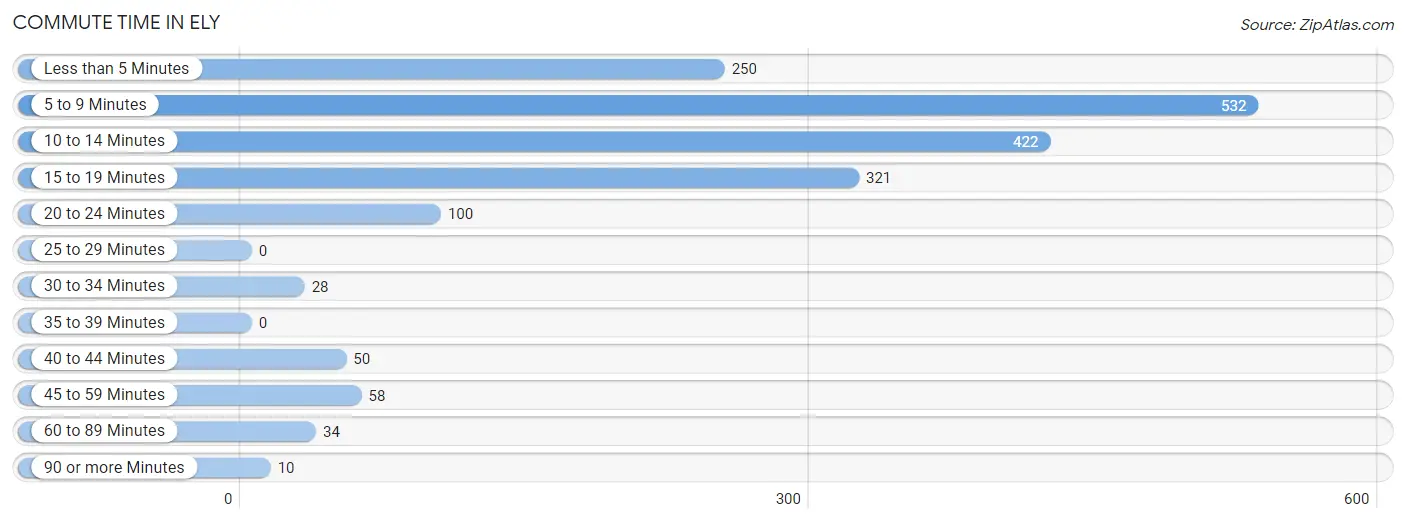
| Commute Time | # Commuters | % Commuters |
| Less than 5 Minutes | 250 | 13.9% |
| 5 to 9 Minutes | 532 | 29.5% |
| 10 to 14 Minutes | 422 | 23.4% |
| 15 to 19 Minutes | 321 | 17.8% |
| 20 to 24 Minutes | 100 | 5.5% |
| 25 to 29 Minutes | 0 | 0.0% |
| 30 to 34 Minutes | 28 | 1.5% |
| 35 to 39 Minutes | 0 | 0.0% |
| 40 to 44 Minutes | 50 | 2.8% |
| 45 to 59 Minutes | 58 | 3.2% |
| 60 to 89 Minutes | 34 | 1.9% |
| 90 or more Minutes | 10 | 0.5% |
Commute Time by Sex in Ely
The most common commute times in Ely are 5 to 9 minutes (277 commuters, 29.5%) for males and 5 to 9 minutes (255 commuters, 29.5%) for females.
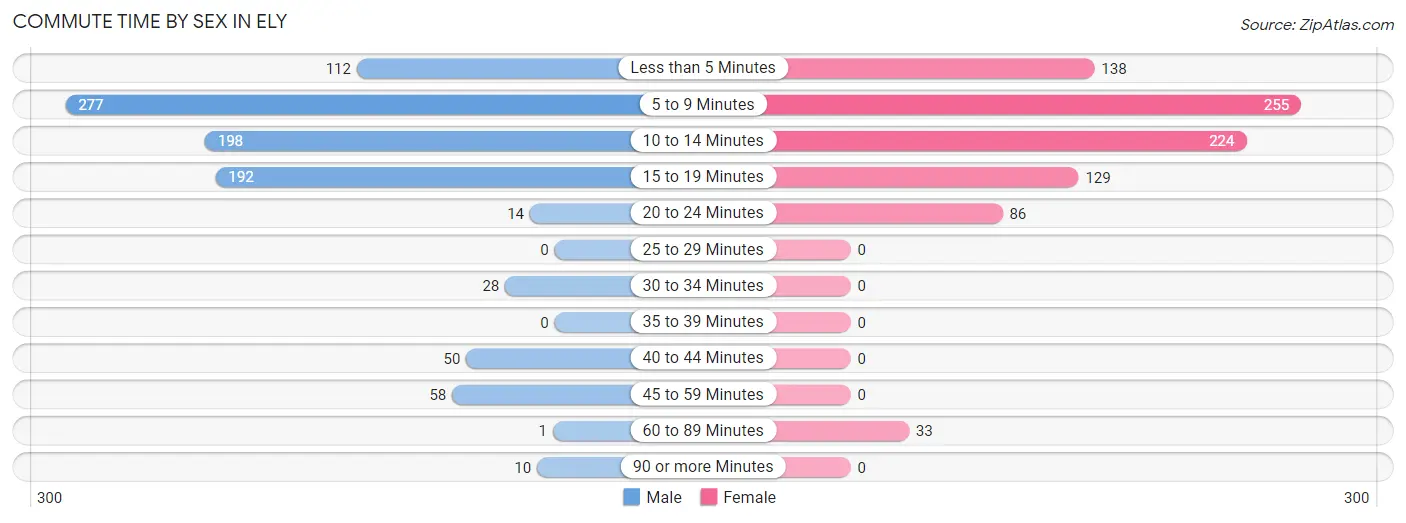
| Commute Time | Male | Female |
| Less than 5 Minutes | 112 (11.9%) | 138 (16.0%) |
| 5 to 9 Minutes | 277 (29.5%) | 255 (29.5%) |
| 10 to 14 Minutes | 198 (21.1%) | 224 (25.9%) |
| 15 to 19 Minutes | 192 (20.4%) | 129 (14.9%) |
| 20 to 24 Minutes | 14 (1.5%) | 86 (9.9%) |
| 25 to 29 Minutes | 0 (0.0%) | 0 (0.0%) |
| 30 to 34 Minutes | 28 (3.0%) | 0 (0.0%) |
| 35 to 39 Minutes | 0 (0.0%) | 0 (0.0%) |
| 40 to 44 Minutes | 50 (5.3%) | 0 (0.0%) |
| 45 to 59 Minutes | 58 (6.2%) | 0 (0.0%) |
| 60 to 89 Minutes | 1 (0.1%) | 33 (3.8%) |
| 90 or more Minutes | 10 (1.1%) | 0 (0.0%) |
Time of Departure to Work by Sex in Ely
The most frequent times of departure to work in Ely are 6:30 AM to 6:59 AM (159, 16.9%) for males and 7:00 AM to 7:29 AM (142, 16.4%) for females.
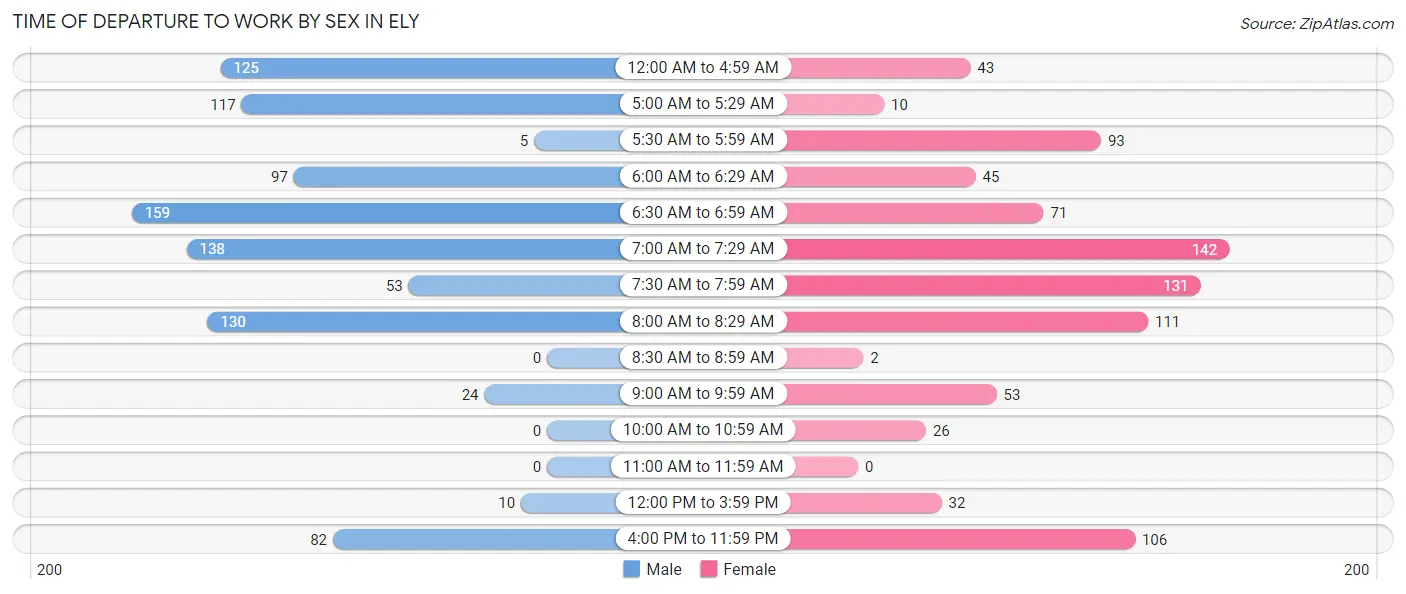
| Time of Departure | Male | Female |
| 12:00 AM to 4:59 AM | 125 (13.3%) | 43 (5.0%) |
| 5:00 AM to 5:29 AM | 117 (12.4%) | 10 (1.2%) |
| 5:30 AM to 5:59 AM | 5 (0.5%) | 93 (10.7%) |
| 6:00 AM to 6:29 AM | 97 (10.3%) | 45 (5.2%) |
| 6:30 AM to 6:59 AM | 159 (16.9%) | 71 (8.2%) |
| 7:00 AM to 7:29 AM | 138 (14.7%) | 142 (16.4%) |
| 7:30 AM to 7:59 AM | 53 (5.6%) | 131 (15.1%) |
| 8:00 AM to 8:29 AM | 130 (13.8%) | 111 (12.8%) |
| 8:30 AM to 8:59 AM | 0 (0.0%) | 2 (0.2%) |
| 9:00 AM to 9:59 AM | 24 (2.5%) | 53 (6.1%) |
| 10:00 AM to 10:59 AM | 0 (0.0%) | 26 (3.0%) |
| 11:00 AM to 11:59 AM | 0 (0.0%) | 0 (0.0%) |
| 12:00 PM to 3:59 PM | 10 (1.1%) | 32 (3.7%) |
| 4:00 PM to 11:59 PM | 82 (8.7%) | 106 (12.2%) |
| Total | 940 (100.0%) | 865 (100.0%) |
Housing Occupancy in Ely
Occupancy by Ownership in Ely
Of the total 1,743 dwellings in Ely, owner-occupied units account for 1,094 (62.8%), while renter-occupied units make up 649 (37.2%).
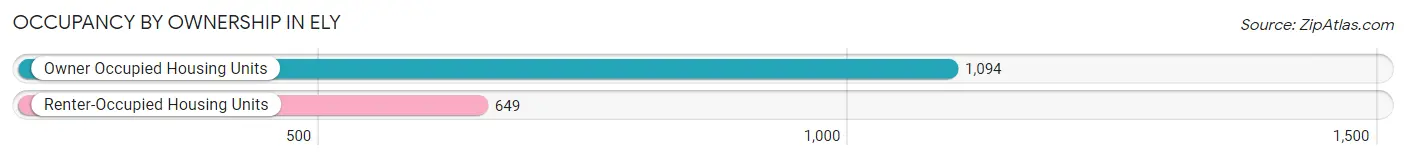
| Occupancy | # Housing Units | % Housing Units |
| Owner Occupied Housing Units | 1,094 | 62.8% |
| Renter-Occupied Housing Units | 649 | 37.2% |
| Total Occupied Housing Units | 1,743 | 100.0% |
Occupancy by Household Size in Ely
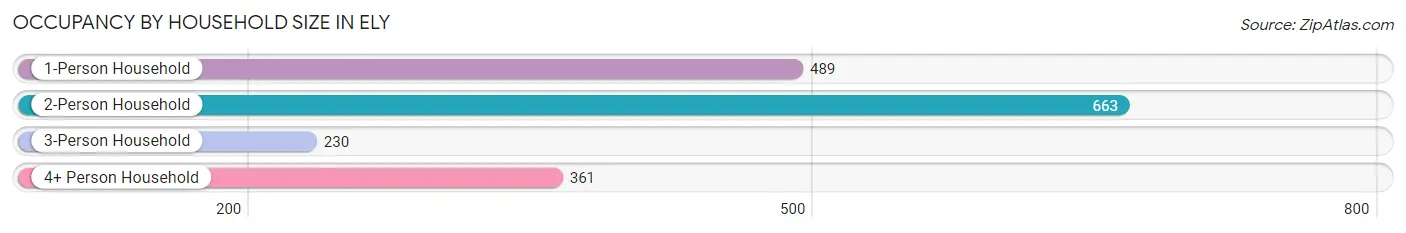
| Household Size | # Housing Units | % Housing Units |
| 1-Person Household | 489 | 28.1% |
| 2-Person Household | 663 | 38.0% |
| 3-Person Household | 230 | 13.2% |
| 4+ Person Household | 361 | 20.7% |
| Total Housing Units | 1,743 | 100.0% |
Occupancy by Ownership by Household Size in Ely
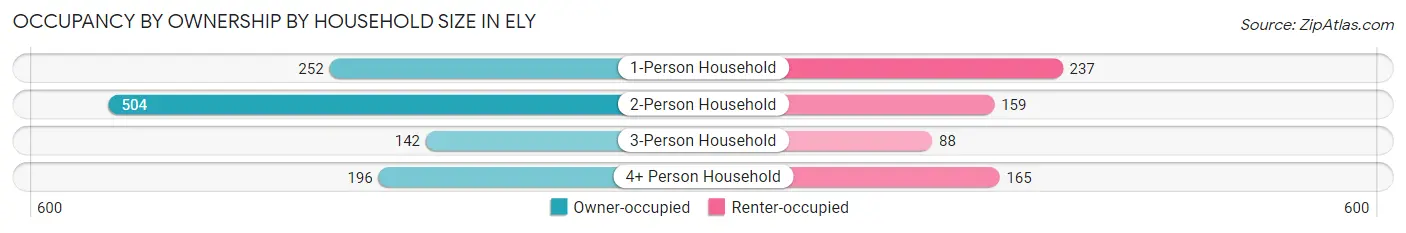
| Household Size | Owner-occupied | Renter-occupied |
| 1-Person Household | 252 (51.5%) | 237 (48.5%) |
| 2-Person Household | 504 (76.0%) | 159 (24.0%) |
| 3-Person Household | 142 (61.7%) | 88 (38.3%) |
| 4+ Person Household | 196 (54.3%) | 165 (45.7%) |
| Total Housing Units | 1,094 (62.8%) | 649 (37.2%) |
Occupancy by Educational Attainment in Ely
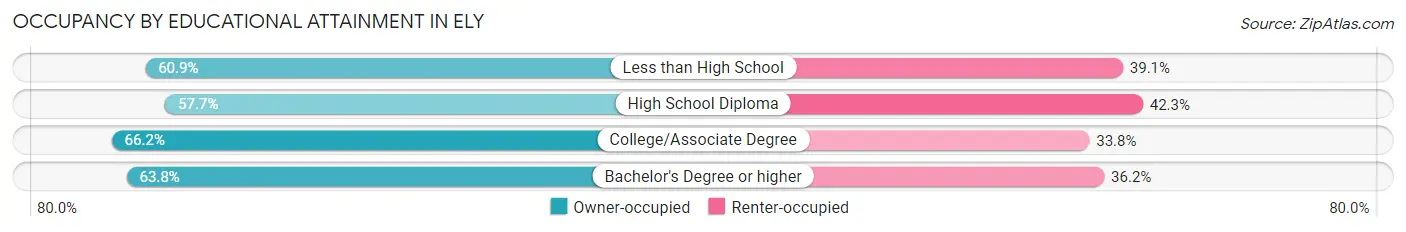
| Household Size | Owner-occupied | Renter-occupied |
| Less than High School | 98 (60.9%) | 63 (39.1%) |
| High School Diploma | 292 (57.7%) | 214 (42.3%) |
| College/Associate Degree | 478 (66.2%) | 244 (33.8%) |
| Bachelor's Degree or higher | 226 (63.8%) | 128 (36.2%) |
Occupancy by Age of Householder in Ely
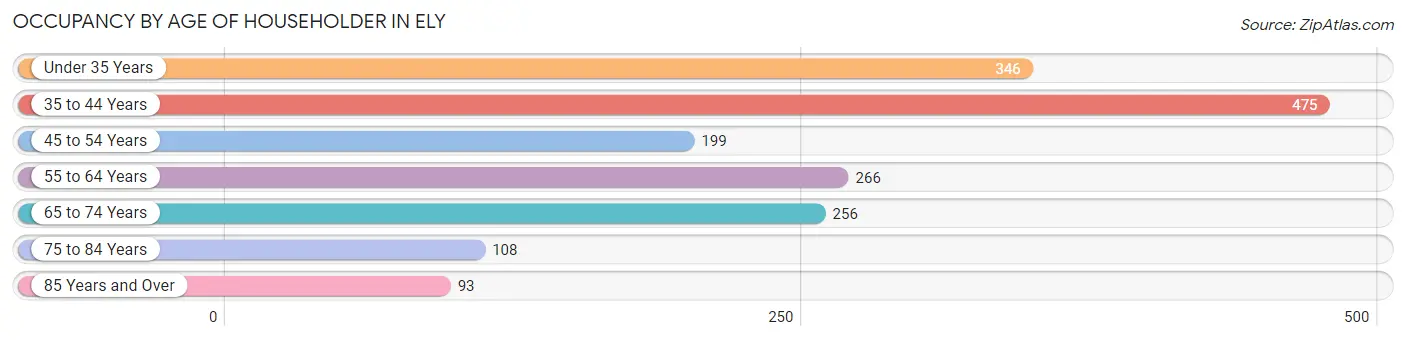
| Age Bracket | # Households | % Households |
| Under 35 Years | 346 | 19.9% |
| 35 to 44 Years | 475 | 27.3% |
| 45 to 54 Years | 199 | 11.4% |
| 55 to 64 Years | 266 | 15.3% |
| 65 to 74 Years | 256 | 14.7% |
| 75 to 84 Years | 108 | 6.2% |
| 85 Years and Over | 93 | 5.3% |
| Total | 1,743 | 100.0% |
Housing Finances in Ely
Median Income by Occupancy in Ely
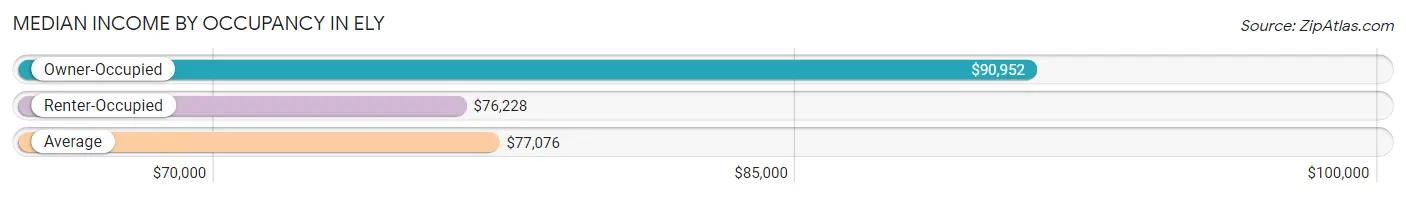
| Occupancy Type | # Households | Median Income |
| Owner-Occupied | 1,094 (62.8%) | $90,952 |
| Renter-Occupied | 649 (37.2%) | $76,228 |
| Average | 1,743 (100.0%) | $77,076 |
Occupancy by Householder Income Bracket in Ely
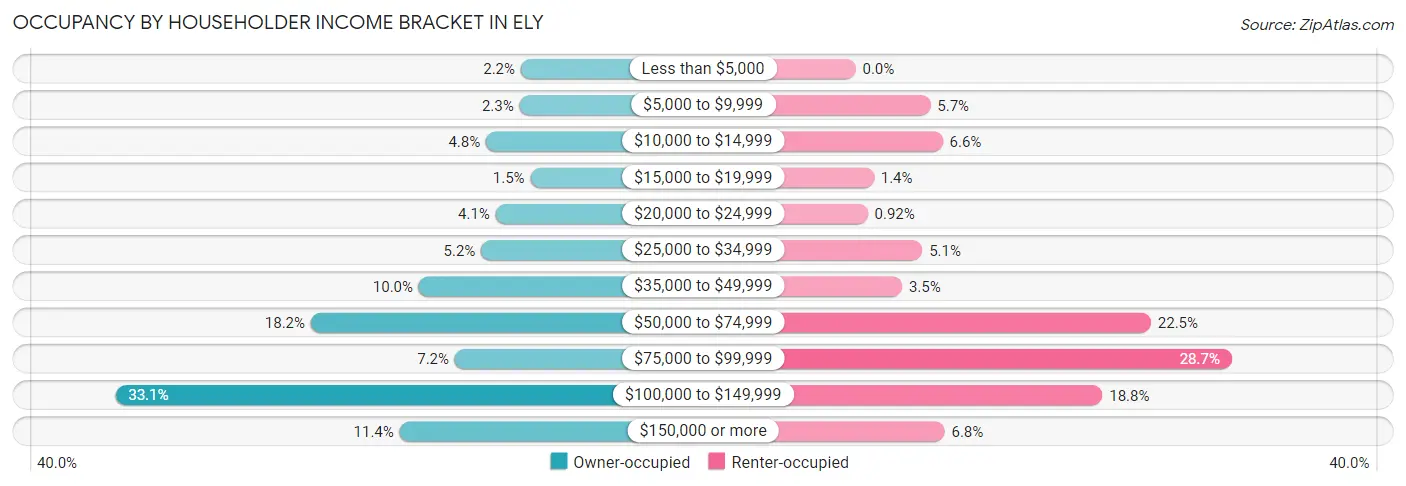
| Income Bracket | Owner-occupied | Renter-occupied |
| Less than $5,000 | 24 (2.2%) | 0 (0.0%) |
| $5,000 to $9,999 | 25 (2.3%) | 37 (5.7%) |
| $10,000 to $14,999 | 53 (4.8%) | 43 (6.6%) |
| $15,000 to $19,999 | 16 (1.5%) | 9 (1.4%) |
| $20,000 to $24,999 | 45 (4.1%) | 6 (0.9%) |
| $25,000 to $34,999 | 57 (5.2%) | 33 (5.1%) |
| $35,000 to $49,999 | 109 (10.0%) | 23 (3.5%) |
| $50,000 to $74,999 | 199 (18.2%) | 146 (22.5%) |
| $75,000 to $99,999 | 79 (7.2%) | 186 (28.7%) |
| $100,000 to $149,999 | 362 (33.1%) | 122 (18.8%) |
| $150,000 or more | 125 (11.4%) | 44 (6.8%) |
| Total | 1,094 (100.0%) | 649 (100.0%) |
Monthly Housing Cost Tiers in Ely
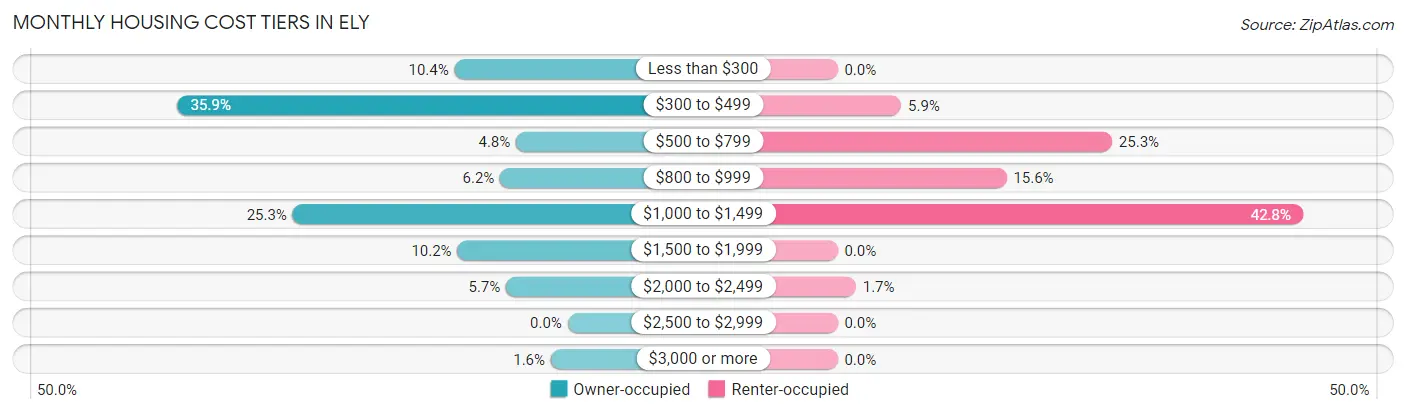
| Monthly Cost | Owner-occupied | Renter-occupied |
| Less than $300 | 114 (10.4%) | 0 (0.0%) |
| $300 to $499 | 393 (35.9%) | 38 (5.9%) |
| $500 to $799 | 52 (4.8%) | 164 (25.3%) |
| $800 to $999 | 68 (6.2%) | 101 (15.6%) |
| $1,000 to $1,499 | 277 (25.3%) | 278 (42.8%) |
| $1,500 to $1,999 | 111 (10.2%) | 0 (0.0%) |
| $2,000 to $2,499 | 62 (5.7%) | 11 (1.7%) |
| $2,500 to $2,999 | 0 (0.0%) | 0 (0.0%) |
| $3,000 or more | 17 (1.5%) | 0 (0.0%) |
| Total | 1,094 (100.0%) | 649 (100.0%) |
Physical Housing Characteristics in Ely
Housing Structures in Ely
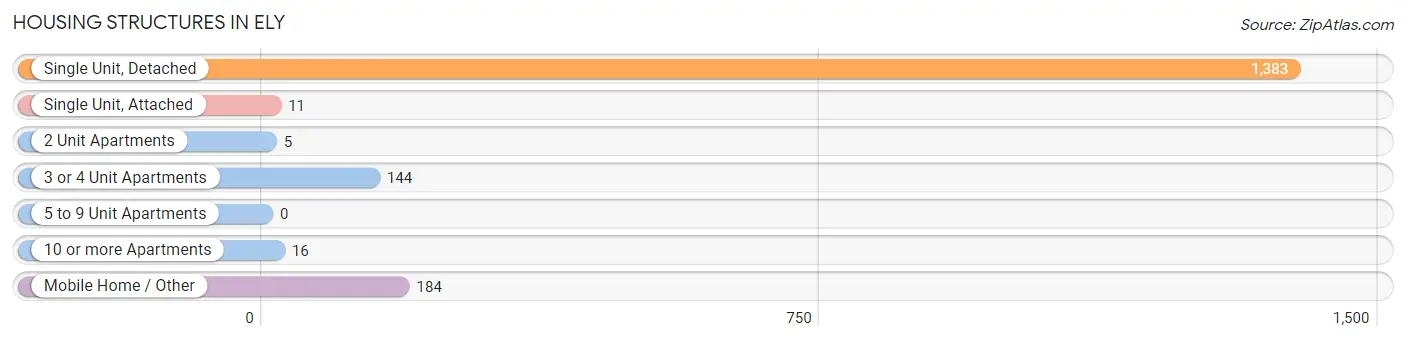
| Structure Type | # Housing Units | % Housing Units |
| Single Unit, Detached | 1,383 | 79.3% |
| Single Unit, Attached | 11 | 0.6% |
| 2 Unit Apartments | 5 | 0.3% |
| 3 or 4 Unit Apartments | 144 | 8.3% |
| 5 to 9 Unit Apartments | 0 | 0.0% |
| 10 or more Apartments | 16 | 0.9% |
| Mobile Home / Other | 184 | 10.6% |
| Total | 1,743 | 100.0% |
Housing Structures by Occupancy in Ely
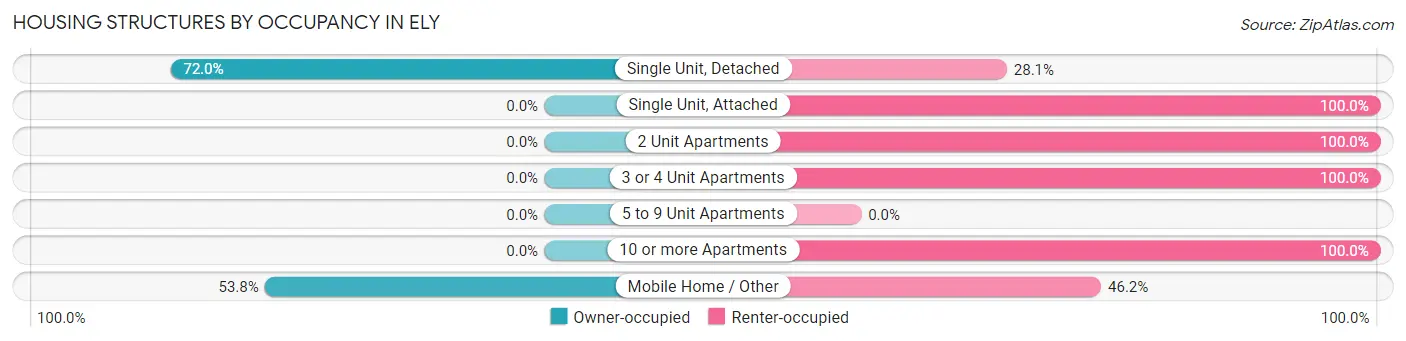
| Structure Type | Owner-occupied | Renter-occupied |
| Single Unit, Detached | 995 (72.0%) | 388 (28.1%) |
| Single Unit, Attached | 0 (0.0%) | 11 (100.0%) |
| 2 Unit Apartments | 0 (0.0%) | 5 (100.0%) |
| 3 or 4 Unit Apartments | 0 (0.0%) | 144 (100.0%) |
| 5 to 9 Unit Apartments | 0 (0.0%) | 0 (0.0%) |
| 10 or more Apartments | 0 (0.0%) | 16 (100.0%) |
| Mobile Home / Other | 99 (53.8%) | 85 (46.2%) |
| Total | 1,094 (62.8%) | 649 (37.2%) |
Housing Structures by Number of Rooms in Ely
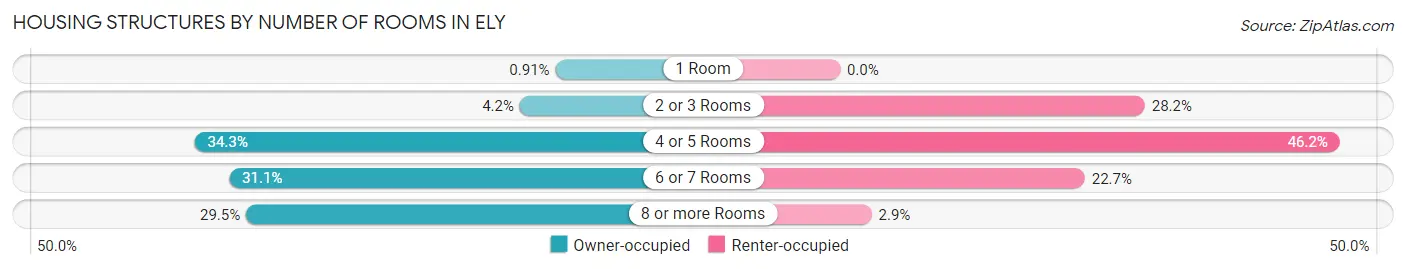
| Number of Rooms | Owner-occupied | Renter-occupied |
| 1 Room | 10 (0.9%) | 0 (0.0%) |
| 2 or 3 Rooms | 46 (4.2%) | 183 (28.2%) |
| 4 or 5 Rooms | 375 (34.3%) | 300 (46.2%) |
| 6 or 7 Rooms | 340 (31.1%) | 147 (22.7%) |
| 8 or more Rooms | 323 (29.5%) | 19 (2.9%) |
| Total | 1,094 (100.0%) | 649 (100.0%) |
Housing Structure by Heating Type in Ely
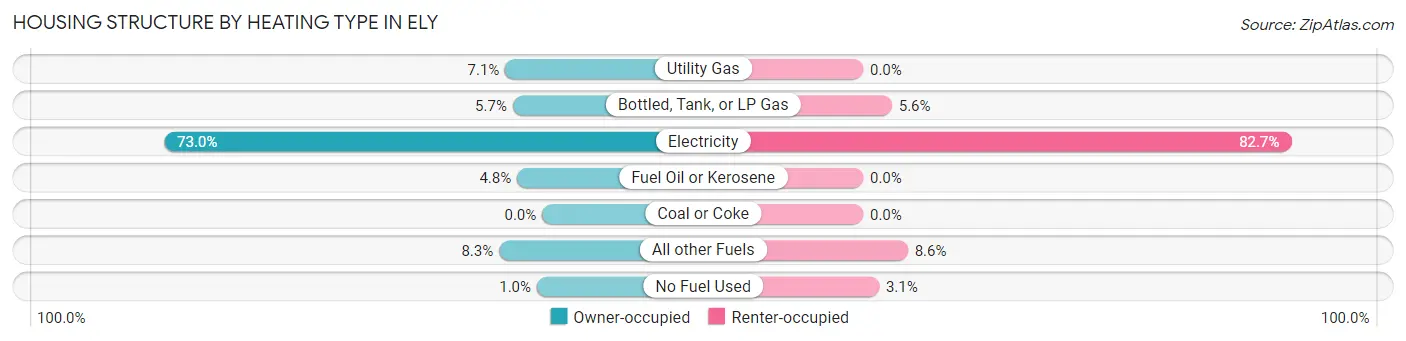
| Heating Type | Owner-occupied | Renter-occupied |
| Utility Gas | 78 (7.1%) | 0 (0.0%) |
| Bottled, Tank, or LP Gas | 62 (5.7%) | 36 (5.6%) |
| Electricity | 799 (73.0%) | 537 (82.7%) |
| Fuel Oil or Kerosene | 53 (4.8%) | 0 (0.0%) |
| Coal or Coke | 0 (0.0%) | 0 (0.0%) |
| All other Fuels | 91 (8.3%) | 56 (8.6%) |
| No Fuel Used | 11 (1.0%) | 20 (3.1%) |
| Total | 1,094 (100.0%) | 649 (100.0%) |
Household Vehicle Usage in Ely
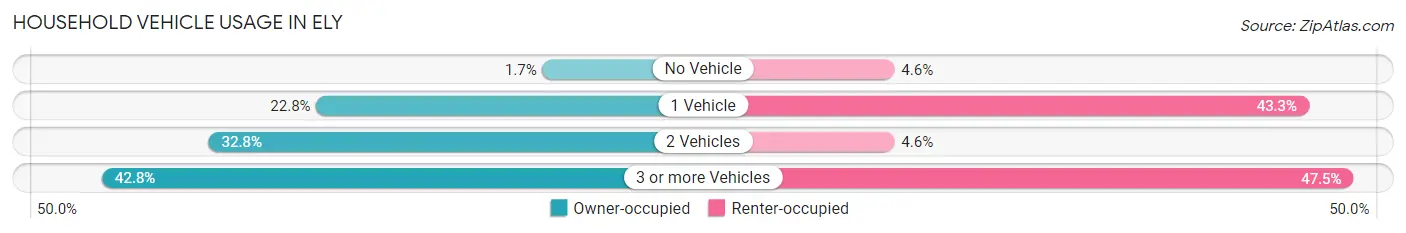
| Vehicles per Household | Owner-occupied | Renter-occupied |
| No Vehicle | 18 (1.7%) | 30 (4.6%) |
| 1 Vehicle | 249 (22.8%) | 281 (43.3%) |
| 2 Vehicles | 359 (32.8%) | 30 (4.6%) |
| 3 or more Vehicles | 468 (42.8%) | 308 (47.5%) |
| Total | 1,094 (100.0%) | 649 (100.0%) |
Real Estate & Mortgages in Ely
Real Estate and Mortgage Overview in Ely
| Characteristic | Without Mortgage | With Mortgage |
| Housing Units | 534 | 560 |
| Median Property Value | $153,600 | $249,200 |
| Median Household Income | $59,559 | $113 |
| Monthly Housing Costs | $368 | $17 |
| Real Estate Taxes | $788 | $14 |
Property Value by Mortgage Status in Ely
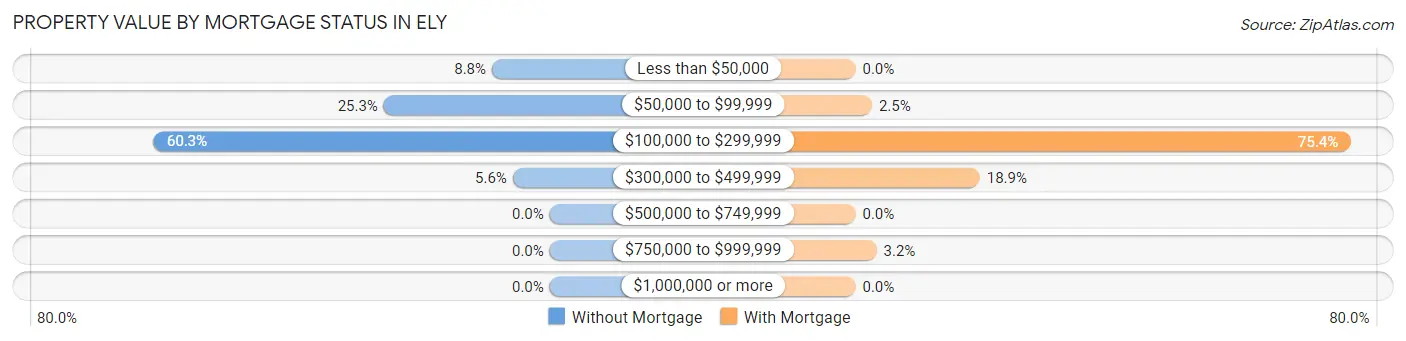
| Property Value | Without Mortgage | With Mortgage |
| Less than $50,000 | 47 (8.8%) | 0 (0.0%) |
| $50,000 to $99,999 | 135 (25.3%) | 14 (2.5%) |
| $100,000 to $299,999 | 322 (60.3%) | 422 (75.4%) |
| $300,000 to $499,999 | 30 (5.6%) | 106 (18.9%) |
| $500,000 to $749,999 | 0 (0.0%) | 0 (0.0%) |
| $750,000 to $999,999 | 0 (0.0%) | 18 (3.2%) |
| $1,000,000 or more | 0 (0.0%) | 0 (0.0%) |
| Total | 534 (100.0%) | 560 (100.0%) |
Household Income by Mortgage Status in Ely
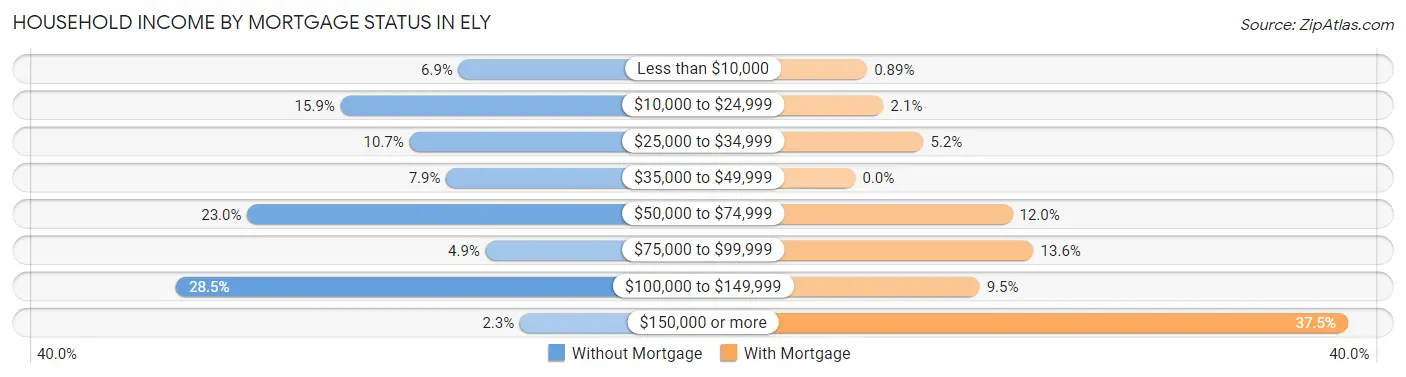
| Household Income | Without Mortgage | With Mortgage |
| Less than $10,000 | 37 (6.9%) | 5 (0.9%) |
| $10,000 to $24,999 | 85 (15.9%) | 12 (2.1%) |
| $25,000 to $34,999 | 57 (10.7%) | 29 (5.2%) |
| $35,000 to $49,999 | 42 (7.9%) | 0 (0.0%) |
| $50,000 to $74,999 | 123 (23.0%) | 67 (12.0%) |
| $75,000 to $99,999 | 26 (4.9%) | 76 (13.6%) |
| $100,000 to $149,999 | 152 (28.5%) | 53 (9.5%) |
| $150,000 or more | 12 (2.2%) | 210 (37.5%) |
| Total | 534 (100.0%) | 560 (100.0%) |
Property Value to Household Income Ratio in Ely
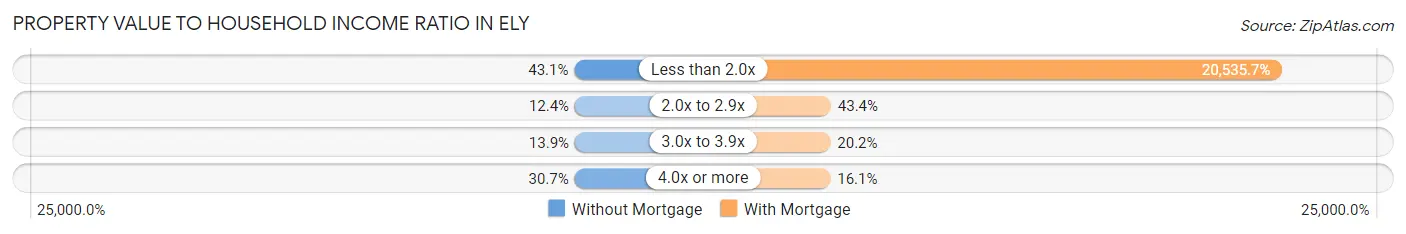
| Value-to-Income Ratio | Without Mortgage | With Mortgage |
| Less than 2.0x | 230 (43.1%) | 115,000 (20,535.7%) |
| 2.0x to 2.9x | 66 (12.4%) | 243 (43.4%) |
| 3.0x to 3.9x | 74 (13.9%) | 113 (20.2%) |
| 4.0x or more | 164 (30.7%) | 90 (16.1%) |
| Total | 534 (100.0%) | 560 (100.0%) |
Real Estate Taxes by Mortgage Status in Ely
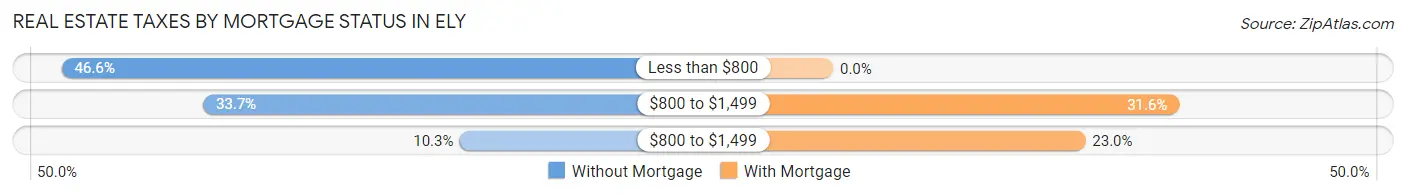
| Property Taxes | Without Mortgage | With Mortgage |
| Less than $800 | 249 (46.6%) | 0 (0.0%) |
| $800 to $1,499 | 180 (33.7%) | 177 (31.6%) |
| $800 to $1,499 | 55 (10.3%) | 129 (23.0%) |
| Total | 534 (100.0%) | 560 (100.0%) |
Health & Disability in Ely
Health Insurance Coverage by Age in Ely
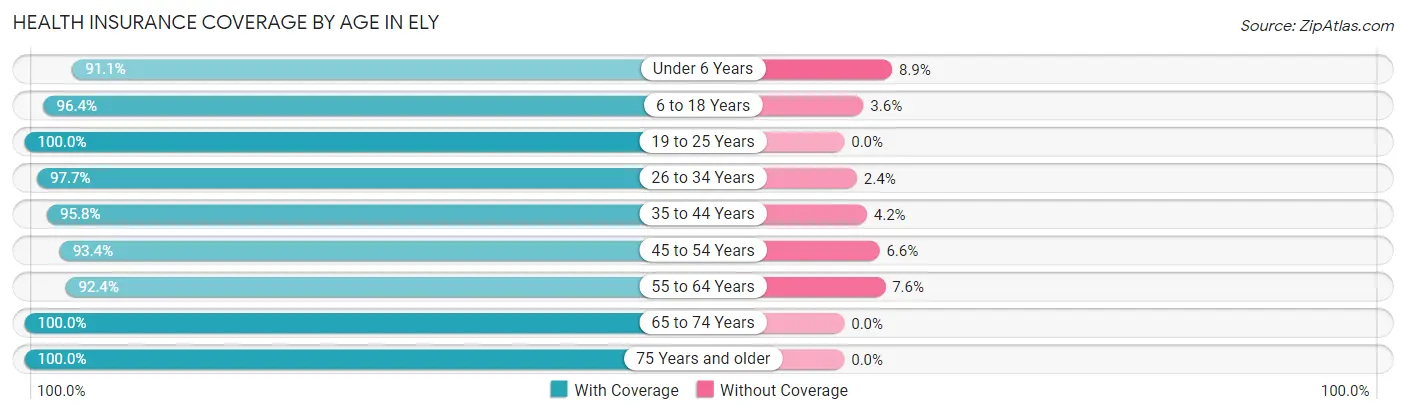
| Age Bracket | With Coverage | Without Coverage |
| Under 6 Years | 307 (91.1%) | 30 (8.9%) |
| 6 to 18 Years | 623 (96.4%) | 23 (3.6%) |
| 19 to 25 Years | 248 (100.0%) | 0 (0.0%) |
| 26 to 34 Years | 416 (97.7%) | 10 (2.4%) |
| 35 to 44 Years | 682 (95.8%) | 30 (4.2%) |
| 45 to 54 Years | 356 (93.4%) | 25 (6.6%) |
| 55 to 64 Years | 436 (92.4%) | 36 (7.6%) |
| 65 to 74 Years | 386 (100.0%) | 0 (0.0%) |
| 75 Years and older | 289 (100.0%) | 0 (0.0%) |
| Total | 3,743 (96.1%) | 154 (4.0%) |
Health Insurance Coverage by Citizenship Status in Ely
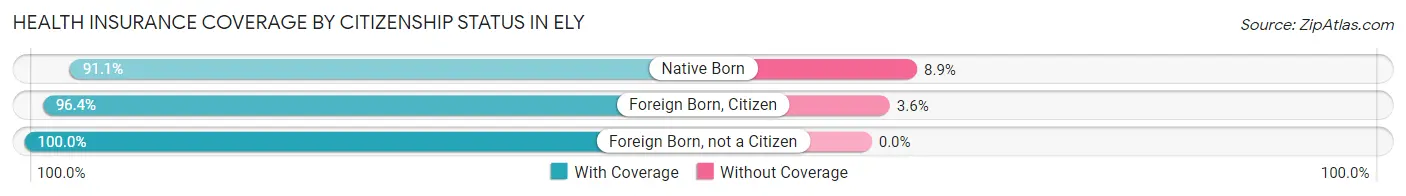
| Citizenship Status | With Coverage | Without Coverage |
| Native Born | 307 (91.1%) | 30 (8.9%) |
| Foreign Born, Citizen | 623 (96.4%) | 23 (3.6%) |
| Foreign Born, not a Citizen | 248 (100.0%) | 0 (0.0%) |
Health Insurance Coverage by Household Income in Ely
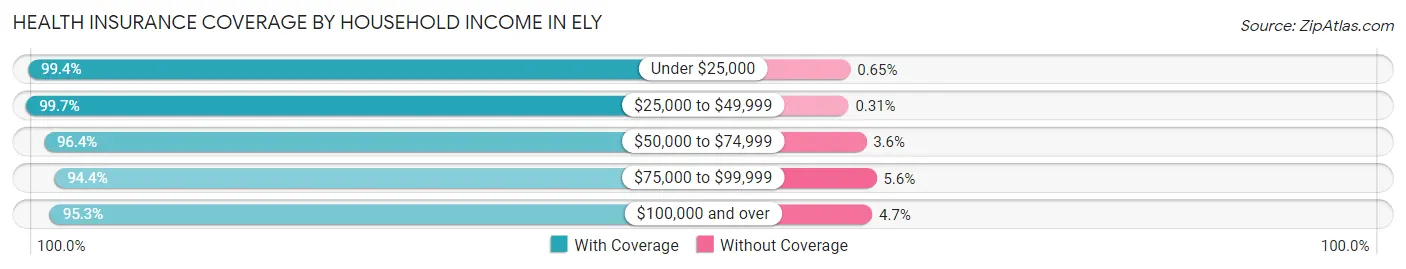
| Household Income | With Coverage | Without Coverage |
| Under $25,000 | 305 (99.4%) | 2 (0.6%) |
| $25,000 to $49,999 | 321 (99.7%) | 1 (0.3%) |
| $50,000 to $74,999 | 691 (96.4%) | 26 (3.6%) |
| $75,000 to $99,999 | 560 (94.4%) | 33 (5.6%) |
| $100,000 and over | 1,850 (95.3%) | 92 (4.7%) |
Public vs Private Health Insurance Coverage by Age in Ely
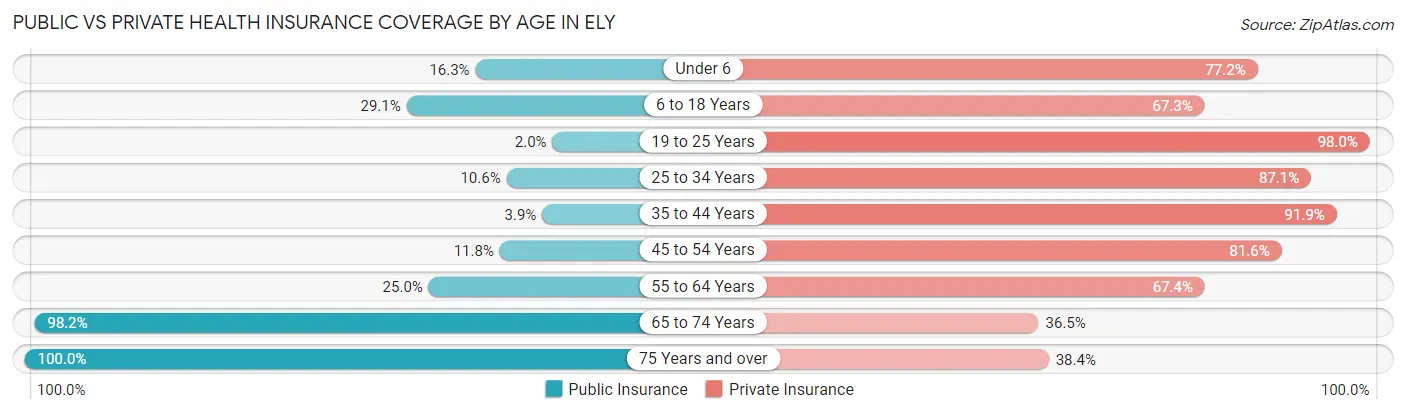
| Age Bracket | Public Insurance | Private Insurance |
| Under 6 | 55 (16.3%) | 260 (77.1%) |
| 6 to 18 Years | 188 (29.1%) | 435 (67.3%) |
| 19 to 25 Years | 5 (2.0%) | 243 (98.0%) |
| 25 to 34 Years | 45 (10.6%) | 371 (87.1%) |
| 35 to 44 Years | 28 (3.9%) | 654 (91.8%) |
| 45 to 54 Years | 45 (11.8%) | 311 (81.6%) |
| 55 to 64 Years | 118 (25.0%) | 318 (67.4%) |
| 65 to 74 Years | 379 (98.2%) | 141 (36.5%) |
| 75 Years and over | 289 (100.0%) | 111 (38.4%) |
| Total | 1,152 (29.6%) | 2,844 (73.0%) |
Disability Status by Sex by Age in Ely
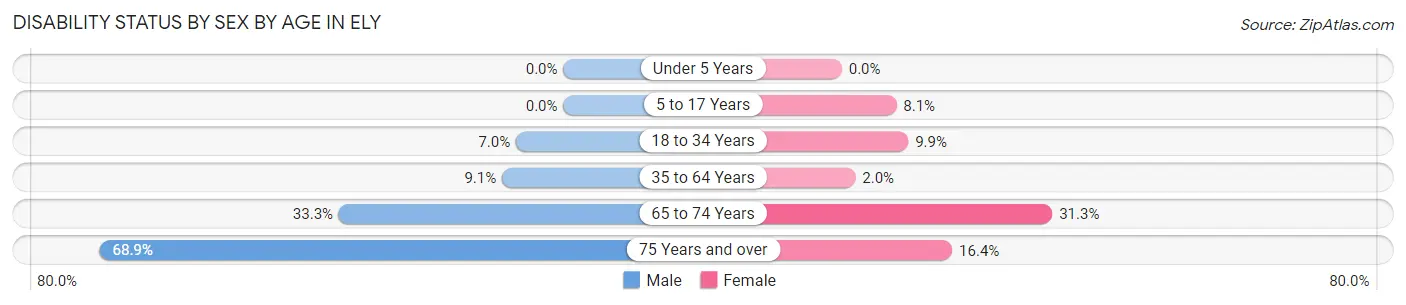
| Age Bracket | Male | Female |
| Under 5 Years | 0 (0.0%) | 0 (0.0%) |
| 5 to 17 Years | 0 (0.0%) | 26 (8.1%) |
| 18 to 34 Years | 25 (7.0%) | 35 (9.9%) |
| 35 to 64 Years | 70 (9.1%) | 16 (2.0%) |
| 65 to 74 Years | 70 (33.3%) | 55 (31.2%) |
| 75 Years and over | 115 (68.9%) | 20 (16.4%) |
Disability Class by Sex by Age in Ely
Disability Class: Hearing Difficulty
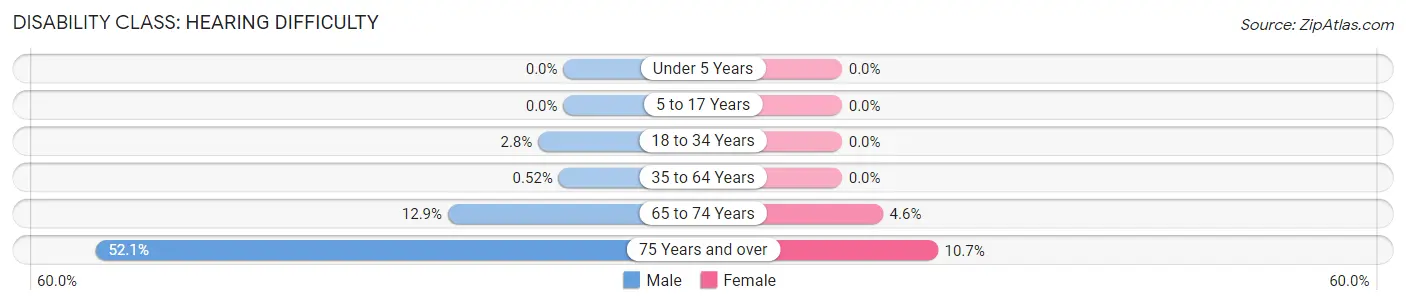
| Age Bracket | Male | Female |
| Under 5 Years | 0 (0.0%) | 0 (0.0%) |
| 5 to 17 Years | 0 (0.0%) | 0 (0.0%) |
| 18 to 34 Years | 10 (2.8%) | 0 (0.0%) |
| 35 to 64 Years | 4 (0.5%) | 0 (0.0%) |
| 65 to 74 Years | 27 (12.9%) | 8 (4.5%) |
| 75 Years and over | 87 (52.1%) | 13 (10.7%) |
Disability Class: Vision Difficulty
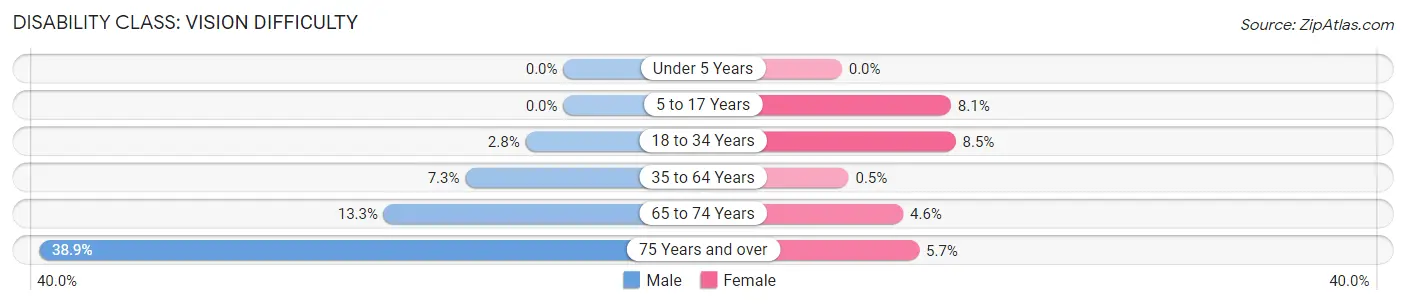
| Age Bracket | Male | Female |
| Under 5 Years | 0 (0.0%) | 0 (0.0%) |
| 5 to 17 Years | 0 (0.0%) | 26 (8.1%) |
| 18 to 34 Years | 10 (2.8%) | 30 (8.5%) |
| 35 to 64 Years | 56 (7.3%) | 4 (0.5%) |
| 65 to 74 Years | 28 (13.3%) | 8 (4.5%) |
| 75 Years and over | 65 (38.9%) | 7 (5.7%) |
Disability Class: Cognitive Difficulty
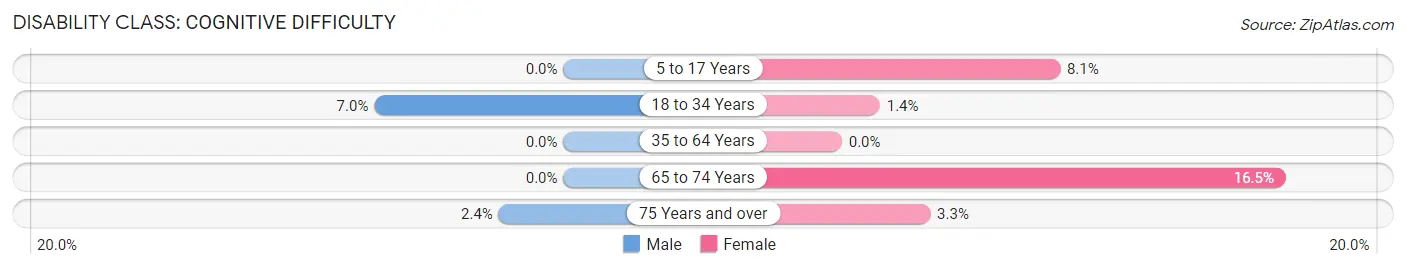
| Age Bracket | Male | Female |
| 5 to 17 Years | 0 (0.0%) | 26 (8.1%) |
| 18 to 34 Years | 25 (7.0%) | 5 (1.4%) |
| 35 to 64 Years | 0 (0.0%) | 0 (0.0%) |
| 65 to 74 Years | 0 (0.0%) | 29 (16.5%) |
| 75 Years and over | 4 (2.4%) | 4 (3.3%) |
Disability Class: Ambulatory Difficulty
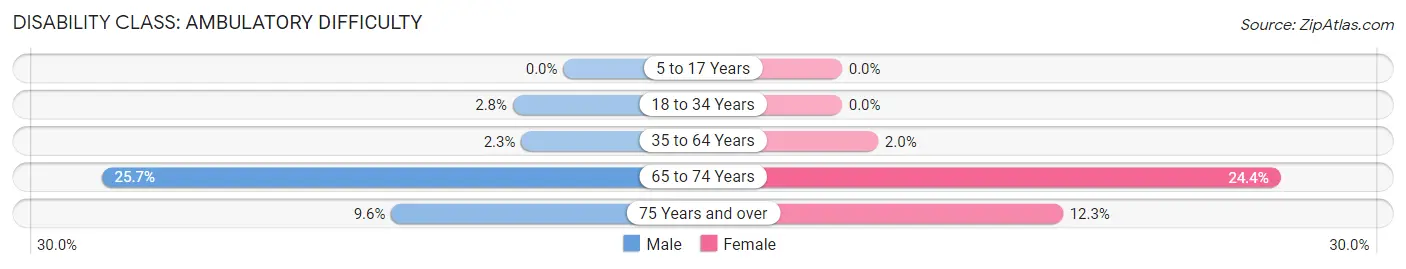
| Age Bracket | Male | Female |
| 5 to 17 Years | 0 (0.0%) | 0 (0.0%) |
| 18 to 34 Years | 10 (2.8%) | 0 (0.0%) |
| 35 to 64 Years | 18 (2.3%) | 16 (2.0%) |
| 65 to 74 Years | 54 (25.7%) | 43 (24.4%) |
| 75 Years and over | 16 (9.6%) | 15 (12.3%) |
Disability Class: Self-Care Difficulty
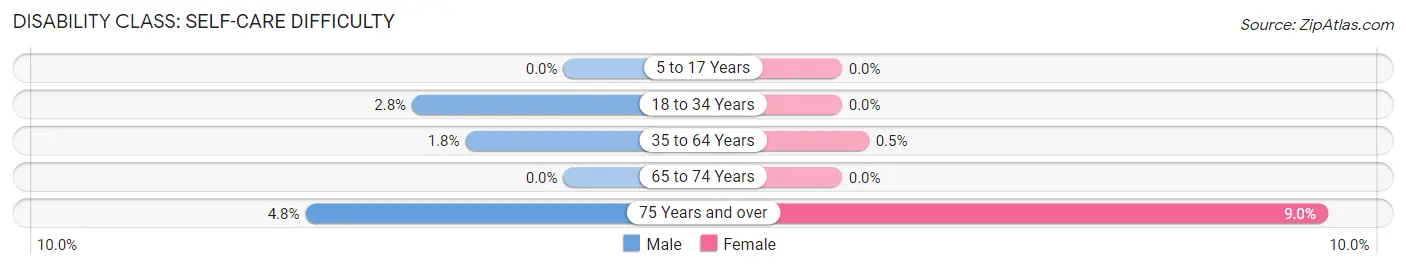
| Age Bracket | Male | Female |
| 5 to 17 Years | 0 (0.0%) | 0 (0.0%) |
| 18 to 34 Years | 10 (2.8%) | 0 (0.0%) |
| 35 to 64 Years | 14 (1.8%) | 4 (0.5%) |
| 65 to 74 Years | 0 (0.0%) | 0 (0.0%) |
| 75 Years and over | 8 (4.8%) | 11 (9.0%) |
Technology Access in Ely
Computing Device Access in Ely
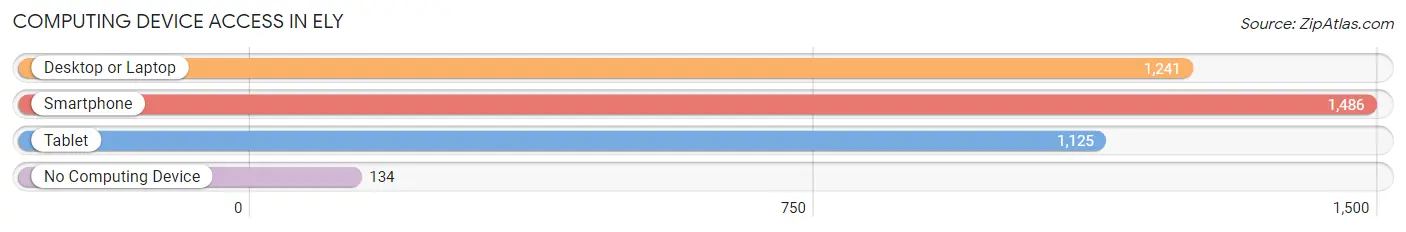
| Device Type | # Households | % Households |
| Desktop or Laptop | 1,241 | 71.2% |
| Smartphone | 1,486 | 85.3% |
| Tablet | 1,125 | 64.5% |
| No Computing Device | 134 | 7.7% |
| Total | 1,743 | 100.0% |
Internet Access in Ely
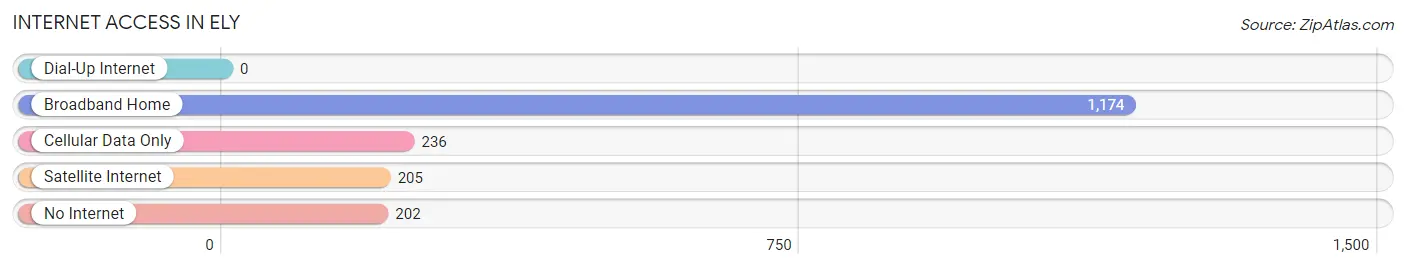
| Internet Type | # Households | % Households |
| Dial-Up Internet | 0 | 0.0% |
| Broadband Home | 1,174 | 67.4% |
| Cellular Data Only | 236 | 13.5% |
| Satellite Internet | 205 | 11.8% |
| No Internet | 202 | 11.6% |
| Total | 1,743 | 100.0% |
Ely Summary
Ely, Nevada is a small city located in White Pine County in the eastern part of the state. It is the county seat and the largest city in the county. The city is located in the Great Basin region of the United States and is surrounded by mountains and desert. The city is known for its mining history, its outdoor recreation opportunities, and its unique culture.
History
The area around Ely was first inhabited by the Northern Paiute people. The first European settlers arrived in the area in the late 1800s, and the town of Ely was founded in 1878. The town was named after Smith Ely, a local businessman and politician.
The town quickly grew as a mining center, and by the early 1900s, it was the largest city in White Pine County. The city was home to several large copper mines, and the population peaked at around 10,000 in the 1920s.
The Great Depression hit Ely hard, and the population declined significantly. The city was able to recover somewhat in the 1940s and 1950s, but the population never returned to its previous levels.
Geography
Ely is located in the Great Basin region of the United States. The city is surrounded by mountains and desert, and the climate is semi-arid. The city is located at an elevation of 6,400 feet, and the average annual temperature is around 50 degrees Fahrenheit.
The city is located near several national parks and monuments, including Great Basin National Park, Lehman Caves National Monument, and the Humboldt-Toiyabe National Forest. The city is also located near several large lakes, including Cave Lake, Ruby Lake, and Wildhorse Reservoir.
Economy
Ely’s economy is largely based on mining and tourism. The city is home to several large copper mines, and the mining industry is the largest employer in the city. The city is also home to several tourist attractions, including the Nevada Northern Railway Museum, the White Pine Public Museum, and the Nevada State Railroad Museum.
The city is also home to several manufacturing companies, including a copper smelter and a paper mill. The city is also home to several retail stores, restaurants, and hotels.
Demographics
As of the 2010 census, the population of Ely was 4,255. The racial makeup of the city was 90.3% White, 0.7% African American, 1.2% Native American, 0.7% Asian, 0.1% Pacific Islander, 4.2% from other races, and 2.9% from two or more races. Hispanic or Latino of any race were 8.3% of the population.
The median income for a household in the city was $37,917, and the median income for a family was $45,938. The per capita income for the city was $20,945. About 11.2% of families and 14.3% of the population were below the poverty line, including 19.2% of those under age 18 and 8.2% of those age 65 or over.
Ely is a small city with a unique history and culture. The city is home to several large copper mines, and the mining industry is the largest employer in the city. The city is also home to several tourist attractions, and the city’s economy is largely based on mining and tourism. The population of the city is diverse, and the median income for a household is slightly below the national average.
Common Questions
What is Per Capita Income in Ely?
Per Capita income in Ely is $36,258.
What is the Median Family Income in Ely?
Median Family Income in Ely is $96,667.
What is the Median Household income in Ely?
Median Household Income in Ely is $77,076.
What is Income or Wage Gap in Ely?
Income or Wage Gap in Ely is 8.3%.
Women in Ely earn 91.7 cents for every dollar earned by a man.
What is Inequality or Gini Index in Ely?
Inequality or Gini Index in Ely is 0.35.
What is the Total Population of Ely?
Total Population of Ely is 3,957.
What is the Total Male Population of Ely?
Total Male Population of Ely is 1,970.
What is the Total Female Population of Ely?
Total Female Population of Ely is 1,987.
What is the Ratio of Males per 100 Females in Ely?
There are 99.14 Males per 100 Females in Ely.
What is the Ratio of Females per 100 Males in Ely?
There are 100.86 Females per 100 Males in Ely.
What is the Median Population Age in Ely?
Median Population Age in Ely is 38.7 Years.
What is the Average Family Size in Ely
Average Family Size in Ely is 2.6 People.
What is the Average Household Size in Ely
Average Household Size in Ely is 2.2 People.
How Large is the Labor Force in Ely?
There are 2,155 People in the Labor Forcein in Ely.
What is the Percentage of People in the Labor Force in Ely?
69.3% of People are in the Labor Force in Ely.
What is the Unemployment Rate in Ely?
Unemployment Rate in Ely is 3.9%.