Caliente, NV Map & Demographics
Caliente Map
Caliente Overview
$31,246
PER CAPITA INCOME
$105,227
AVG FAMILY INCOME
$36,400
AVG HOUSEHOLD INCOME
0.48
INEQUALITY / GINI INDEX
840
TOTAL POPULATION
321
MALE POPULATION
519
FEMALE POPULATION
61.85
MALES / 100 FEMALES
161.68
FEMALES / 100 MALES
43.9
MEDIAN AGE
3.9
AVG FAMILY SIZE
2.2
AVG HOUSEHOLD SIZE
361
LABOR FORCE [ PEOPLE ]
49.3%
PERCENT IN LABOR FORCE
4.2%
UNEMPLOYMENT RATE
Caliente Zip Codes
Caliente Area Codes
Income in Caliente
Income Overview in Caliente
Per Capita Income in Caliente is $31,246, while median incomes of families and households are $105,227 and $36,400 respectively.
| Characteristic | Number | Measure |
| Per Capita Income | 840 | $31,246 |
| Median Family Income | 134 | $105,227 |
| Mean Family Income | 134 | $110,701 |
| Median Household Income | 348 | $36,400 |
| Mean Household Income | 348 | $61,139 |
| Income Deficit | 134 | $0 |
| Wage / Income Gap (%) | 840 | 0.00% |
| Wage / Income Gap ($) | 840 | 100.00¢ per $1 |
| Gini / Inequality Index | 840 | 0.48 |
Earnings by Sex in Caliente
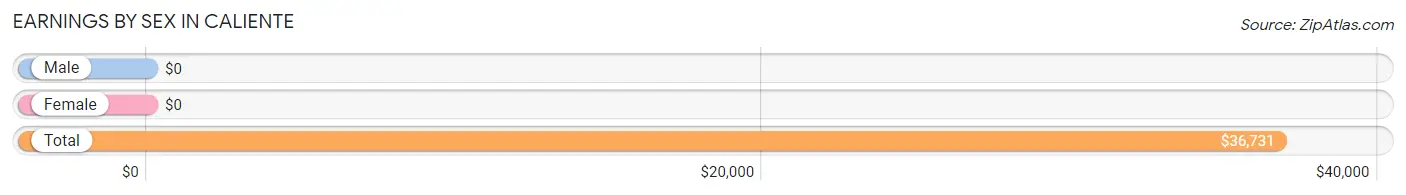
| Sex | Number | Average Earnings |
| Male | 183 (44.4%) | $0 |
| Female | 229 (55.6%) | $0 |
| Total | 412 (100.0%) | $36,731 |
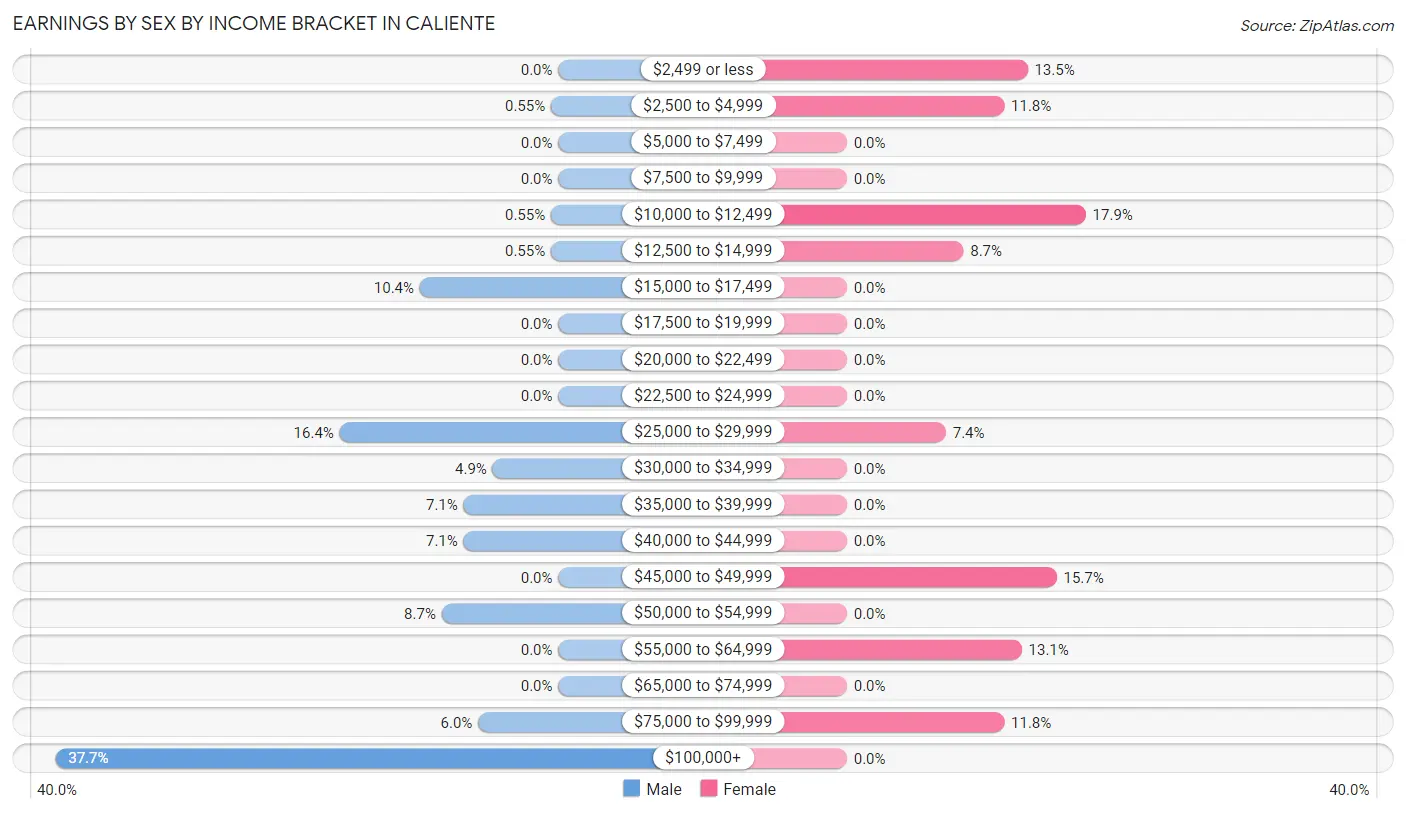
Earnings by Sex by Income Bracket in Caliente
The most common earnings brackets in Caliente are $100,000+ for men (69 | 37.7%) and $10,000 to $12,499 for women (41 | 17.9%).
| Income | Male | Female |
| $2,499 or less | 0 (0.0%) | 31 (13.5%) |
| $2,500 to $4,999 | 1 (0.5%) | 27 (11.8%) |
| $5,000 to $7,499 | 0 (0.0%) | 0 (0.0%) |
| $7,500 to $9,999 | 0 (0.0%) | 0 (0.0%) |
| $10,000 to $12,499 | 1 (0.5%) | 41 (17.9%) |
| $12,500 to $14,999 | 1 (0.5%) | 20 (8.7%) |
| $15,000 to $17,499 | 19 (10.4%) | 0 (0.0%) |
| $17,500 to $19,999 | 0 (0.0%) | 0 (0.0%) |
| $20,000 to $22,499 | 0 (0.0%) | 0 (0.0%) |
| $22,500 to $24,999 | 0 (0.0%) | 0 (0.0%) |
| $25,000 to $29,999 | 30 (16.4%) | 17 (7.4%) |
| $30,000 to $34,999 | 9 (4.9%) | 0 (0.0%) |
| $35,000 to $39,999 | 13 (7.1%) | 0 (0.0%) |
| $40,000 to $44,999 | 13 (7.1%) | 0 (0.0%) |
| $45,000 to $49,999 | 0 (0.0%) | 36 (15.7%) |
| $50,000 to $54,999 | 16 (8.7%) | 0 (0.0%) |
| $55,000 to $64,999 | 0 (0.0%) | 30 (13.1%) |
| $65,000 to $74,999 | 0 (0.0%) | 0 (0.0%) |
| $75,000 to $99,999 | 11 (6.0%) | 27 (11.8%) |
| $100,000+ | 69 (37.7%) | 0 (0.0%) |
| Total | 183 (100.0%) | 229 (100.0%) |
Earnings by Sex by Educational Attainment in Caliente
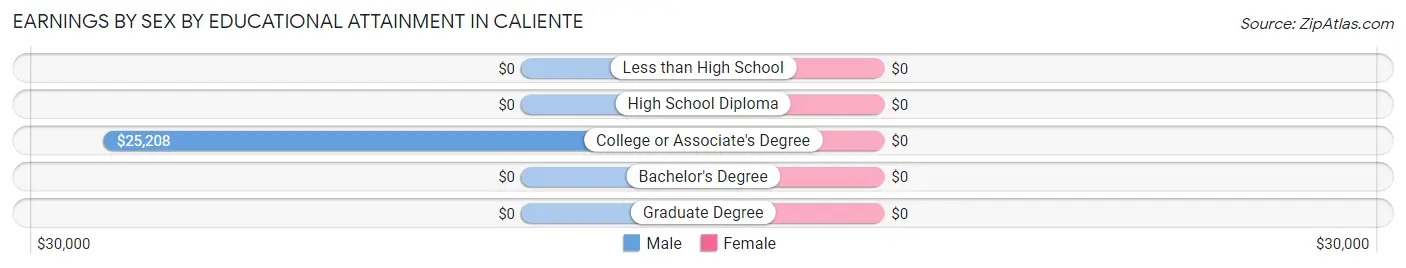
| Educational Attainment | Male Income | Female Income |
| Less than High School | - | - |
| High School Diploma | - | - |
| College or Associate's Degree | $25,208 | $0 |
| Bachelor's Degree | - | - |
| Graduate Degree | - | - |
| Total | - | - |
Family Income in Caliente
Family Income Brackets in Caliente
According to the Caliente family income data, there are 42 families falling into the $75,000 to $99,999 income range, which is the most common income bracket and makes up 31.3% of all families.
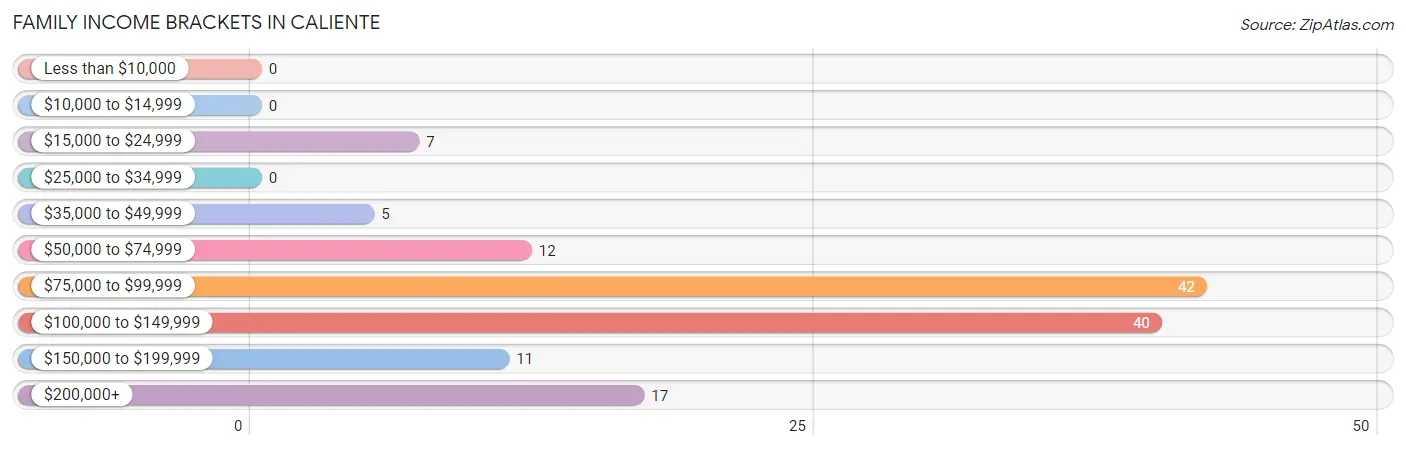
| Income Bracket | # Families | % Families |
| Less than $10,000 | 0 | 0.0% |
| $10,000 to $14,999 | 0 | 0.0% |
| $15,000 to $24,999 | 7 | 5.2% |
| $25,000 to $34,999 | 0 | 0.0% |
| $35,000 to $49,999 | 5 | 3.7% |
| $50,000 to $74,999 | 12 | 9.0% |
| $75,000 to $99,999 | 42 | 31.3% |
| $100,000 to $149,999 | 40 | 29.9% |
| $150,000 to $199,999 | 11 | 8.2% |
| $200,000+ | 17 | 12.7% |
Family Income by Famaliy Size in Caliente
2-person families (60 | 44.8%) account for the highest median family income in Caliente with $95,278 per family, while 2-person families (60 | 44.8%) have the highest median income of $47,639 per family member.
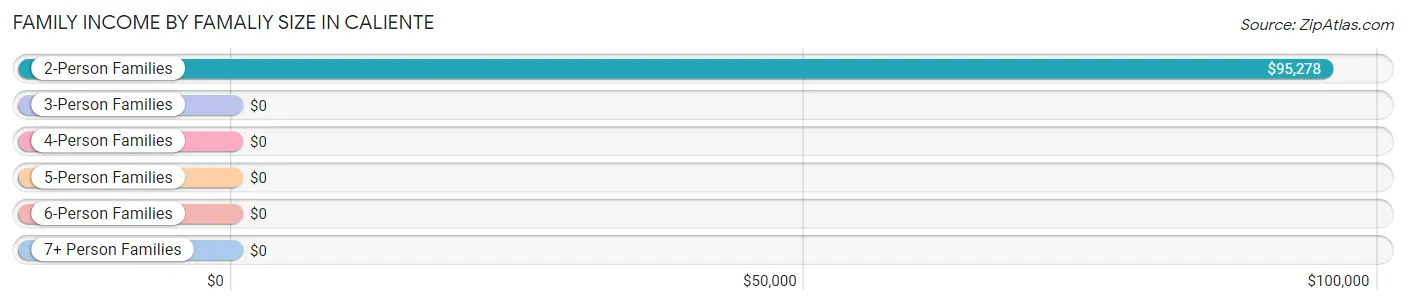
| Income Bracket | # Families | Median Income |
| 2-Person Families | 60 (44.8%) | $95,278 |
| 3-Person Families | 18 (13.4%) | $0 |
| 4-Person Families | 27 (20.2%) | $0 |
| 5-Person Families | 29 (21.6%) | $0 |
| 6-Person Families | 0 (0.0%) | $0 |
| 7+ Person Families | 0 (0.0%) | $0 |
| Total | 134 (100.0%) | $105,227 |
Family Income by Number of Earners in Caliente
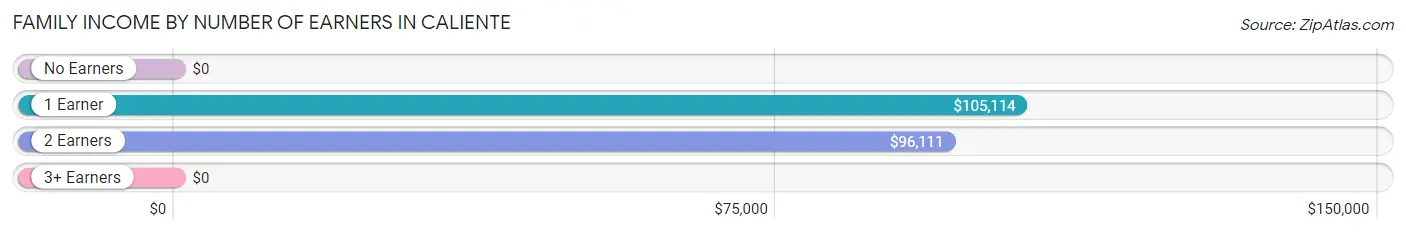
| Number of Earners | # Families | Median Income |
| No Earners | 17 (12.7%) | $0 |
| 1 Earner | 43 (32.1%) | $105,114 |
| 2 Earners | 46 (34.3%) | $96,111 |
| 3+ Earners | 28 (20.9%) | $0 |
| Total | 134 (100.0%) | $105,227 |
Household Income in Caliente
Household Income Brackets in Caliente
With 70 households falling in the category, the $15,000 to $24,999 income range is the most frequent in Caliente, accounting for 20.1% of all households.
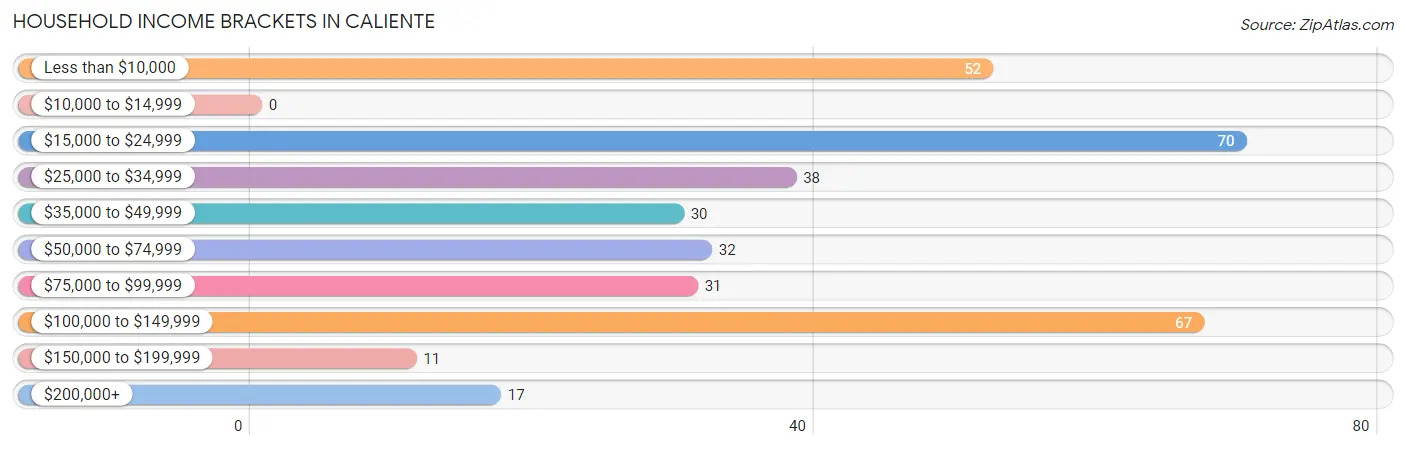
| Income Bracket | # Households | % Households |
| Less than $10,000 | 52 | 14.9% |
| $10,000 to $14,999 | 0 | 0.0% |
| $15,000 to $24,999 | 70 | 20.1% |
| $25,000 to $34,999 | 38 | 10.9% |
| $35,000 to $49,999 | 30 | 8.6% |
| $50,000 to $74,999 | 32 | 9.2% |
| $75,000 to $99,999 | 31 | 8.9% |
| $100,000 to $149,999 | 67 | 19.3% |
| $150,000 to $199,999 | 11 | 3.2% |
| $200,000+ | 17 | 4.9% |
Household Income by Householder Age in Caliente
The median household income in Caliente is $36,400, with the highest median household income of $35,625 found in the 65+ years age bracket for the primary householder. A total of 124 households (35.6%) fall into this category.
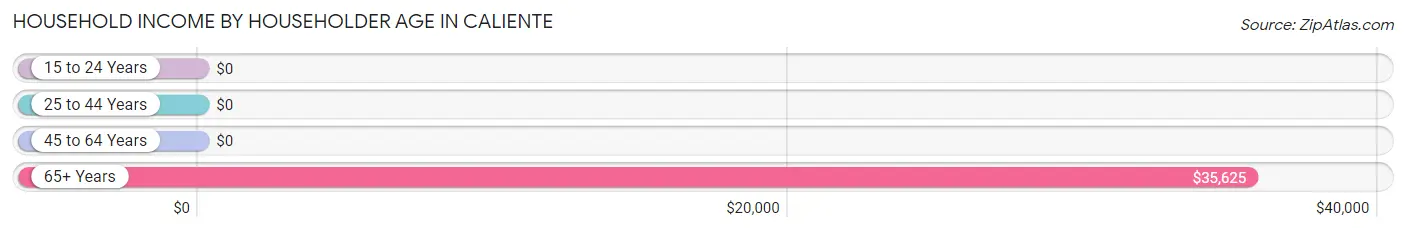
| Income Bracket | # Households | Median Income |
| 15 to 24 Years | 0 (0.0%) | $0 |
| 25 to 44 Years | 100 (28.7%) | $0 |
| 45 to 64 Years | 124 (35.6%) | $0 |
| 65+ Years | 124 (35.6%) | $35,625 |
| Total | 348 (100.0%) | $36,400 |
Poverty in Caliente
Income Below Poverty by Sex and Age in Caliente
With 6.7% poverty level for males and 14.4% for females among the residents of Caliente, 65 to 74 year old males and 25 to 34 year old females are the most vulnerable to poverty, with 10 males (28.6%) and 10 females (100.0%) in their respective age groups living below the poverty level.
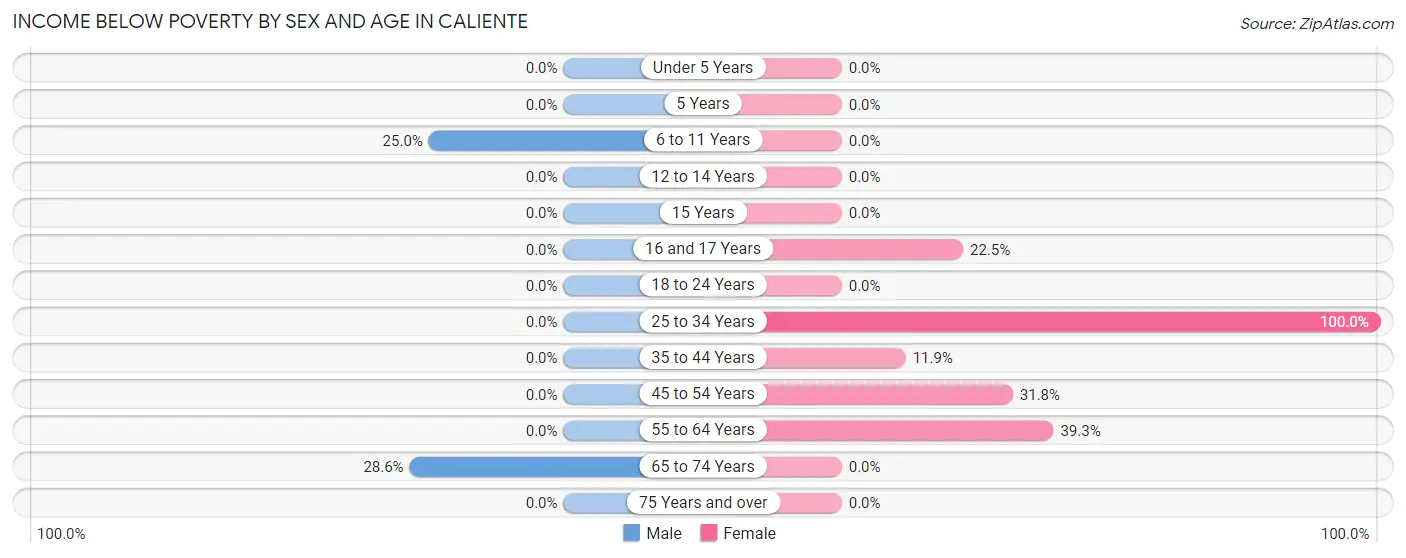
| Age Bracket | Male | Female |
| Under 5 Years | 0 (0.0%) | 0 (0.0%) |
| 5 Years | 0 (0.0%) | 0 (0.0%) |
| 6 to 11 Years | 10 (25.0%) | 0 (0.0%) |
| 12 to 14 Years | 0 (0.0%) | 0 (0.0%) |
| 15 Years | 0 (0.0%) | 0 (0.0%) |
| 16 and 17 Years | 0 (0.0%) | 9 (22.5%) |
| 18 to 24 Years | 0 (0.0%) | 0 (0.0%) |
| 25 to 34 Years | 0 (0.0%) | 10 (100.0%) |
| 35 to 44 Years | 0 (0.0%) | 7 (11.9%) |
| 45 to 54 Years | 0 (0.0%) | 20 (31.8%) |
| 55 to 64 Years | 0 (0.0%) | 22 (39.3%) |
| 65 to 74 Years | 10 (28.6%) | 0 (0.0%) |
| 75 Years and over | 0 (0.0%) | 0 (0.0%) |
| Total | 20 (6.7%) | 68 (14.4%) |
Income Above Poverty by Sex and Age in Caliente
According to the poverty statistics in Caliente, males aged 18 to 24 years and females aged 6 to 11 years are the age groups that are most secure financially, with 100.0% of males and 100.0% of females in these age groups living above the poverty line.
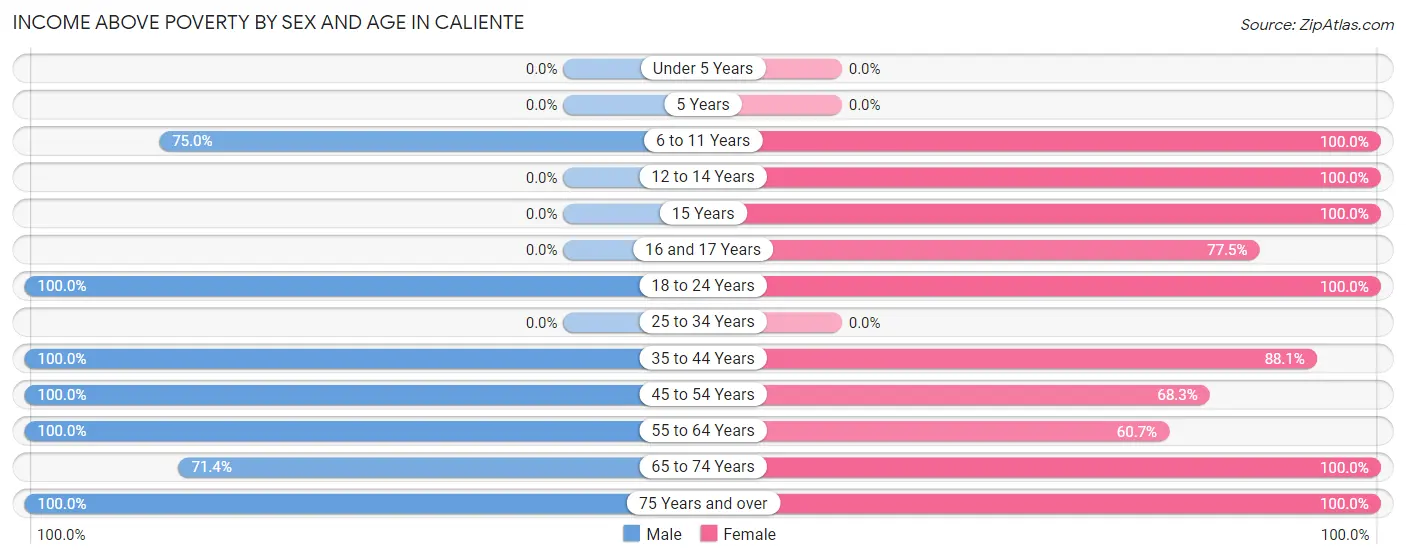
| Age Bracket | Male | Female |
| Under 5 Years | 0 (0.0%) | 0 (0.0%) |
| 5 Years | 0 (0.0%) | 0 (0.0%) |
| 6 to 11 Years | 30 (75.0%) | 12 (100.0%) |
| 12 to 14 Years | 0 (0.0%) | 13 (100.0%) |
| 15 Years | 0 (0.0%) | 30 (100.0%) |
| 16 and 17 Years | 0 (0.0%) | 31 (77.5%) |
| 18 to 24 Years | 15 (100.0%) | 77 (100.0%) |
| 25 to 34 Years | 0 (0.0%) | 0 (0.0%) |
| 35 to 44 Years | 108 (100.0%) | 52 (88.1%) |
| 45 to 54 Years | 18 (100.0%) | 43 (68.2%) |
| 55 to 64 Years | 70 (100.0%) | 34 (60.7%) |
| 65 to 74 Years | 25 (71.4%) | 40 (100.0%) |
| 75 Years and over | 12 (100.0%) | 71 (100.0%) |
| Total | 278 (93.3%) | 403 (85.6%) |
Income Below Poverty Among Married-Couple Families in Caliente
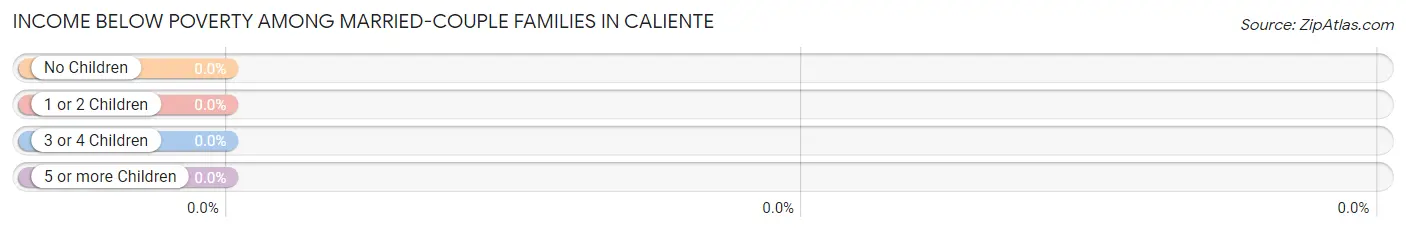
| Children | Above Poverty | Below Poverty |
| No Children | 60 (100.0%) | 0 (0.0%) |
| 1 or 2 Children | 46 (100.0%) | 0 (0.0%) |
| 3 or 4 Children | 0 (0.0%) | 0 (0.0%) |
| 5 or more Children | 0 (0.0%) | 0 (0.0%) |
| Total | 106 (100.0%) | 0 (0.0%) |
Income Below Poverty Among Single-Parent Households in Caliente
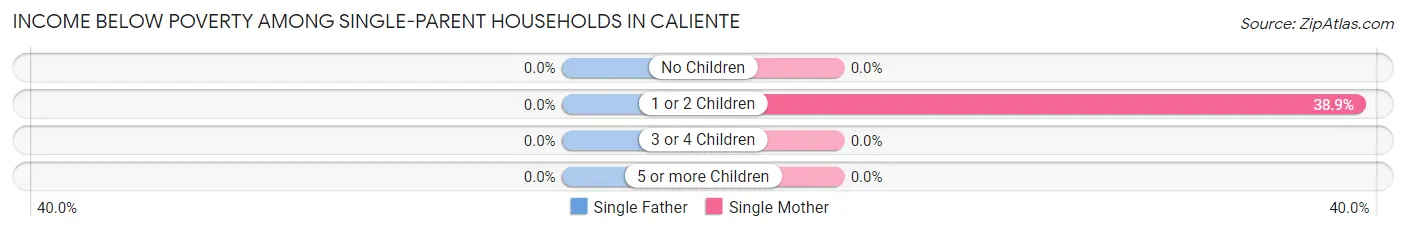
| Children | Single Father | Single Mother |
| No Children | 0 (0.0%) | 0 (0.0%) |
| 1 or 2 Children | 0 (0.0%) | 7 (38.9%) |
| 3 or 4 Children | 0 (0.0%) | 0 (0.0%) |
| 5 or more Children | 0 (0.0%) | 0 (0.0%) |
| Total | 0 (0.0%) | 7 (25.0%) |
Income Below Poverty Among Married-Couple vs Single-Parent Households in Caliente
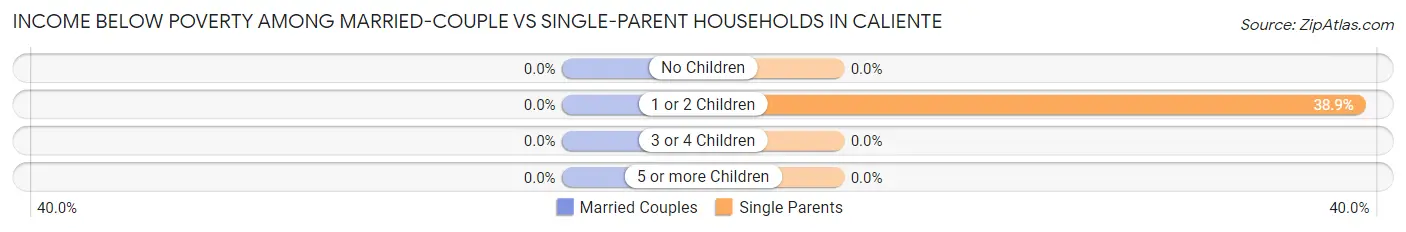
| Children | Married-Couple Families | Single-Parent Households |
| No Children | 0 (0.0%) | 0 (0.0%) |
| 1 or 2 Children | 0 (0.0%) | 7 (38.9%) |
| 3 or 4 Children | 0 (0.0%) | 0 (0.0%) |
| 5 or more Children | 0 (0.0%) | 0 (0.0%) |
| Total | 0 (0.0%) | 7 (25.0%) |
Race in Caliente
The most populous races in Caliente are White / Caucasian (744 | 88.6%), Two or more Races (46 | 5.5%), and Black / African American (22 | 2.6%).
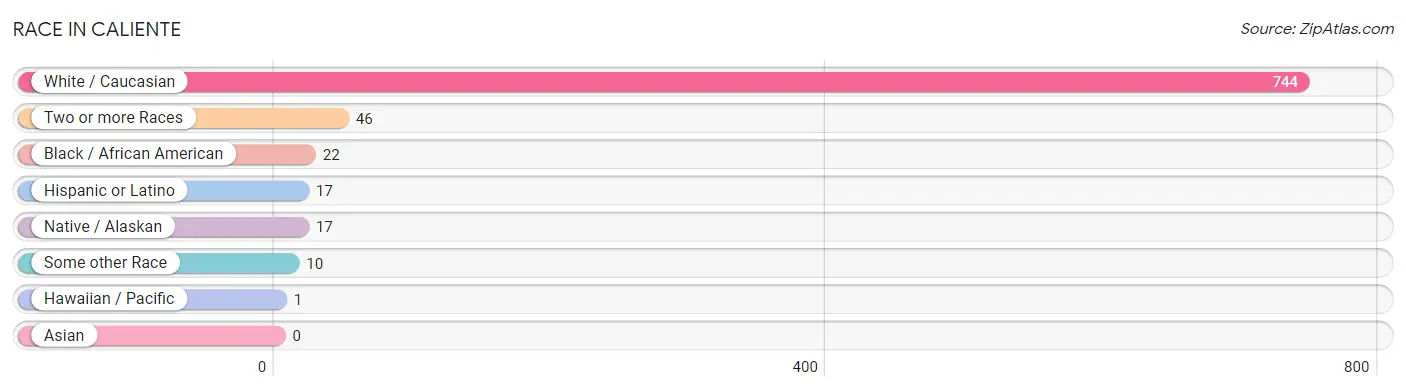
| Race | # Population | % Population |
| Asian | 0 | 0.0% |
| Black / African American | 22 | 2.6% |
| Hawaiian / Pacific | 1 | 0.1% |
| Hispanic or Latino | 17 | 2.0% |
| Native / Alaskan | 17 | 2.0% |
| White / Caucasian | 744 | 88.6% |
| Two or more Races | 46 | 5.5% |
| Some other Race | 10 | 1.2% |
| Total | 840 | 100.0% |
Ancestry in Caliente
The most populous ancestries reported in Caliente are German (124 | 14.8%), English (111 | 13.2%), Irish (84 | 10.0%), French (40 | 4.8%), and American (33 | 3.9%), together accounting for 46.7% of all Caliente residents.
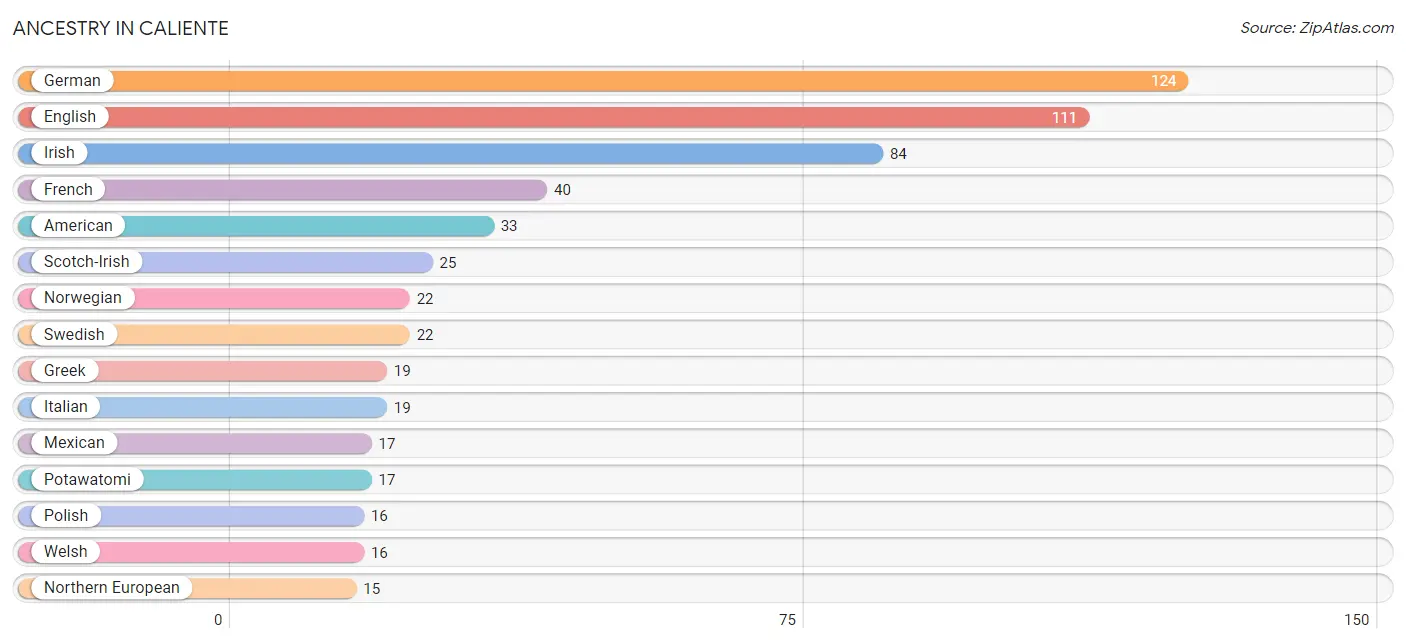
| Ancestry | # Population | % Population |
| African | 3 | 0.4% |
| American | 33 | 3.9% |
| British | 1 | 0.1% |
| Czech | 12 | 1.4% |
| Danish | 9 | 1.1% |
| Dutch | 10 | 1.2% |
| English | 111 | 13.2% |
| European | 1 | 0.1% |
| French | 40 | 4.8% |
| French Canadian | 6 | 0.7% |
| German | 124 | 14.8% |
| Greek | 19 | 2.3% |
| Irish | 84 | 10.0% |
| Italian | 19 | 2.3% |
| Jamaican | 1 | 0.1% |
| Korean | 1 | 0.1% |
| Mexican | 17 | 2.0% |
| Northern European | 15 | 1.8% |
| Norwegian | 22 | 2.6% |
| Polish | 16 | 1.9% |
| Potawatomi | 17 | 2.0% |
| Samoan | 1 | 0.1% |
| Scotch-Irish | 25 | 3.0% |
| Scottish | 7 | 0.8% |
| Subsaharan African | 3 | 0.4% |
| Swedish | 22 | 2.6% |
| Welsh | 16 | 1.9% | View All 27 Rows |
Immigrants in Caliente
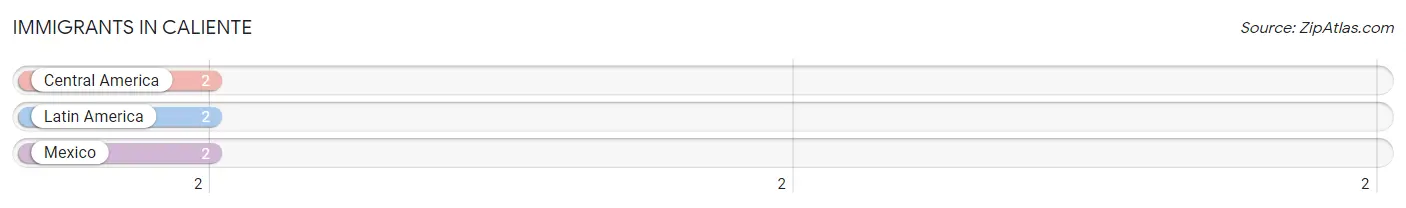
The most numerous immigrant groups reported in Caliente came from Central America (2 | 0.2%), Latin America (2 | 0.2%), and Mexico (2 | 0.2%), together accounting for 0.7% of all Caliente residents.
| Immigration Origin | # Population | % Population |
| Central America | 2 | 0.2% |
| Latin America | 2 | 0.2% |
| Mexico | 2 | 0.2% | View All 3 Rows |
Sex and Age in Caliente
Sex and Age in Caliente
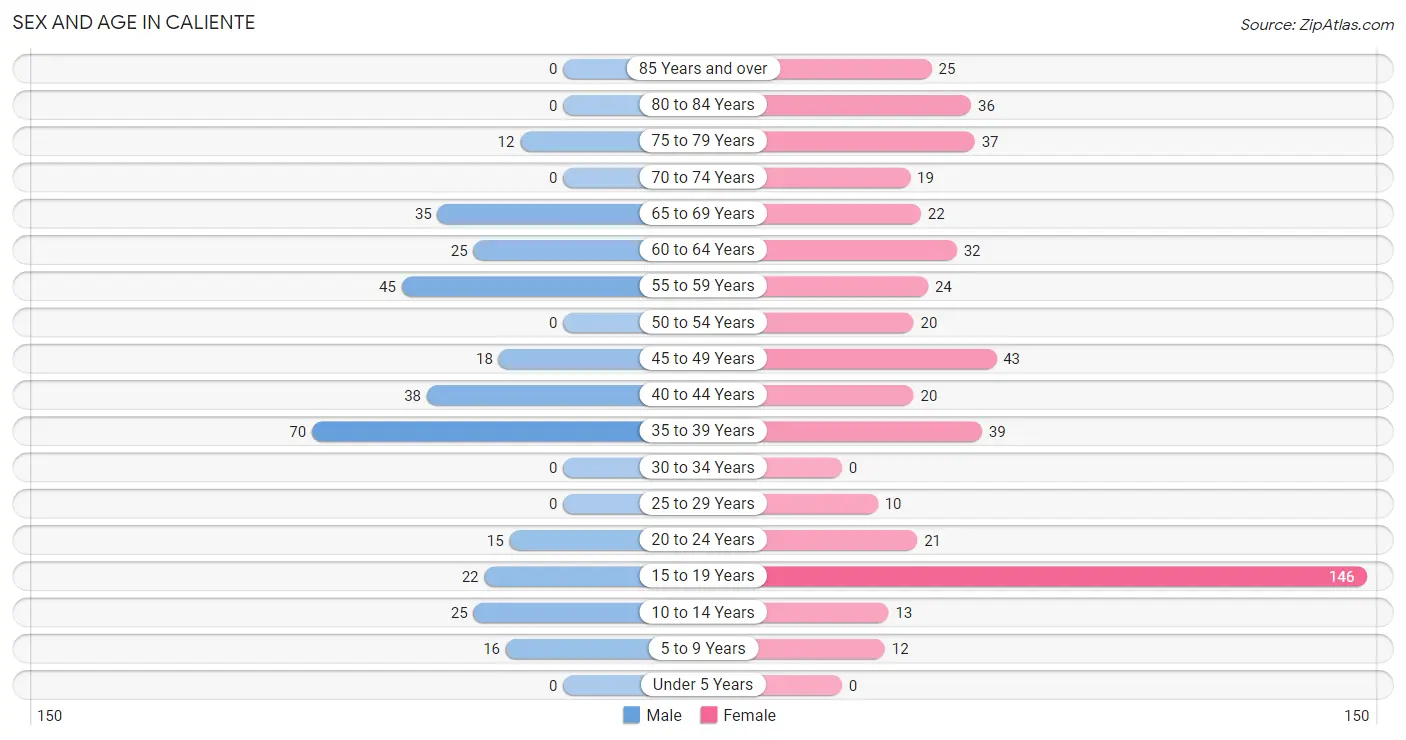
The most populous age groups in Caliente are 35 to 39 Years (70 | 21.8%) for men and 15 to 19 Years (146 | 28.1%) for women.
| Age Bracket | Male | Female |
| Under 5 Years | 0 (0.0%) | 0 (0.0%) |
| 5 to 9 Years | 16 (5.0%) | 12 (2.3%) |
| 10 to 14 Years | 25 (7.8%) | 13 (2.5%) |
| 15 to 19 Years | 22 (6.9%) | 146 (28.1%) |
| 20 to 24 Years | 15 (4.7%) | 21 (4.1%) |
| 25 to 29 Years | 0 (0.0%) | 10 (1.9%) |
| 30 to 34 Years | 0 (0.0%) | 0 (0.0%) |
| 35 to 39 Years | 70 (21.8%) | 39 (7.5%) |
| 40 to 44 Years | 38 (11.8%) | 20 (3.8%) |
| 45 to 49 Years | 18 (5.6%) | 43 (8.3%) |
| 50 to 54 Years | 0 (0.0%) | 20 (3.8%) |
| 55 to 59 Years | 45 (14.0%) | 24 (4.6%) |
| 60 to 64 Years | 25 (7.8%) | 32 (6.2%) |
| 65 to 69 Years | 35 (10.9%) | 22 (4.2%) |
| 70 to 74 Years | 0 (0.0%) | 19 (3.7%) |
| 75 to 79 Years | 12 (3.7%) | 37 (7.1%) |
| 80 to 84 Years | 0 (0.0%) | 36 (6.9%) |
| 85 Years and over | 0 (0.0%) | 25 (4.8%) |
| Total | 321 (100.0%) | 519 (100.0%) |
Families and Households in Caliente
Median Family Size in Caliente
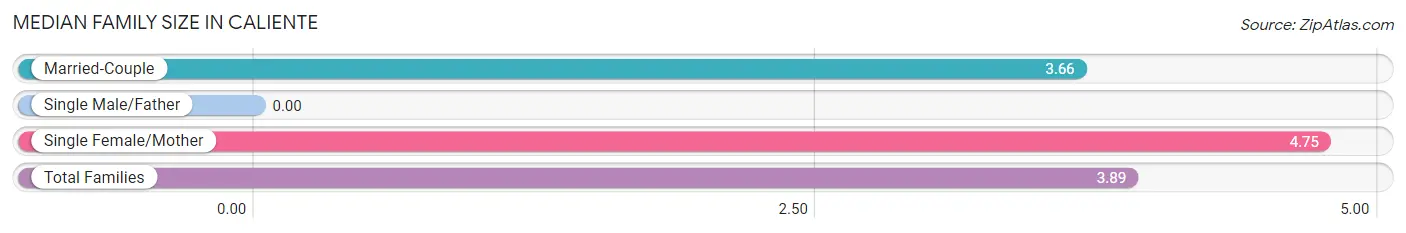
| Family Type | # Families | Family Size |
| Married-Couple | 106 (79.1%) | 3.66 |
| Single Male/Father | 0 (0.0%) | - |
| Single Female/Mother | 28 (20.9%) | 4.75 |
| Total Families | 134 (100.0%) | 3.89 |
Median Household Size in Caliente
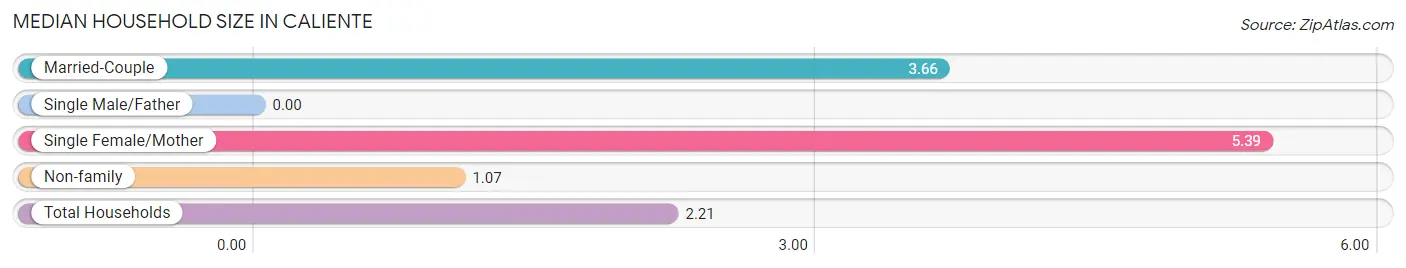
| Household Type | # Households | Household Size |
| Married-Couple | 106 (30.5%) | 3.66 |
| Single Male/Father | 0 (0.0%) | - |
| Single Female/Mother | 28 (8.1%) | 5.39 |
| Non-family | 214 (61.5%) | 1.07 |
| Total Households | 348 (100.0%) | 2.21 |
Household Size by Marriage Status in Caliente
Out of a total of 348 households in Caliente, 134 (38.5%) are family households, while 214 (61.5%) are nonfamily households. The most numerous type of family households are 2-person households, comprising 60, and the most common type of nonfamily households are 1-person households, comprising 204.
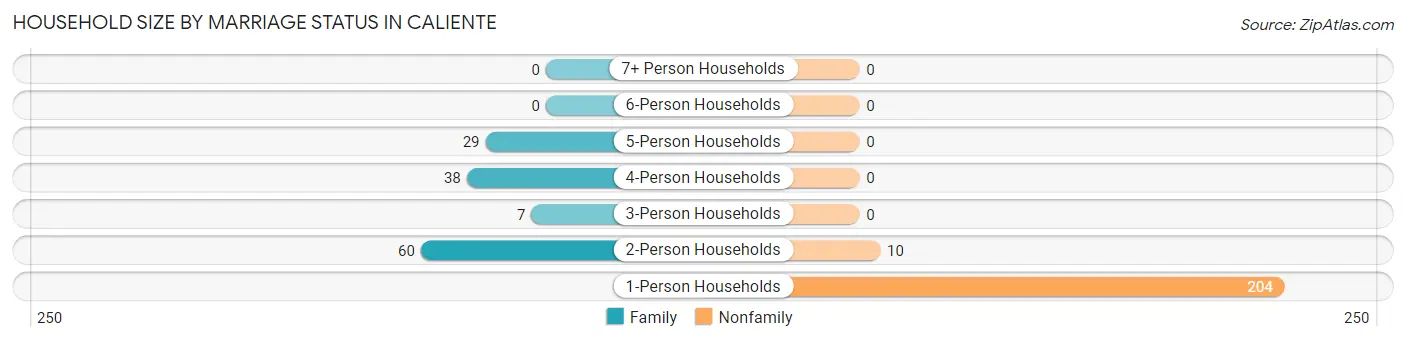
| Household Size | Family Households | Nonfamily Households |
| 1-Person Households | - | 204 (58.6%) |
| 2-Person Households | 60 (17.2%) | 10 (2.9%) |
| 3-Person Households | 7 (2.0%) | 0 (0.0%) |
| 4-Person Households | 38 (10.9%) | 0 (0.0%) |
| 5-Person Households | 29 (8.3%) | 0 (0.0%) |
| 6-Person Households | 0 (0.0%) | 0 (0.0%) |
| 7+ Person Households | 0 (0.0%) | 0 (0.0%) |
| Total | 134 (38.5%) | 214 (61.5%) |
Female Fertility in Caliente
Fertility by Age in Caliente
| Age Bracket | Women with Births | Births / 1,000 Women |
| 15 to 19 years | 0 (0.0%) | 0.0 |
| 20 to 34 years | 0 (0.0%) | 0.0 |
| 35 to 50 years | 0 (0.0%) | 0.0 |
| Total | 0 (0.0%) | 0.0 |
Fertility by Age by Marriage Status in Caliente
| Age Bracket | Married | Unmarried |
| 15 to 19 years | 0 (0.0%) | 0 (0.0%) |
| 20 to 34 years | 0 (0.0%) | 0 (0.0%) |
| 35 to 50 years | 0 (0.0%) | 0 (0.0%) |
| Total | 0 (0.0%) | 0 (0.0%) |
Fertility by Education in Caliente
| Educational Attainment | Women with Births | Births / 1,000 Women |
| Less than High School | 0 (0.0%) | 0.0 |
| High School Diploma | 0 (0.0%) | 0.0 |
| College or Associate's Degree | 0 (0.0%) | 0.0 |
| Bachelor's Degree | 0 (0.0%) | 0.0 |
| Graduate Degree | 0 (0.0%) | 0.0 |
| Total | 0 (0.0%) | 0.0 |
Fertility by Education by Marriage Status in Caliente
| Educational Attainment | Married | Unmarried |
| Less than High School | 0 (0.0%) | 0 (0.0%) |
| High School Diploma | 0 (0.0%) | 0 (0.0%) |
| College or Associate's Degree | 0 (0.0%) | 0 (0.0%) |
| Bachelor's Degree | 0 (0.0%) | 0 (0.0%) |
| Graduate Degree | 0 (0.0%) | 0 (0.0%) |
| Total | 0 (0.0%) | 0 (0.0%) |
Employment Characteristics in Caliente
Employment by Class of Employer in Caliente
Among the 346 employed individuals in Caliente, private company employees (177 | 51.2%), self-employed (not incorporated) (47 | 13.6%), and state government employees (44 | 12.7%) make up the most common classes of employment.
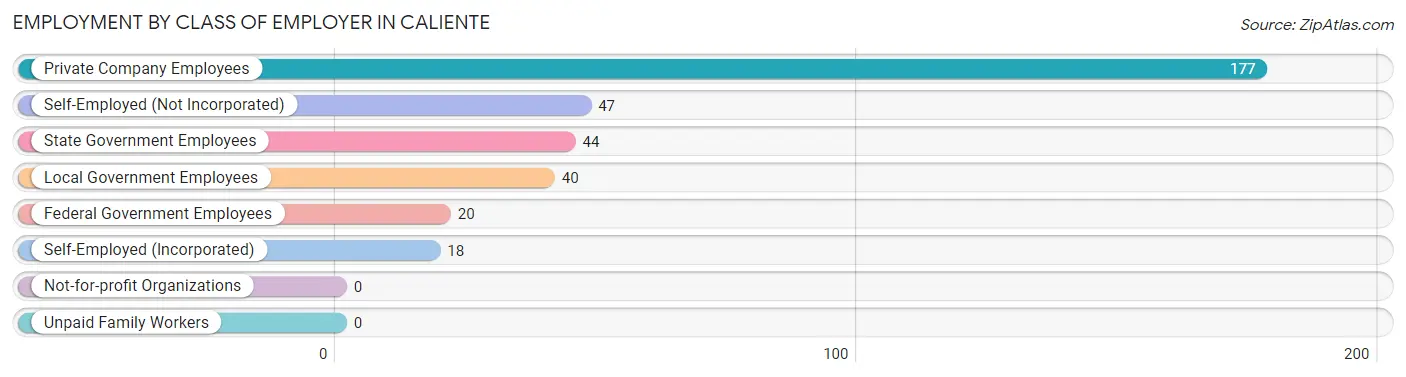
| Employer Class | # Employees | % Employees |
| Private Company Employees | 177 | 51.2% |
| Self-Employed (Incorporated) | 18 | 5.2% |
| Self-Employed (Not Incorporated) | 47 | 13.6% |
| Not-for-profit Organizations | 0 | 0.0% |
| Local Government Employees | 40 | 11.6% |
| State Government Employees | 44 | 12.7% |
| Federal Government Employees | 20 | 5.8% |
| Unpaid Family Workers | 0 | 0.0% |
| Total | 346 | 100.0% |
Employment Status by Age in Caliente
According to the labor force statistics for Caliente, out of the total population over 16 years of age (732), 49.3% or 361 individuals are in the labor force, with 4.2% or 15 of them unemployed. The age group with the highest labor force participation rate is 55 to 59 years, with 82.6% or 57 individuals in the labor force. Within the labor force, the 20 to 24 years age range has the highest percentage of unemployed individuals, with 100.0% or 15 of them being unemployed.
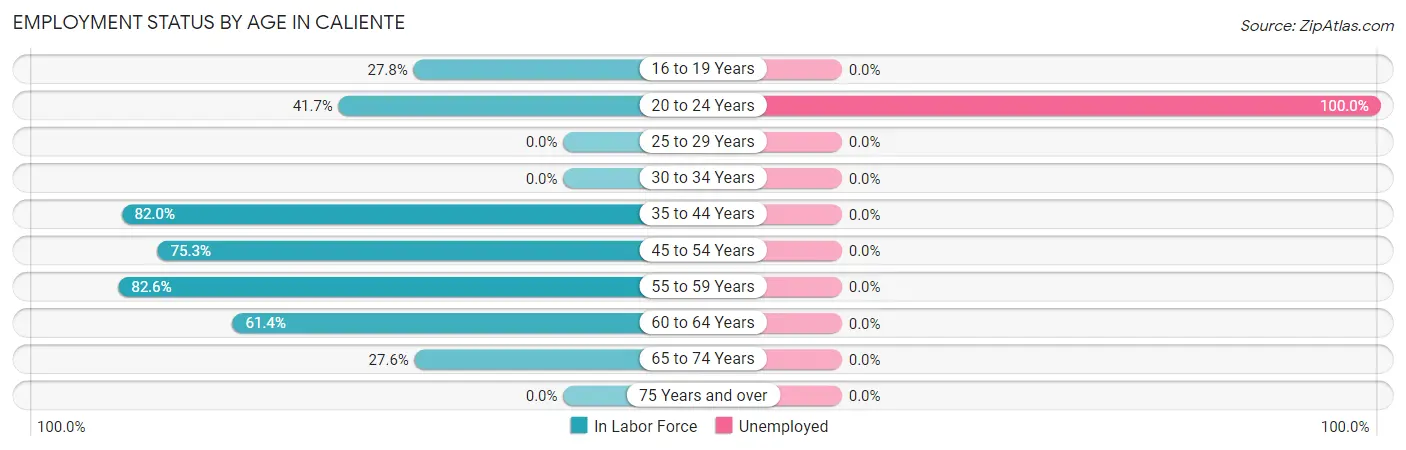
| Age Bracket | In Labor Force | Unemployed |
| 16 to 19 Years | 35 (27.8%) | 0 (0.0%) |
| 20 to 24 Years | 15 (41.7%) | 15 (100.0%) |
| 25 to 29 Years | 0 (0.0%) | 0 (0.0%) |
| 30 to 34 Years | 0 (0.0%) | 0 (0.0%) |
| 35 to 44 Years | 137 (82.0%) | 0 (0.0%) |
| 45 to 54 Years | 61 (75.3%) | 0 (0.0%) |
| 55 to 59 Years | 57 (82.6%) | 0 (0.0%) |
| 60 to 64 Years | 35 (61.4%) | 0 (0.0%) |
| 65 to 74 Years | 21 (27.6%) | 0 (0.0%) |
| 75 Years and over | 0 (0.0%) | 0 (0.0%) |
| Total | 361 (49.3%) | 15 (4.2%) |
Employment Status by Educational Attainment in Caliente
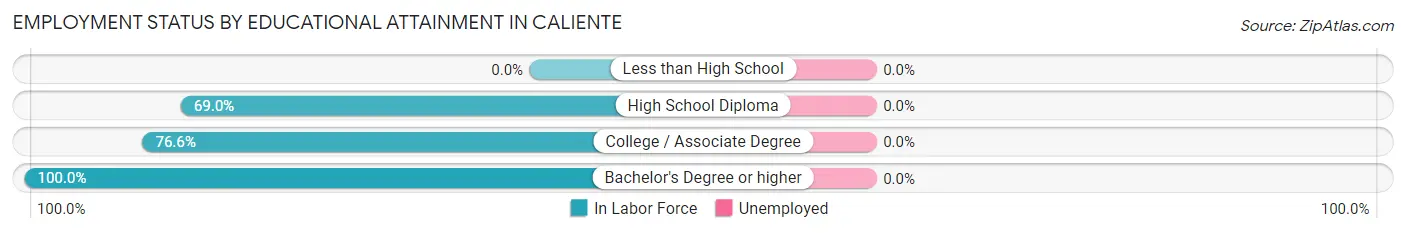
| Educational Attainment | In Labor Force | Unemployed |
| Less than High School | 0 (0.0%) | 0 (0.0%) |
| High School Diploma | 120 (69.0%) | 0 (0.0%) |
| College / Associate Degree | 59 (76.6%) | 0 (0.0%) |
| Bachelor's Degree or higher | 111 (100.0%) | 0 (0.0%) |
| Total | 290 (75.5%) | 0 (0.0%) |
Employment Occupations by Sex in Caliente
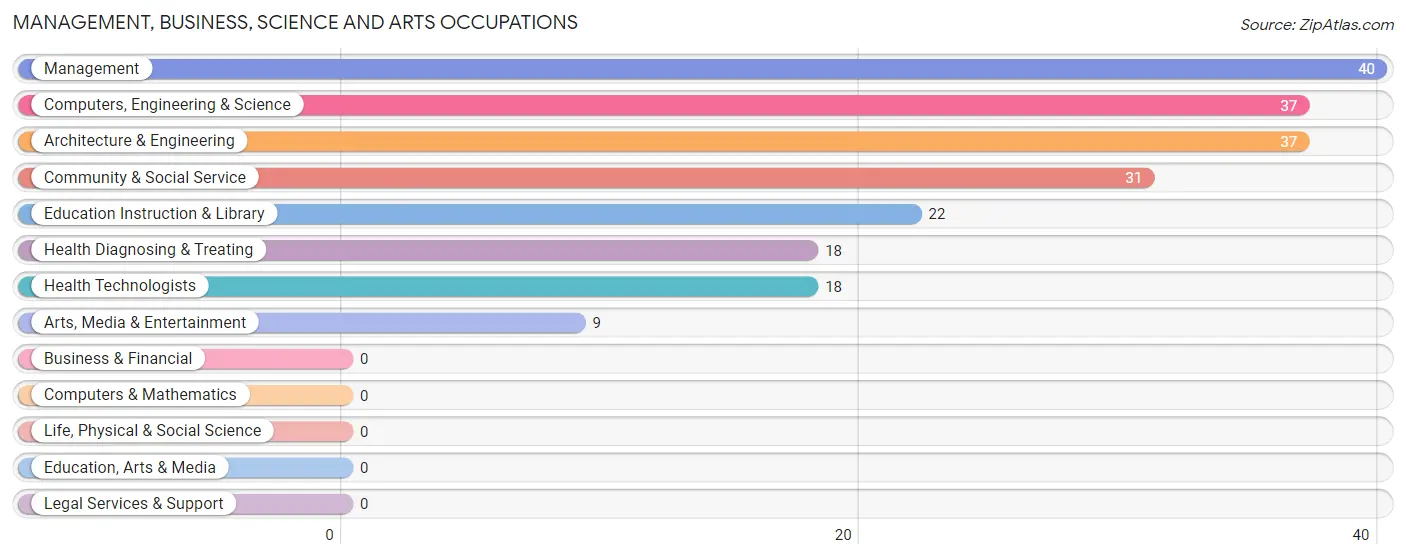
Management, Business, Science and Arts Occupations
The most common Management, Business, Science and Arts occupations in Caliente are Management (40 | 11.6%), Computers, Engineering & Science (37 | 10.7%), Architecture & Engineering (37 | 10.7%), Community & Social Service (31 | 9.0%), and Education Instruction & Library (22 | 6.4%).
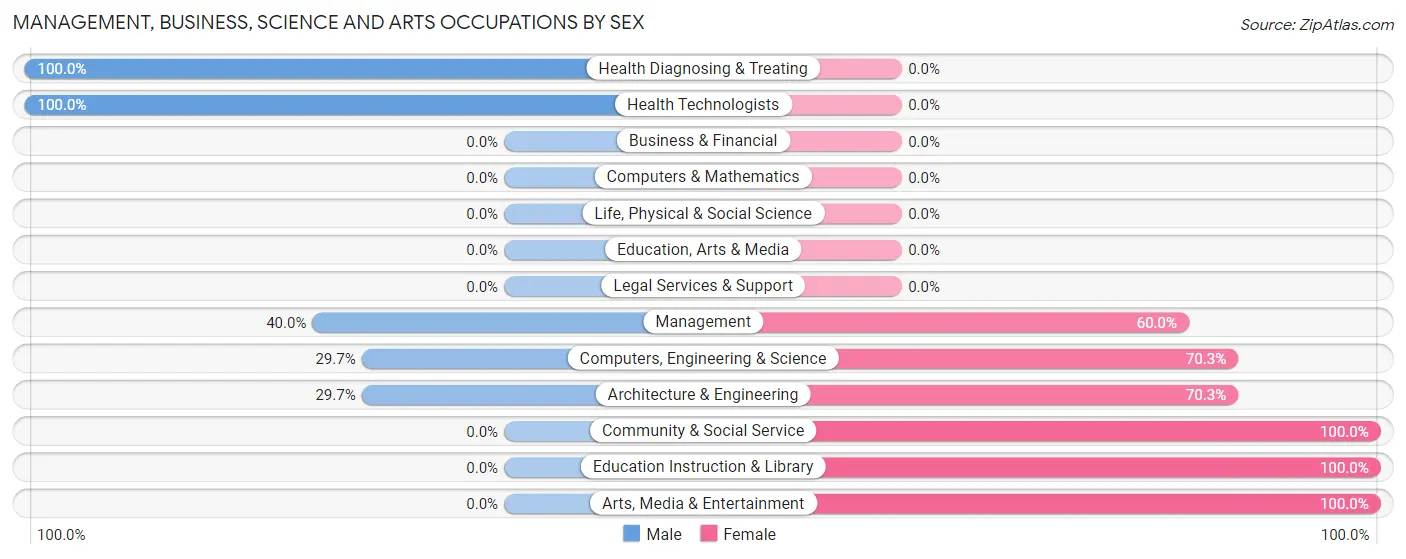
Management, Business, Science and Arts Occupations by Sex
Within the Management, Business, Science and Arts occupations in Caliente, the most male-oriented occupations are Health Diagnosing & Treating (100.0%), Health Technologists (100.0%), and Management (40.0%), while the most female-oriented occupations are Community & Social Service (100.0%), Education Instruction & Library (100.0%), and Arts, Media & Entertainment (100.0%).
| Occupation | Male | Female |
| Management | 16 (40.0%) | 24 (60.0%) |
| Business & Financial | 0 (0.0%) | 0 (0.0%) |
| Computers, Engineering & Science | 11 (29.7%) | 26 (70.3%) |
| Computers & Mathematics | 0 (0.0%) | 0 (0.0%) |
| Architecture & Engineering | 11 (29.7%) | 26 (70.3%) |
| Life, Physical & Social Science | 0 (0.0%) | 0 (0.0%) |
| Community & Social Service | 0 (0.0%) | 31 (100.0%) |
| Education, Arts & Media | 0 (0.0%) | 0 (0.0%) |
| Legal Services & Support | 0 (0.0%) | 0 (0.0%) |
| Education Instruction & Library | 0 (0.0%) | 22 (100.0%) |
| Arts, Media & Entertainment | 0 (0.0%) | 9 (100.0%) |
| Health Diagnosing & Treating | 18 (100.0%) | 0 (0.0%) |
| Health Technologists | 18 (100.0%) | 0 (0.0%) |
| Total (Category) | 45 (35.7%) | 81 (64.3%) |
| Total (Overall) | 180 (52.0%) | 166 (48.0%) |
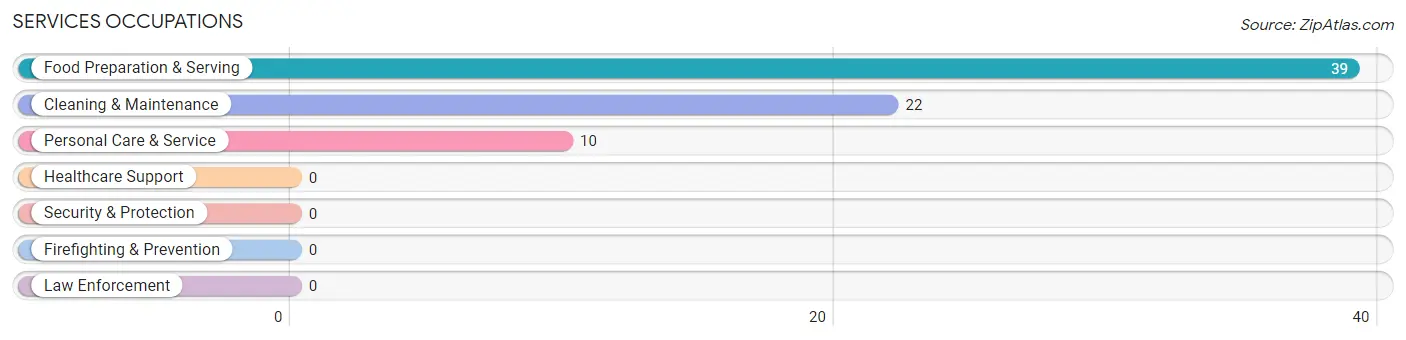
Services Occupations
The most common Services occupations in Caliente are Food Preparation & Serving (39 | 11.3%), Cleaning & Maintenance (22 | 6.4%), and Personal Care & Service (10 | 2.9%).
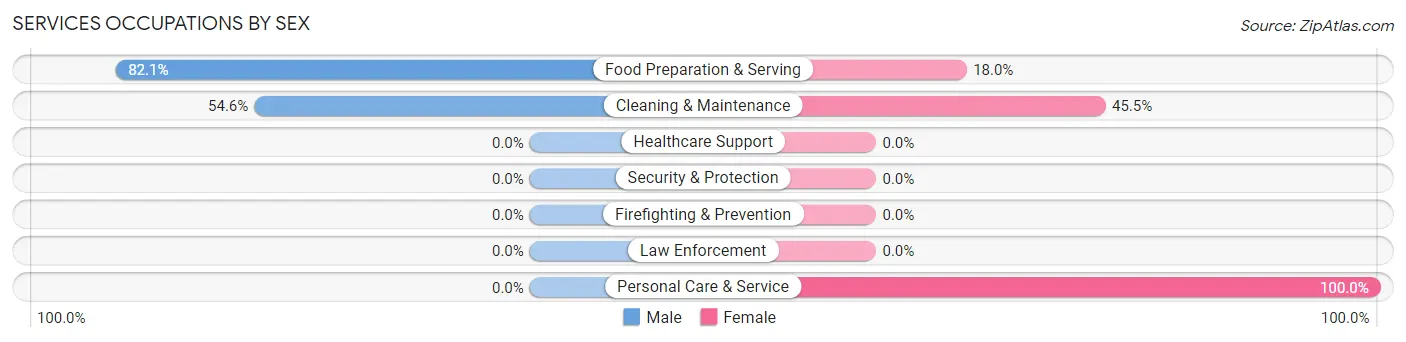
Services Occupations by Sex
Within the Services occupations in Caliente, the most male-oriented occupations are Food Preparation & Serving (82.1%), and Cleaning & Maintenance (54.5%), while the most female-oriented occupations are Personal Care & Service (100.0%), Cleaning & Maintenance (45.5%), and Food Preparation & Serving (17.9%).
| Occupation | Male | Female |
| Healthcare Support | 0 (0.0%) | 0 (0.0%) |
| Security & Protection | 0 (0.0%) | 0 (0.0%) |
| Firefighting & Prevention | 0 (0.0%) | 0 (0.0%) |
| Law Enforcement | 0 (0.0%) | 0 (0.0%) |
| Food Preparation & Serving | 32 (82.1%) | 7 (17.9%) |
| Cleaning & Maintenance | 12 (54.5%) | 10 (45.5%) |
| Personal Care & Service | 0 (0.0%) | 10 (100.0%) |
| Total (Category) | 44 (62.0%) | 27 (38.0%) |
| Total (Overall) | 180 (52.0%) | 166 (48.0%) |
Sales and Office Occupations
The most common Sales and Office occupations in Caliente are Office & Administration (64 | 18.5%), and Sales & Related (34 | 9.8%).
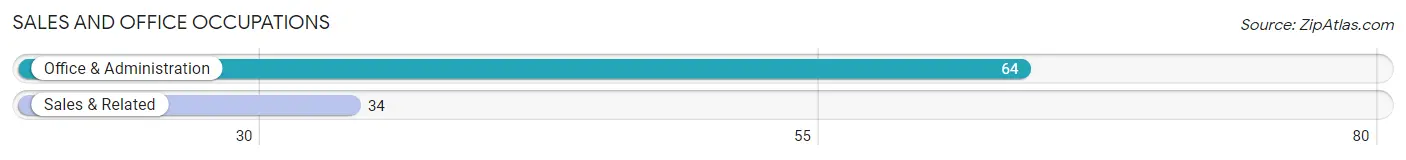
Sales and Office Occupations by Sex
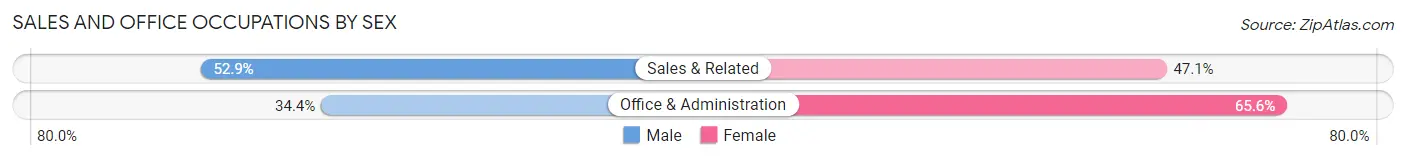
| Occupation | Male | Female |
| Sales & Related | 18 (52.9%) | 16 (47.1%) |
| Office & Administration | 22 (34.4%) | 42 (65.6%) |
| Total (Category) | 40 (40.8%) | 58 (59.2%) |
| Total (Overall) | 180 (52.0%) | 166 (48.0%) |
Natural Resources, Construction and Maintenance Occupations
The most common Natural Resources, Construction and Maintenance occupations in Caliente are , and Construction & Extraction (33 | 9.5%).
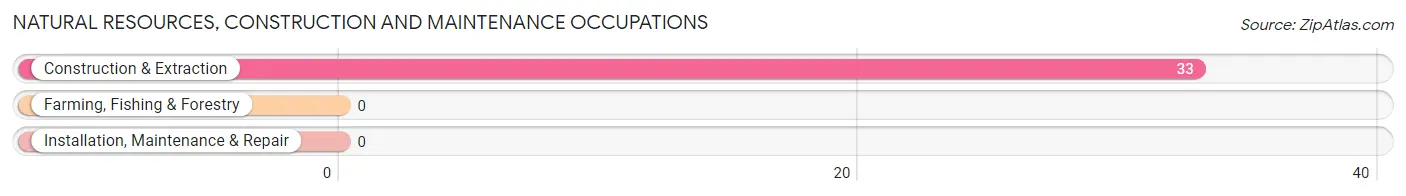
Natural Resources, Construction and Maintenance Occupations by Sex
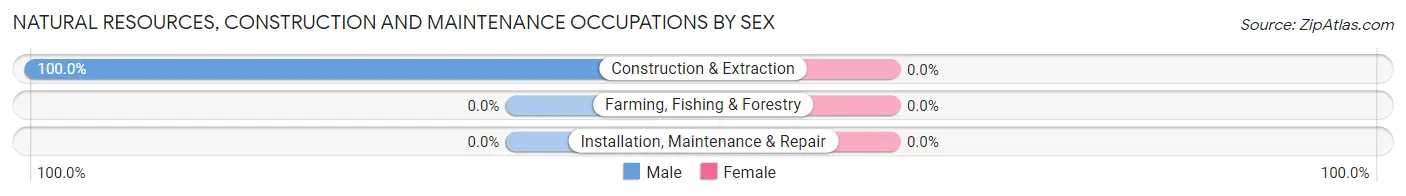
| Occupation | Male | Female |
| Farming, Fishing & Forestry | 0 (0.0%) | 0 (0.0%) |
| Construction & Extraction | 33 (100.0%) | 0 (0.0%) |
| Installation, Maintenance & Repair | 0 (0.0%) | 0 (0.0%) |
| Total (Category) | 33 (100.0%) | 0 (0.0%) |
| Total (Overall) | 180 (52.0%) | 166 (48.0%) |
Production, Transportation and Moving Occupations
The most common Production, Transportation and Moving occupations in Caliente are , and Transportation (18 | 5.2%).
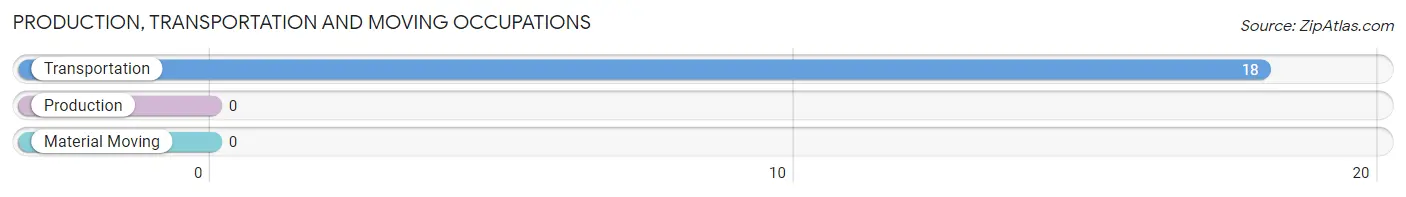
Production, Transportation and Moving Occupations by Sex
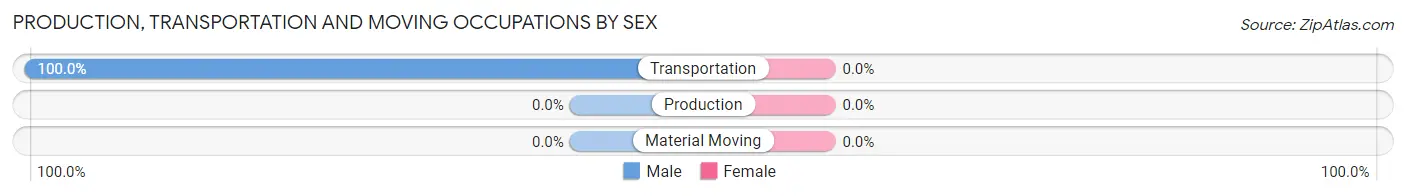
| Occupation | Male | Female |
| Production | 0 (0.0%) | 0 (0.0%) |
| Transportation | 18 (100.0%) | 0 (0.0%) |
| Material Moving | 0 (0.0%) | 0 (0.0%) |
| Total (Category) | 18 (100.0%) | 0 (0.0%) |
| Total (Overall) | 180 (52.0%) | 166 (48.0%) |
Employment Industries by Sex in Caliente
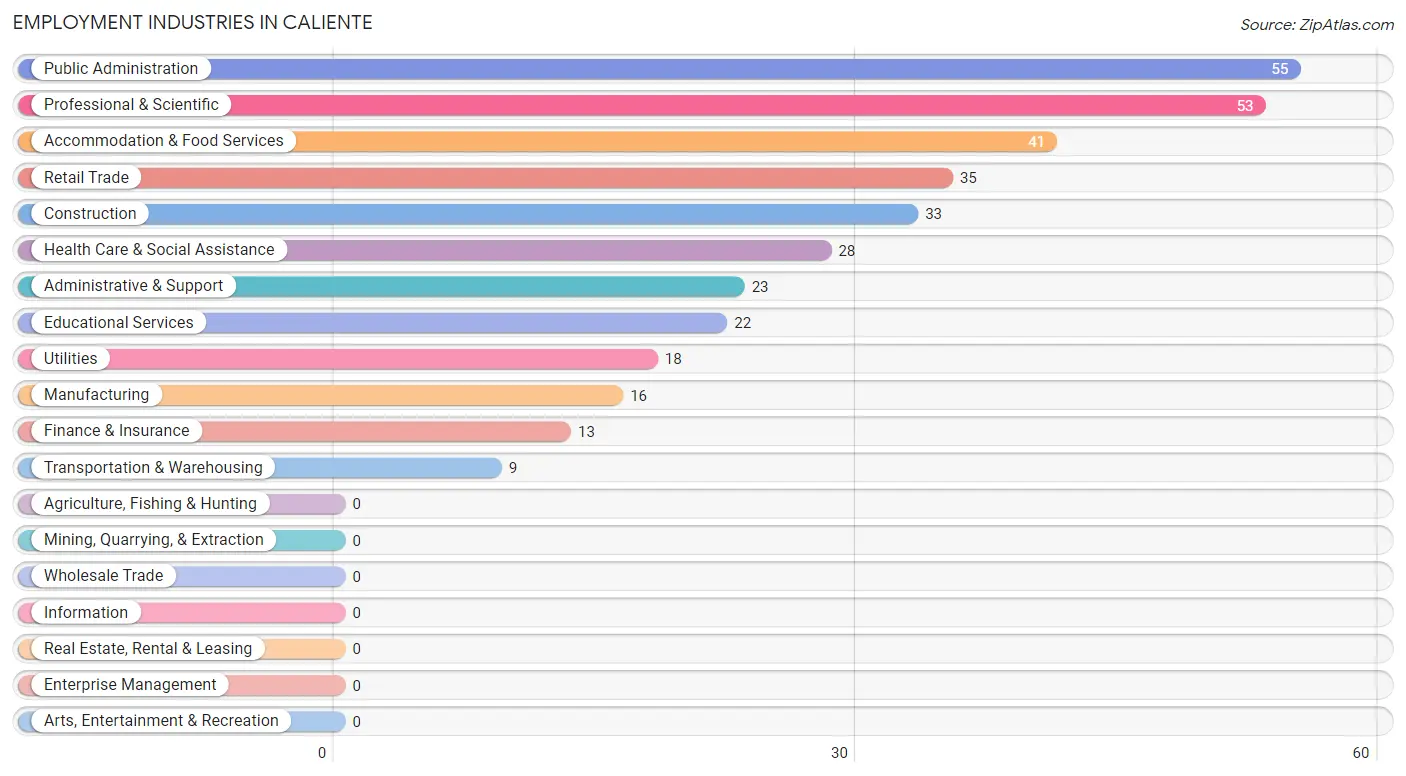
Employment Industries in Caliente
The major employment industries in Caliente include Public Administration (55 | 15.9%), Professional & Scientific (53 | 15.3%), Accommodation & Food Services (41 | 11.8%), Retail Trade (35 | 10.1%), and Construction (33 | 9.5%).
Employment Industries by Sex in Caliente
The Caliente industries that see more men than women are Construction (100.0%), Manufacturing (100.0%), and Transportation & Warehousing (100.0%), whereas the industries that tend to have a higher number of women are Educational Services (100.0%), Accommodation & Food Services (100.0%), and Professional & Scientific (66.0%).
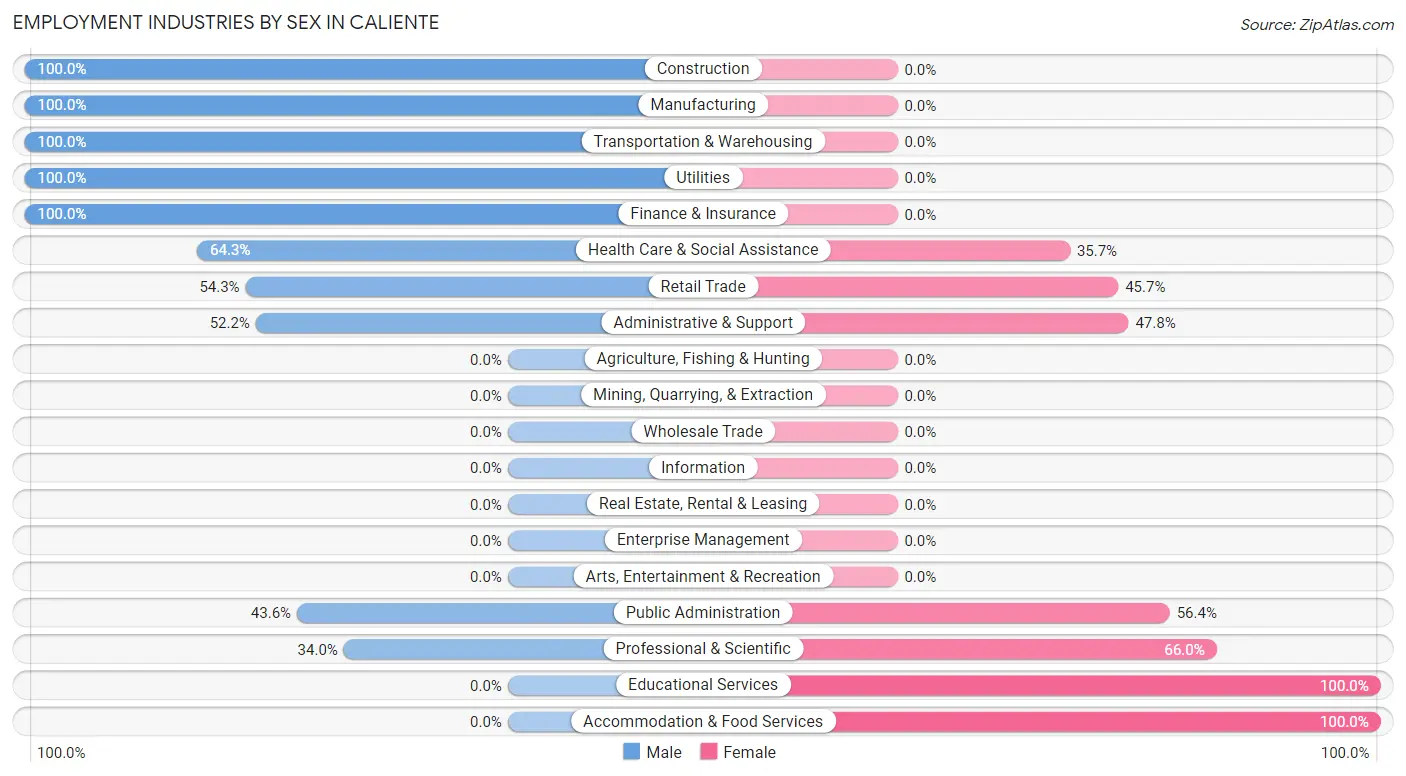
| Industry | Male | Female |
| Agriculture, Fishing & Hunting | 0 (0.0%) | 0 (0.0%) |
| Mining, Quarrying, & Extraction | 0 (0.0%) | 0 (0.0%) |
| Construction | 33 (100.0%) | 0 (0.0%) |
| Manufacturing | 16 (100.0%) | 0 (0.0%) |
| Wholesale Trade | 0 (0.0%) | 0 (0.0%) |
| Retail Trade | 19 (54.3%) | 16 (45.7%) |
| Transportation & Warehousing | 9 (100.0%) | 0 (0.0%) |
| Utilities | 18 (100.0%) | 0 (0.0%) |
| Information | 0 (0.0%) | 0 (0.0%) |
| Finance & Insurance | 13 (100.0%) | 0 (0.0%) |
| Real Estate, Rental & Leasing | 0 (0.0%) | 0 (0.0%) |
| Professional & Scientific | 18 (34.0%) | 35 (66.0%) |
| Enterprise Management | 0 (0.0%) | 0 (0.0%) |
| Administrative & Support | 12 (52.2%) | 11 (47.8%) |
| Educational Services | 0 (0.0%) | 22 (100.0%) |
| Health Care & Social Assistance | 18 (64.3%) | 10 (35.7%) |
| Arts, Entertainment & Recreation | 0 (0.0%) | 0 (0.0%) |
| Accommodation & Food Services | 0 (0.0%) | 41 (100.0%) |
| Public Administration | 24 (43.6%) | 31 (56.4%) |
| Total | 180 (52.0%) | 166 (48.0%) |
Education in Caliente
School Enrollment in Caliente
The most common levels of schooling among the 178 students in Caliente are high school (112 | 62.9%), middle school (38 | 21.3%), and elementary school (28 | 15.7%).
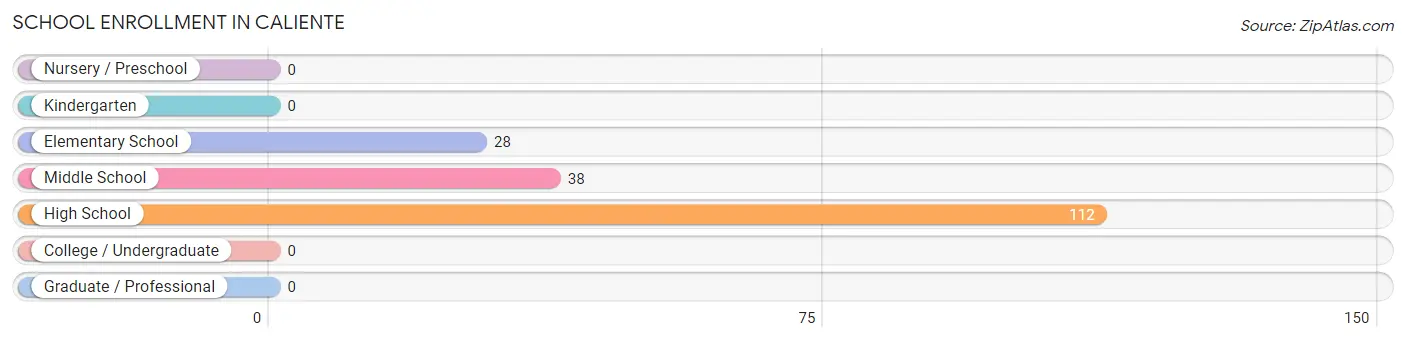
| School Level | # Students | % Students |
| Nursery / Preschool | 0 | 0.0% |
| Kindergarten | 0 | 0.0% |
| Elementary School | 28 | 15.7% |
| Middle School | 38 | 21.3% |
| High School | 112 | 62.9% |
| College / Undergraduate | 0 | 0.0% |
| Graduate / Professional | 0 | 0.0% |
| Total | 178 | 100.0% |
School Enrollment by Age by Funding Source in Caliente
Out of a total of 178 students who are enrolled in schools in Caliente, 2 (1.1%) attend a private institution, while the remaining 176 (98.9%) are enrolled in public schools. The age group of 10 to 14 year olds has the highest likelihood of being enrolled in private schools, with 1 (2.6% in the age bracket) enrolled. Conversely, the age group of 5 to 9 year old has the lowest likelihood of being enrolled in a private school, with 28 (100.0% in the age bracket) attending a public institution.
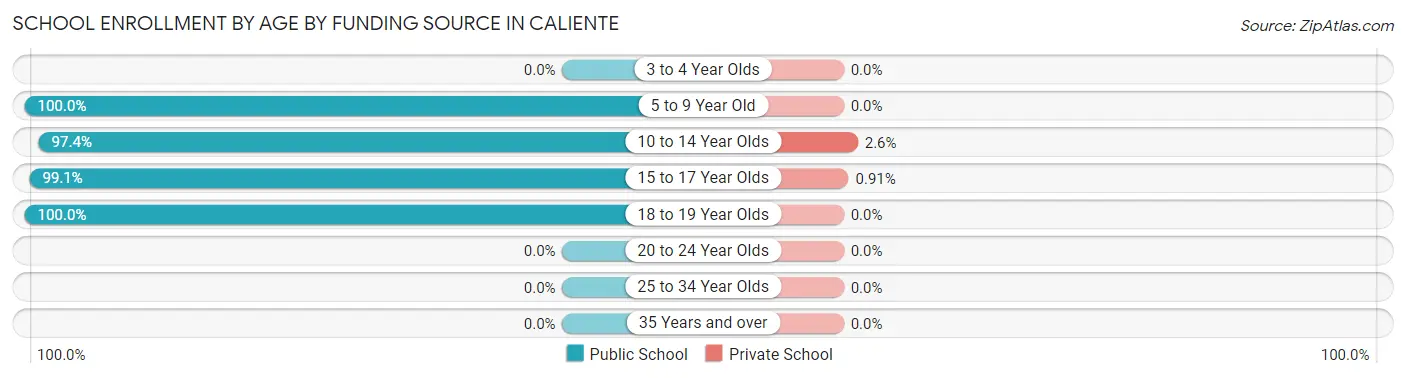
| Age Bracket | Public School | Private School |
| 3 to 4 Year Olds | 0 (0.0%) | 0 (0.0%) |
| 5 to 9 Year Old | 28 (100.0%) | 0 (0.0%) |
| 10 to 14 Year Olds | 37 (97.4%) | 1 (2.6%) |
| 15 to 17 Year Olds | 109 (99.1%) | 1 (0.9%) |
| 18 to 19 Year Olds | 2 (100.0%) | 0 (0.0%) |
| 20 to 24 Year Olds | 0 (0.0%) | 0 (0.0%) |
| 25 to 34 Year Olds | 0 (0.0%) | 0 (0.0%) |
| 35 Years and over | 0 (0.0%) | 0 (0.0%) |
| Total | 176 (98.9%) | 2 (1.1%) |
Educational Attainment by Field of Study in Caliente
Education (45 | 31.0%), business (39 | 26.9%), science & technology (18 | 12.4%), literature & languages (16 | 11.0%), and engineering (11 | 7.6%) are the most common fields of study among 145 individuals in Caliente who have obtained a bachelor's degree or higher.
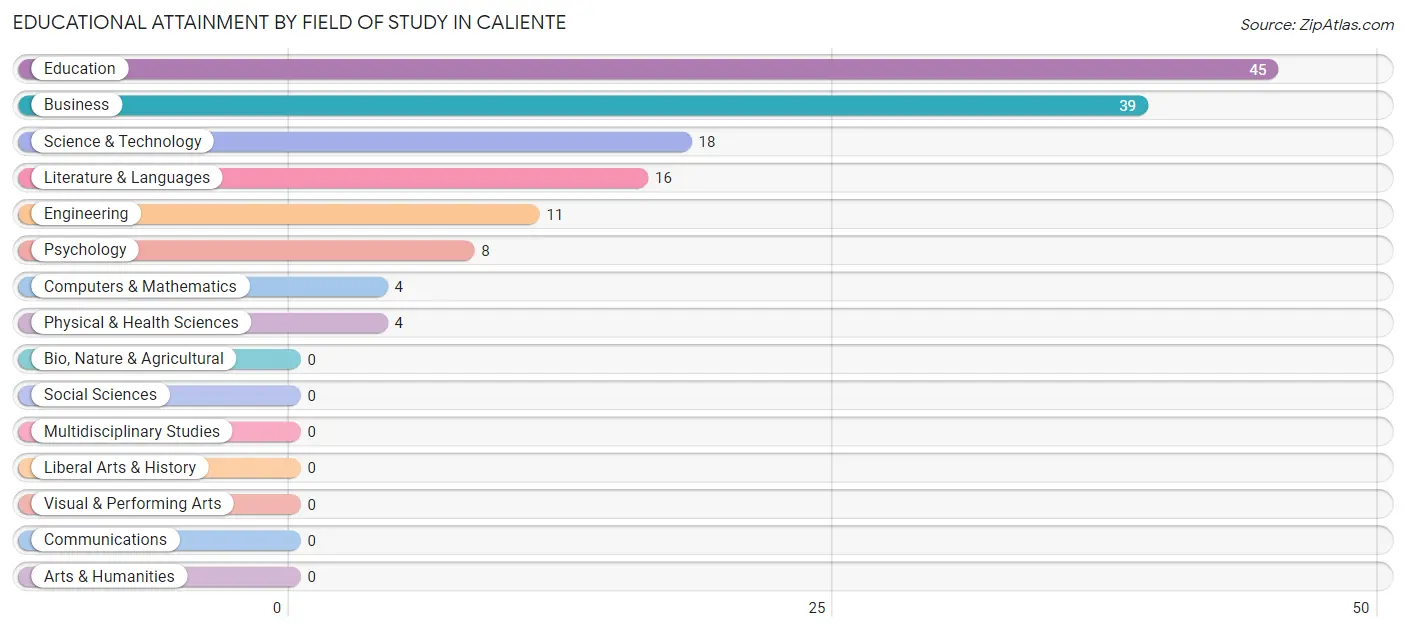
| Field of Study | # Graduates | % Graduates |
| Computers & Mathematics | 4 | 2.8% |
| Bio, Nature & Agricultural | 0 | 0.0% |
| Physical & Health Sciences | 4 | 2.8% |
| Psychology | 8 | 5.5% |
| Social Sciences | 0 | 0.0% |
| Engineering | 11 | 7.6% |
| Multidisciplinary Studies | 0 | 0.0% |
| Science & Technology | 18 | 12.4% |
| Business | 39 | 26.9% |
| Education | 45 | 31.0% |
| Literature & Languages | 16 | 11.0% |
| Liberal Arts & History | 0 | 0.0% |
| Visual & Performing Arts | 0 | 0.0% |
| Communications | 0 | 0.0% |
| Arts & Humanities | 0 | 0.0% |
| Total | 145 | 100.0% |
Transportation & Commute in Caliente
Vehicle Availability by Sex in Caliente
The most prevalent vehicle ownership categories in Caliente are males with 2 vehicles (68, accounting for 37.8%) and females with 2 vehicles (58, making up 41.0%).
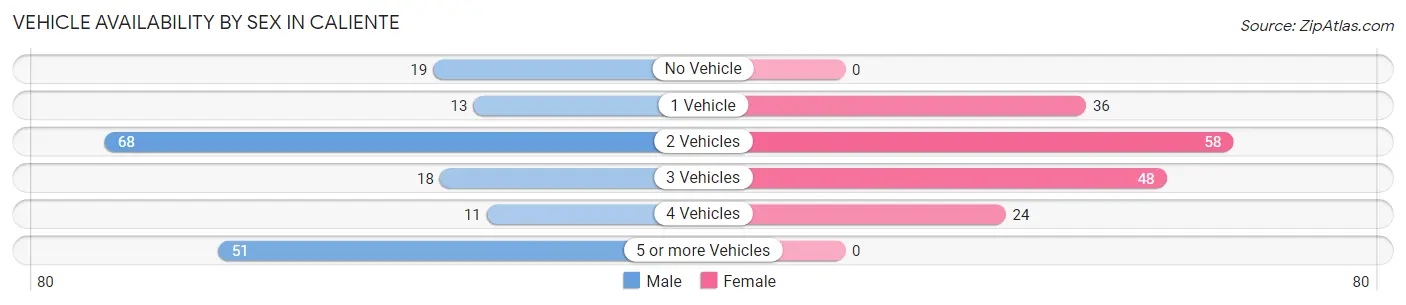
| Vehicles Available | Male | Female |
| No Vehicle | 19 (10.6%) | 0 (0.0%) |
| 1 Vehicle | 13 (7.2%) | 36 (21.7%) |
| 2 Vehicles | 68 (37.8%) | 58 (34.9%) |
| 3 Vehicles | 18 (10.0%) | 48 (28.9%) |
| 4 Vehicles | 11 (6.1%) | 24 (14.5%) |
| 5 or more Vehicles | 51 (28.3%) | 0 (0.0%) |
| Total | 180 (100.0%) | 166 (100.0%) |
Commute Time in Caliente
The most frequently occuring commute durations in Caliente are less than 5 minutes (77 commuters, 30.9%), 5 to 9 minutes (63 commuters, 25.3%), and 45 to 59 minutes (51 commuters, 20.5%).
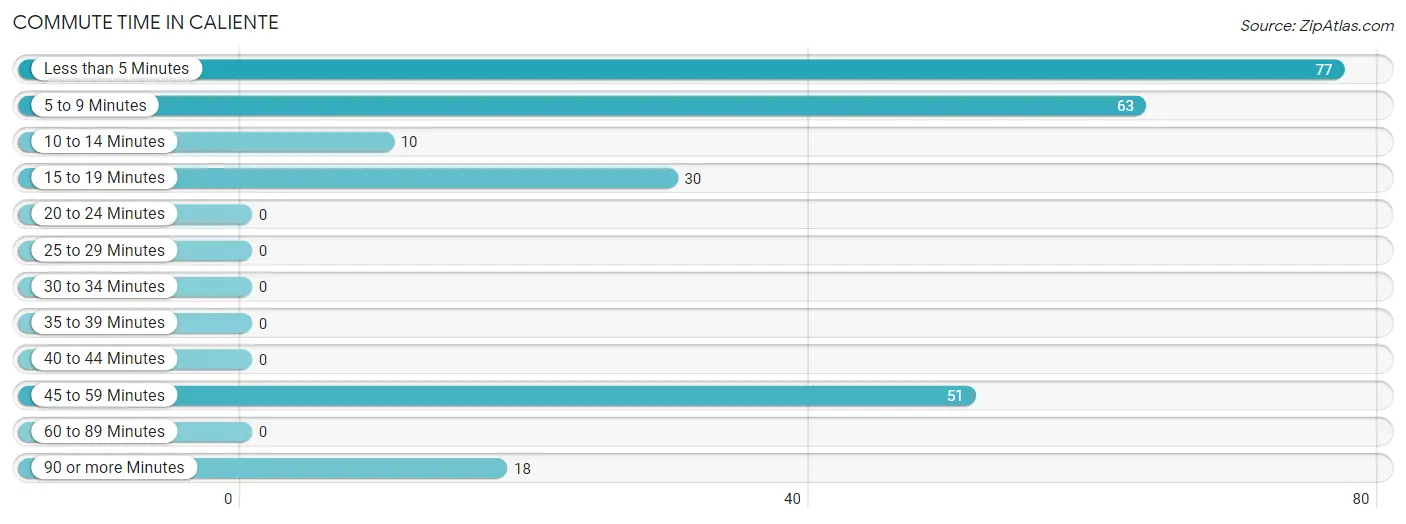
| Commute Time | # Commuters | % Commuters |
| Less than 5 Minutes | 77 | 30.9% |
| 5 to 9 Minutes | 63 | 25.3% |
| 10 to 14 Minutes | 10 | 4.0% |
| 15 to 19 Minutes | 30 | 12.0% |
| 20 to 24 Minutes | 0 | 0.0% |
| 25 to 29 Minutes | 0 | 0.0% |
| 30 to 34 Minutes | 0 | 0.0% |
| 35 to 39 Minutes | 0 | 0.0% |
| 40 to 44 Minutes | 0 | 0.0% |
| 45 to 59 Minutes | 51 | 20.5% |
| 60 to 89 Minutes | 0 | 0.0% |
| 90 or more Minutes | 18 | 7.2% |
Commute Time by Sex in Caliente
The most common commute times in Caliente are 45 to 59 minutes (51 commuters, 30.4%) for males and less than 5 minutes (42 commuters, 51.8%) for females.
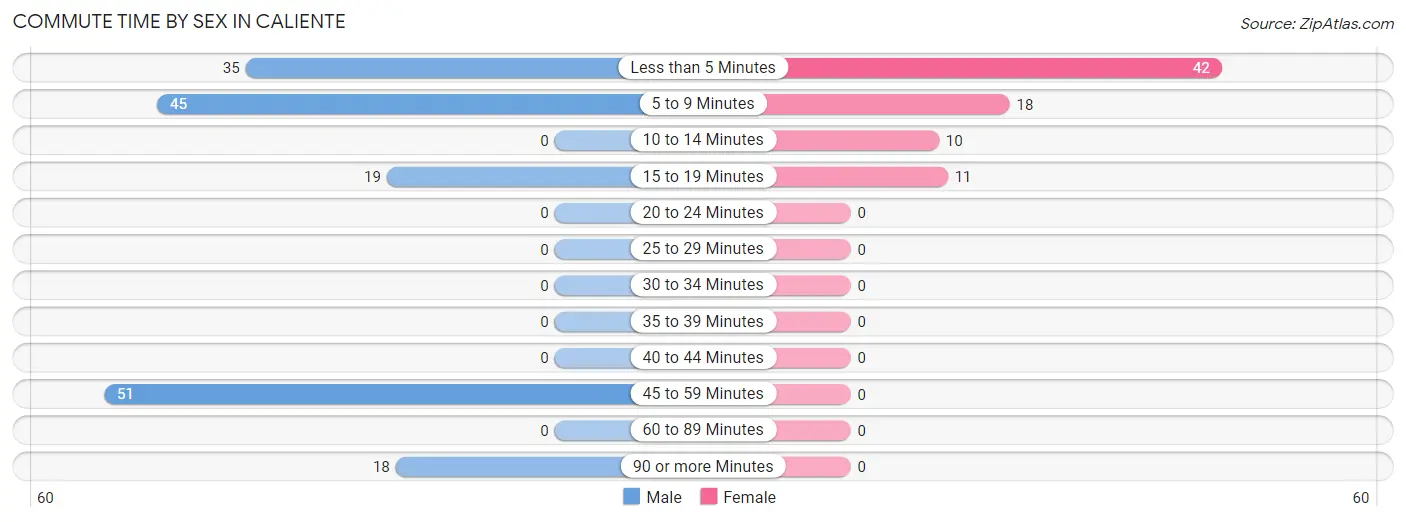
| Commute Time | Male | Female |
| Less than 5 Minutes | 35 (20.8%) | 42 (51.8%) |
| 5 to 9 Minutes | 45 (26.8%) | 18 (22.2%) |
| 10 to 14 Minutes | 0 (0.0%) | 10 (12.3%) |
| 15 to 19 Minutes | 19 (11.3%) | 11 (13.6%) |
| 20 to 24 Minutes | 0 (0.0%) | 0 (0.0%) |
| 25 to 29 Minutes | 0 (0.0%) | 0 (0.0%) |
| 30 to 34 Minutes | 0 (0.0%) | 0 (0.0%) |
| 35 to 39 Minutes | 0 (0.0%) | 0 (0.0%) |
| 40 to 44 Minutes | 0 (0.0%) | 0 (0.0%) |
| 45 to 59 Minutes | 51 (30.4%) | 0 (0.0%) |
| 60 to 89 Minutes | 0 (0.0%) | 0 (0.0%) |
| 90 or more Minutes | 18 (10.7%) | 0 (0.0%) |
Time of Departure to Work by Sex in Caliente
The most frequent times of departure to work in Caliente are 4:00 PM to 11:59 PM (51, 30.4%) for males and 7:30 AM to 7:59 AM (23, 28.4%) for females.
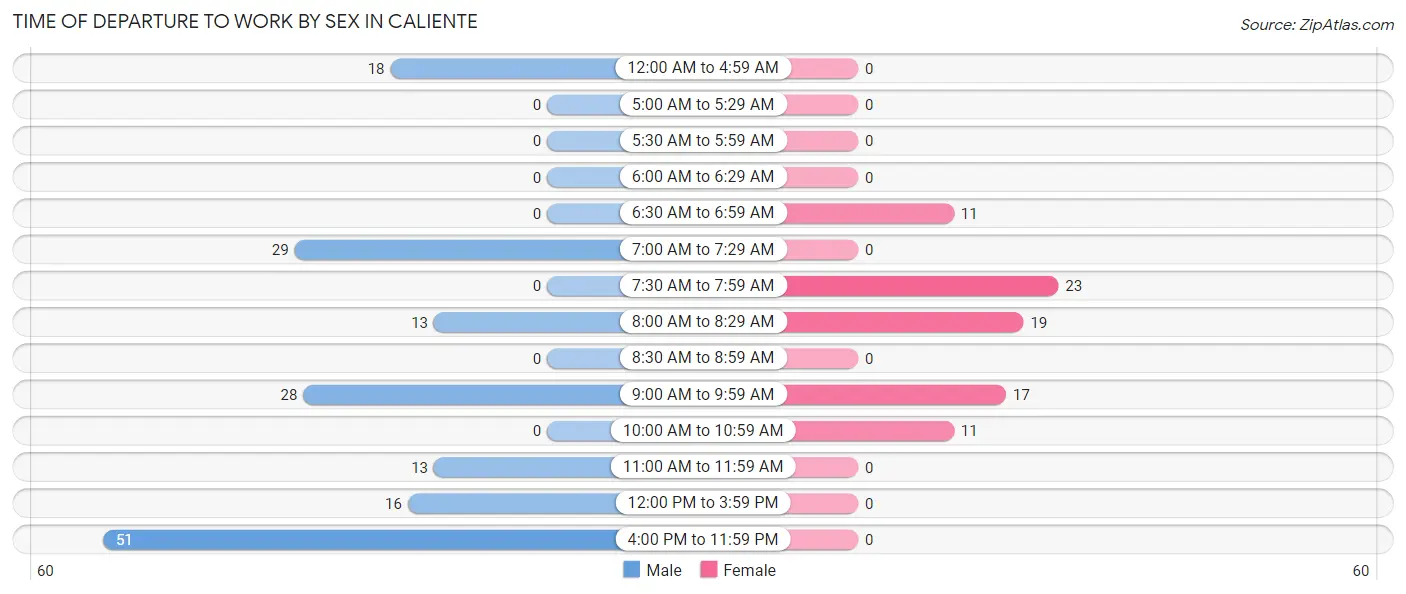
| Time of Departure | Male | Female |
| 12:00 AM to 4:59 AM | 18 (10.7%) | 0 (0.0%) |
| 5:00 AM to 5:29 AM | 0 (0.0%) | 0 (0.0%) |
| 5:30 AM to 5:59 AM | 0 (0.0%) | 0 (0.0%) |
| 6:00 AM to 6:29 AM | 0 (0.0%) | 0 (0.0%) |
| 6:30 AM to 6:59 AM | 0 (0.0%) | 11 (13.6%) |
| 7:00 AM to 7:29 AM | 29 (17.3%) | 0 (0.0%) |
| 7:30 AM to 7:59 AM | 0 (0.0%) | 23 (28.4%) |
| 8:00 AM to 8:29 AM | 13 (7.7%) | 19 (23.5%) |
| 8:30 AM to 8:59 AM | 0 (0.0%) | 0 (0.0%) |
| 9:00 AM to 9:59 AM | 28 (16.7%) | 17 (21.0%) |
| 10:00 AM to 10:59 AM | 0 (0.0%) | 11 (13.6%) |
| 11:00 AM to 11:59 AM | 13 (7.7%) | 0 (0.0%) |
| 12:00 PM to 3:59 PM | 16 (9.5%) | 0 (0.0%) |
| 4:00 PM to 11:59 PM | 51 (30.4%) | 0 (0.0%) |
| Total | 168 (100.0%) | 81 (100.0%) |
Housing Occupancy in Caliente
Occupancy by Ownership in Caliente
Of the total 348 dwellings in Caliente, owner-occupied units account for 210 (60.3%), while renter-occupied units make up 138 (39.7%).
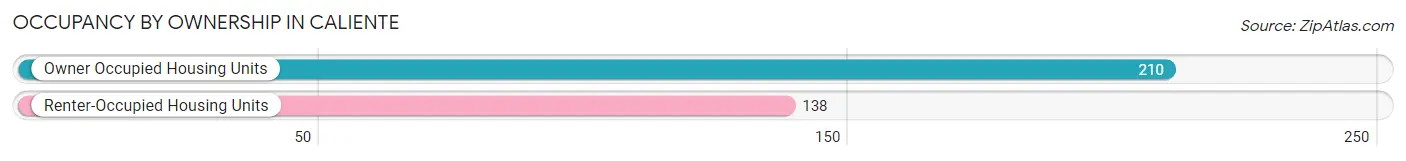
| Occupancy | # Housing Units | % Housing Units |
| Owner Occupied Housing Units | 210 | 60.3% |
| Renter-Occupied Housing Units | 138 | 39.7% |
| Total Occupied Housing Units | 348 | 100.0% |
Occupancy by Household Size in Caliente
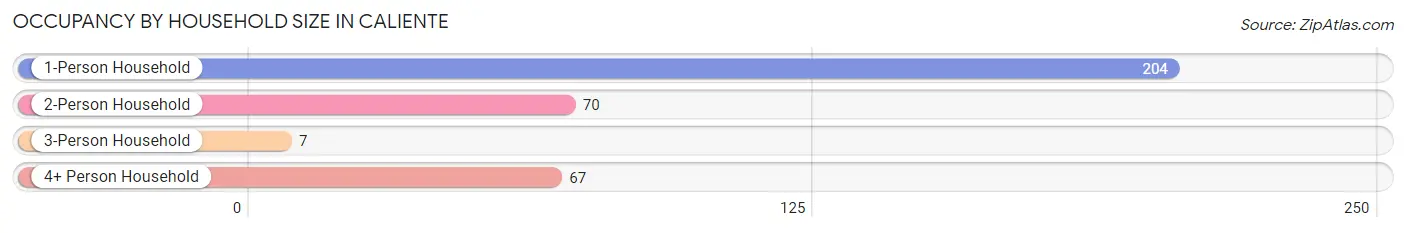
| Household Size | # Housing Units | % Housing Units |
| 1-Person Household | 204 | 58.6% |
| 2-Person Household | 70 | 20.1% |
| 3-Person Household | 7 | 2.0% |
| 4+ Person Household | 67 | 19.3% |
| Total Housing Units | 348 | 100.0% |
Occupancy by Ownership by Household Size in Caliente
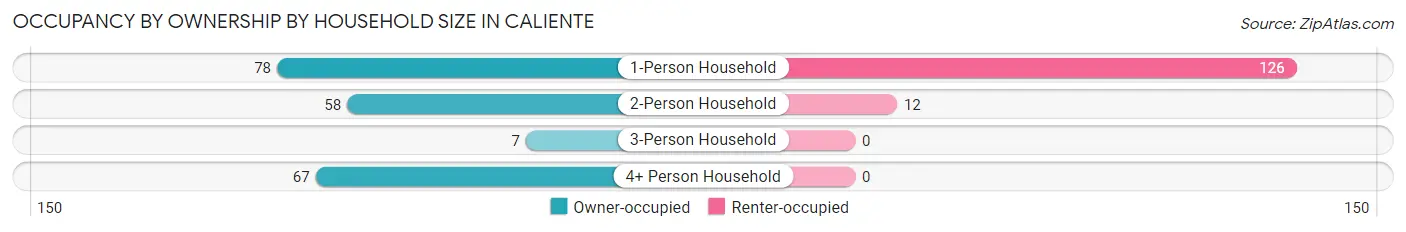
| Household Size | Owner-occupied | Renter-occupied |
| 1-Person Household | 78 (38.2%) | 126 (61.8%) |
| 2-Person Household | 58 (82.9%) | 12 (17.1%) |
| 3-Person Household | 7 (100.0%) | 0 (0.0%) |
| 4+ Person Household | 67 (100.0%) | 0 (0.0%) |
| Total Housing Units | 210 (60.3%) | 138 (39.7%) |
Occupancy by Educational Attainment in Caliente
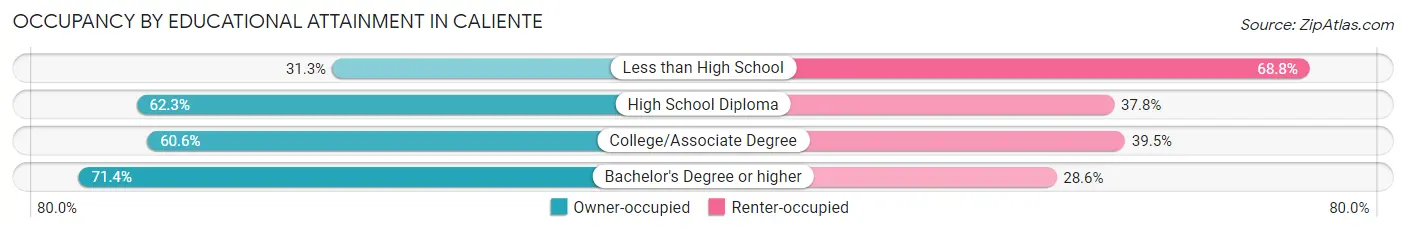
| Household Size | Owner-occupied | Renter-occupied |
| Less than High School | 10 (31.2%) | 22 (68.8%) |
| High School Diploma | 94 (62.3%) | 57 (37.8%) |
| College/Associate Degree | 66 (60.6%) | 43 (39.5%) |
| Bachelor's Degree or higher | 40 (71.4%) | 16 (28.6%) |
Occupancy by Age of Householder in Caliente
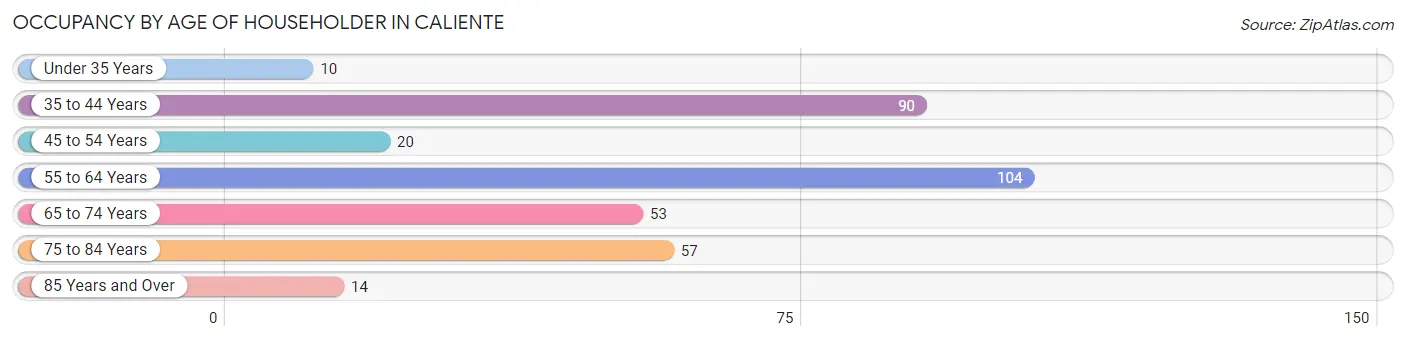
| Age Bracket | # Households | % Households |
| Under 35 Years | 10 | 2.9% |
| 35 to 44 Years | 90 | 25.9% |
| 45 to 54 Years | 20 | 5.8% |
| 55 to 64 Years | 104 | 29.9% |
| 65 to 74 Years | 53 | 15.2% |
| 75 to 84 Years | 57 | 16.4% |
| 85 Years and Over | 14 | 4.0% |
| Total | 348 | 100.0% |
Housing Finances in Caliente
Median Income by Occupancy in Caliente
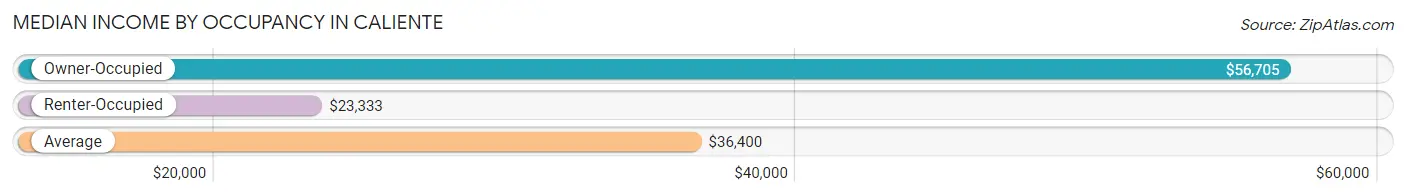
| Occupancy Type | # Households | Median Income |
| Owner-Occupied | 210 (60.3%) | $56,705 |
| Renter-Occupied | 138 (39.7%) | $23,333 |
| Average | 348 (100.0%) | $36,400 |
Occupancy by Householder Income Bracket in Caliente
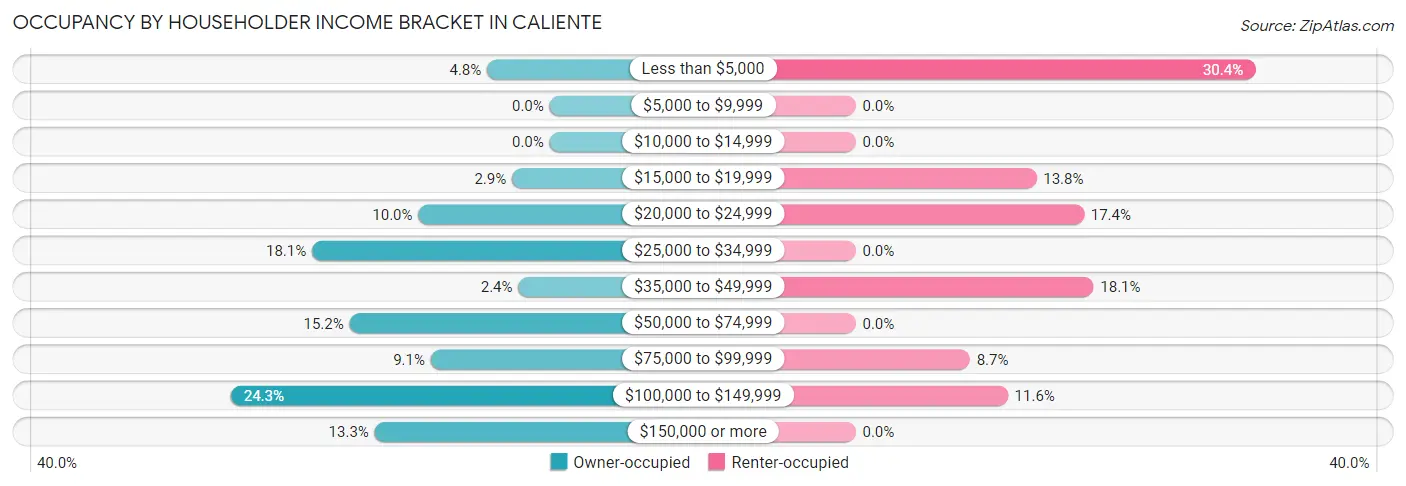
| Income Bracket | Owner-occupied | Renter-occupied |
| Less than $5,000 | 10 (4.8%) | 42 (30.4%) |
| $5,000 to $9,999 | 0 (0.0%) | 0 (0.0%) |
| $10,000 to $14,999 | 0 (0.0%) | 0 (0.0%) |
| $15,000 to $19,999 | 6 (2.9%) | 19 (13.8%) |
| $20,000 to $24,999 | 21 (10.0%) | 24 (17.4%) |
| $25,000 to $34,999 | 38 (18.1%) | 0 (0.0%) |
| $35,000 to $49,999 | 5 (2.4%) | 25 (18.1%) |
| $50,000 to $74,999 | 32 (15.2%) | 0 (0.0%) |
| $75,000 to $99,999 | 19 (9.0%) | 12 (8.7%) |
| $100,000 to $149,999 | 51 (24.3%) | 16 (11.6%) |
| $150,000 or more | 28 (13.3%) | 0 (0.0%) |
| Total | 210 (100.0%) | 138 (100.0%) |
Monthly Housing Cost Tiers in Caliente
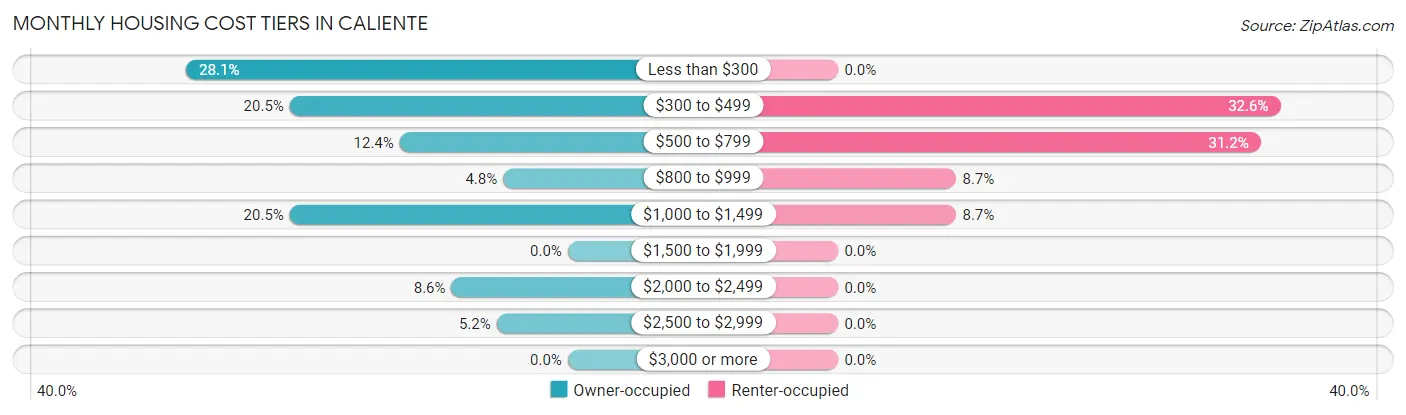
| Monthly Cost | Owner-occupied | Renter-occupied |
| Less than $300 | 59 (28.1%) | 0 (0.0%) |
| $300 to $499 | 43 (20.5%) | 45 (32.6%) |
| $500 to $799 | 26 (12.4%) | 43 (31.2%) |
| $800 to $999 | 10 (4.8%) | 12 (8.7%) |
| $1,000 to $1,499 | 43 (20.5%) | 12 (8.7%) |
| $1,500 to $1,999 | 0 (0.0%) | 0 (0.0%) |
| $2,000 to $2,499 | 18 (8.6%) | 0 (0.0%) |
| $2,500 to $2,999 | 11 (5.2%) | 0 (0.0%) |
| $3,000 or more | 0 (0.0%) | 0 (0.0%) |
| Total | 210 (100.0%) | 138 (100.0%) |
Physical Housing Characteristics in Caliente
Housing Structures in Caliente
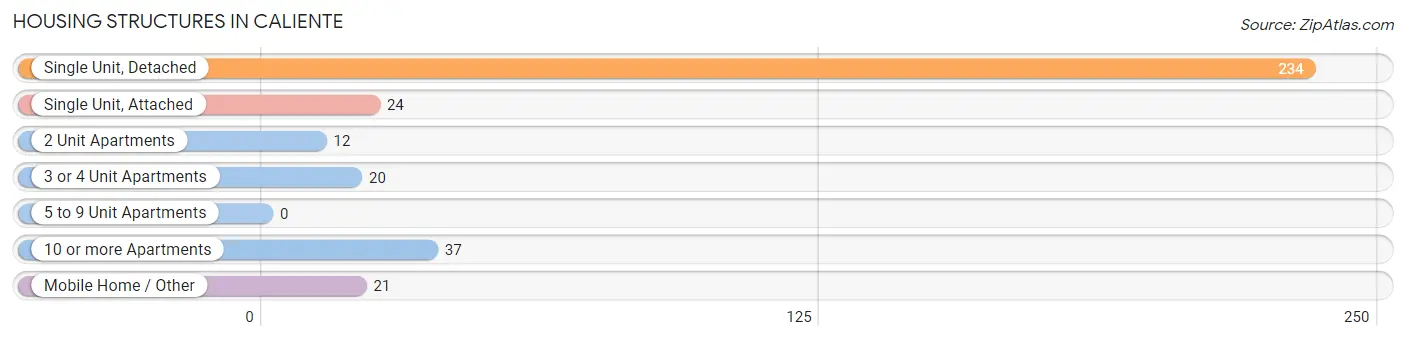
| Structure Type | # Housing Units | % Housing Units |
| Single Unit, Detached | 234 | 67.2% |
| Single Unit, Attached | 24 | 6.9% |
| 2 Unit Apartments | 12 | 3.5% |
| 3 or 4 Unit Apartments | 20 | 5.8% |
| 5 to 9 Unit Apartments | 0 | 0.0% |
| 10 or more Apartments | 37 | 10.6% |
| Mobile Home / Other | 21 | 6.0% |
| Total | 348 | 100.0% |
Housing Structures by Occupancy in Caliente
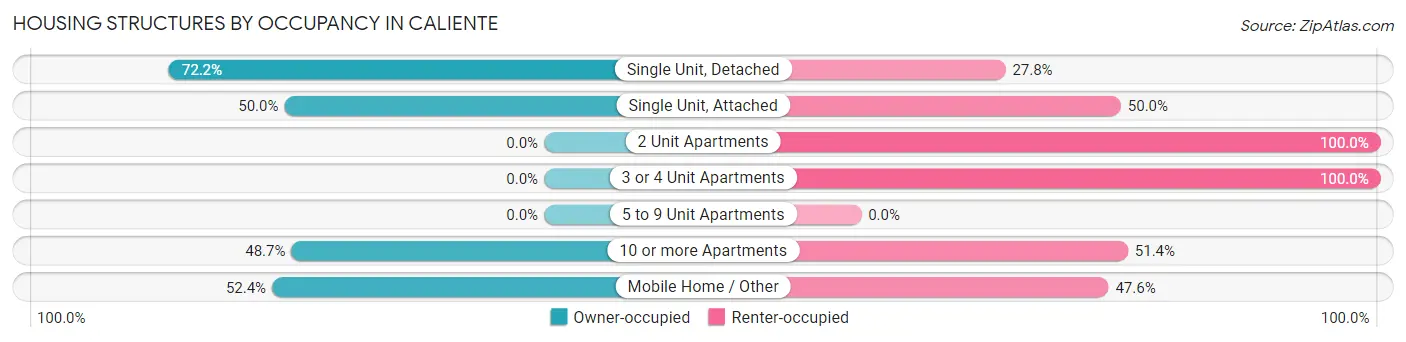
| Structure Type | Owner-occupied | Renter-occupied |
| Single Unit, Detached | 169 (72.2%) | 65 (27.8%) |
| Single Unit, Attached | 12 (50.0%) | 12 (50.0%) |
| 2 Unit Apartments | 0 (0.0%) | 12 (100.0%) |
| 3 or 4 Unit Apartments | 0 (0.0%) | 20 (100.0%) |
| 5 to 9 Unit Apartments | 0 (0.0%) | 0 (0.0%) |
| 10 or more Apartments | 18 (48.6%) | 19 (51.3%) |
| Mobile Home / Other | 11 (52.4%) | 10 (47.6%) |
| Total | 210 (60.3%) | 138 (39.7%) |
Housing Structures by Number of Rooms in Caliente
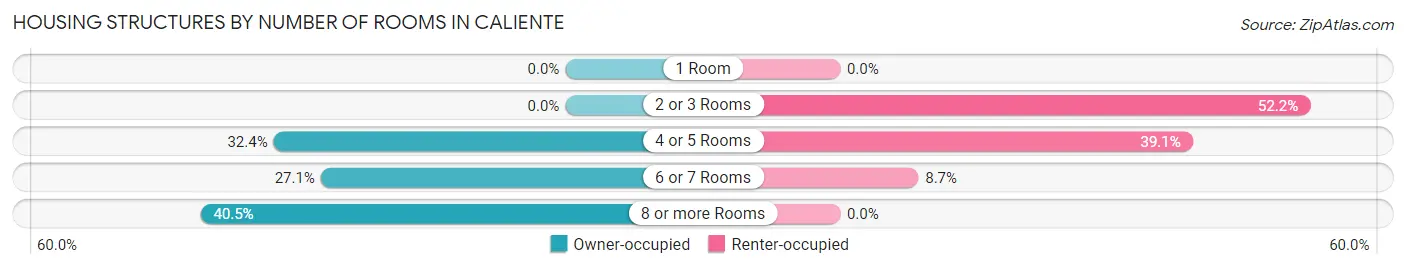
| Number of Rooms | Owner-occupied | Renter-occupied |
| 1 Room | 0 (0.0%) | 0 (0.0%) |
| 2 or 3 Rooms | 0 (0.0%) | 72 (52.2%) |
| 4 or 5 Rooms | 68 (32.4%) | 54 (39.1%) |
| 6 or 7 Rooms | 57 (27.1%) | 12 (8.7%) |
| 8 or more Rooms | 85 (40.5%) | 0 (0.0%) |
| Total | 210 (100.0%) | 138 (100.0%) |
Housing Structure by Heating Type in Caliente
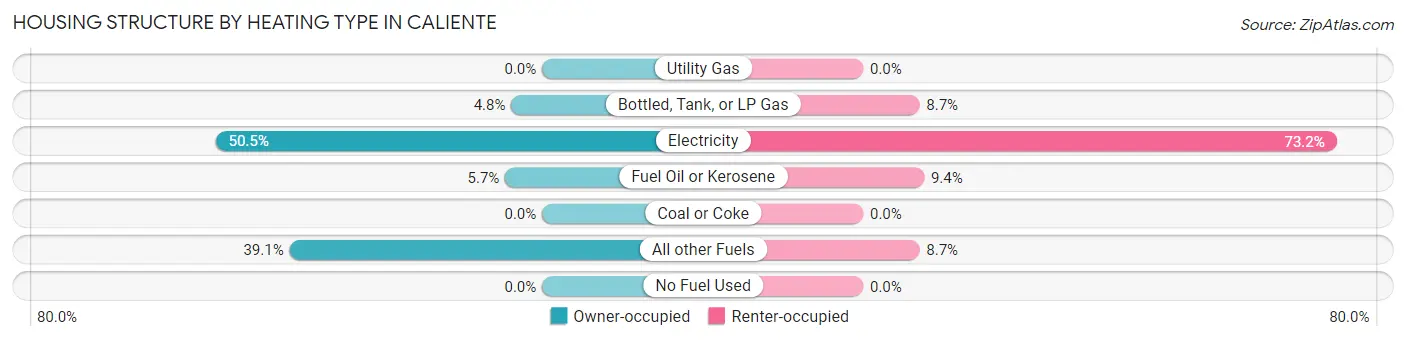
| Heating Type | Owner-occupied | Renter-occupied |
| Utility Gas | 0 (0.0%) | 0 (0.0%) |
| Bottled, Tank, or LP Gas | 10 (4.8%) | 12 (8.7%) |
| Electricity | 106 (50.5%) | 101 (73.2%) |
| Fuel Oil or Kerosene | 12 (5.7%) | 13 (9.4%) |
| Coal or Coke | 0 (0.0%) | 0 (0.0%) |
| All other Fuels | 82 (39.1%) | 12 (8.7%) |
| No Fuel Used | 0 (0.0%) | 0 (0.0%) |
| Total | 210 (100.0%) | 138 (100.0%) |
Household Vehicle Usage in Caliente
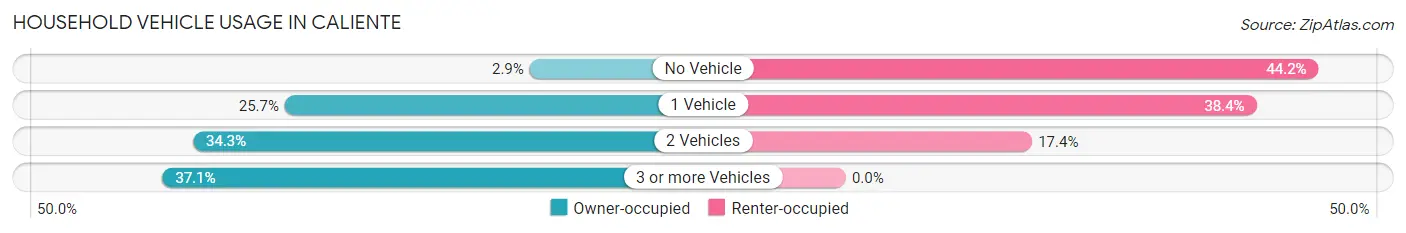
| Vehicles per Household | Owner-occupied | Renter-occupied |
| No Vehicle | 6 (2.9%) | 61 (44.2%) |
| 1 Vehicle | 54 (25.7%) | 53 (38.4%) |
| 2 Vehicles | 72 (34.3%) | 24 (17.4%) |
| 3 or more Vehicles | 78 (37.1%) | 0 (0.0%) |
| Total | 210 (100.0%) | 138 (100.0%) |
Real Estate & Mortgages in Caliente
Real Estate and Mortgage Overview in Caliente
| Characteristic | Without Mortgage | With Mortgage |
| Housing Units | 103 | 107 |
| Median Property Value | $133,200 | $174,300 |
| Median Household Income | - | - |
| Monthly Housing Costs | $292 | $0 |
| Real Estate Taxes | $868 | $0 |
Property Value by Mortgage Status in Caliente
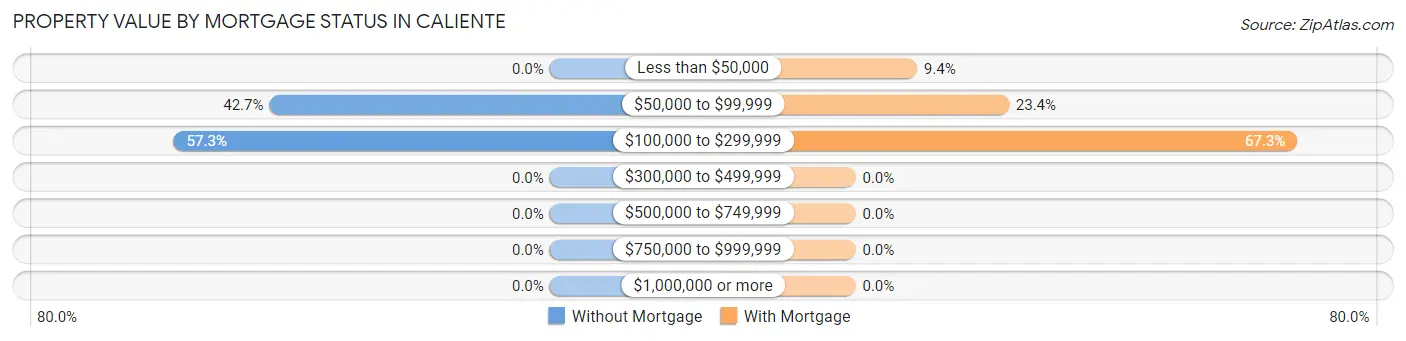
| Property Value | Without Mortgage | With Mortgage |
| Less than $50,000 | 0 (0.0%) | 10 (9.3%) |
| $50,000 to $99,999 | 44 (42.7%) | 25 (23.4%) |
| $100,000 to $299,999 | 59 (57.3%) | 72 (67.3%) |
| $300,000 to $499,999 | 0 (0.0%) | 0 (0.0%) |
| $500,000 to $749,999 | 0 (0.0%) | 0 (0.0%) |
| $750,000 to $999,999 | 0 (0.0%) | 0 (0.0%) |
| $1,000,000 or more | 0 (0.0%) | 0 (0.0%) |
| Total | 103 (100.0%) | 107 (100.0%) |
Household Income by Mortgage Status in Caliente
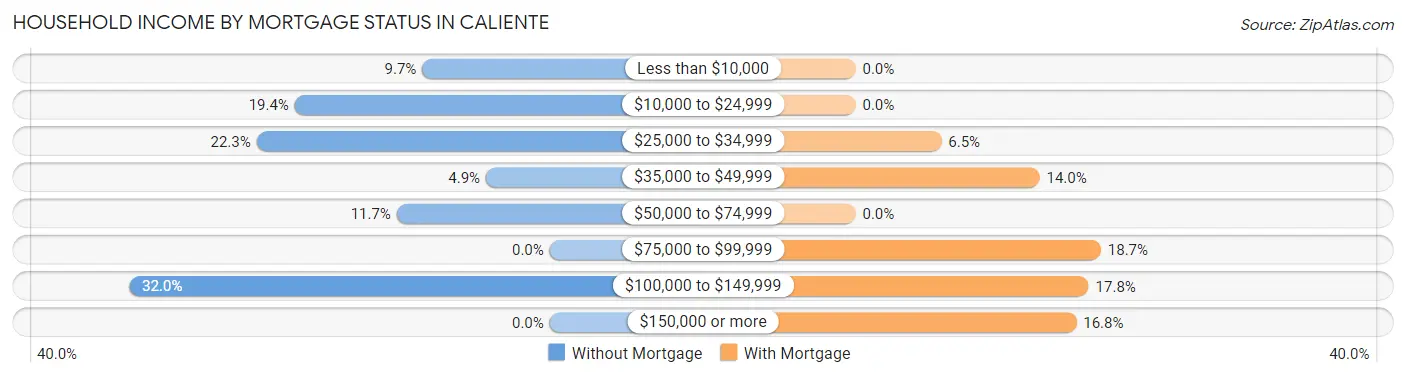
| Household Income | Without Mortgage | With Mortgage |
| Less than $10,000 | 10 (9.7%) | 0 (0.0%) |
| $10,000 to $24,999 | 20 (19.4%) | 0 (0.0%) |
| $25,000 to $34,999 | 23 (22.3%) | 7 (6.5%) |
| $35,000 to $49,999 | 5 (4.9%) | 15 (14.0%) |
| $50,000 to $74,999 | 12 (11.7%) | 0 (0.0%) |
| $75,000 to $99,999 | 0 (0.0%) | 20 (18.7%) |
| $100,000 to $149,999 | 33 (32.0%) | 19 (17.8%) |
| $150,000 or more | 0 (0.0%) | 18 (16.8%) |
| Total | 103 (100.0%) | 107 (100.0%) |
Property Value to Household Income Ratio in Caliente
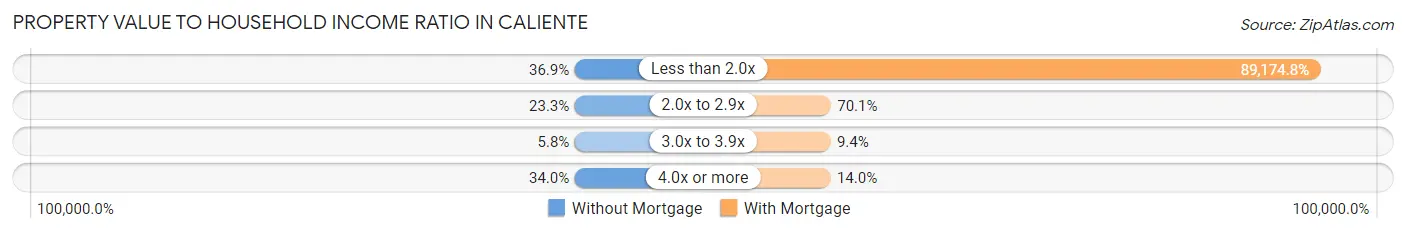
| Value-to-Income Ratio | Without Mortgage | With Mortgage |
| Less than 2.0x | 38 (36.9%) | 95,417 (89,174.8%) |
| 2.0x to 2.9x | 24 (23.3%) | 75 (70.1%) |
| 3.0x to 3.9x | 6 (5.8%) | 10 (9.3%) |
| 4.0x or more | 35 (34.0%) | 15 (14.0%) |
| Total | 103 (100.0%) | 107 (100.0%) |
Real Estate Taxes by Mortgage Status in Caliente
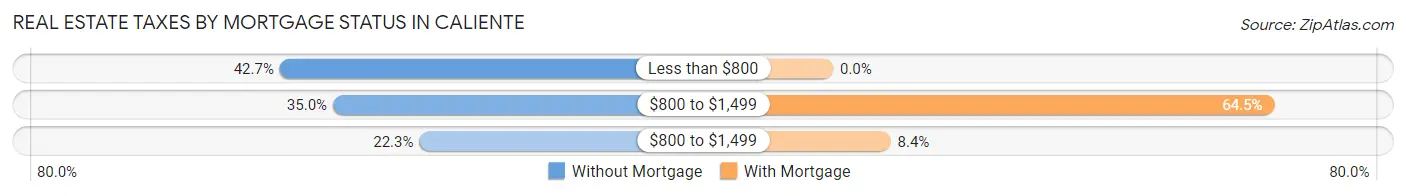
| Property Taxes | Without Mortgage | With Mortgage |
| Less than $800 | 44 (42.7%) | 0 (0.0%) |
| $800 to $1,499 | 36 (34.9%) | 69 (64.5%) |
| $800 to $1,499 | 23 (22.3%) | 9 (8.4%) |
| Total | 103 (100.0%) | 107 (100.0%) |
Health & Disability in Caliente
Health Insurance Coverage by Age in Caliente
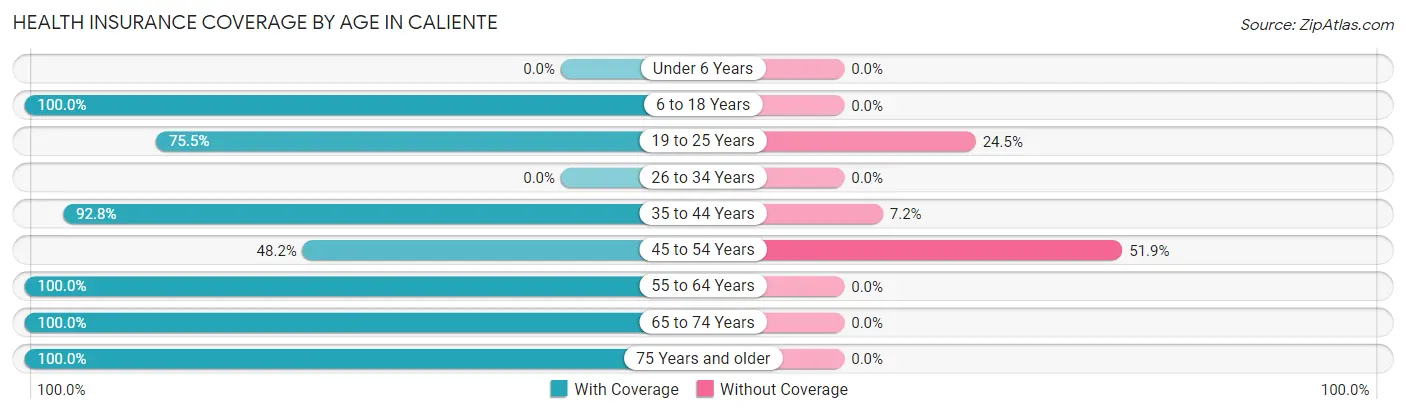
| Age Bracket | With Coverage | Without Coverage |
| Under 6 Years | 0 (0.0%) | 0 (0.0%) |
| 6 to 18 Years | 135 (100.0%) | 0 (0.0%) |
| 19 to 25 Years | 77 (75.5%) | 25 (24.5%) |
| 26 to 34 Years | 0 (0.0%) | 0 (0.0%) |
| 35 to 44 Years | 155 (92.8%) | 12 (7.2%) |
| 45 to 54 Years | 39 (48.1%) | 42 (51.8%) |
| 55 to 64 Years | 126 (100.0%) | 0 (0.0%) |
| 65 to 74 Years | 75 (100.0%) | 0 (0.0%) |
| 75 Years and older | 83 (100.0%) | 0 (0.0%) |
| Total | 690 (89.7%) | 79 (10.3%) |
Health Insurance Coverage by Citizenship Status in Caliente
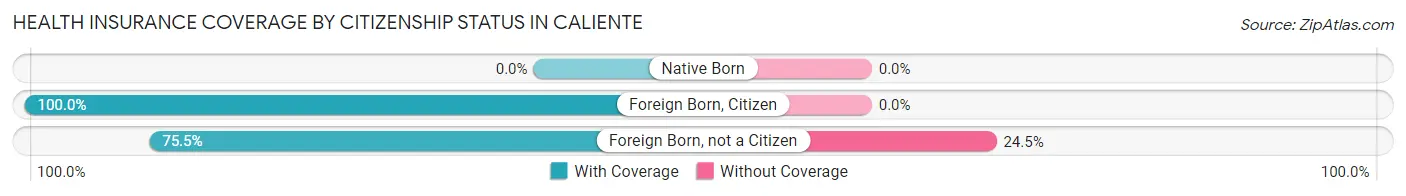
| Citizenship Status | With Coverage | Without Coverage |
| Native Born | 0 (0.0%) | 0 (0.0%) |
| Foreign Born, Citizen | 135 (100.0%) | 0 (0.0%) |
| Foreign Born, not a Citizen | 77 (75.5%) | 25 (24.5%) |
Health Insurance Coverage by Household Income in Caliente
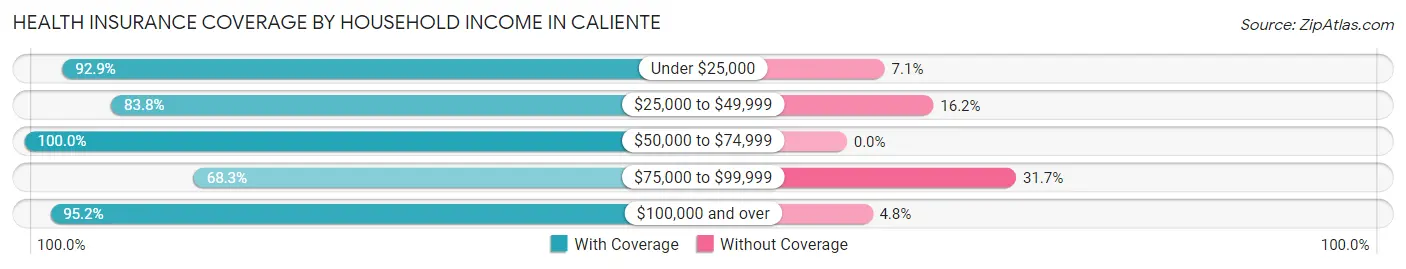
| Household Income | With Coverage | Without Coverage |
| Under $25,000 | 131 (92.9%) | 10 (7.1%) |
| $25,000 to $49,999 | 62 (83.8%) | 12 (16.2%) |
| $50,000 to $74,999 | 57 (100.0%) | 0 (0.0%) |
| $75,000 to $99,999 | 84 (68.3%) | 39 (31.7%) |
| $100,000 and over | 356 (95.2%) | 18 (4.8%) |
Public vs Private Health Insurance Coverage by Age in Caliente
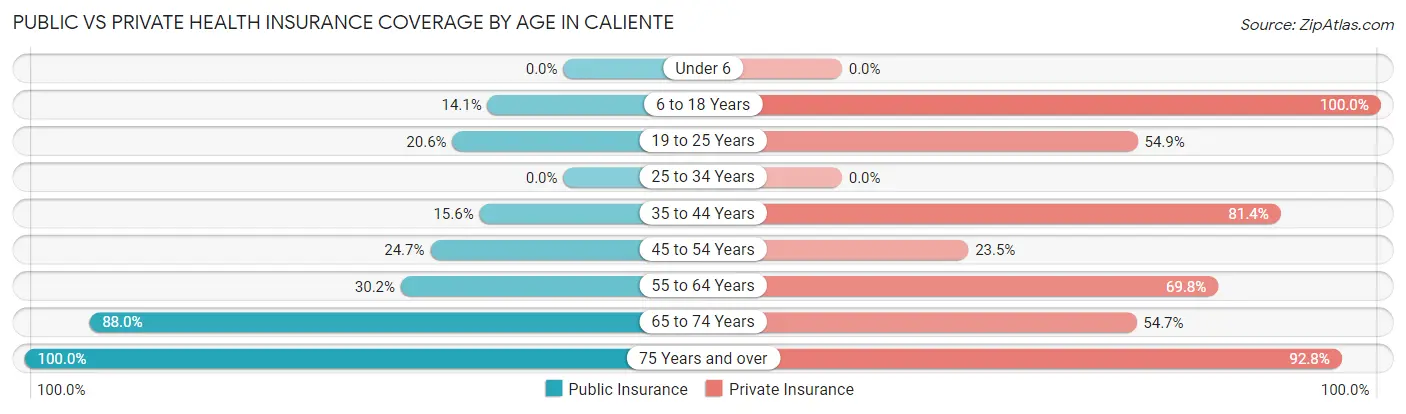
| Age Bracket | Public Insurance | Private Insurance |
| Under 6 | 0 (0.0%) | 0 (0.0%) |
| 6 to 18 Years | 19 (14.1%) | 135 (100.0%) |
| 19 to 25 Years | 21 (20.6%) | 56 (54.9%) |
| 25 to 34 Years | 0 (0.0%) | 0 (0.0%) |
| 35 to 44 Years | 26 (15.6%) | 136 (81.4%) |
| 45 to 54 Years | 20 (24.7%) | 19 (23.5%) |
| 55 to 64 Years | 38 (30.2%) | 88 (69.8%) |
| 65 to 74 Years | 66 (88.0%) | 41 (54.7%) |
| 75 Years and over | 83 (100.0%) | 77 (92.8%) |
| Total | 273 (35.5%) | 552 (71.8%) |
Disability Status by Sex by Age in Caliente
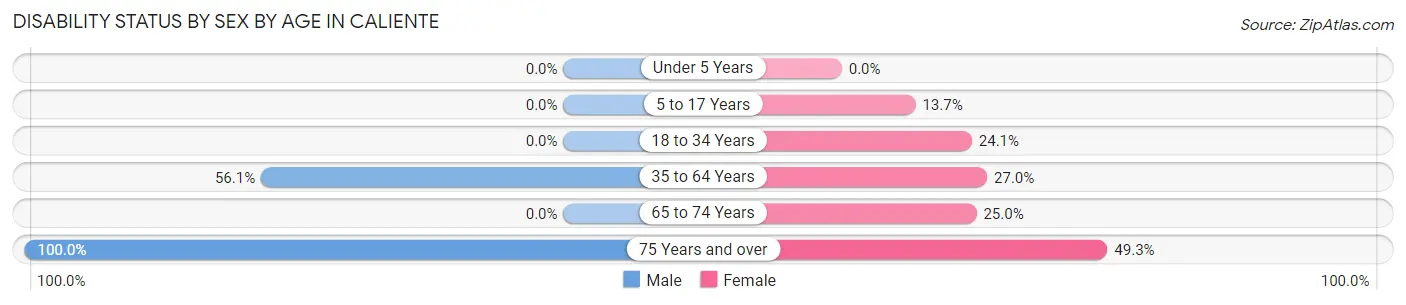
| Age Bracket | Male | Female |
| Under 5 Years | 0 (0.0%) | 0 (0.0%) |
| 5 to 17 Years | 0 (0.0%) | 13 (13.7%) |
| 18 to 34 Years | 0 (0.0%) | 21 (24.1%) |
| 35 to 64 Years | 110 (56.1%) | 48 (27.0%) |
| 65 to 74 Years | 0 (0.0%) | 10 (25.0%) |
| 75 Years and over | 12 (100.0%) | 35 (49.3%) |
Disability Class by Sex by Age in Caliente
Disability Class: Hearing Difficulty
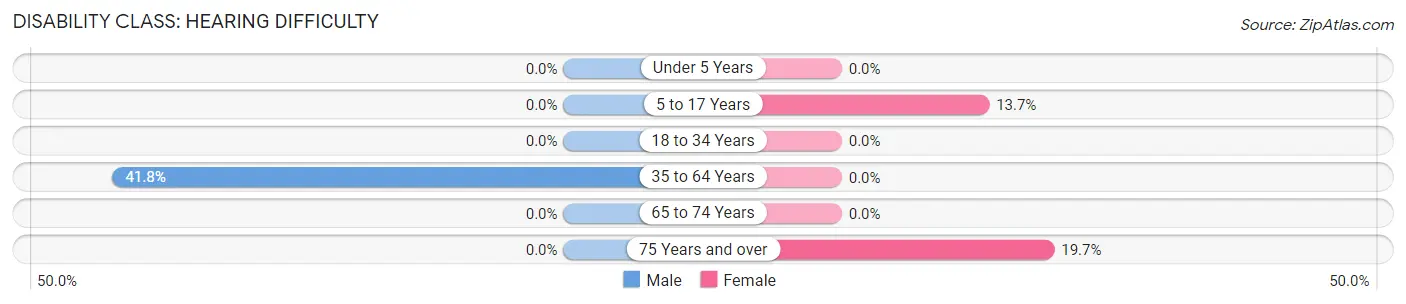
| Age Bracket | Male | Female |
| Under 5 Years | 0 (0.0%) | 0 (0.0%) |
| 5 to 17 Years | 0 (0.0%) | 13 (13.7%) |
| 18 to 34 Years | 0 (0.0%) | 0 (0.0%) |
| 35 to 64 Years | 82 (41.8%) | 0 (0.0%) |
| 65 to 74 Years | 0 (0.0%) | 0 (0.0%) |
| 75 Years and over | 0 (0.0%) | 14 (19.7%) |
Disability Class: Vision Difficulty
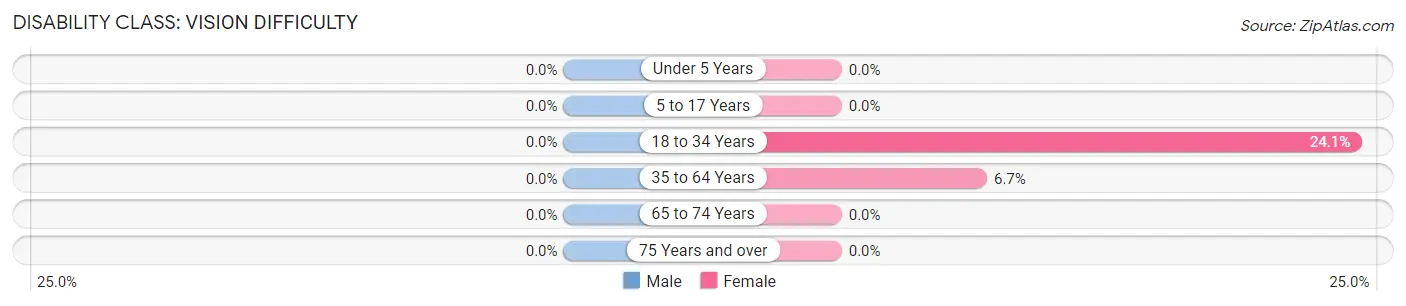
| Age Bracket | Male | Female |
| Under 5 Years | 0 (0.0%) | 0 (0.0%) |
| 5 to 17 Years | 0 (0.0%) | 0 (0.0%) |
| 18 to 34 Years | 0 (0.0%) | 21 (24.1%) |
| 35 to 64 Years | 0 (0.0%) | 12 (6.7%) |
| 65 to 74 Years | 0 (0.0%) | 0 (0.0%) |
| 75 Years and over | 0 (0.0%) | 0 (0.0%) |
Disability Class: Cognitive Difficulty
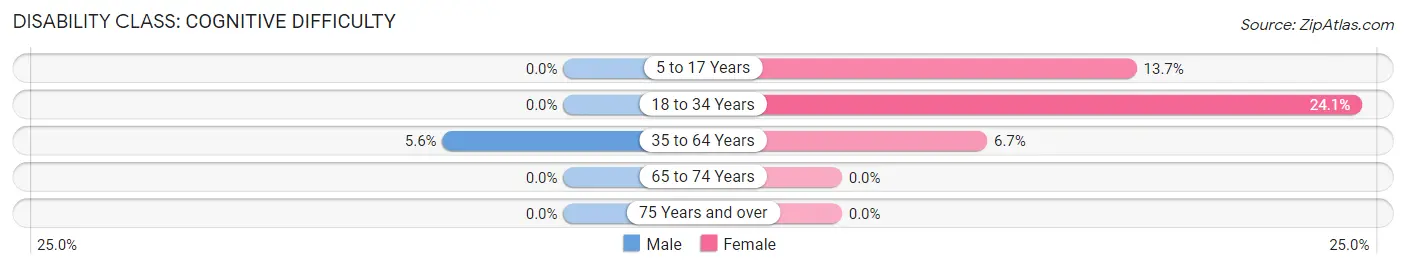
| Age Bracket | Male | Female |
| 5 to 17 Years | 0 (0.0%) | 13 (13.7%) |
| 18 to 34 Years | 0 (0.0%) | 21 (24.1%) |
| 35 to 64 Years | 11 (5.6%) | 12 (6.7%) |
| 65 to 74 Years | 0 (0.0%) | 0 (0.0%) |
| 75 Years and over | 0 (0.0%) | 0 (0.0%) |
Disability Class: Ambulatory Difficulty
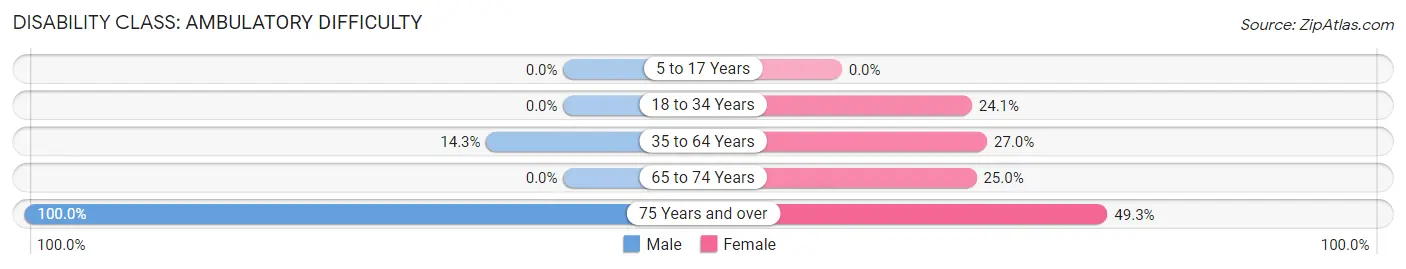
| Age Bracket | Male | Female |
| 5 to 17 Years | 0 (0.0%) | 0 (0.0%) |
| 18 to 34 Years | 0 (0.0%) | 21 (24.1%) |
| 35 to 64 Years | 28 (14.3%) | 48 (27.0%) |
| 65 to 74 Years | 0 (0.0%) | 10 (25.0%) |
| 75 Years and over | 12 (100.0%) | 35 (49.3%) |
Disability Class: Self-Care Difficulty
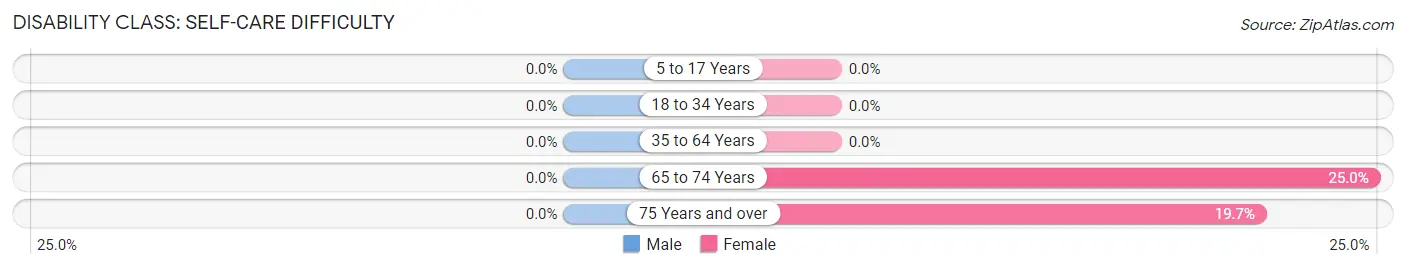
| Age Bracket | Male | Female |
| 5 to 17 Years | 0 (0.0%) | 0 (0.0%) |
| 18 to 34 Years | 0 (0.0%) | 0 (0.0%) |
| 35 to 64 Years | 0 (0.0%) | 0 (0.0%) |
| 65 to 74 Years | 0 (0.0%) | 10 (25.0%) |
| 75 Years and over | 0 (0.0%) | 14 (19.7%) |
Technology Access in Caliente
Computing Device Access in Caliente
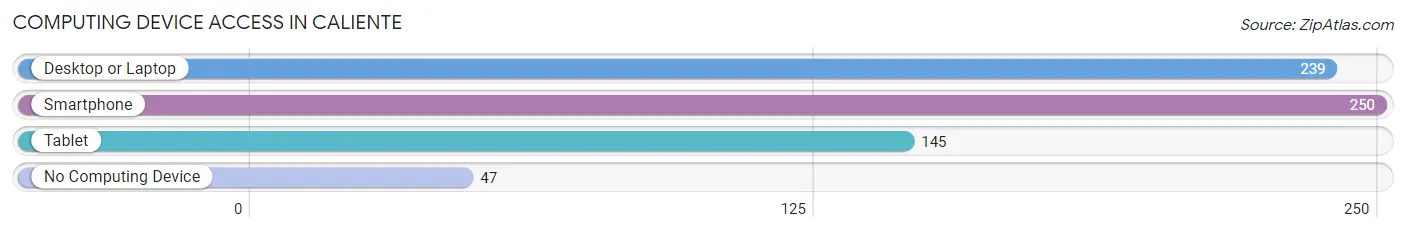
| Device Type | # Households | % Households |
| Desktop or Laptop | 239 | 68.7% |
| Smartphone | 250 | 71.8% |
| Tablet | 145 | 41.7% |
| No Computing Device | 47 | 13.5% |
| Total | 348 | 100.0% |
Internet Access in Caliente
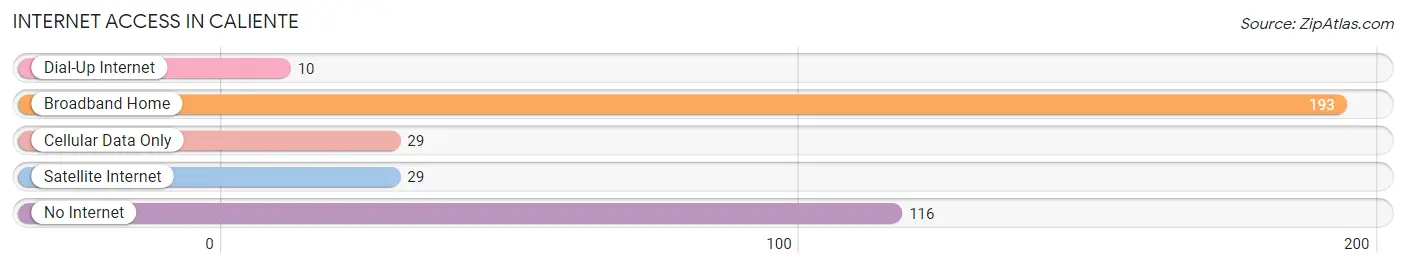
| Internet Type | # Households | % Households |
| Dial-Up Internet | 10 | 2.9% |
| Broadband Home | 193 | 55.5% |
| Cellular Data Only | 29 | 8.3% |
| Satellite Internet | 29 | 8.3% |
| No Internet | 116 | 33.3% |
| Total | 348 | 100.0% |
Caliente Summary
Caliente is a small city located in Lincoln County, Nevada, United States. It is the county seat of Lincoln County and is located in the southeastern part of the state. The population of Caliente was 1,130 at the 2010 census.
History
Caliente was founded in 1901 by the Southern Pacific Railroad. The city was named after the nearby hot springs, which were believed to have healing properties. The city was incorporated in 1909 and was the first city in Lincoln County.
Geography
Caliente is located at the intersection of U.S. Route 93 and Nevada State Route 317. It is situated in the Meadow Valley Wash, which is a large valley in the southeastern part of the state. The city is surrounded by the Toquima Range to the west, the White Pine Range to the east, and the Delamar Mountains to the south.
The climate in Caliente is semi-arid, with hot summers and mild winters. The average annual precipitation is 8.5 inches.
Economy
The economy of Caliente is largely based on tourism and agriculture. The city is home to several tourist attractions, including the Caliente Hot Springs, the Caliente Railroad Museum, and the Caliente Raceway.
Agriculture is also an important part of the local economy. The area is known for its production of alfalfa, hay, and other crops.
Demographics
As of the 2010 census, the population of Caliente was 1,130. The racial makeup of the city was 91.3% White, 0.2% African American, 0.7% Native American, 0.2% Asian, 0.1% Pacific Islander, 5.2% from other races, and 2.3% from two or more races. Hispanic or Latino of any race were 11.2% of the population.
The median income for a household in Caliente was $31,250, and the median income for a family was $35,417. The per capita income for the city was $14,945. About 16.2% of families and 19.2% of the population were below the poverty line, including 25.2% of those under age 18 and 10.3% of those age 65 or over.
Conclusion
Caliente is a small city located in Lincoln County, Nevada. It was founded in 1901 and is the county seat of Lincoln County. The economy of Caliente is largely based on tourism and agriculture, and the city is home to several tourist attractions. The population of Caliente was 1,130 at the 2010 census, and the racial makeup of the city was 91.3% White, 0.2% African American, 0.7% Native American, 0.2% Asian, 0.1% Pacific Islander, 5.2% from other races, and 2.3% from two or more races. The median income for a household in Caliente was $31,250, and the median income for a family was $35,417.
Common Questions
What is Per Capita Income in Caliente?
Per Capita income in Caliente is $31,246.
What is the Median Family Income in Caliente?
Median Family Income in Caliente is $105,227.
What is the Median Household income in Caliente?
Median Household Income in Caliente is $36,400.
What is Inequality or Gini Index in Caliente?
Inequality or Gini Index in Caliente is 0.48.
What is the Total Population of Caliente?
Total Population of Caliente is 840.
What is the Total Male Population of Caliente?
Total Male Population of Caliente is 321.
What is the Total Female Population of Caliente?
Total Female Population of Caliente is 519.
What is the Ratio of Males per 100 Females in Caliente?
There are 61.85 Males per 100 Females in Caliente.
What is the Ratio of Females per 100 Males in Caliente?
There are 161.68 Females per 100 Males in Caliente.
What is the Median Population Age in Caliente?
Median Population Age in Caliente is 43.9 Years.
What is the Average Family Size in Caliente
Average Family Size in Caliente is 3.9 People.
What is the Average Household Size in Caliente
Average Household Size in Caliente is 2.2 People.
How Large is the Labor Force in Caliente?
There are 361 People in the Labor Forcein in Caliente.
What is the Percentage of People in the Labor Force in Caliente?
49.3% of People are in the Labor Force in Caliente.
What is the Unemployment Rate in Caliente?
Unemployment Rate in Caliente is 4.2%.