Sutcliffe, NV Map & Demographics
Sutcliffe Map
Sutcliffe Overview
$25,158
PER CAPITA INCOME
$36,250
AVG FAMILY INCOME
$28,967
AVG HOUSEHOLD INCOME
0.47
INEQUALITY / GINI INDEX
291
TOTAL POPULATION
119
MALE POPULATION
172
FEMALE POPULATION
69.19
MALES / 100 FEMALES
144.54
FEMALES / 100 MALES
55.2
MEDIAN AGE
2.6
AVG FAMILY SIZE
2.0
AVG HOUSEHOLD SIZE
124
LABOR FORCE [ PEOPLE ]
49.8%
PERCENT IN LABOR FORCE
6.3%
UNEMPLOYMENT RATE
Income in Sutcliffe
Income Overview in Sutcliffe
Per Capita Income in Sutcliffe is $25,158, while median incomes of families and households are $36,250 and $28,967 respectively.
| Characteristic | Number | Measure |
| Per Capita Income | 291 | $25,158 |
| Median Family Income | 89 | $36,250 |
| Mean Family Income | 89 | $64,008 |
| Median Household Income | 147 | $28,967 |
| Mean Household Income | 147 | $50,683 |
| Income Deficit | 89 | $0 |
| Wage / Income Gap (%) | 291 | 0.00% |
| Wage / Income Gap ($) | 291 | 100.00¢ per $1 |
| Gini / Inequality Index | 291 | 0.47 |
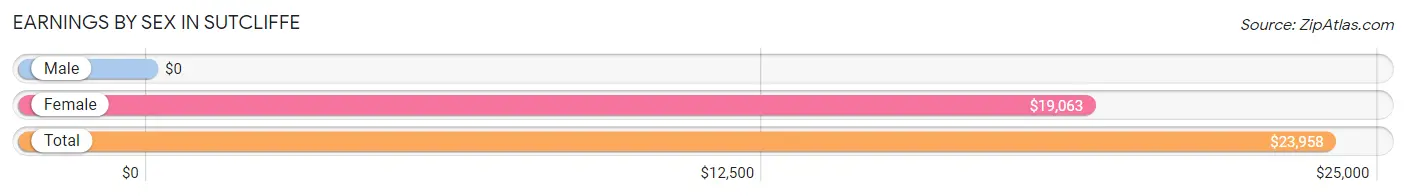
Earnings by Sex in Sutcliffe
| Sex | Number | Average Earnings |
| Male | 62 (48.4%) | $0 |
| Female | 66 (51.6%) | $19,063 |
| Total | 128 (100.0%) | $23,958 |
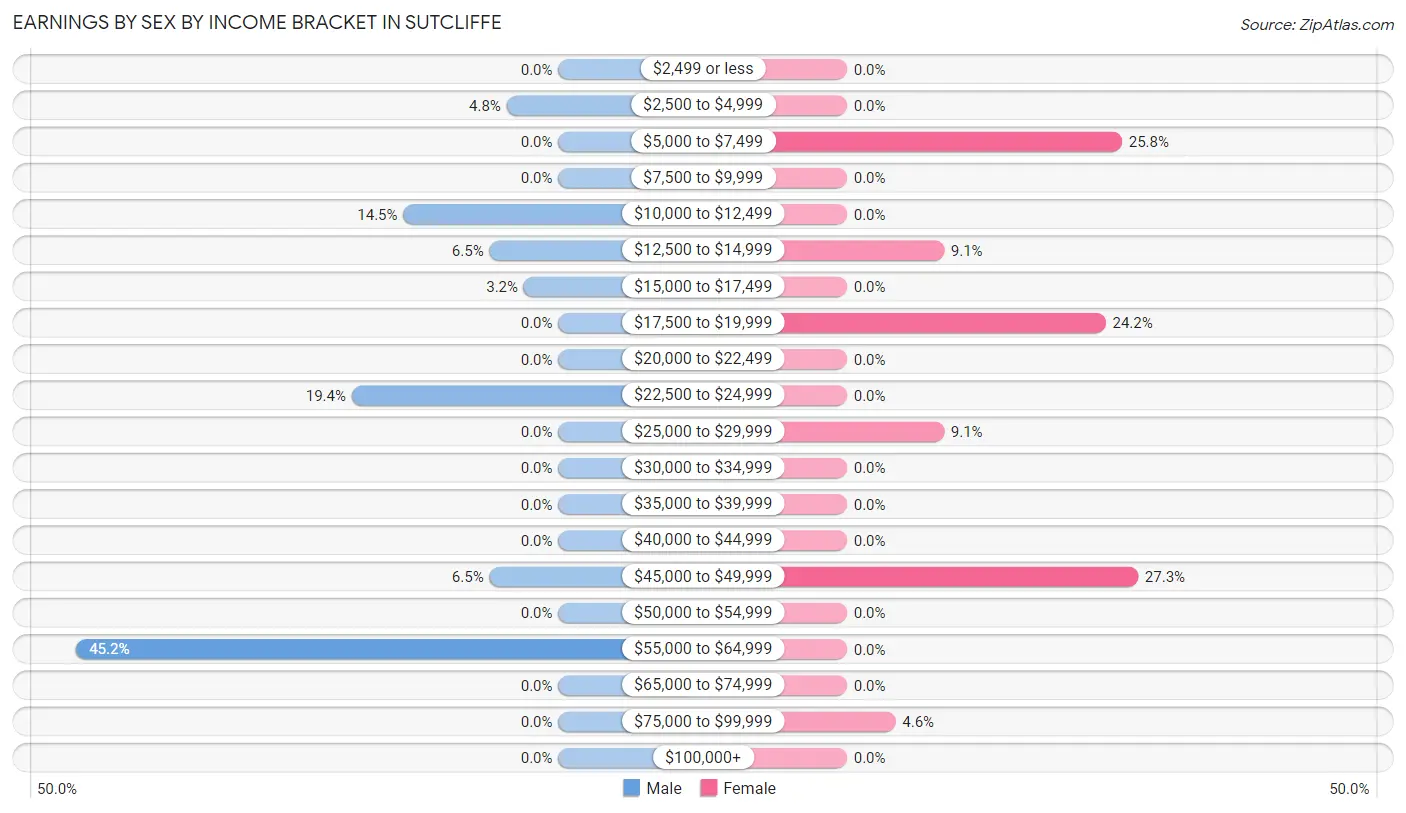
Earnings by Sex by Income Bracket in Sutcliffe
The most common earnings brackets in Sutcliffe are $55,000 to $64,999 for men (28 | 45.2%) and $45,000 to $49,999 for women (18 | 27.3%).
| Income | Male | Female |
| $2,499 or less | 0 (0.0%) | 0 (0.0%) |
| $2,500 to $4,999 | 3 (4.8%) | 0 (0.0%) |
| $5,000 to $7,499 | 0 (0.0%) | 17 (25.8%) |
| $7,500 to $9,999 | 0 (0.0%) | 0 (0.0%) |
| $10,000 to $12,499 | 9 (14.5%) | 0 (0.0%) |
| $12,500 to $14,999 | 4 (6.5%) | 6 (9.1%) |
| $15,000 to $17,499 | 2 (3.2%) | 0 (0.0%) |
| $17,500 to $19,999 | 0 (0.0%) | 16 (24.2%) |
| $20,000 to $22,499 | 0 (0.0%) | 0 (0.0%) |
| $22,500 to $24,999 | 12 (19.4%) | 0 (0.0%) |
| $25,000 to $29,999 | 0 (0.0%) | 6 (9.1%) |
| $30,000 to $34,999 | 0 (0.0%) | 0 (0.0%) |
| $35,000 to $39,999 | 0 (0.0%) | 0 (0.0%) |
| $40,000 to $44,999 | 0 (0.0%) | 0 (0.0%) |
| $45,000 to $49,999 | 4 (6.5%) | 18 (27.3%) |
| $50,000 to $54,999 | 0 (0.0%) | 0 (0.0%) |
| $55,000 to $64,999 | 28 (45.2%) | 0 (0.0%) |
| $65,000 to $74,999 | 0 (0.0%) | 0 (0.0%) |
| $75,000 to $99,999 | 0 (0.0%) | 3 (4.5%) |
| $100,000+ | 0 (0.0%) | 0 (0.0%) |
| Total | 62 (100.0%) | 66 (100.0%) |
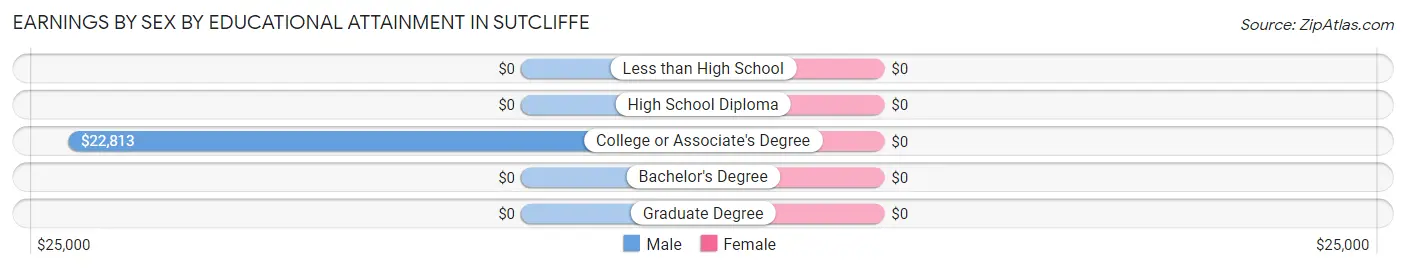
Earnings by Sex by Educational Attainment in Sutcliffe
| Educational Attainment | Male Income | Female Income |
| Less than High School | - | - |
| High School Diploma | - | - |
| College or Associate's Degree | $22,813 | $0 |
| Bachelor's Degree | - | - |
| Graduate Degree | - | - |
| Total | $49,063 | $19,063 |
Family Income in Sutcliffe
Family Income Brackets in Sutcliffe
According to the Sutcliffe family income data, there are 33 families falling into the $25,000 to $34,999 income range, which is the most common income bracket and makes up 37.1% of all families.
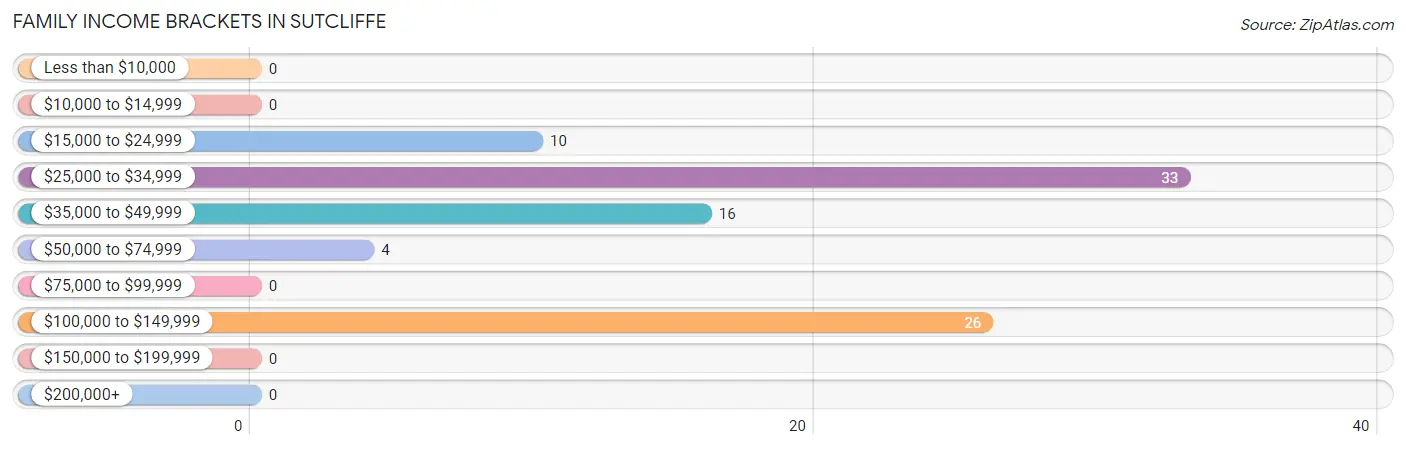
| Income Bracket | # Families | % Families |
| Less than $10,000 | 0 | 0.0% |
| $10,000 to $14,999 | 0 | 0.0% |
| $15,000 to $24,999 | 10 | 11.2% |
| $25,000 to $34,999 | 33 | 37.1% |
| $35,000 to $49,999 | 16 | 18.0% |
| $50,000 to $74,999 | 4 | 4.5% |
| $75,000 to $99,999 | 0 | 0.0% |
| $100,000 to $149,999 | 26 | 29.2% |
| $150,000 to $199,999 | 0 | 0.0% |
| $200,000+ | 0 | 0.0% |
Family Income by Famaliy Size in Sutcliffe
2-person families (41 | 46.1%) account for the highest median family income in Sutcliffe with $40,139 per family, while 2-person families (41 | 46.1%) have the highest median income of $20,070 per family member.
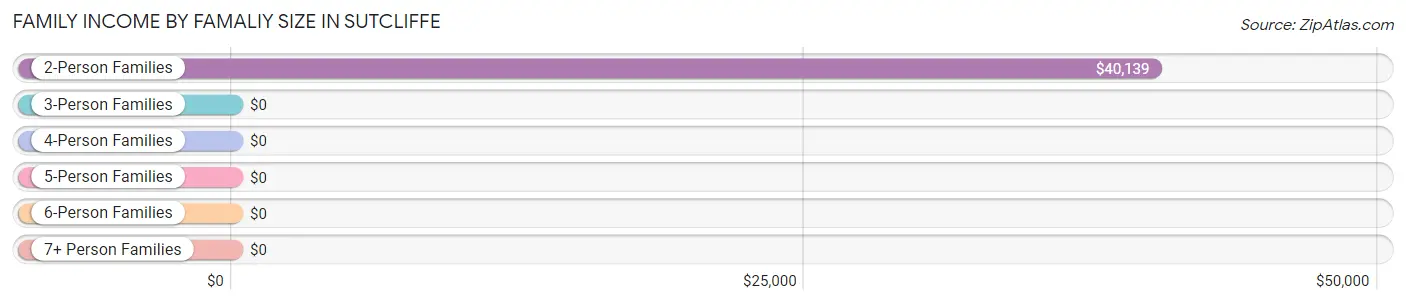
| Income Bracket | # Families | Median Income |
| 2-Person Families | 41 (46.1%) | $40,139 |
| 3-Person Families | 0 (0.0%) | $0 |
| 4-Person Families | 38 (42.7%) | $0 |
| 5-Person Families | 6 (6.7%) | $0 |
| 6-Person Families | 4 (4.5%) | $0 |
| 7+ Person Families | 0 (0.0%) | $0 |
| Total | 89 (100.0%) | $36,250 |
Family Income by Number of Earners in Sutcliffe
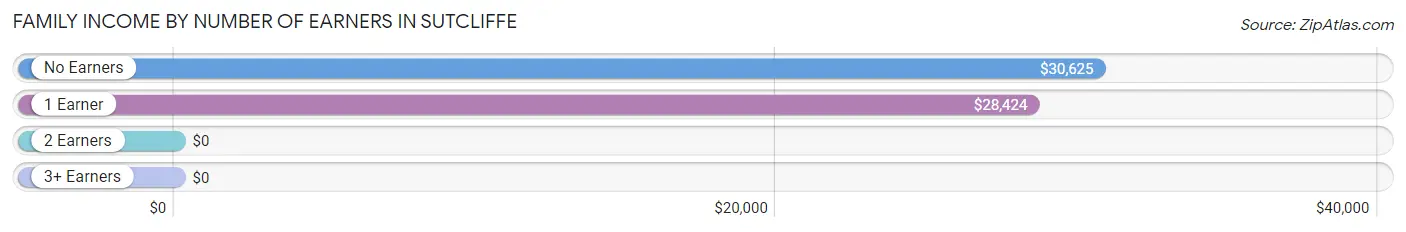
| Number of Earners | # Families | Median Income |
| No Earners | 9 (10.1%) | $30,625 |
| 1 Earner | 45 (50.6%) | $28,424 |
| 2 Earners | 17 (19.1%) | $0 |
| 3+ Earners | 18 (20.2%) | $0 |
| Total | 89 (100.0%) | $36,250 |
Household Income in Sutcliffe
Household Income Brackets in Sutcliffe
With 40 households falling in the category, the $25,000 to $34,999 income range is the most frequent in Sutcliffe, accounting for 27.2% of all households.
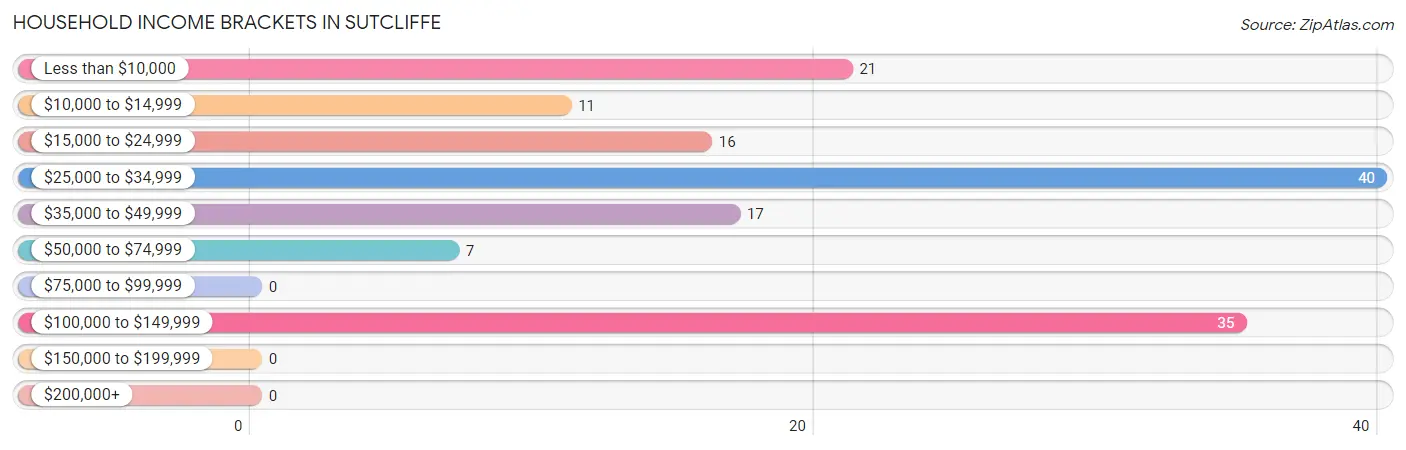
| Income Bracket | # Households | % Households |
| Less than $10,000 | 21 | 14.3% |
| $10,000 to $14,999 | 11 | 7.5% |
| $15,000 to $24,999 | 16 | 10.9% |
| $25,000 to $34,999 | 40 | 27.2% |
| $35,000 to $49,999 | 17 | 11.6% |
| $50,000 to $74,999 | 7 | 4.8% |
| $75,000 to $99,999 | 0 | 0.0% |
| $100,000 to $149,999 | 35 | 23.8% |
| $150,000 to $199,999 | 0 | 0.0% |
| $200,000+ | 0 | 0.0% |
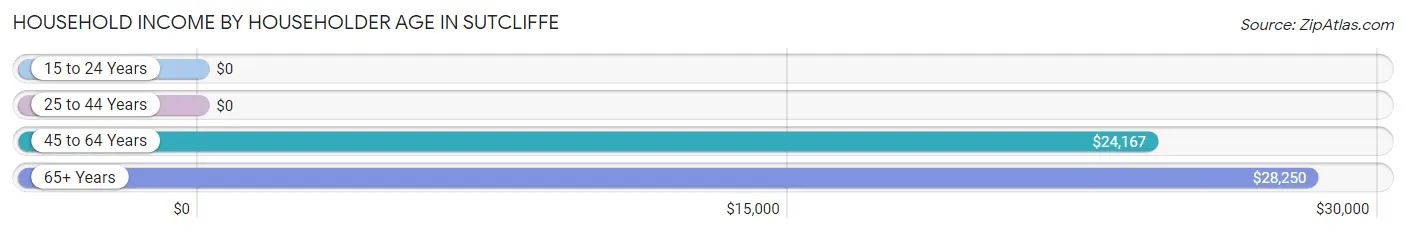
Household Income by Householder Age in Sutcliffe
The median household income in Sutcliffe is $28,967, with the highest median household income of $28,250 found in the 65+ years age bracket for the primary householder. A total of 70 households (47.6%) fall into this category.
| Income Bracket | # Households | Median Income |
| 15 to 24 Years | 0 (0.0%) | $0 |
| 25 to 44 Years | 35 (23.8%) | $0 |
| 45 to 64 Years | 42 (28.6%) | $24,167 |
| 65+ Years | 70 (47.6%) | $28,250 |
| Total | 147 (100.0%) | $28,967 |
Poverty in Sutcliffe
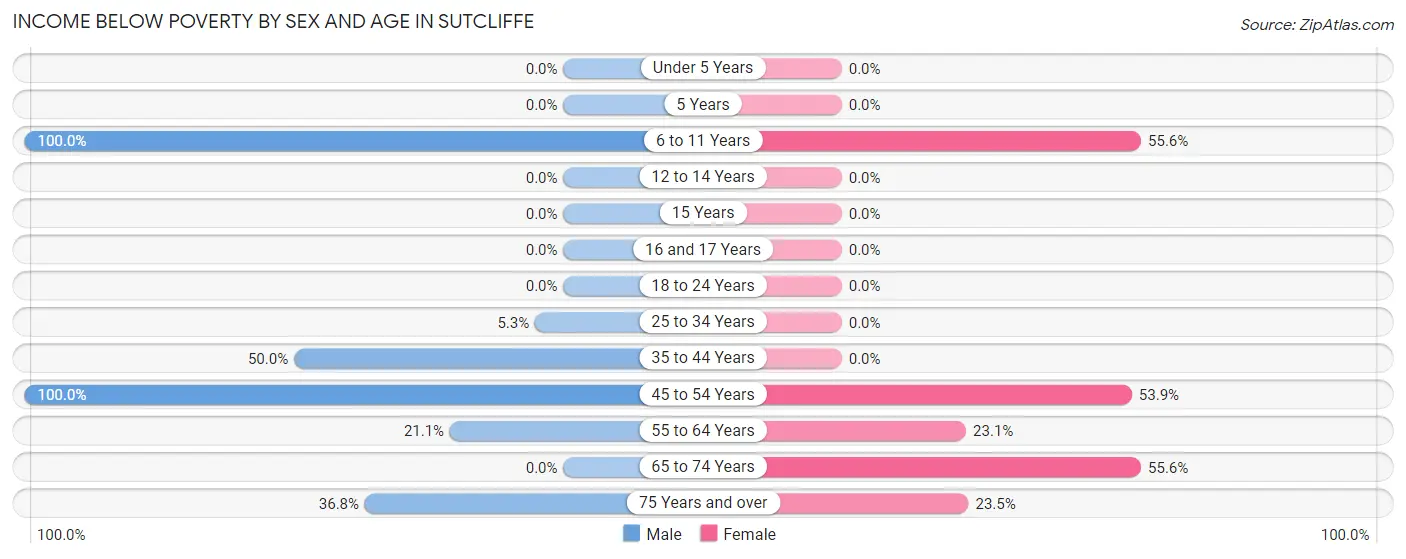
Income Below Poverty by Sex and Age in Sutcliffe
With 34.4% poverty level for males and 30.8% for females among the residents of Sutcliffe, 6 to 11 year old males and 6 to 11 year old females are the most vulnerable to poverty, with 16 males (100.0%) and 10 females (55.6%) in their respective age groups living below the poverty level.
| Age Bracket | Male | Female |
| Under 5 Years | 0 (0.0%) | 0 (0.0%) |
| 5 Years | 0 (0.0%) | 0 (0.0%) |
| 6 to 11 Years | 16 (100.0%) | 10 (55.6%) |
| 12 to 14 Years | 0 (0.0%) | 0 (0.0%) |
| 15 Years | 0 (0.0%) | 0 (0.0%) |
| 16 and 17 Years | 0 (0.0%) | 0 (0.0%) |
| 18 to 24 Years | 0 (0.0%) | 0 (0.0%) |
| 25 to 34 Years | 2 (5.3%) | 0 (0.0%) |
| 35 to 44 Years | 4 (50.0%) | 0 (0.0%) |
| 45 to 54 Years | 8 (100.0%) | 7 (53.8%) |
| 55 to 64 Years | 4 (21.0%) | 12 (23.1%) |
| 65 to 74 Years | 0 (0.0%) | 20 (55.6%) |
| 75 Years and over | 7 (36.8%) | 4 (23.5%) |
| Total | 41 (34.4%) | 53 (30.8%) |
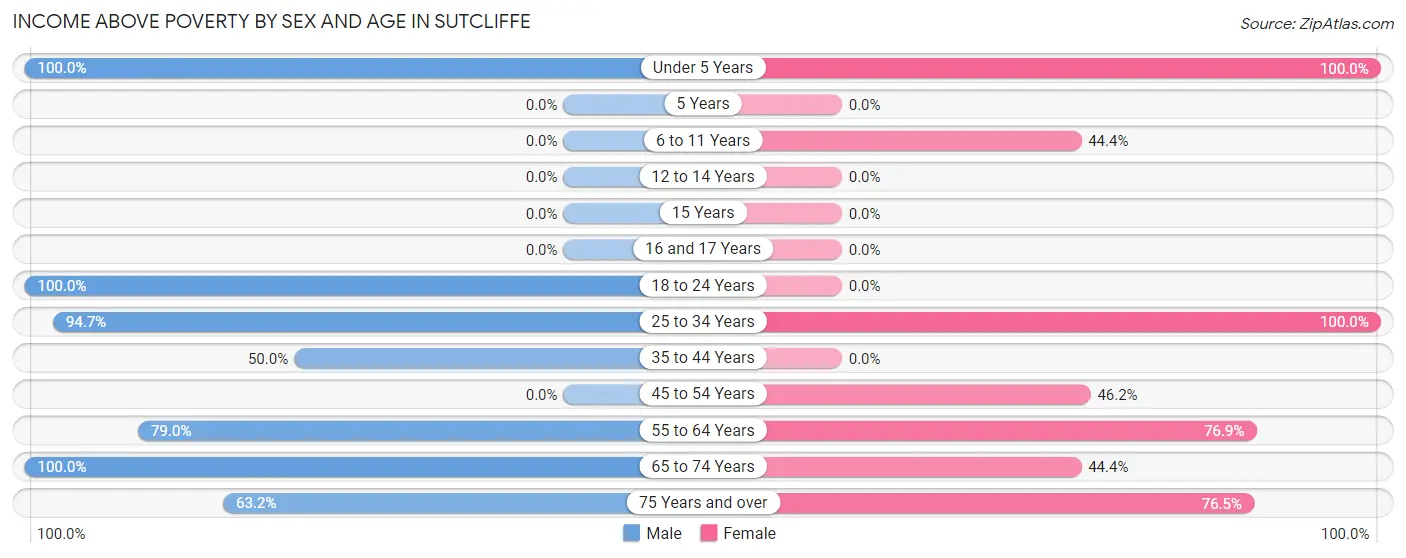
Income Above Poverty by Sex and Age in Sutcliffe
According to the poverty statistics in Sutcliffe, males aged under 5 years and females aged under 5 years are the age groups that are most secure financially, with 100.0% of males and 100.0% of females in these age groups living above the poverty line.
| Age Bracket | Male | Female |
| Under 5 Years | 3 (100.0%) | 5 (100.0%) |
| 5 Years | 0 (0.0%) | 0 (0.0%) |
| 6 to 11 Years | 0 (0.0%) | 8 (44.4%) |
| 12 to 14 Years | 0 (0.0%) | 0 (0.0%) |
| 15 Years | 0 (0.0%) | 0 (0.0%) |
| 16 and 17 Years | 0 (0.0%) | 0 (0.0%) |
| 18 to 24 Years | 3 (100.0%) | 0 (0.0%) |
| 25 to 34 Years | 36 (94.7%) | 31 (100.0%) |
| 35 to 44 Years | 4 (50.0%) | 0 (0.0%) |
| 45 to 54 Years | 0 (0.0%) | 6 (46.2%) |
| 55 to 64 Years | 15 (78.9%) | 40 (76.9%) |
| 65 to 74 Years | 5 (100.0%) | 16 (44.4%) |
| 75 Years and over | 12 (63.2%) | 13 (76.5%) |
| Total | 78 (65.5%) | 119 (69.2%) |
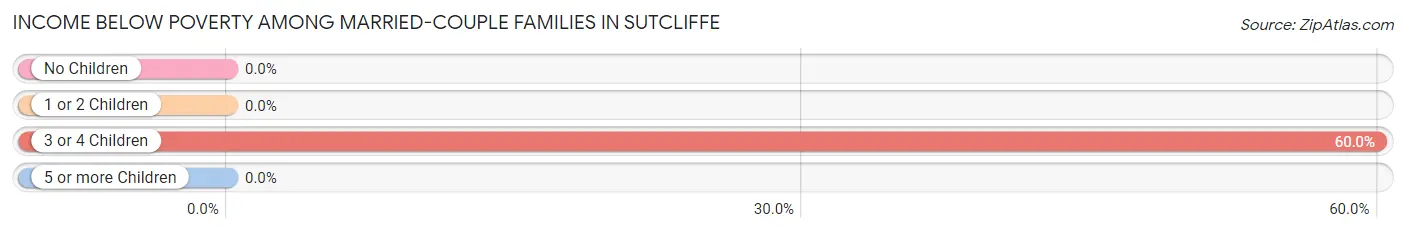
Income Below Poverty Among Married-Couple Families in Sutcliffe
The poverty statistics for married-couple families in Sutcliffe show that 15.8% or 6 of the total 38 families live below the poverty line. Families with 3 or 4 children have the highest poverty rate of 60.0%, comprising of 6 families. On the other hand, families with no children have the lowest poverty rate of 0.0%, which includes 0 families.
| Children | Above Poverty | Below Poverty |
| No Children | 28 (100.0%) | 0 (0.0%) |
| 1 or 2 Children | 0 (0.0%) | 0 (0.0%) |
| 3 or 4 Children | 4 (40.0%) | 6 (60.0%) |
| 5 or more Children | 0 (0.0%) | 0 (0.0%) |
| Total | 32 (84.2%) | 6 (15.8%) |
Income Below Poverty Among Single-Parent Households in Sutcliffe
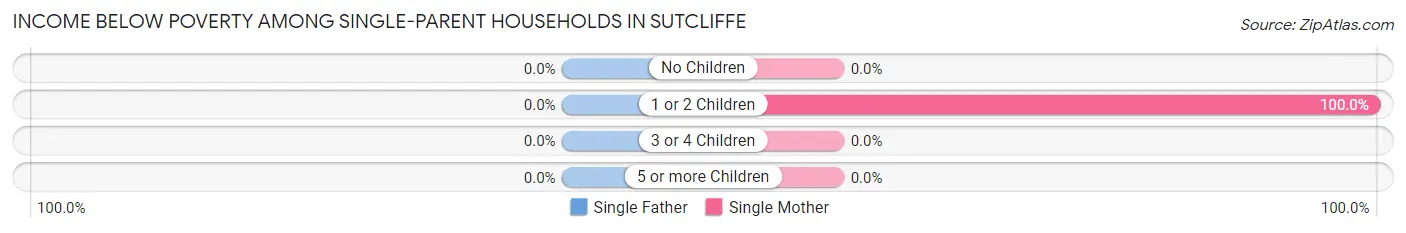
| Children | Single Father | Single Mother |
| No Children | 0 (0.0%) | 0 (0.0%) |
| 1 or 2 Children | 0 (0.0%) | 20 (100.0%) |
| 3 or 4 Children | 0 (0.0%) | 0 (0.0%) |
| 5 or more Children | 0 (0.0%) | 0 (0.0%) |
| Total | 0 (0.0%) | 20 (39.2%) |
Income Below Poverty Among Married-Couple vs Single-Parent Households in Sutcliffe
The poverty data for Sutcliffe shows that 6 of the married-couple family households (15.8%) and 20 of the single-parent households (39.2%) are living below the poverty level. Within the married-couple family households, those with 3 or 4 children have the highest poverty rate, with 6 households (60.0%) falling below the poverty line. Among the single-parent households, those with 1 or 2 children have the highest poverty rate, with 20 household (100.0%) living below poverty.
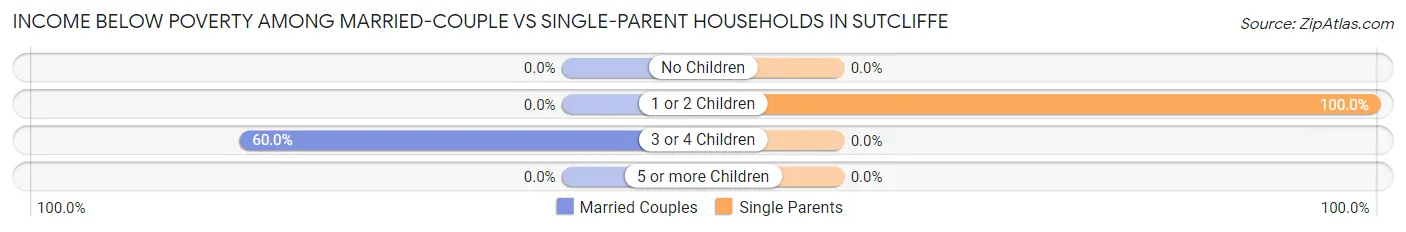
| Children | Married-Couple Families | Single-Parent Households |
| No Children | 0 (0.0%) | 0 (0.0%) |
| 1 or 2 Children | 0 (0.0%) | 20 (100.0%) |
| 3 or 4 Children | 6 (60.0%) | 0 (0.0%) |
| 5 or more Children | 0 (0.0%) | 0 (0.0%) |
| Total | 6 (15.8%) | 20 (39.2%) |
Race in Sutcliffe
The most populous races in Sutcliffe are Native / Alaskan (168 | 57.7%), White / Caucasian (81 | 27.8%), and Hispanic or Latino (40 | 13.8%).
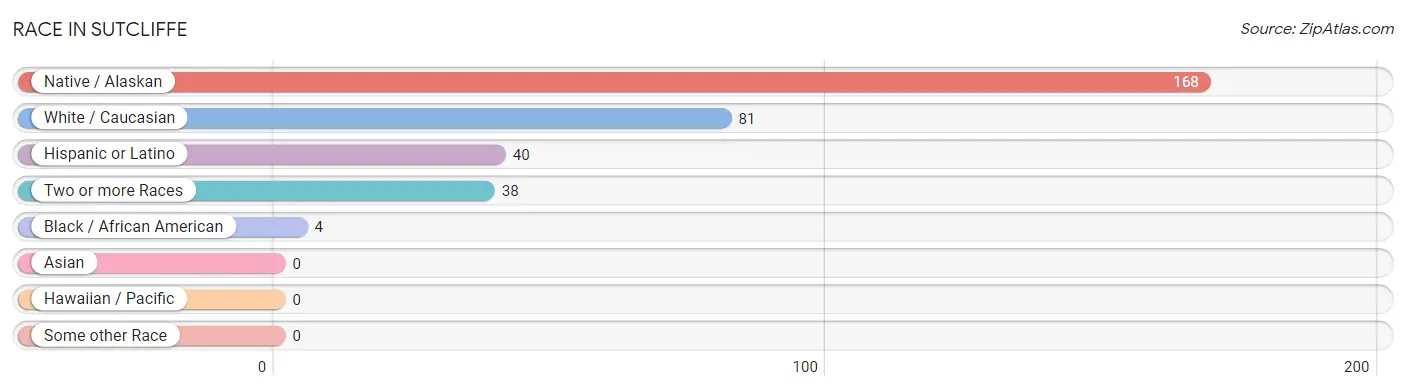
| Race | # Population | % Population |
| Asian | 0 | 0.0% |
| Black / African American | 4 | 1.4% |
| Hawaiian / Pacific | 0 | 0.0% |
| Hispanic or Latino | 40 | 13.8% |
| Native / Alaskan | 168 | 57.7% |
| White / Caucasian | 81 | 27.8% |
| Two or more Races | 38 | 13.1% |
| Some other Race | 0 | 0.0% |
| Total | 291 | 100.0% |
Ancestry in Sutcliffe
The most populous ancestries reported in Sutcliffe are Paiute (142 | 48.8%), Navajo (68 | 23.4%), Central American (28 | 9.6%), Salvadoran (28 | 9.6%), and Irish (25 | 8.6%), together accounting for 100.0% of all Sutcliffe residents.
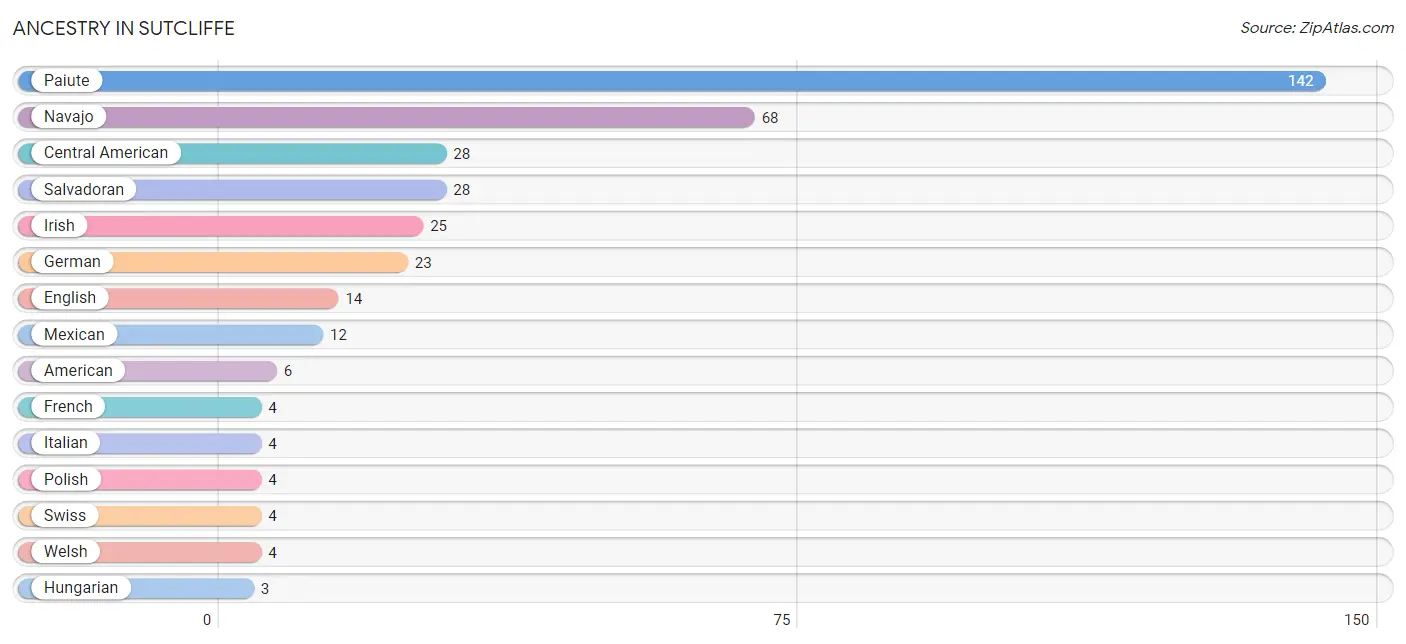
| Ancestry | # Population | % Population |
| American | 6 | 2.1% |
| Central American | 28 | 9.6% |
| English | 14 | 4.8% |
| French | 4 | 1.4% |
| German | 23 | 7.9% |
| Hungarian | 3 | 1.0% |
| Irish | 25 | 8.6% |
| Italian | 4 | 1.4% |
| Mexican | 12 | 4.1% |
| Navajo | 68 | 23.4% |
| Norwegian | 2 | 0.7% |
| Paiute | 142 | 48.8% |
| Polish | 4 | 1.4% |
| Russian | 3 | 1.0% |
| Salvadoran | 28 | 9.6% |
| Scottish | 2 | 0.7% |
| Swedish | 3 | 1.0% |
| Swiss | 4 | 1.4% |
| Welsh | 4 | 1.4% | View All 19 Rows |
Immigrants in Sutcliffe

| Immigration Origin | # Population | % Population | View All 0 Rows |
Sex and Age in Sutcliffe
Sex and Age in Sutcliffe
The most populous age groups in Sutcliffe are 30 to 34 Years (26 | 21.8%) for men and 55 to 59 Years (26 | 15.1%) for women.
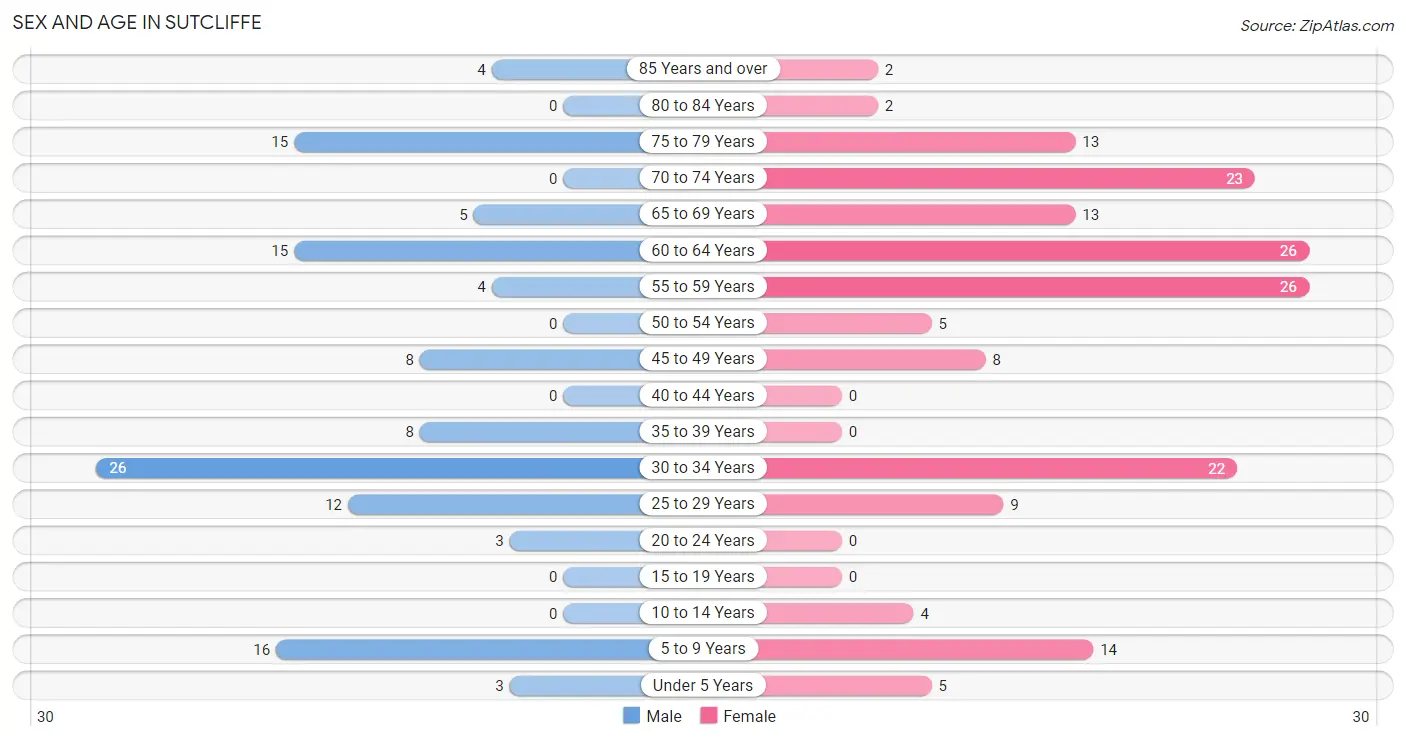
| Age Bracket | Male | Female |
| Under 5 Years | 3 (2.5%) | 5 (2.9%) |
| 5 to 9 Years | 16 (13.5%) | 14 (8.1%) |
| 10 to 14 Years | 0 (0.0%) | 4 (2.3%) |
| 15 to 19 Years | 0 (0.0%) | 0 (0.0%) |
| 20 to 24 Years | 3 (2.5%) | 0 (0.0%) |
| 25 to 29 Years | 12 (10.1%) | 9 (5.2%) |
| 30 to 34 Years | 26 (21.8%) | 22 (12.8%) |
| 35 to 39 Years | 8 (6.7%) | 0 (0.0%) |
| 40 to 44 Years | 0 (0.0%) | 0 (0.0%) |
| 45 to 49 Years | 8 (6.7%) | 8 (4.6%) |
| 50 to 54 Years | 0 (0.0%) | 5 (2.9%) |
| 55 to 59 Years | 4 (3.4%) | 26 (15.1%) |
| 60 to 64 Years | 15 (12.6%) | 26 (15.1%) |
| 65 to 69 Years | 5 (4.2%) | 13 (7.6%) |
| 70 to 74 Years | 0 (0.0%) | 23 (13.4%) |
| 75 to 79 Years | 15 (12.6%) | 13 (7.6%) |
| 80 to 84 Years | 0 (0.0%) | 2 (1.2%) |
| 85 Years and over | 4 (3.4%) | 2 (1.2%) |
| Total | 119 (100.0%) | 172 (100.0%) |
Families and Households in Sutcliffe
Median Family Size in Sutcliffe
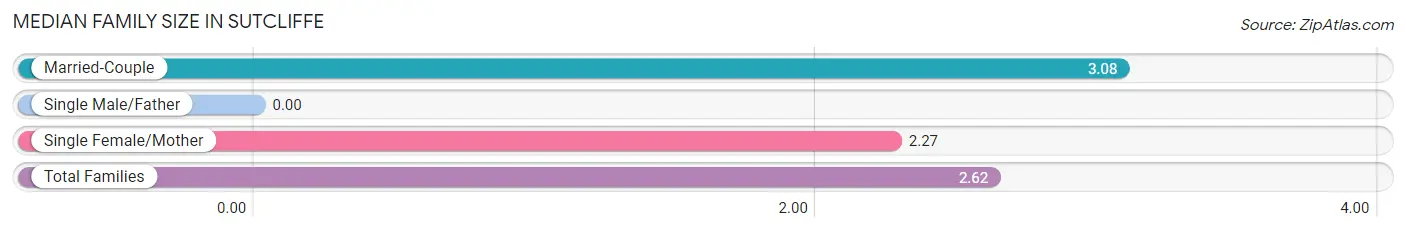
| Family Type | # Families | Family Size |
| Married-Couple | 38 (42.7%) | 3.08 |
| Single Male/Father | 0 (0.0%) | - |
| Single Female/Mother | 51 (57.3%) | 2.27 |
| Total Families | 89 (100.0%) | 2.62 |
Median Household Size in Sutcliffe
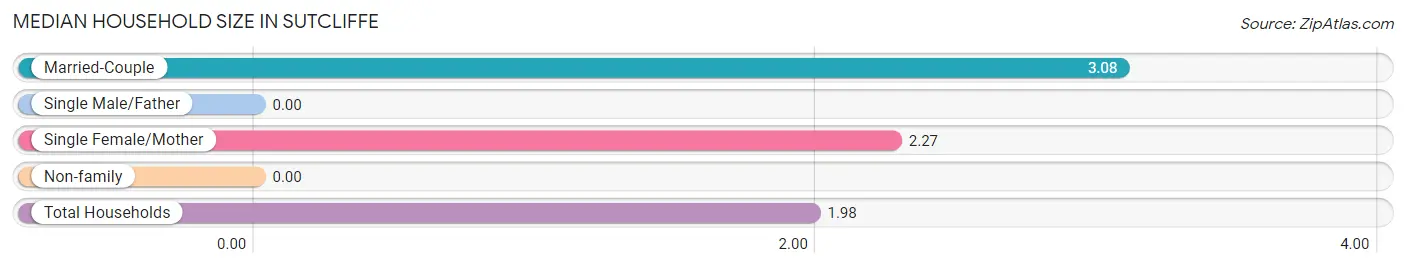
| Household Type | # Households | Household Size |
| Married-Couple | 38 (25.9%) | 3.08 |
| Single Male/Father | 0 (0.0%) | - |
| Single Female/Mother | 51 (34.7%) | 2.27 |
| Non-family | 58 (39.5%) | - |
| Total Households | 147 (100.0%) | 1.98 |
Household Size by Marriage Status in Sutcliffe
Out of a total of 147 households in Sutcliffe, 89 (60.5%) are family households, while 58 (39.5%) are nonfamily households. The most numerous type of family households are 2-person households, comprising 41, and the most common type of nonfamily households are 1-person households, comprising 58.
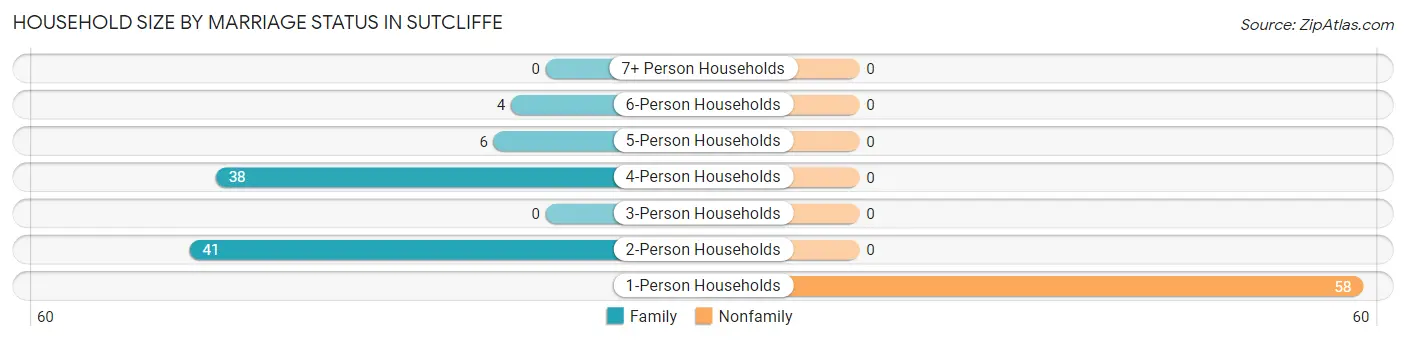
| Household Size | Family Households | Nonfamily Households |
| 1-Person Households | - | 58 (39.5%) |
| 2-Person Households | 41 (27.9%) | 0 (0.0%) |
| 3-Person Households | 0 (0.0%) | 0 (0.0%) |
| 4-Person Households | 38 (25.9%) | 0 (0.0%) |
| 5-Person Households | 6 (4.1%) | 0 (0.0%) |
| 6-Person Households | 4 (2.7%) | 0 (0.0%) |
| 7+ Person Households | 0 (0.0%) | 0 (0.0%) |
| Total | 89 (60.5%) | 58 (39.5%) |
Female Fertility in Sutcliffe
Fertility by Age in Sutcliffe
| Age Bracket | Women with Births | Births / 1,000 Women |
| 15 to 19 years | 0 (0.0%) | 0.0 |
| 20 to 34 years | 0 (0.0%) | 0.0 |
| 35 to 50 years | 0 (0.0%) | 0.0 |
| Total | 0 (0.0%) | 0.0 |
Fertility by Age by Marriage Status in Sutcliffe
| Age Bracket | Married | Unmarried |
| 15 to 19 years | 0 (0.0%) | 0 (0.0%) |
| 20 to 34 years | 0 (0.0%) | 0 (0.0%) |
| 35 to 50 years | 0 (0.0%) | 0 (0.0%) |
| Total | 0 (0.0%) | 0 (0.0%) |
Fertility by Education in Sutcliffe
| Educational Attainment | Women with Births | Births / 1,000 Women |
| Less than High School | 0 (0.0%) | 0.0 |
| High School Diploma | 0 (0.0%) | 0.0 |
| College or Associate's Degree | 0 (0.0%) | 0.0 |
| Bachelor's Degree | 0 (0.0%) | 0.0 |
| Graduate Degree | 0 (0.0%) | 0.0 |
| Total | 0 (0.0%) | 0.0 |
Fertility by Education by Marriage Status in Sutcliffe
| Educational Attainment | Married | Unmarried |
| Less than High School | 0 (0.0%) | 0 (0.0%) |
| High School Diploma | 0 (0.0%) | 0 (0.0%) |
| College or Associate's Degree | 0 (0.0%) | 0 (0.0%) |
| Bachelor's Degree | 0 (0.0%) | 0 (0.0%) |
| Graduate Degree | 0 (0.0%) | 0 (0.0%) |
| Total | 0 (0.0%) | 0 (0.0%) |
Employment Characteristics in Sutcliffe
Employment by Class of Employer in Sutcliffe
Among the 117 employed individuals in Sutcliffe, private company employees (85 | 72.7%), local government employees (13 | 11.1%), and federal government employees (12 | 10.3%) make up the most common classes of employment.
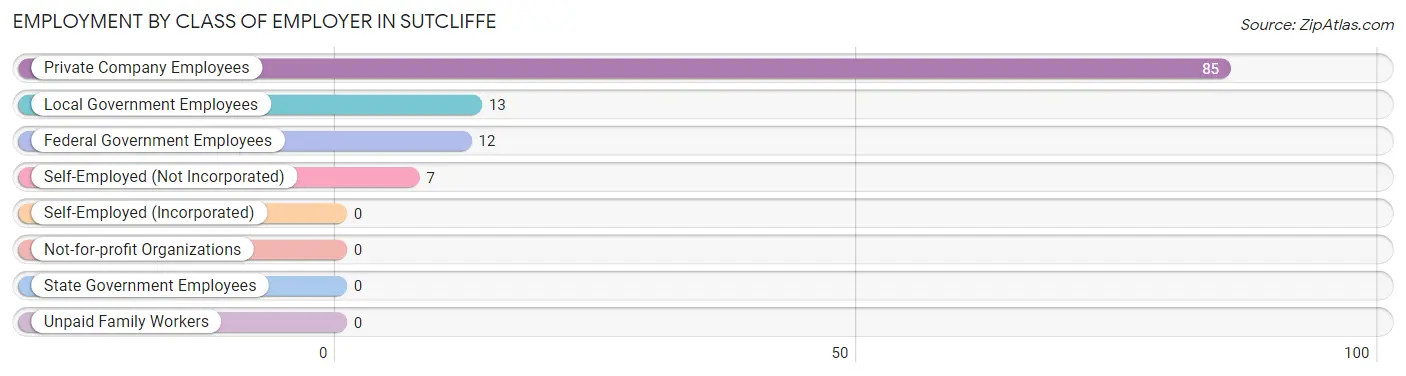
| Employer Class | # Employees | % Employees |
| Private Company Employees | 85 | 72.7% |
| Self-Employed (Incorporated) | 0 | 0.0% |
| Self-Employed (Not Incorporated) | 7 | 6.0% |
| Not-for-profit Organizations | 0 | 0.0% |
| Local Government Employees | 13 | 11.1% |
| State Government Employees | 0 | 0.0% |
| Federal Government Employees | 12 | 10.3% |
| Unpaid Family Workers | 0 | 0.0% |
| Total | 117 | 100.0% |
Employment Status by Age in Sutcliffe
According to the labor force statistics for Sutcliffe, out of the total population over 16 years of age (249), 49.8% or 124 individuals are in the labor force, with 6.3% or 8 of them unemployed. The age group with the highest labor force participation rate is 20 to 24 years, with 100.0% or 3 individuals in the labor force. Within the labor force, the 20 to 24 years age range has the highest percentage of unemployed individuals, with 100.0% or 3 of them being unemployed.
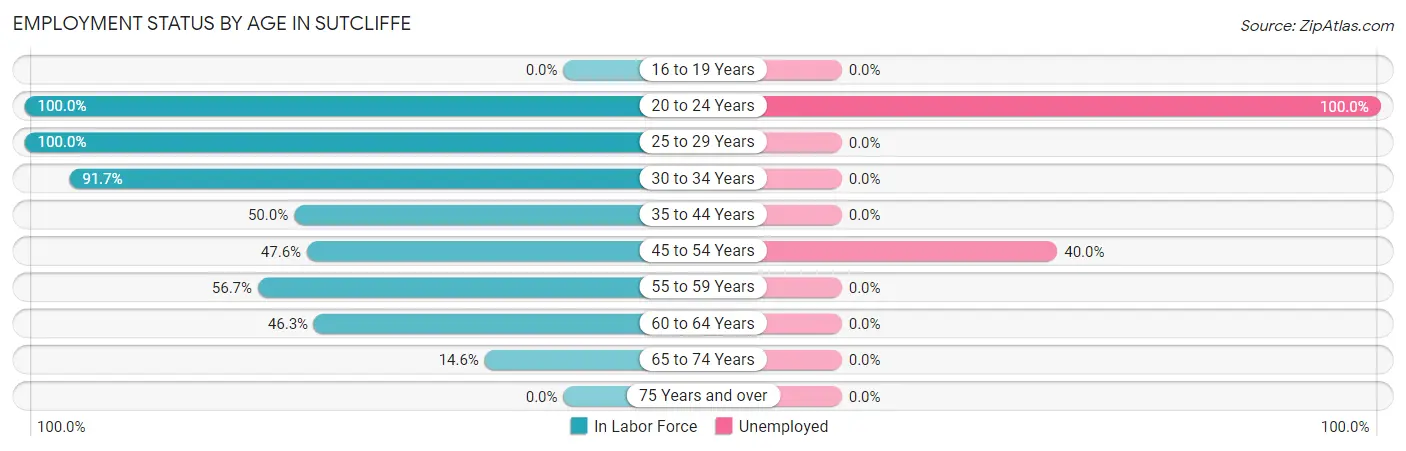
| Age Bracket | In Labor Force | Unemployed |
| 16 to 19 Years | 0 (0.0%) | 0 (0.0%) |
| 20 to 24 Years | 3 (100.0%) | 3 (100.0%) |
| 25 to 29 Years | 21 (100.0%) | 0 (0.0%) |
| 30 to 34 Years | 44 (91.7%) | 0 (0.0%) |
| 35 to 44 Years | 4 (50.0%) | 0 (0.0%) |
| 45 to 54 Years | 10 (47.6%) | 4 (40.0%) |
| 55 to 59 Years | 17 (56.7%) | 0 (0.0%) |
| 60 to 64 Years | 19 (46.3%) | 0 (0.0%) |
| 65 to 74 Years | 6 (14.6%) | 0 (0.0%) |
| 75 Years and over | 0 (0.0%) | 0 (0.0%) |
| Total | 124 (49.8%) | 8 (6.3%) |
Employment Status by Educational Attainment in Sutcliffe
According to labor force statistics for Sutcliffe, 68.0% of individuals (115) out of the total population between 25 and 64 years of age (169) are in the labor force, with 3.9% or 4 of them being unemployed. The group with the highest labor force participation rate are those with the educational attainment of bachelor's degree or higher, with 100.0% or 15 individuals in the labor force. Within the labor force, individuals with less than high school education have the highest percentage of unemployment, with 66.7% or 4 of them being unemployed.
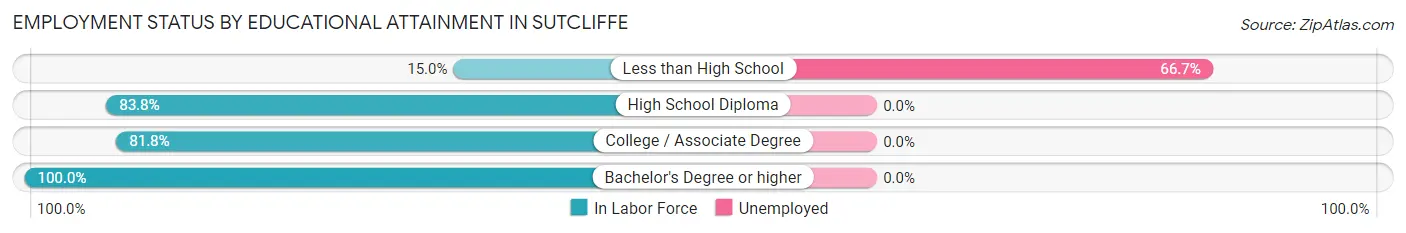
| Educational Attainment | In Labor Force | Unemployed |
| Less than High School | 6 (15.0%) | 27 (66.7%) |
| High School Diploma | 31 (83.8%) | 0 (0.0%) |
| College / Associate Degree | 63 (81.8%) | 0 (0.0%) |
| Bachelor's Degree or higher | 15 (100.0%) | 0 (0.0%) |
| Total | 115 (68.0%) | 7 (3.9%) |
Employment Occupations by Sex in Sutcliffe
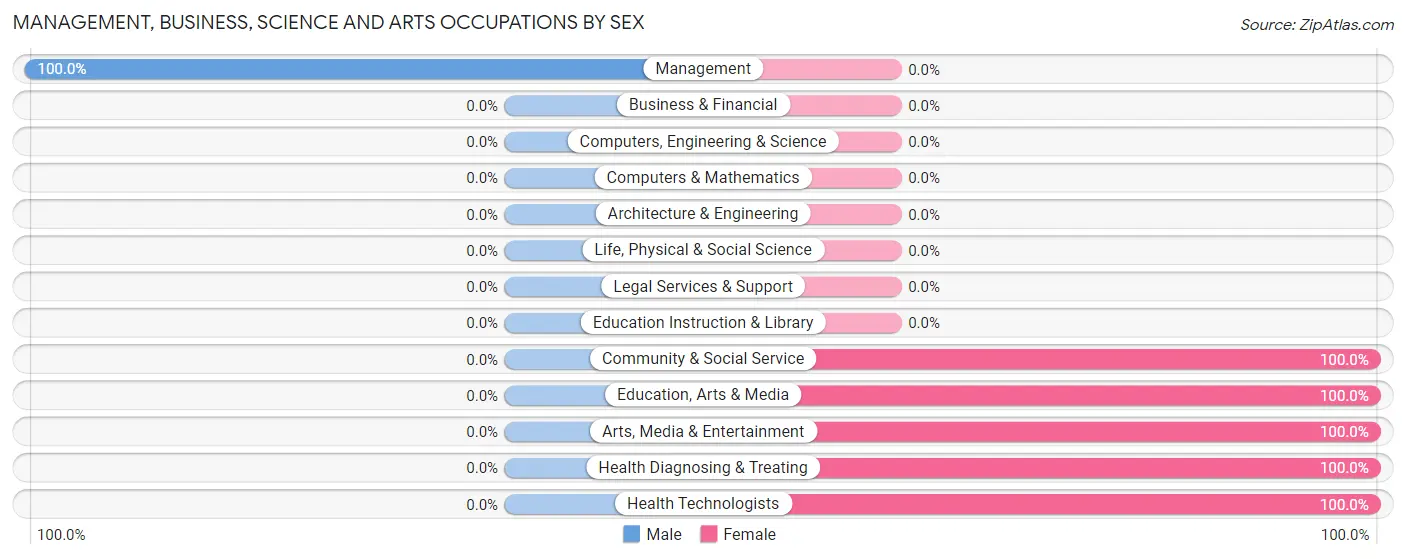
Management, Business, Science and Arts Occupations
The most common Management, Business, Science and Arts occupations in Sutcliffe are Community & Social Service (6 | 5.7%), Health Diagnosing & Treating (6 | 5.7%), Health Technologists (6 | 5.7%), Management (4 | 3.8%), and Education, Arts & Media (3 | 2.9%).
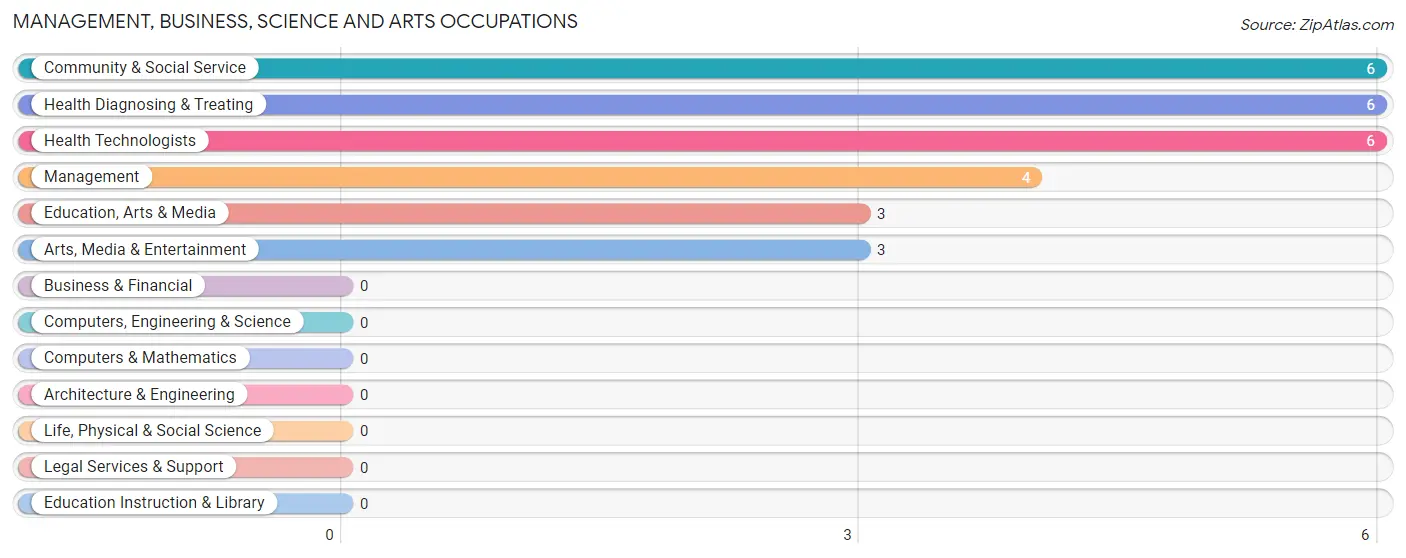
Management, Business, Science and Arts Occupations by Sex
| Occupation | Male | Female |
| Management | 4 (100.0%) | 0 (0.0%) |
| Business & Financial | 0 (0.0%) | 0 (0.0%) |
| Computers, Engineering & Science | 0 (0.0%) | 0 (0.0%) |
| Computers & Mathematics | 0 (0.0%) | 0 (0.0%) |
| Architecture & Engineering | 0 (0.0%) | 0 (0.0%) |
| Life, Physical & Social Science | 0 (0.0%) | 0 (0.0%) |
| Community & Social Service | 0 (0.0%) | 6 (100.0%) |
| Education, Arts & Media | 0 (0.0%) | 3 (100.0%) |
| Legal Services & Support | 0 (0.0%) | 0 (0.0%) |
| Education Instruction & Library | 0 (0.0%) | 0 (0.0%) |
| Arts, Media & Entertainment | 0 (0.0%) | 3 (100.0%) |
| Health Diagnosing & Treating | 0 (0.0%) | 6 (100.0%) |
| Health Technologists | 0 (0.0%) | 6 (100.0%) |
| Total (Category) | 4 (25.0%) | 12 (75.0%) |
| Total (Overall) | 43 (40.9%) | 62 (59.1%) |
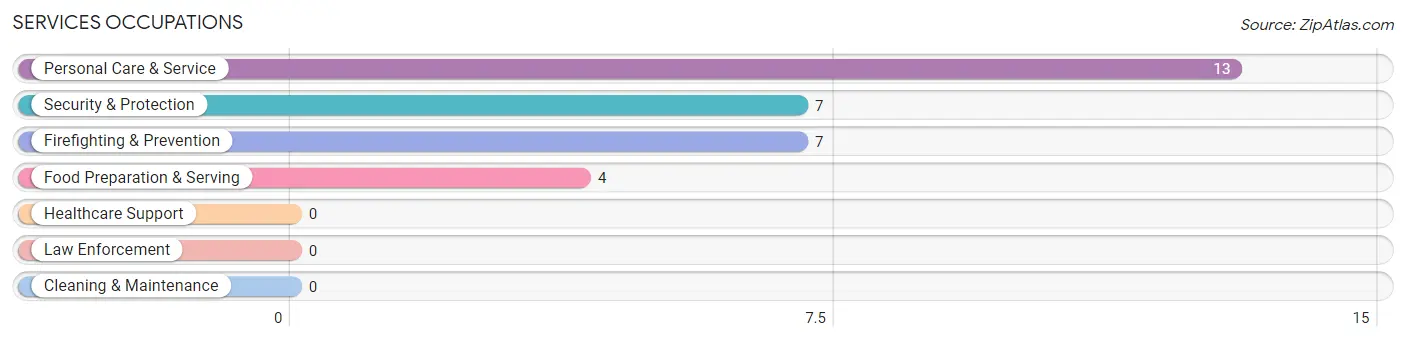
Services Occupations
The most common Services occupations in Sutcliffe are Personal Care & Service (13 | 12.4%), Security & Protection (7 | 6.7%), Firefighting & Prevention (7 | 6.7%), and Food Preparation & Serving (4 | 3.8%).
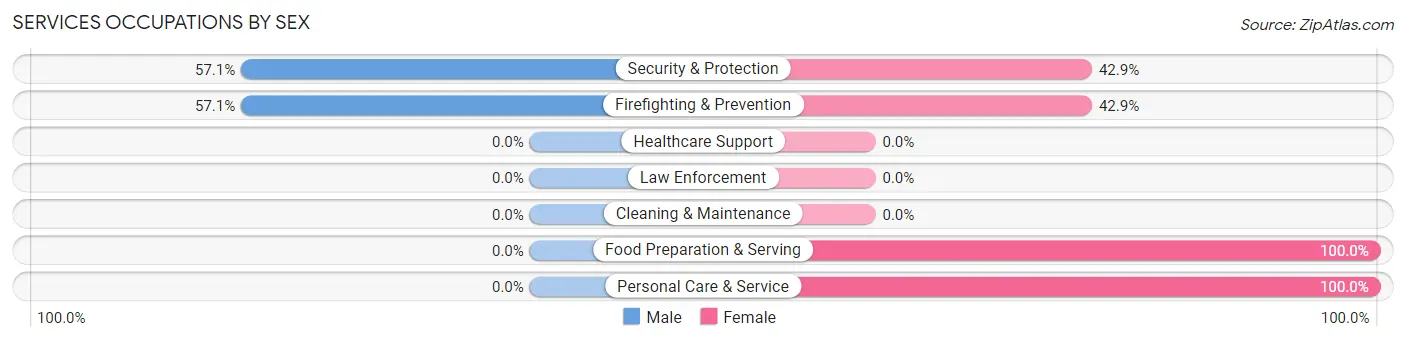
Services Occupations by Sex
Within the Services occupations in Sutcliffe, the most male-oriented occupations are Security & Protection (57.1%), and Firefighting & Prevention (57.1%), while the most female-oriented occupations are Food Preparation & Serving (100.0%), Personal Care & Service (100.0%), and Security & Protection (42.9%).
| Occupation | Male | Female |
| Healthcare Support | 0 (0.0%) | 0 (0.0%) |
| Security & Protection | 4 (57.1%) | 3 (42.9%) |
| Firefighting & Prevention | 4 (57.1%) | 3 (42.9%) |
| Law Enforcement | 0 (0.0%) | 0 (0.0%) |
| Food Preparation & Serving | 0 (0.0%) | 4 (100.0%) |
| Cleaning & Maintenance | 0 (0.0%) | 0 (0.0%) |
| Personal Care & Service | 0 (0.0%) | 13 (100.0%) |
| Total (Category) | 4 (16.7%) | 20 (83.3%) |
| Total (Overall) | 43 (40.9%) | 62 (59.1%) |
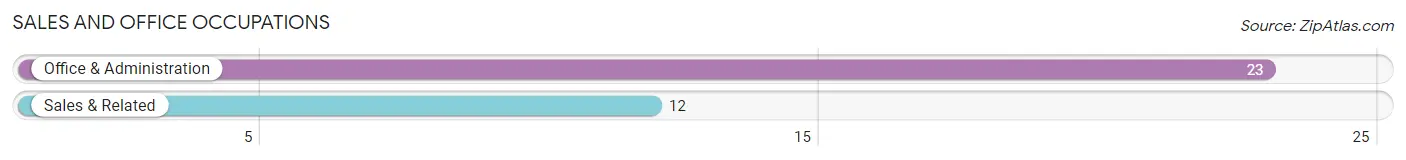
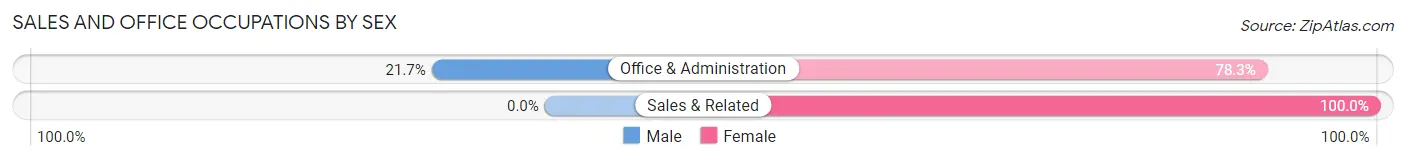
Sales and Office Occupations
The most common Sales and Office occupations in Sutcliffe are Office & Administration (23 | 21.9%), and Sales & Related (12 | 11.4%).
Sales and Office Occupations by Sex
| Occupation | Male | Female |
| Sales & Related | 0 (0.0%) | 12 (100.0%) |
| Office & Administration | 5 (21.7%) | 18 (78.3%) |
| Total (Category) | 5 (14.3%) | 30 (85.7%) |
| Total (Overall) | 43 (40.9%) | 62 (59.1%) |
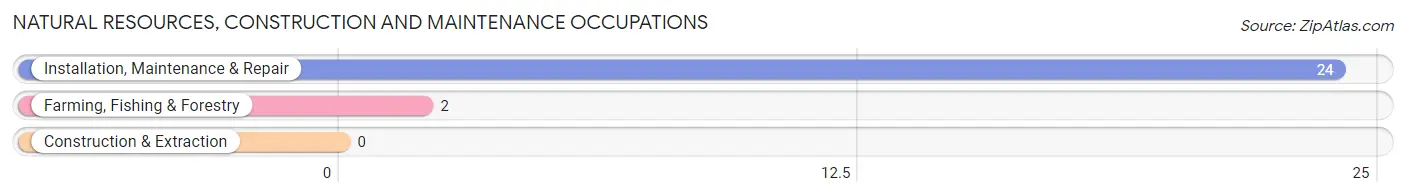
Natural Resources, Construction and Maintenance Occupations
The most common Natural Resources, Construction and Maintenance occupations in Sutcliffe are Installation, Maintenance & Repair (24 | 22.9%), and Farming, Fishing & Forestry (2 | 1.9%).
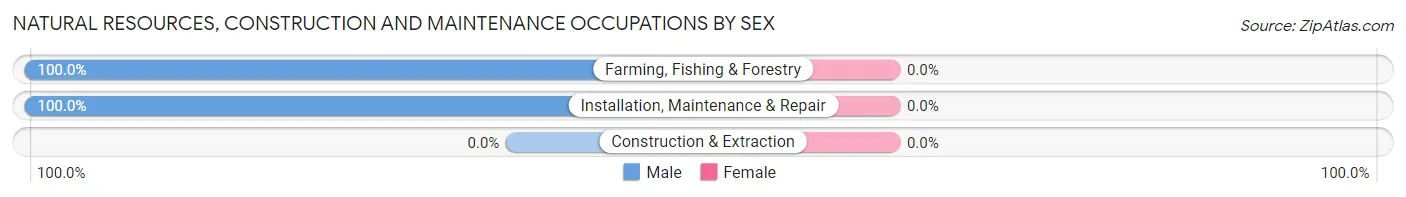
Natural Resources, Construction and Maintenance Occupations by Sex
| Occupation | Male | Female |
| Farming, Fishing & Forestry | 2 (100.0%) | 0 (0.0%) |
| Construction & Extraction | 0 (0.0%) | 0 (0.0%) |
| Installation, Maintenance & Repair | 24 (100.0%) | 0 (0.0%) |
| Total (Category) | 26 (100.0%) | 0 (0.0%) |
| Total (Overall) | 43 (40.9%) | 62 (59.1%) |
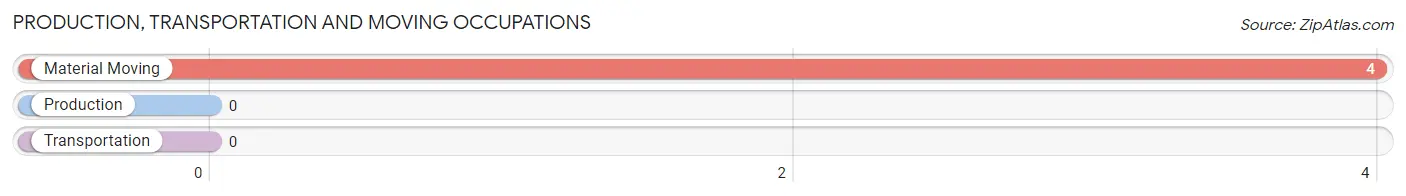
Production, Transportation and Moving Occupations
The most common Production, Transportation and Moving occupations in Sutcliffe are , and Material Moving (4 | 3.8%).
Production, Transportation and Moving Occupations by Sex
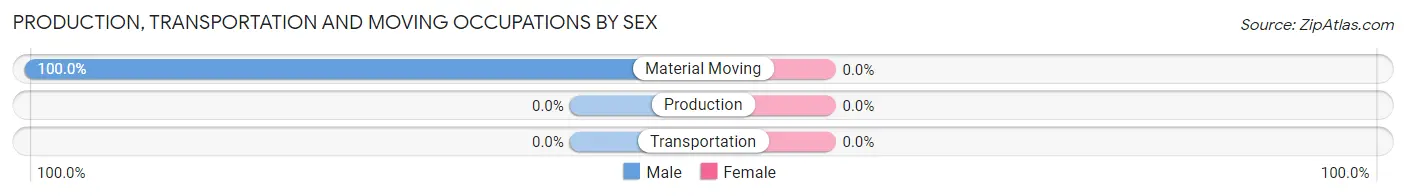
| Occupation | Male | Female |
| Production | 0 (0.0%) | 0 (0.0%) |
| Transportation | 0 (0.0%) | 0 (0.0%) |
| Material Moving | 4 (100.0%) | 0 (0.0%) |
| Total (Category) | 4 (100.0%) | 0 (0.0%) |
| Total (Overall) | 43 (40.9%) | 62 (59.1%) |
Employment Industries by Sex in Sutcliffe
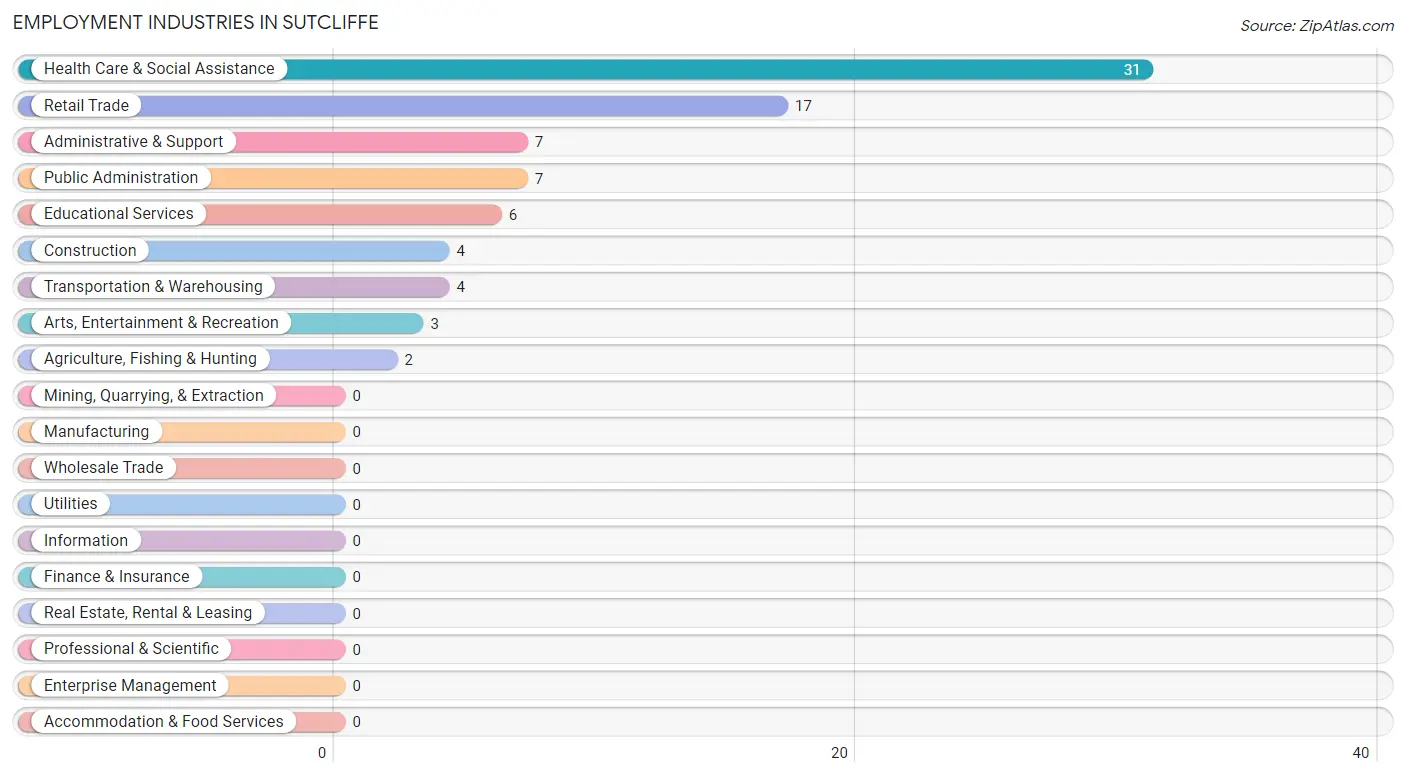
Employment Industries in Sutcliffe
The major employment industries in Sutcliffe include Health Care & Social Assistance (31 | 29.5%), Retail Trade (17 | 16.2%), Administrative & Support (7 | 6.7%), Public Administration (7 | 6.7%), and Educational Services (6 | 5.7%).
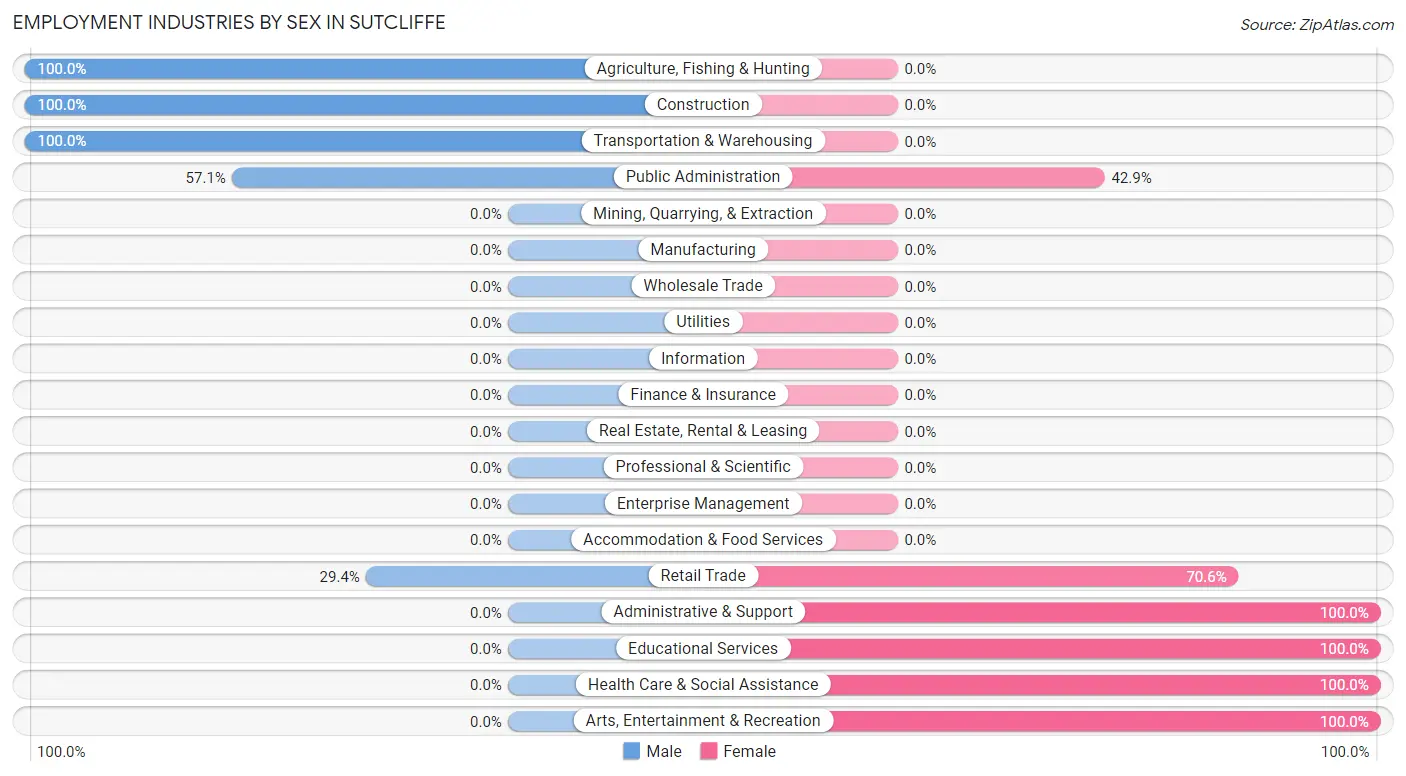
Employment Industries by Sex in Sutcliffe
The Sutcliffe industries that see more men than women are Agriculture, Fishing & Hunting (100.0%), Construction (100.0%), and Transportation & Warehousing (100.0%), whereas the industries that tend to have a higher number of women are Administrative & Support (100.0%), Educational Services (100.0%), and Health Care & Social Assistance (100.0%).
| Industry | Male | Female |
| Agriculture, Fishing & Hunting | 2 (100.0%) | 0 (0.0%) |
| Mining, Quarrying, & Extraction | 0 (0.0%) | 0 (0.0%) |
| Construction | 4 (100.0%) | 0 (0.0%) |
| Manufacturing | 0 (0.0%) | 0 (0.0%) |
| Wholesale Trade | 0 (0.0%) | 0 (0.0%) |
| Retail Trade | 5 (29.4%) | 12 (70.6%) |
| Transportation & Warehousing | 4 (100.0%) | 0 (0.0%) |
| Utilities | 0 (0.0%) | 0 (0.0%) |
| Information | 0 (0.0%) | 0 (0.0%) |
| Finance & Insurance | 0 (0.0%) | 0 (0.0%) |
| Real Estate, Rental & Leasing | 0 (0.0%) | 0 (0.0%) |
| Professional & Scientific | 0 (0.0%) | 0 (0.0%) |
| Enterprise Management | 0 (0.0%) | 0 (0.0%) |
| Administrative & Support | 0 (0.0%) | 7 (100.0%) |
| Educational Services | 0 (0.0%) | 6 (100.0%) |
| Health Care & Social Assistance | 0 (0.0%) | 31 (100.0%) |
| Arts, Entertainment & Recreation | 0 (0.0%) | 3 (100.0%) |
| Accommodation & Food Services | 0 (0.0%) | 0 (0.0%) |
| Public Administration | 4 (57.1%) | 3 (42.9%) |
| Total | 43 (40.9%) | 62 (59.1%) |
Education in Sutcliffe
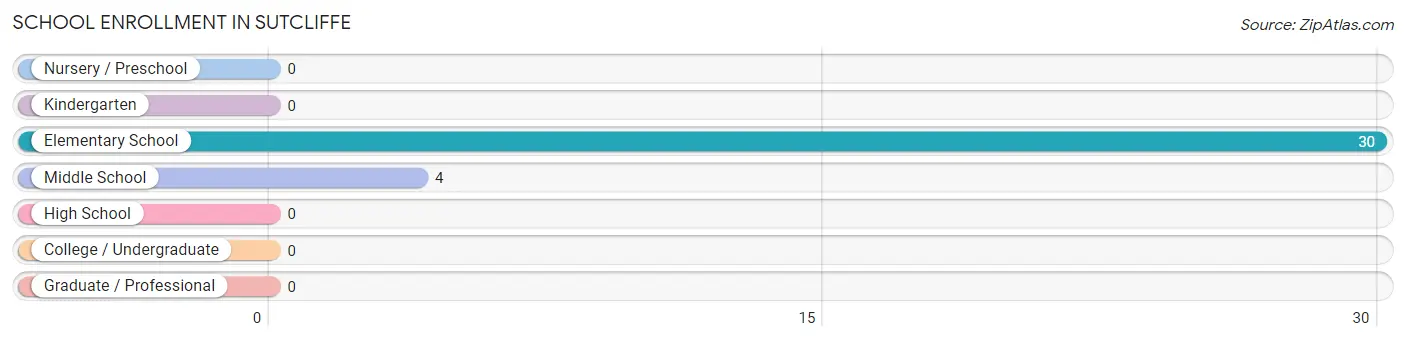
School Enrollment in Sutcliffe
The most common levels of schooling among the 34 students in Sutcliffe are elementary school (30 | 88.2%), and middle school (4 | 11.8%).
| School Level | # Students | % Students |
| Nursery / Preschool | 0 | 0.0% |
| Kindergarten | 0 | 0.0% |
| Elementary School | 30 | 88.2% |
| Middle School | 4 | 11.8% |
| High School | 0 | 0.0% |
| College / Undergraduate | 0 | 0.0% |
| Graduate / Professional | 0 | 0.0% |
| Total | 34 | 100.0% |
School Enrollment by Age by Funding Source in Sutcliffe
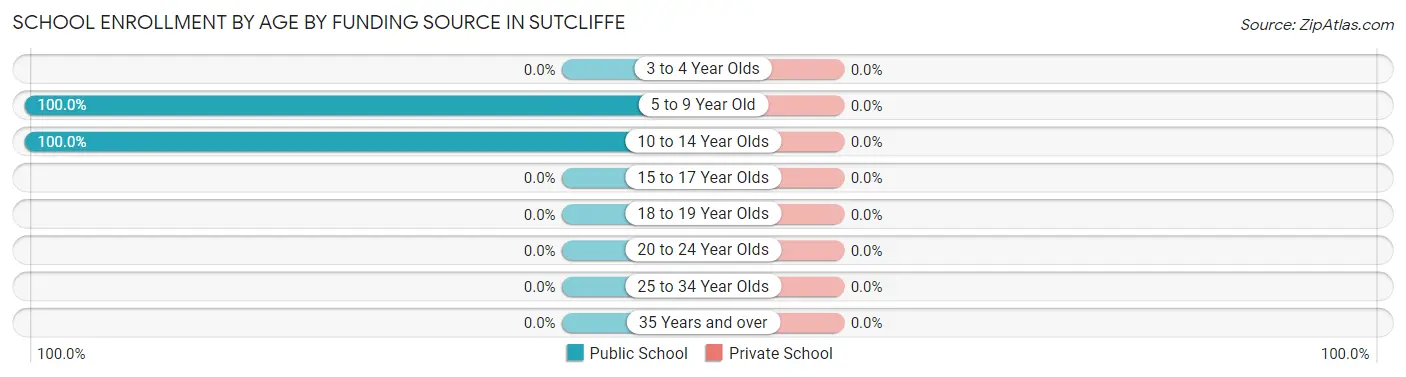
| Age Bracket | Public School | Private School |
| 3 to 4 Year Olds | 0 (0.0%) | 0 (0.0%) |
| 5 to 9 Year Old | 30 (100.0%) | 0 (0.0%) |
| 10 to 14 Year Olds | 4 (100.0%) | 0 (0.0%) |
| 15 to 17 Year Olds | 0 (0.0%) | 0 (0.0%) |
| 18 to 19 Year Olds | 0 (0.0%) | 0 (0.0%) |
| 20 to 24 Year Olds | 0 (0.0%) | 0 (0.0%) |
| 25 to 34 Year Olds | 0 (0.0%) | 0 (0.0%) |
| 35 Years and over | 0 (0.0%) | 0 (0.0%) |
| Total | 34 (100.0%) | 0 (0.0%) |
Educational Attainment by Field of Study in Sutcliffe
Social sciences (9 | 37.5%), communications (9 | 37.5%), and physical & health sciences (6 | 25.0%) are the most common fields of study among 24 individuals in Sutcliffe who have obtained a bachelor's degree or higher.
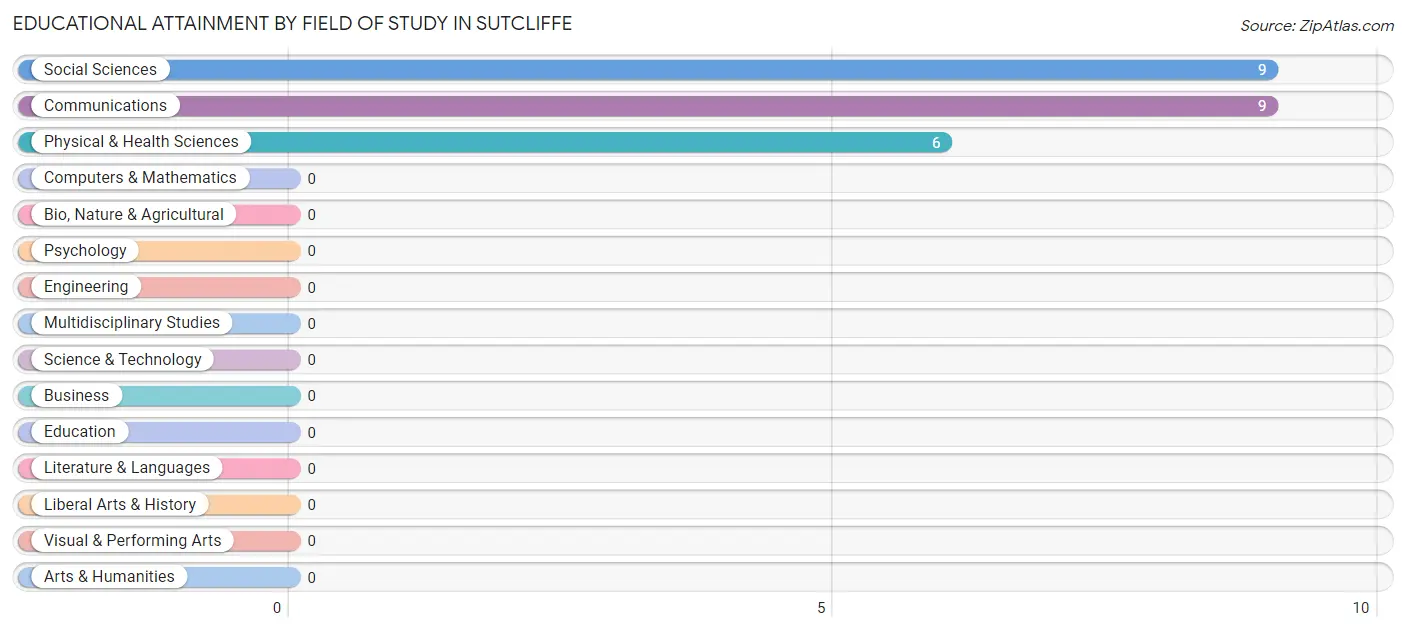
| Field of Study | # Graduates | % Graduates |
| Computers & Mathematics | 0 | 0.0% |
| Bio, Nature & Agricultural | 0 | 0.0% |
| Physical & Health Sciences | 6 | 25.0% |
| Psychology | 0 | 0.0% |
| Social Sciences | 9 | 37.5% |
| Engineering | 0 | 0.0% |
| Multidisciplinary Studies | 0 | 0.0% |
| Science & Technology | 0 | 0.0% |
| Business | 0 | 0.0% |
| Education | 0 | 0.0% |
| Literature & Languages | 0 | 0.0% |
| Liberal Arts & History | 0 | 0.0% |
| Visual & Performing Arts | 0 | 0.0% |
| Communications | 9 | 37.5% |
| Arts & Humanities | 0 | 0.0% |
| Total | 24 | 100.0% |
Transportation & Commute in Sutcliffe
Vehicle Availability by Sex in Sutcliffe
The most prevalent vehicle ownership categories in Sutcliffe are males with 2 vehicles (33, accounting for 60.0%) and females with 2 vehicles (41, making up 53.2%).
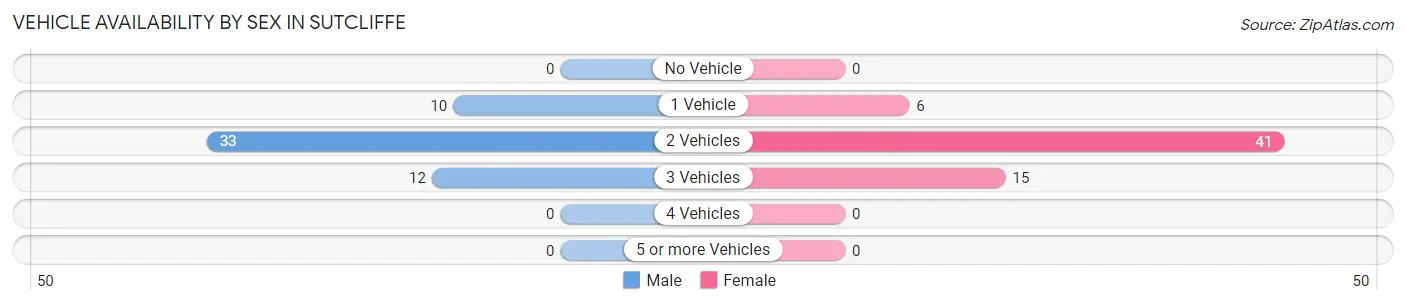
| Vehicles Available | Male | Female |
| No Vehicle | 0 (0.0%) | 0 (0.0%) |
| 1 Vehicle | 10 (18.2%) | 6 (9.7%) |
| 2 Vehicles | 33 (60.0%) | 41 (66.1%) |
| 3 Vehicles | 12 (21.8%) | 15 (24.2%) |
| 4 Vehicles | 0 (0.0%) | 0 (0.0%) |
| 5 or more Vehicles | 0 (0.0%) | 0 (0.0%) |
| Total | 55 (100.0%) | 62 (100.0%) |
Commute Time in Sutcliffe
The most frequently occuring commute durations in Sutcliffe are 60 to 89 minutes (45 commuters, 45.0%), 20 to 24 minutes (13 commuters, 13.0%), and 25 to 29 minutes (12 commuters, 12.0%).
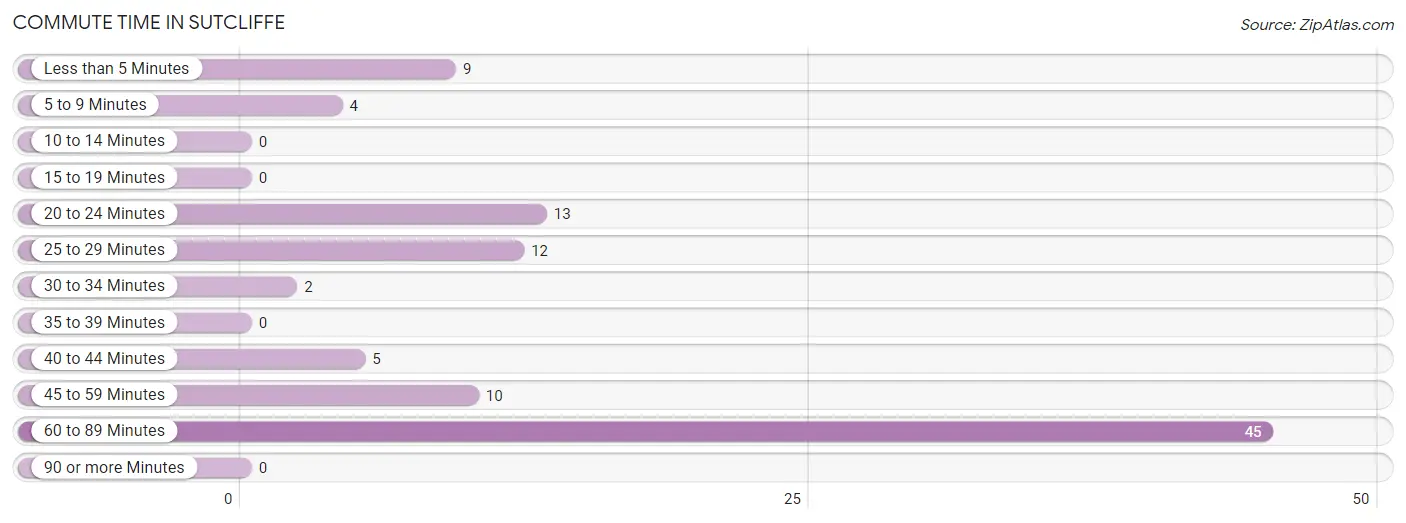
| Commute Time | # Commuters | % Commuters |
| Less than 5 Minutes | 9 | 9.0% |
| 5 to 9 Minutes | 4 | 4.0% |
| 10 to 14 Minutes | 0 | 0.0% |
| 15 to 19 Minutes | 0 | 0.0% |
| 20 to 24 Minutes | 13 | 13.0% |
| 25 to 29 Minutes | 12 | 12.0% |
| 30 to 34 Minutes | 2 | 2.0% |
| 35 to 39 Minutes | 0 | 0.0% |
| 40 to 44 Minutes | 5 | 5.0% |
| 45 to 59 Minutes | 10 | 10.0% |
| 60 to 89 Minutes | 45 | 45.0% |
| 90 or more Minutes | 0 | 0.0% |
Commute Time by Sex in Sutcliffe
The most common commute times in Sutcliffe are 60 to 89 minutes (24 commuters, 47.1%) for males and 60 to 89 minutes (21 commuters, 42.9%) for females.
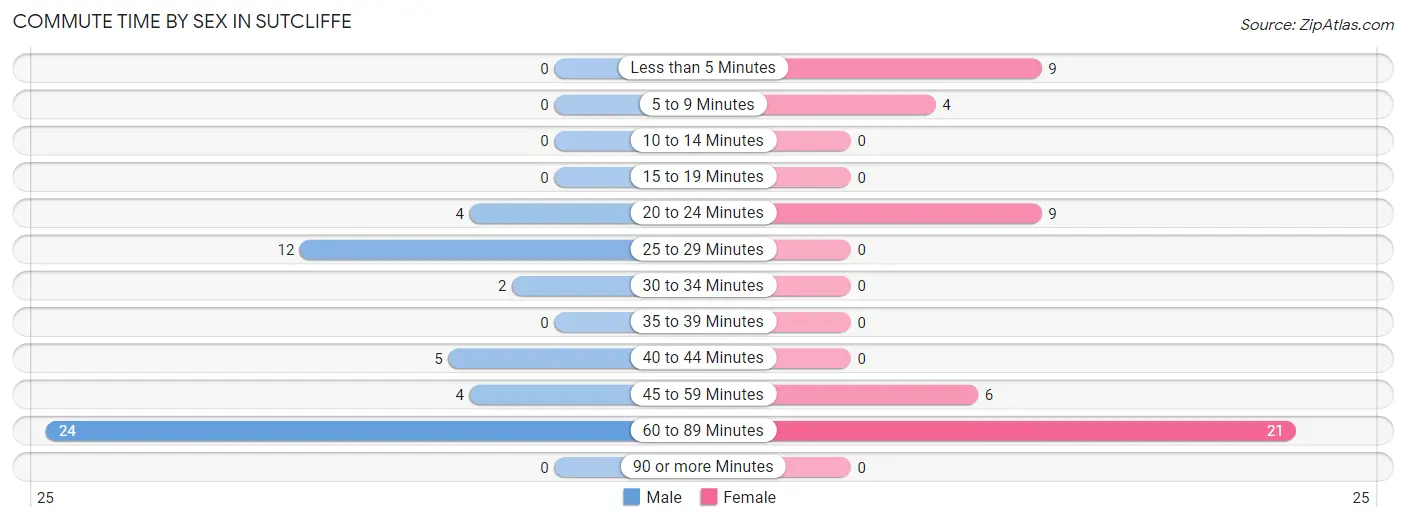
| Commute Time | Male | Female |
| Less than 5 Minutes | 0 (0.0%) | 9 (18.4%) |
| 5 to 9 Minutes | 0 (0.0%) | 4 (8.2%) |
| 10 to 14 Minutes | 0 (0.0%) | 0 (0.0%) |
| 15 to 19 Minutes | 0 (0.0%) | 0 (0.0%) |
| 20 to 24 Minutes | 4 (7.8%) | 9 (18.4%) |
| 25 to 29 Minutes | 12 (23.5%) | 0 (0.0%) |
| 30 to 34 Minutes | 2 (3.9%) | 0 (0.0%) |
| 35 to 39 Minutes | 0 (0.0%) | 0 (0.0%) |
| 40 to 44 Minutes | 5 (9.8%) | 0 (0.0%) |
| 45 to 59 Minutes | 4 (7.8%) | 6 (12.2%) |
| 60 to 89 Minutes | 24 (47.1%) | 21 (42.9%) |
| 90 or more Minutes | 0 (0.0%) | 0 (0.0%) |
Time of Departure to Work by Sex in Sutcliffe
The most frequent times of departure to work in Sutcliffe are 6:30 AM to 6:59 AM (28, 54.9%) for males and 6:30 AM to 6:59 AM (18, 36.7%) for females.
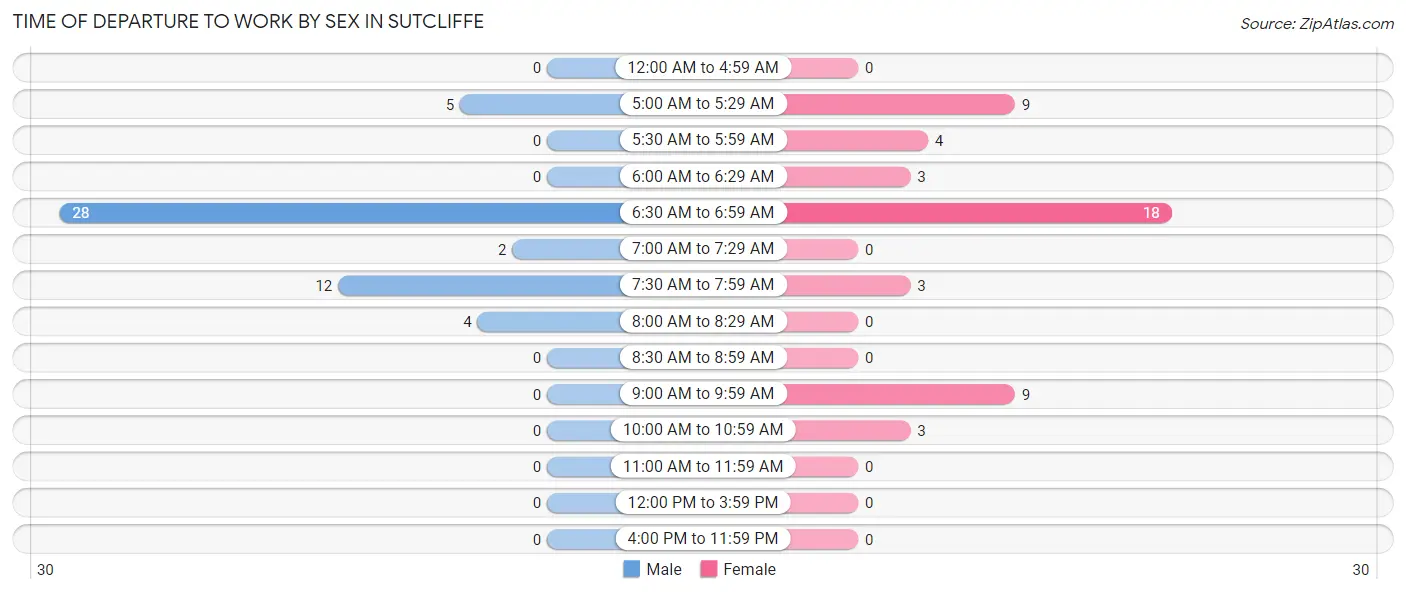
| Time of Departure | Male | Female |
| 12:00 AM to 4:59 AM | 0 (0.0%) | 0 (0.0%) |
| 5:00 AM to 5:29 AM | 5 (9.8%) | 9 (18.4%) |
| 5:30 AM to 5:59 AM | 0 (0.0%) | 4 (8.2%) |
| 6:00 AM to 6:29 AM | 0 (0.0%) | 3 (6.1%) |
| 6:30 AM to 6:59 AM | 28 (54.9%) | 18 (36.7%) |
| 7:00 AM to 7:29 AM | 2 (3.9%) | 0 (0.0%) |
| 7:30 AM to 7:59 AM | 12 (23.5%) | 3 (6.1%) |
| 8:00 AM to 8:29 AM | 4 (7.8%) | 0 (0.0%) |
| 8:30 AM to 8:59 AM | 0 (0.0%) | 0 (0.0%) |
| 9:00 AM to 9:59 AM | 0 (0.0%) | 9 (18.4%) |
| 10:00 AM to 10:59 AM | 0 (0.0%) | 3 (6.1%) |
| 11:00 AM to 11:59 AM | 0 (0.0%) | 0 (0.0%) |
| 12:00 PM to 3:59 PM | 0 (0.0%) | 0 (0.0%) |
| 4:00 PM to 11:59 PM | 0 (0.0%) | 0 (0.0%) |
| Total | 51 (100.0%) | 49 (100.0%) |
Housing Occupancy in Sutcliffe
Occupancy by Ownership in Sutcliffe
Of the total 147 dwellings in Sutcliffe, owner-occupied units account for 130 (88.4%), while renter-occupied units make up 17 (11.6%).
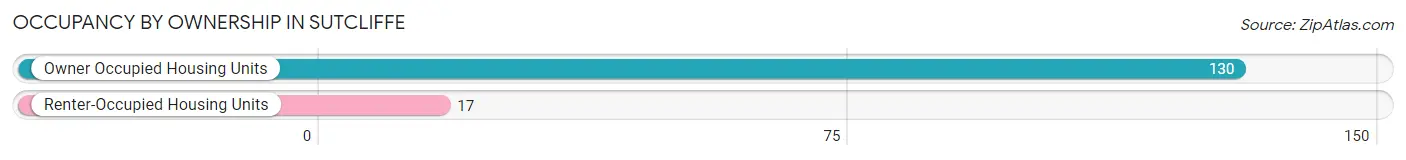
| Occupancy | # Housing Units | % Housing Units |
| Owner Occupied Housing Units | 130 | 88.4% |
| Renter-Occupied Housing Units | 17 | 11.6% |
| Total Occupied Housing Units | 147 | 100.0% |
Occupancy by Household Size in Sutcliffe
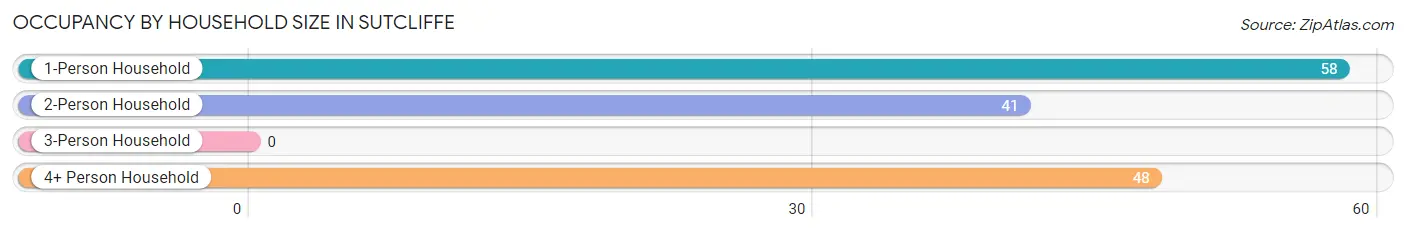
| Household Size | # Housing Units | % Housing Units |
| 1-Person Household | 58 | 39.5% |
| 2-Person Household | 41 | 27.9% |
| 3-Person Household | 0 | 0.0% |
| 4+ Person Household | 48 | 32.7% |
| Total Housing Units | 147 | 100.0% |
Occupancy by Ownership by Household Size in Sutcliffe
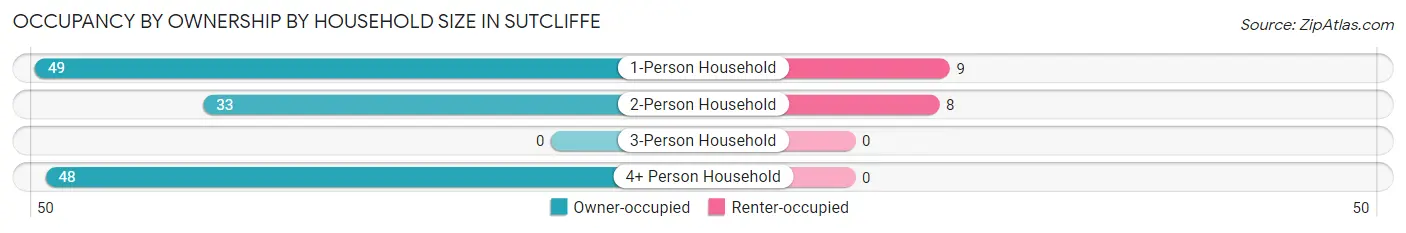
| Household Size | Owner-occupied | Renter-occupied |
| 1-Person Household | 49 (84.5%) | 9 (15.5%) |
| 2-Person Household | 33 (80.5%) | 8 (19.5%) |
| 3-Person Household | 0 (0.0%) | 0 (0.0%) |
| 4+ Person Household | 48 (100.0%) | 0 (0.0%) |
| Total Housing Units | 130 (88.4%) | 17 (11.6%) |
Occupancy by Educational Attainment in Sutcliffe
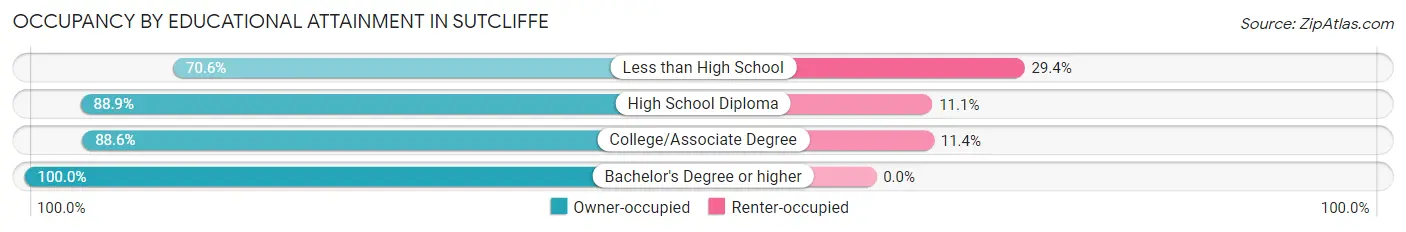
| Household Size | Owner-occupied | Renter-occupied |
| Less than High School | 12 (70.6%) | 5 (29.4%) |
| High School Diploma | 32 (88.9%) | 4 (11.1%) |
| College/Associate Degree | 62 (88.6%) | 8 (11.4%) |
| Bachelor's Degree or higher | 24 (100.0%) | 0 (0.0%) |
Occupancy by Age of Householder in Sutcliffe
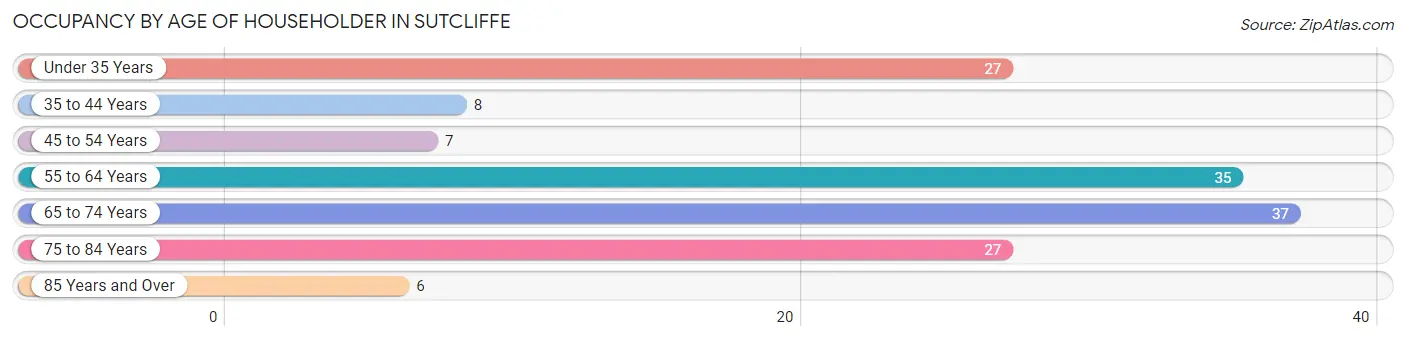
| Age Bracket | # Households | % Households |
| Under 35 Years | 27 | 18.4% |
| 35 to 44 Years | 8 | 5.4% |
| 45 to 54 Years | 7 | 4.8% |
| 55 to 64 Years | 35 | 23.8% |
| 65 to 74 Years | 37 | 25.2% |
| 75 to 84 Years | 27 | 18.4% |
| 85 Years and Over | 6 | 4.1% |
| Total | 147 | 100.0% |
Housing Finances in Sutcliffe
Median Income by Occupancy in Sutcliffe
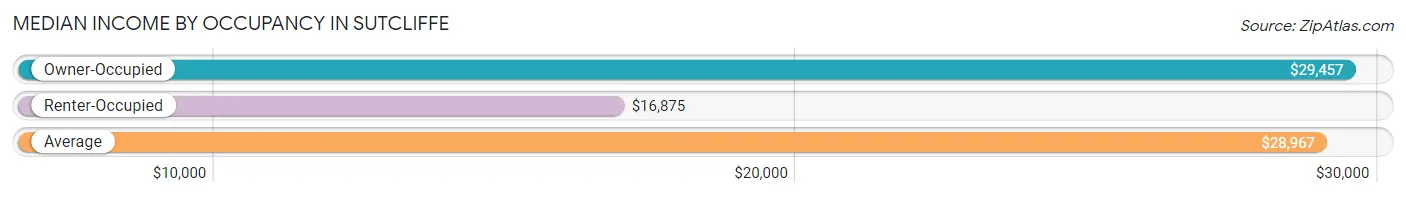
| Occupancy Type | # Households | Median Income |
| Owner-Occupied | 130 (88.4%) | $29,457 |
| Renter-Occupied | 17 (11.6%) | $16,875 |
| Average | 147 (100.0%) | $28,967 |
Occupancy by Householder Income Bracket in Sutcliffe
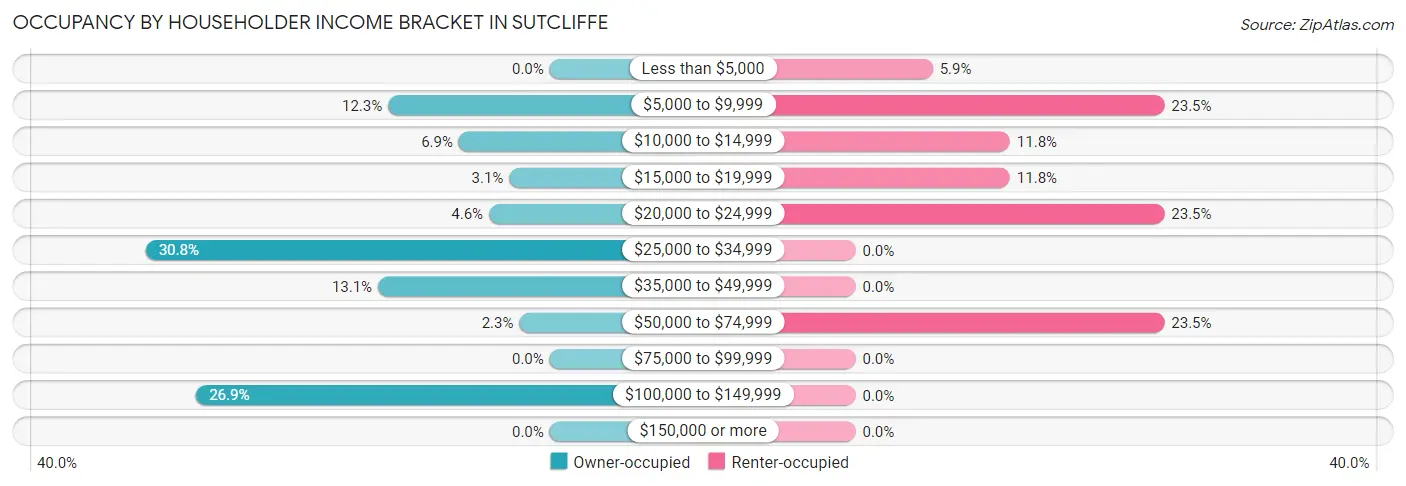
| Income Bracket | Owner-occupied | Renter-occupied |
| Less than $5,000 | 0 (0.0%) | 1 (5.9%) |
| $5,000 to $9,999 | 16 (12.3%) | 4 (23.5%) |
| $10,000 to $14,999 | 9 (6.9%) | 2 (11.8%) |
| $15,000 to $19,999 | 4 (3.1%) | 2 (11.8%) |
| $20,000 to $24,999 | 6 (4.6%) | 4 (23.5%) |
| $25,000 to $34,999 | 40 (30.8%) | 0 (0.0%) |
| $35,000 to $49,999 | 17 (13.1%) | 0 (0.0%) |
| $50,000 to $74,999 | 3 (2.3%) | 4 (23.5%) |
| $75,000 to $99,999 | 0 (0.0%) | 0 (0.0%) |
| $100,000 to $149,999 | 35 (26.9%) | 0 (0.0%) |
| $150,000 or more | 0 (0.0%) | 0 (0.0%) |
| Total | 130 (100.0%) | 17 (100.0%) |
Monthly Housing Cost Tiers in Sutcliffe
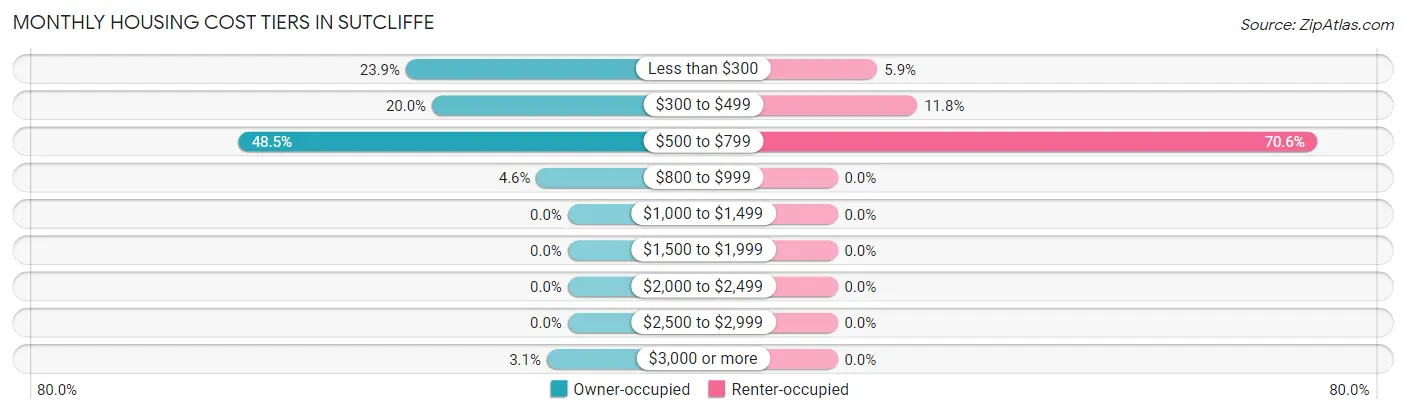
| Monthly Cost | Owner-occupied | Renter-occupied |
| Less than $300 | 31 (23.8%) | 1 (5.9%) |
| $300 to $499 | 26 (20.0%) | 2 (11.8%) |
| $500 to $799 | 63 (48.5%) | 12 (70.6%) |
| $800 to $999 | 6 (4.6%) | 0 (0.0%) |
| $1,000 to $1,499 | 0 (0.0%) | 0 (0.0%) |
| $1,500 to $1,999 | 0 (0.0%) | 0 (0.0%) |
| $2,000 to $2,499 | 0 (0.0%) | 0 (0.0%) |
| $2,500 to $2,999 | 0 (0.0%) | 0 (0.0%) |
| $3,000 or more | 4 (3.1%) | 0 (0.0%) |
| Total | 130 (100.0%) | 17 (100.0%) |
Physical Housing Characteristics in Sutcliffe
Housing Structures in Sutcliffe
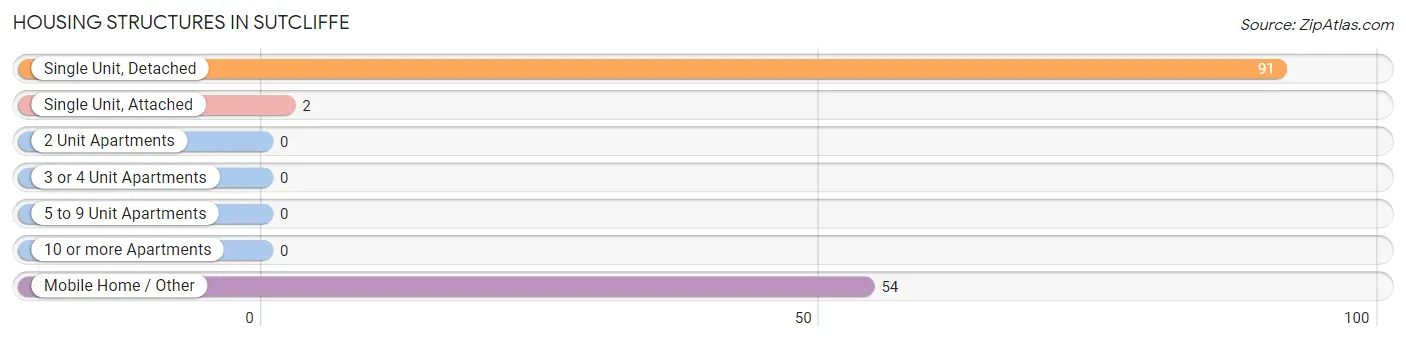
| Structure Type | # Housing Units | % Housing Units |
| Single Unit, Detached | 91 | 61.9% |
| Single Unit, Attached | 2 | 1.4% |
| 2 Unit Apartments | 0 | 0.0% |
| 3 or 4 Unit Apartments | 0 | 0.0% |
| 5 to 9 Unit Apartments | 0 | 0.0% |
| 10 or more Apartments | 0 | 0.0% |
| Mobile Home / Other | 54 | 36.7% |
| Total | 147 | 100.0% |
Housing Structures by Occupancy in Sutcliffe
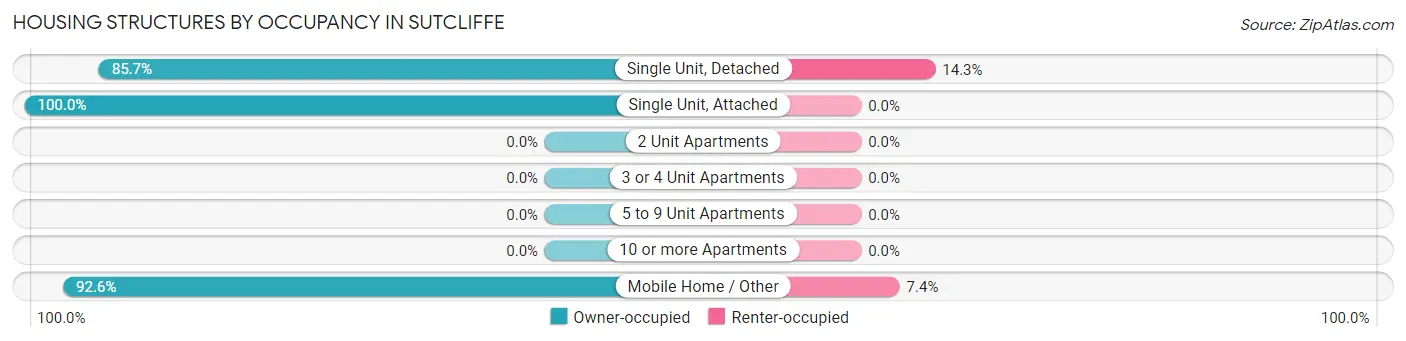
| Structure Type | Owner-occupied | Renter-occupied |
| Single Unit, Detached | 78 (85.7%) | 13 (14.3%) |
| Single Unit, Attached | 2 (100.0%) | 0 (0.0%) |
| 2 Unit Apartments | 0 (0.0%) | 0 (0.0%) |
| 3 or 4 Unit Apartments | 0 (0.0%) | 0 (0.0%) |
| 5 to 9 Unit Apartments | 0 (0.0%) | 0 (0.0%) |
| 10 or more Apartments | 0 (0.0%) | 0 (0.0%) |
| Mobile Home / Other | 50 (92.6%) | 4 (7.4%) |
| Total | 130 (88.4%) | 17 (11.6%) |
Housing Structures by Number of Rooms in Sutcliffe
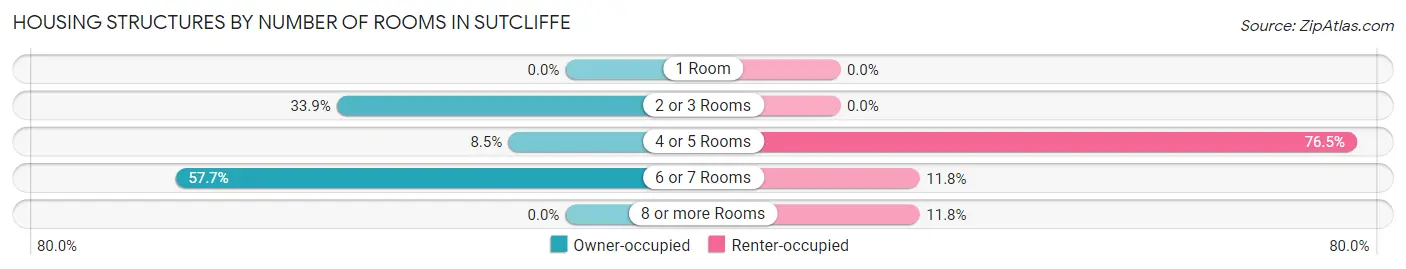
| Number of Rooms | Owner-occupied | Renter-occupied |
| 1 Room | 0 (0.0%) | 0 (0.0%) |
| 2 or 3 Rooms | 44 (33.9%) | 0 (0.0%) |
| 4 or 5 Rooms | 11 (8.5%) | 13 (76.5%) |
| 6 or 7 Rooms | 75 (57.7%) | 2 (11.8%) |
| 8 or more Rooms | 0 (0.0%) | 2 (11.8%) |
| Total | 130 (100.0%) | 17 (100.0%) |
Housing Structure by Heating Type in Sutcliffe
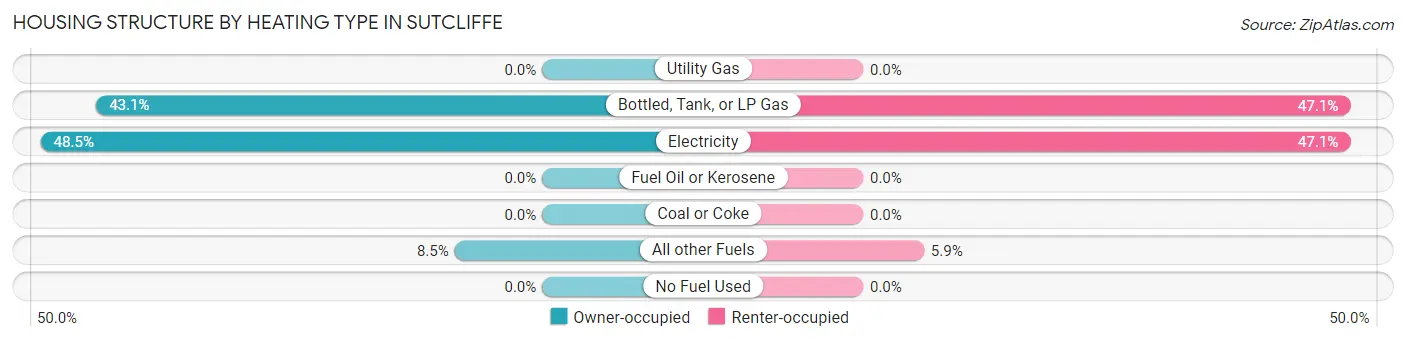
| Heating Type | Owner-occupied | Renter-occupied |
| Utility Gas | 0 (0.0%) | 0 (0.0%) |
| Bottled, Tank, or LP Gas | 56 (43.1%) | 8 (47.1%) |
| Electricity | 63 (48.5%) | 8 (47.1%) |
| Fuel Oil or Kerosene | 0 (0.0%) | 0 (0.0%) |
| Coal or Coke | 0 (0.0%) | 0 (0.0%) |
| All other Fuels | 11 (8.5%) | 1 (5.9%) |
| No Fuel Used | 0 (0.0%) | 0 (0.0%) |
| Total | 130 (100.0%) | 17 (100.0%) |
Household Vehicle Usage in Sutcliffe
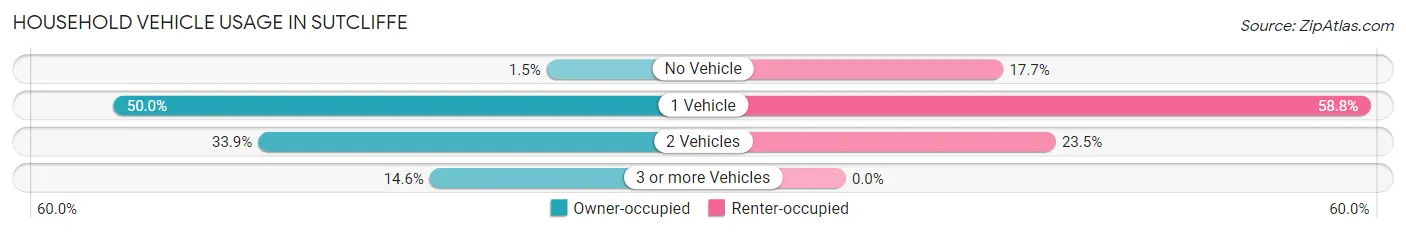
| Vehicles per Household | Owner-occupied | Renter-occupied |
| No Vehicle | 2 (1.5%) | 3 (17.6%) |
| 1 Vehicle | 65 (50.0%) | 10 (58.8%) |
| 2 Vehicles | 44 (33.9%) | 4 (23.5%) |
| 3 or more Vehicles | 19 (14.6%) | 0 (0.0%) |
| Total | 130 (100.0%) | 17 (100.0%) |
Real Estate & Mortgages in Sutcliffe
Real Estate and Mortgage Overview in Sutcliffe
| Characteristic | Without Mortgage | With Mortgage |
| Housing Units | 108 | 22 |
| Median Property Value | $50,000 | $0 |
| Median Household Income | $28,696 | $0 |
| Monthly Housing Costs | $463 | $4 |
| Real Estate Taxes | $199 | $0 |
Property Value by Mortgage Status in Sutcliffe
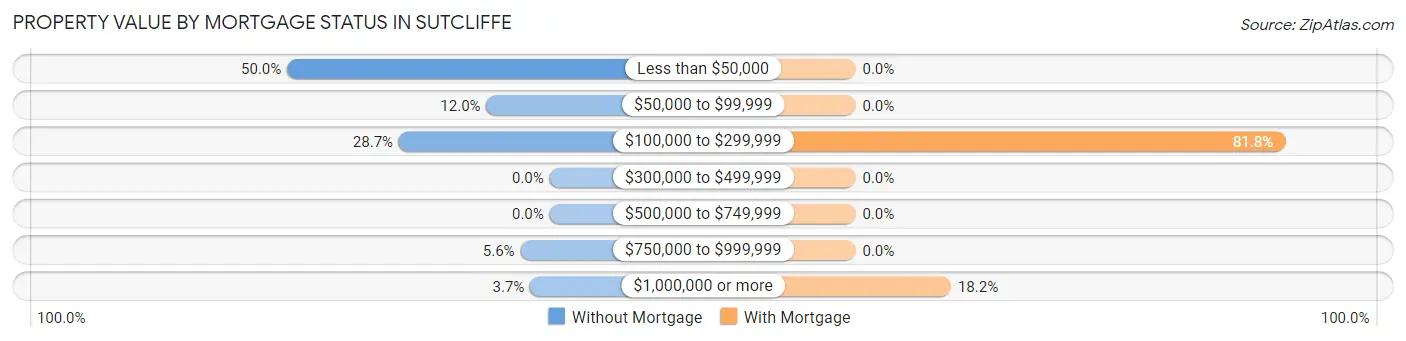
| Property Value | Without Mortgage | With Mortgage |
| Less than $50,000 | 54 (50.0%) | 0 (0.0%) |
| $50,000 to $99,999 | 13 (12.0%) | 0 (0.0%) |
| $100,000 to $299,999 | 31 (28.7%) | 18 (81.8%) |
| $300,000 to $499,999 | 0 (0.0%) | 0 (0.0%) |
| $500,000 to $749,999 | 0 (0.0%) | 0 (0.0%) |
| $750,000 to $999,999 | 6 (5.6%) | 0 (0.0%) |
| $1,000,000 or more | 4 (3.7%) | 4 (18.2%) |
| Total | 108 (100.0%) | 22 (100.0%) |
Household Income by Mortgage Status in Sutcliffe
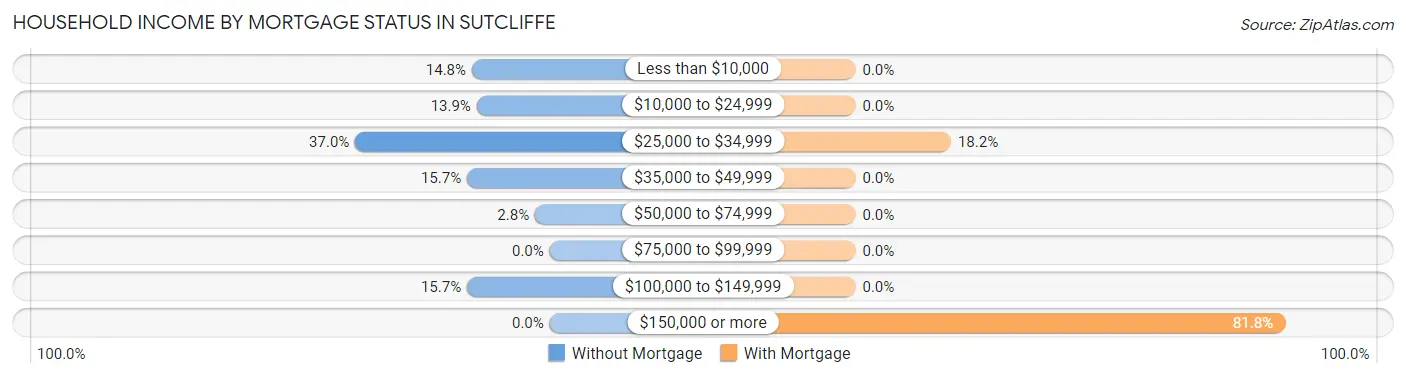
| Household Income | Without Mortgage | With Mortgage |
| Less than $10,000 | 16 (14.8%) | 0 (0.0%) |
| $10,000 to $24,999 | 15 (13.9%) | 0 (0.0%) |
| $25,000 to $34,999 | 40 (37.0%) | 4 (18.2%) |
| $35,000 to $49,999 | 17 (15.7%) | 0 (0.0%) |
| $50,000 to $74,999 | 3 (2.8%) | 0 (0.0%) |
| $75,000 to $99,999 | 0 (0.0%) | 0 (0.0%) |
| $100,000 to $149,999 | 17 (15.7%) | 0 (0.0%) |
| $150,000 or more | 0 (0.0%) | 18 (81.8%) |
| Total | 108 (100.0%) | 22 (100.0%) |
Property Value to Household Income Ratio in Sutcliffe
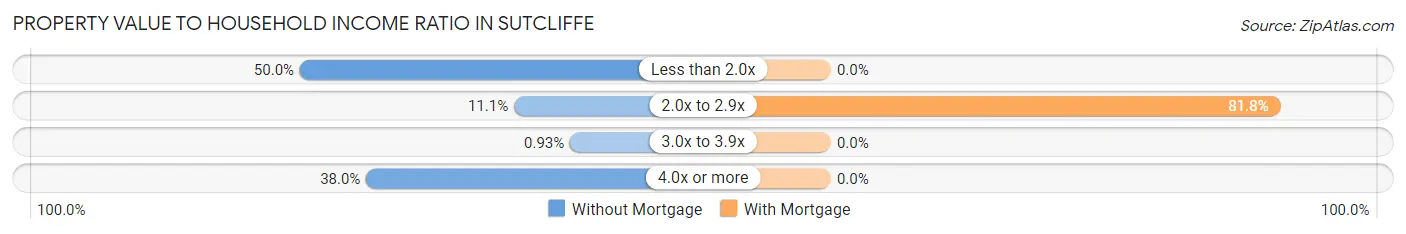
| Value-to-Income Ratio | Without Mortgage | With Mortgage |
| Less than 2.0x | 54 (50.0%) | 0 (0.0%) |
| 2.0x to 2.9x | 12 (11.1%) | 18 (81.8%) |
| 3.0x to 3.9x | 1 (0.9%) | 0 (0.0%) |
| 4.0x or more | 41 (38.0%) | 0 (0.0%) |
| Total | 108 (100.0%) | 22 (100.0%) |
Real Estate Taxes by Mortgage Status in Sutcliffe
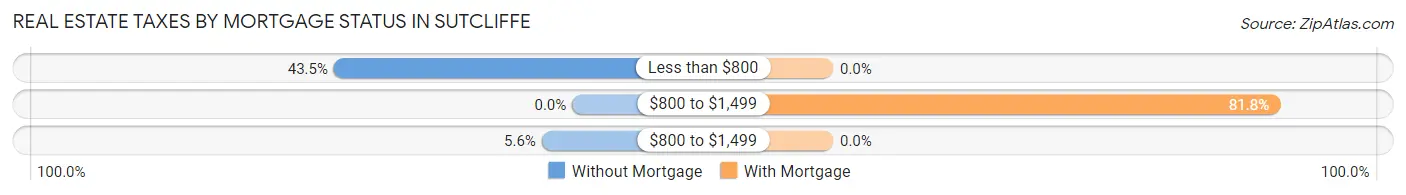
| Property Taxes | Without Mortgage | With Mortgage |
| Less than $800 | 47 (43.5%) | 0 (0.0%) |
| $800 to $1,499 | 0 (0.0%) | 18 (81.8%) |
| $800 to $1,499 | 6 (5.6%) | 0 (0.0%) |
| Total | 108 (100.0%) | 22 (100.0%) |
Health & Disability in Sutcliffe
Health Insurance Coverage by Age in Sutcliffe
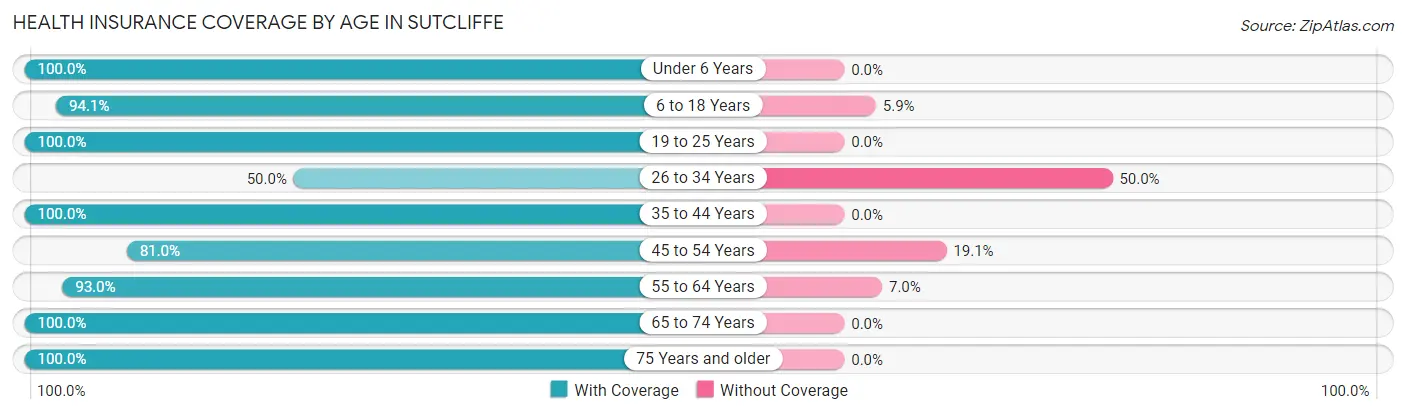
| Age Bracket | With Coverage | Without Coverage |
| Under 6 Years | 8 (100.0%) | 0 (0.0%) |
| 6 to 18 Years | 32 (94.1%) | 2 (5.9%) |
| 19 to 25 Years | 12 (100.0%) | 0 (0.0%) |
| 26 to 34 Years | 24 (50.0%) | 24 (50.0%) |
| 35 to 44 Years | 8 (100.0%) | 0 (0.0%) |
| 45 to 54 Years | 17 (80.9%) | 4 (19.1%) |
| 55 to 64 Years | 66 (93.0%) | 5 (7.0%) |
| 65 to 74 Years | 41 (100.0%) | 0 (0.0%) |
| 75 Years and older | 36 (100.0%) | 0 (0.0%) |
| Total | 244 (87.5%) | 35 (12.5%) |
Health Insurance Coverage by Citizenship Status in Sutcliffe
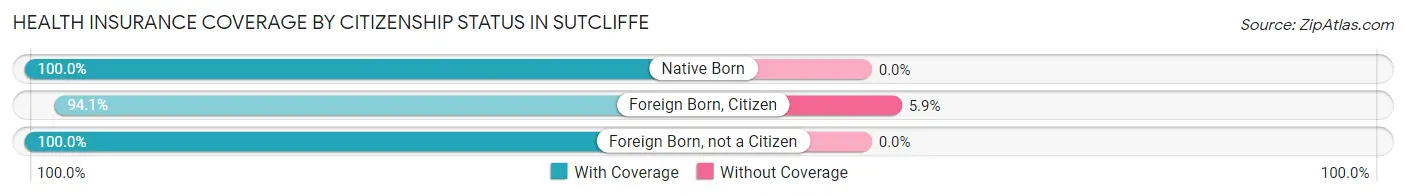
| Citizenship Status | With Coverage | Without Coverage |
| Native Born | 8 (100.0%) | 0 (0.0%) |
| Foreign Born, Citizen | 32 (94.1%) | 2 (5.9%) |
| Foreign Born, not a Citizen | 12 (100.0%) | 0 (0.0%) |
Health Insurance Coverage by Household Income in Sutcliffe
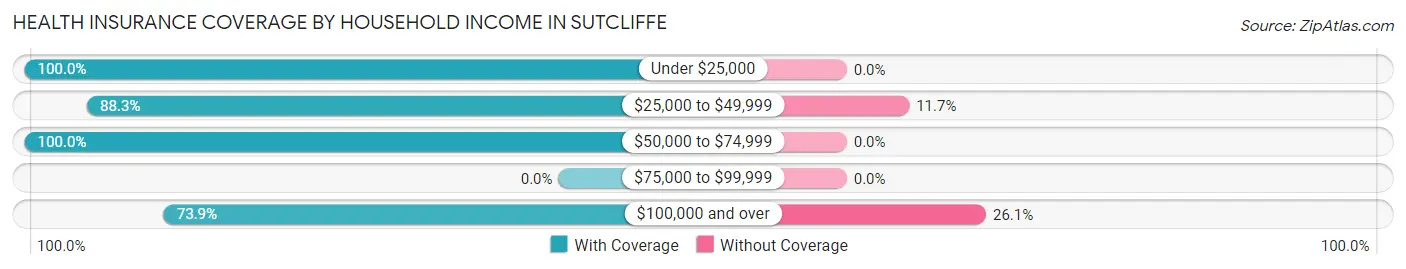
| Household Income | With Coverage | Without Coverage |
| Under $25,000 | 82 (100.0%) | 0 (0.0%) |
| $25,000 to $49,999 | 83 (88.3%) | 11 (11.7%) |
| $50,000 to $74,999 | 11 (100.0%) | 0 (0.0%) |
| $75,000 to $99,999 | 0 (0.0%) | 0 (0.0%) |
| $100,000 and over | 68 (73.9%) | 24 (26.1%) |
Public vs Private Health Insurance Coverage by Age in Sutcliffe
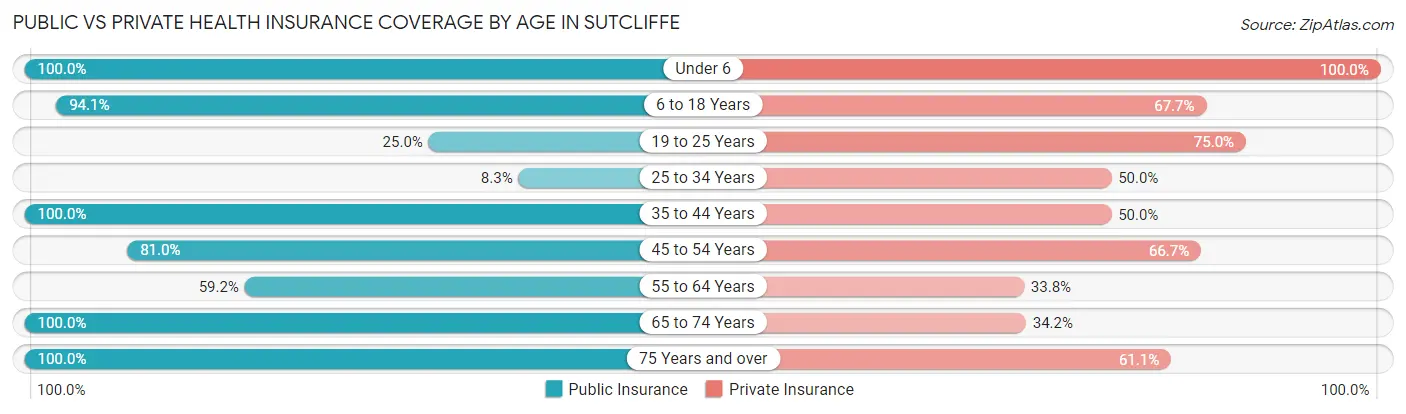
| Age Bracket | Public Insurance | Private Insurance |
| Under 6 | 8 (100.0%) | 8 (100.0%) |
| 6 to 18 Years | 32 (94.1%) | 23 (67.6%) |
| 19 to 25 Years | 3 (25.0%) | 9 (75.0%) |
| 25 to 34 Years | 4 (8.3%) | 24 (50.0%) |
| 35 to 44 Years | 8 (100.0%) | 4 (50.0%) |
| 45 to 54 Years | 17 (80.9%) | 14 (66.7%) |
| 55 to 64 Years | 42 (59.2%) | 24 (33.8%) |
| 65 to 74 Years | 41 (100.0%) | 14 (34.2%) |
| 75 Years and over | 36 (100.0%) | 22 (61.1%) |
| Total | 191 (68.5%) | 142 (50.9%) |
Disability Status by Sex by Age in Sutcliffe
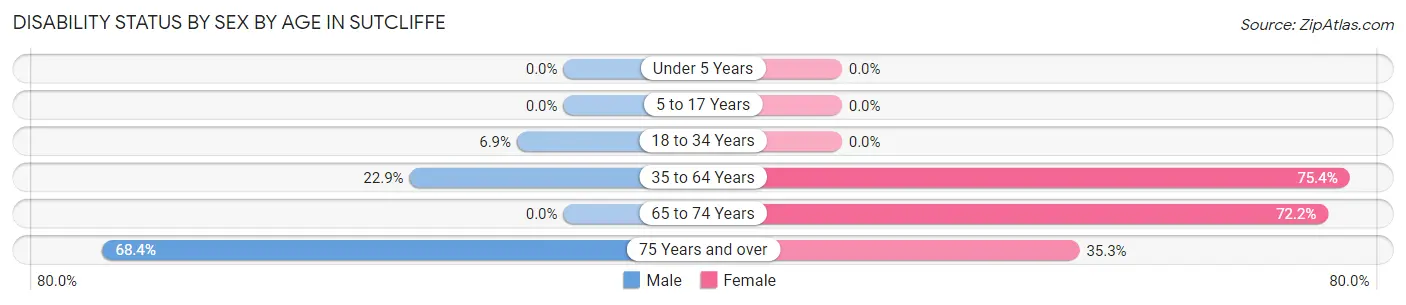
| Age Bracket | Male | Female |
| Under 5 Years | 0 (0.0%) | 0 (0.0%) |
| 5 to 17 Years | 0 (0.0%) | 0 (0.0%) |
| 18 to 34 Years | 2 (6.9%) | 0 (0.0%) |
| 35 to 64 Years | 8 (22.9%) | 49 (75.4%) |
| 65 to 74 Years | 0 (0.0%) | 26 (72.2%) |
| 75 Years and over | 13 (68.4%) | 6 (35.3%) |
Disability Class by Sex by Age in Sutcliffe
Disability Class: Hearing Difficulty
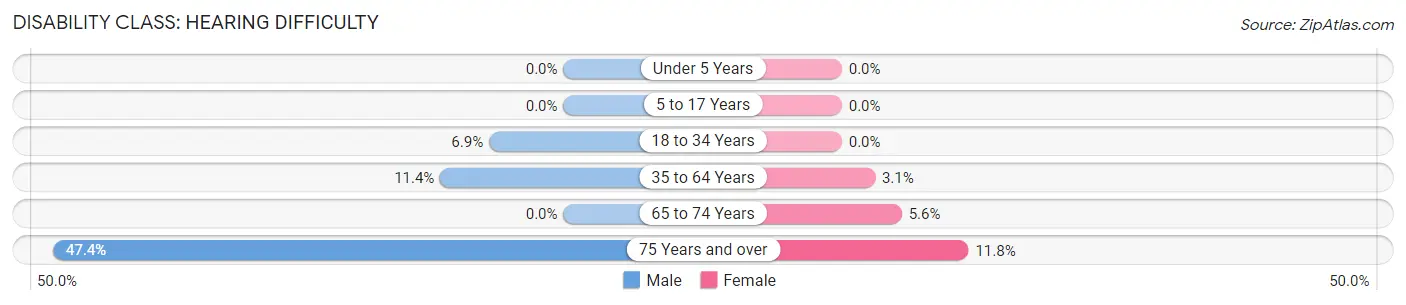
| Age Bracket | Male | Female |
| Under 5 Years | 0 (0.0%) | 0 (0.0%) |
| 5 to 17 Years | 0 (0.0%) | 0 (0.0%) |
| 18 to 34 Years | 2 (6.9%) | 0 (0.0%) |
| 35 to 64 Years | 4 (11.4%) | 2 (3.1%) |
| 65 to 74 Years | 0 (0.0%) | 2 (5.6%) |
| 75 Years and over | 9 (47.4%) | 2 (11.8%) |
Disability Class: Vision Difficulty
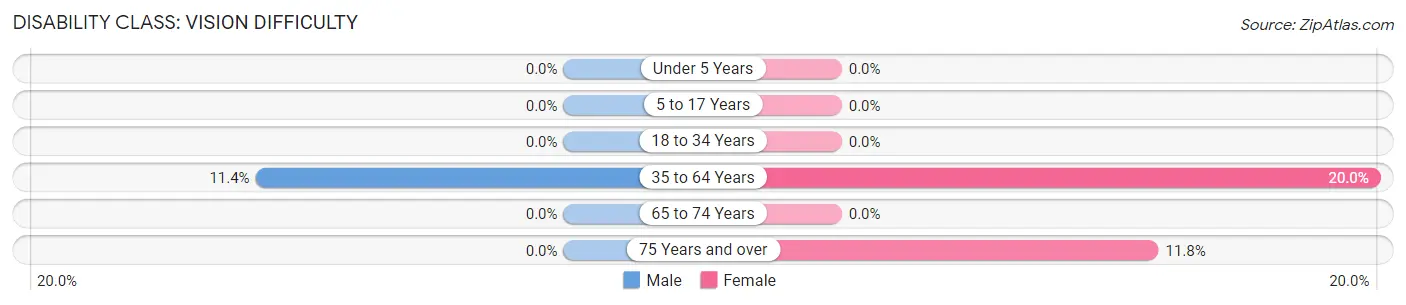
| Age Bracket | Male | Female |
| Under 5 Years | 0 (0.0%) | 0 (0.0%) |
| 5 to 17 Years | 0 (0.0%) | 0 (0.0%) |
| 18 to 34 Years | 0 (0.0%) | 0 (0.0%) |
| 35 to 64 Years | 4 (11.4%) | 13 (20.0%) |
| 65 to 74 Years | 0 (0.0%) | 0 (0.0%) |
| 75 Years and over | 0 (0.0%) | 2 (11.8%) |
Disability Class: Cognitive Difficulty
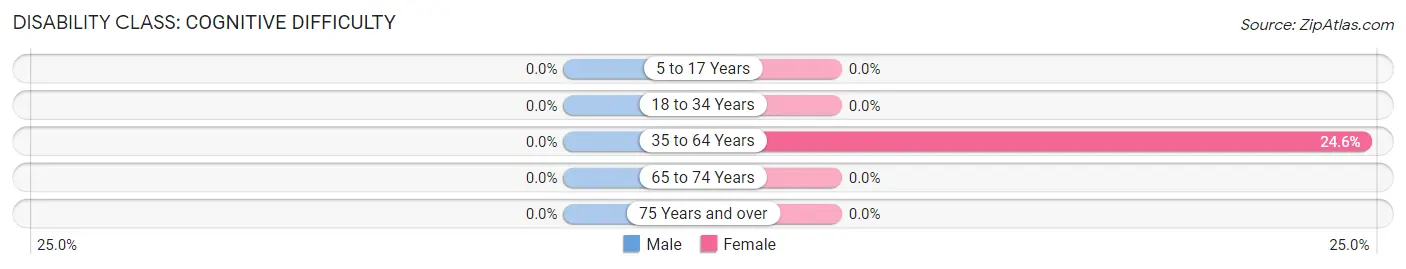
| Age Bracket | Male | Female |
| 5 to 17 Years | 0 (0.0%) | 0 (0.0%) |
| 18 to 34 Years | 0 (0.0%) | 0 (0.0%) |
| 35 to 64 Years | 0 (0.0%) | 16 (24.6%) |
| 65 to 74 Years | 0 (0.0%) | 0 (0.0%) |
| 75 Years and over | 0 (0.0%) | 0 (0.0%) |
Disability Class: Ambulatory Difficulty
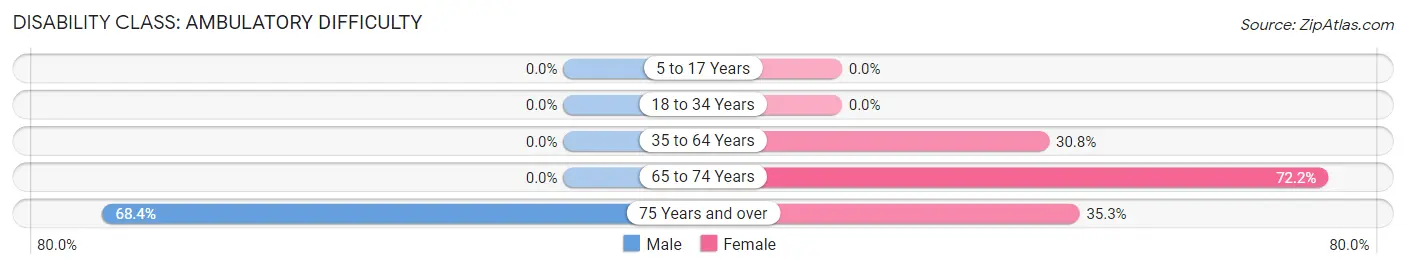
| Age Bracket | Male | Female |
| 5 to 17 Years | 0 (0.0%) | 0 (0.0%) |
| 18 to 34 Years | 0 (0.0%) | 0 (0.0%) |
| 35 to 64 Years | 0 (0.0%) | 20 (30.8%) |
| 65 to 74 Years | 0 (0.0%) | 26 (72.2%) |
| 75 Years and over | 13 (68.4%) | 6 (35.3%) |
Disability Class: Self-Care Difficulty
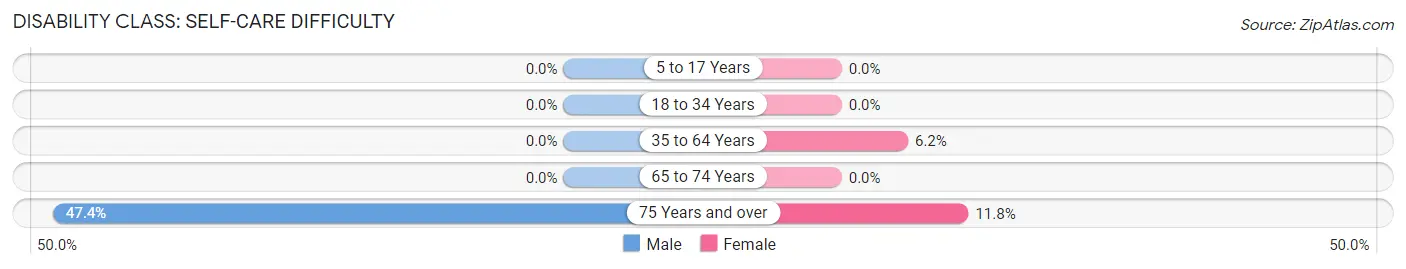
| Age Bracket | Male | Female |
| 5 to 17 Years | 0 (0.0%) | 0 (0.0%) |
| 18 to 34 Years | 0 (0.0%) | 0 (0.0%) |
| 35 to 64 Years | 0 (0.0%) | 4 (6.1%) |
| 65 to 74 Years | 0 (0.0%) | 0 (0.0%) |
| 75 Years and over | 9 (47.4%) | 2 (11.8%) |
Technology Access in Sutcliffe
Computing Device Access in Sutcliffe
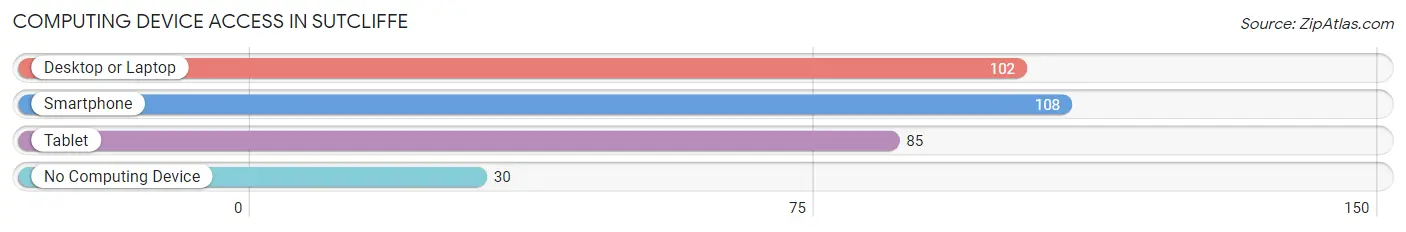
| Device Type | # Households | % Households |
| Desktop or Laptop | 102 | 69.4% |
| Smartphone | 108 | 73.5% |
| Tablet | 85 | 57.8% |
| No Computing Device | 30 | 20.4% |
| Total | 147 | 100.0% |
Internet Access in Sutcliffe
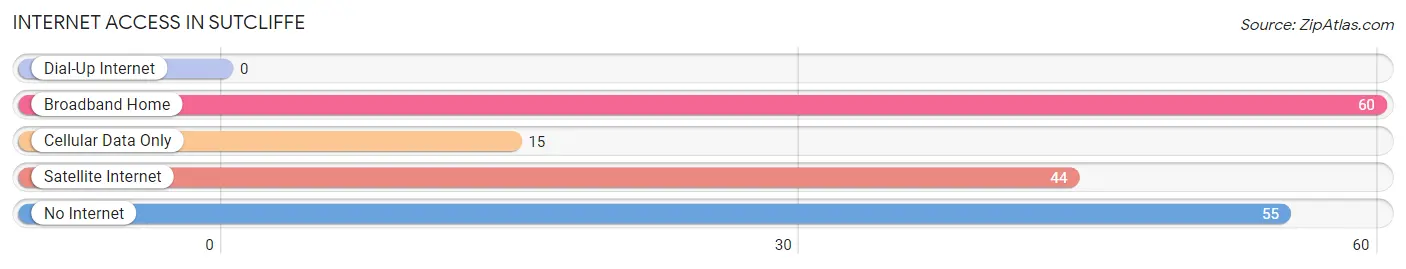
| Internet Type | # Households | % Households |
| Dial-Up Internet | 0 | 0.0% |
| Broadband Home | 60 | 40.8% |
| Cellular Data Only | 15 | 10.2% |
| Satellite Internet | 44 | 29.9% |
| No Internet | 55 | 37.4% |
| Total | 147 | 100.0% |
Sutcliffe Summary
Sutcliffe is an unincorporated town located in Washoe County, Nevada, United States. It is situated on the eastern shore of Pyramid Lake, approximately 30 miles northeast of Reno. The town was founded in 1883 and is named after the Sutcliffe family, who were among the first settlers in the area.
History
The area around Sutcliffe was originally inhabited by the Northern Paiute people, who had lived in the region for centuries prior to the arrival of European settlers. The first Europeans to settle in the area were the Sutcliffe family, who arrived in 1883. The family established a ranch and began to raise cattle and sheep. The town of Sutcliffe was officially founded in 1887, and the first post office was established in 1888.
In the early 1900s, Sutcliffe became a popular destination for tourists, who came to enjoy the area’s natural beauty and recreational activities. The town was also home to a number of businesses, including a hotel, a general store, and a saloon.
Geography
Sutcliffe is located in the western part of Washoe County, Nevada, approximately 30 miles northeast of Reno. The town is situated on the eastern shore of Pyramid Lake, a large, shallow lake that is fed by the Truckee River. The lake is home to a variety of fish, including the Lahontan cutthroat trout, which is the state fish of Nevada.
The town of Sutcliffe is surrounded by the Pyramid Lake Indian Reservation, which is home to the Pyramid Lake Paiute Tribe. The reservation covers an area of approximately 450,000 acres and is located in both Washoe and Lyon counties.
Economy
The economy of Sutcliffe is largely based on tourism and recreation. The town is a popular destination for fishing, boating, and camping, and is home to a number of resorts and campgrounds. The town is also home to a number of businesses, including a general store, a gas station, and a restaurant.
Demographics
As of the 2010 census, the population of Sutcliffe was 545. The town has a total area of 0.6 square miles, all of which is land. The racial makeup of the town was 94.2% White, 0.2% African American, 0.7% Native American, 0.2% Asian, 0.2% Pacific Islander, and 4.7% from other races.
Conclusion
Sutcliffe is a small town located in Washoe County, Nevada, United States. It is situated on the eastern shore of Pyramid Lake, approximately 30 miles northeast of Reno. The town was founded in 1883 and is named after the Sutcliffe family, who were among the first settlers in the area. The economy of Sutcliffe is largely based on tourism and recreation, and the town is a popular destination for fishing, boating, and camping. As of the 2010 census, the population of Sutcliffe was 545.
Common Questions
What is Per Capita Income in Sutcliffe?
Per Capita income in Sutcliffe is $25,158.
What is the Median Family Income in Sutcliffe?
Median Family Income in Sutcliffe is $36,250.
What is the Median Household income in Sutcliffe?
Median Household Income in Sutcliffe is $28,967.
What is Inequality or Gini Index in Sutcliffe?
Inequality or Gini Index in Sutcliffe is 0.47.
What is the Total Population of Sutcliffe?
Total Population of Sutcliffe is 291.
What is the Total Male Population of Sutcliffe?
Total Male Population of Sutcliffe is 119.
What is the Total Female Population of Sutcliffe?
Total Female Population of Sutcliffe is 172.
What is the Ratio of Males per 100 Females in Sutcliffe?
There are 69.19 Males per 100 Females in Sutcliffe.
What is the Ratio of Females per 100 Males in Sutcliffe?
There are 144.54 Females per 100 Males in Sutcliffe.
What is the Median Population Age in Sutcliffe?
Median Population Age in Sutcliffe is 55.2 Years.
What is the Average Family Size in Sutcliffe
Average Family Size in Sutcliffe is 2.6 People.
What is the Average Household Size in Sutcliffe
Average Household Size in Sutcliffe is 2.0 People.
How Large is the Labor Force in Sutcliffe?
There are 124 People in the Labor Forcein in Sutcliffe.
What is the Percentage of People in the Labor Force in Sutcliffe?
49.8% of People are in the Labor Force in Sutcliffe.
What is the Unemployment Rate in Sutcliffe?
Unemployment Rate in Sutcliffe is 6.3%.