Lovelock, NV Map & Demographics
Lovelock Map
Lovelock Overview
$25,484
PER CAPITA INCOME
$59,167
AVG FAMILY INCOME
$42,955
AVG HOUSEHOLD INCOME
46.5%
WAGE / INCOME GAP [ % ]
53.5¢/ $1
WAGE / INCOME GAP [ $ ]
0.47
INEQUALITY / GINI INDEX
1,675
TOTAL POPULATION
828
MALE POPULATION
847
FEMALE POPULATION
97.76
MALES / 100 FEMALES
102.29
FEMALES / 100 MALES
39.4
MEDIAN AGE
3.2
AVG FAMILY SIZE
2.3
AVG HOUSEHOLD SIZE
680
LABOR FORCE [ PEOPLE ]
52.3%
PERCENT IN LABOR FORCE
14.2%
UNEMPLOYMENT RATE
Lovelock Zip Codes
Lovelock Area Codes
Income in Lovelock
Income Overview in Lovelock
Per Capita Income in Lovelock is $25,484, while median incomes of families and households are $59,167 and $42,955 respectively.
| Characteristic | Number | Measure |
| Per Capita Income | 1,675 | $25,484 |
| Median Family Income | 382 | $59,167 |
| Mean Family Income | 382 | $83,043 |
| Median Household Income | 674 | $42,955 |
| Mean Household Income | 674 | $62,684 |
| Income Deficit | 382 | $0 |
| Wage / Income Gap (%) | 1,675 | 46.47% |
| Wage / Income Gap ($) | 1,675 | 53.53¢ per $1 |
| Gini / Inequality Index | 1,675 | 0.47 |
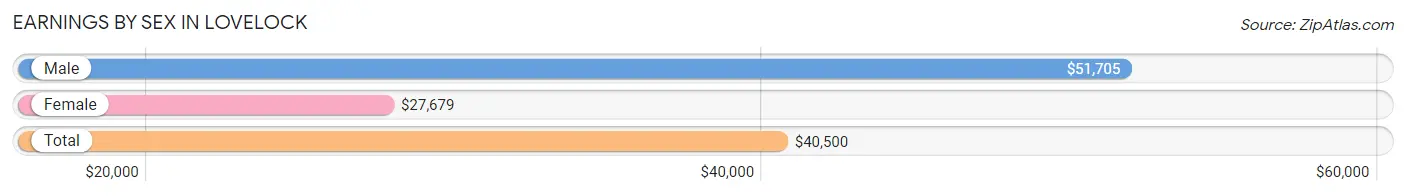
Earnings by Sex in Lovelock
Average Earnings in Lovelock are $40,500, $51,705 for men and $27,679 for women, a difference of 46.5%.
| Sex | Number | Average Earnings |
| Male | 361 (50.4%) | $51,705 |
| Female | 355 (49.6%) | $27,679 |
| Total | 716 (100.0%) | $40,500 |
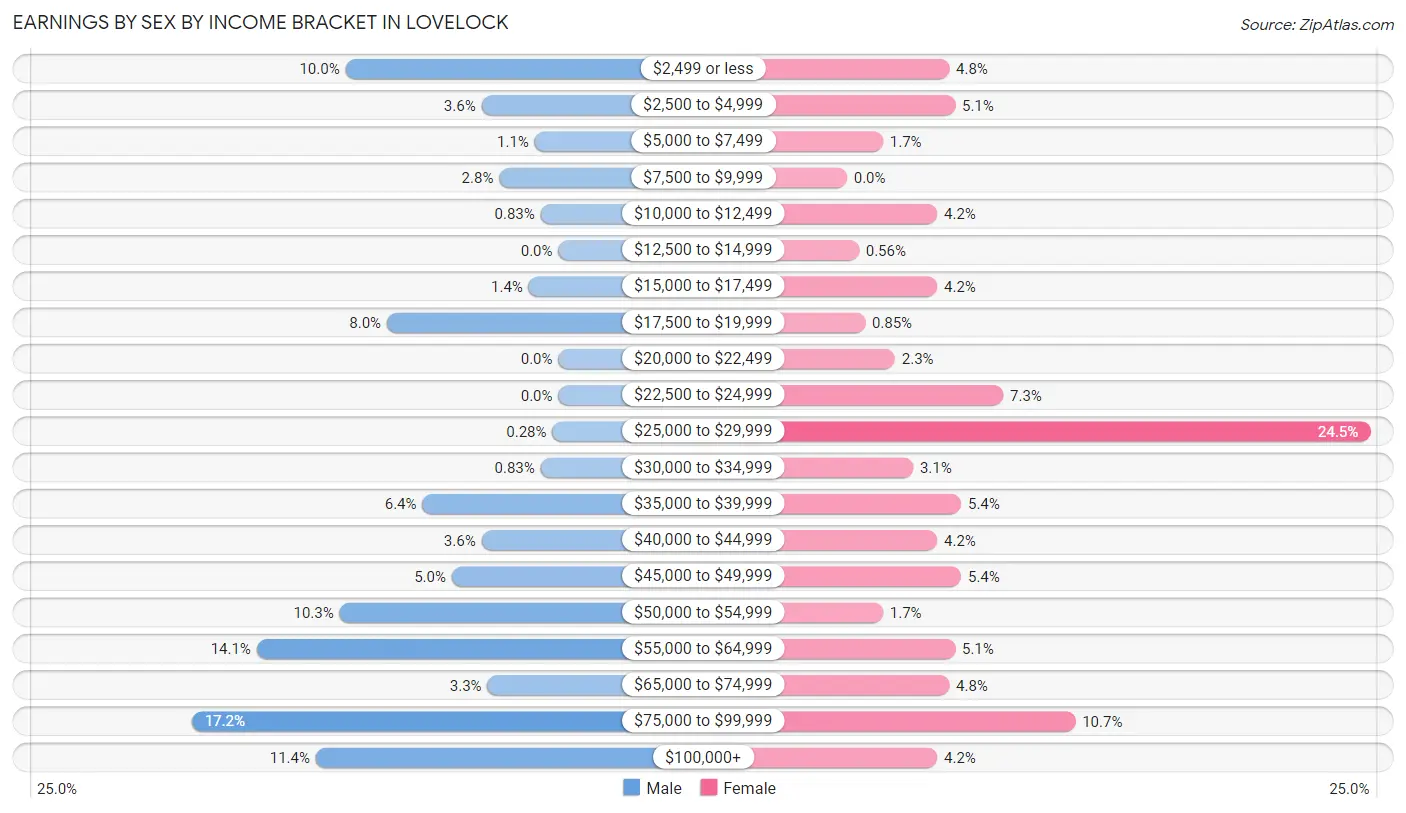
Earnings by Sex by Income Bracket in Lovelock
The most common earnings brackets in Lovelock are $75,000 to $99,999 for men (62 | 17.2%) and $25,000 to $29,999 for women (87 | 24.5%).
| Income | Male | Female |
| $2,499 or less | 36 (10.0%) | 17 (4.8%) |
| $2,500 to $4,999 | 13 (3.6%) | 18 (5.1%) |
| $5,000 to $7,499 | 4 (1.1%) | 6 (1.7%) |
| $7,500 to $9,999 | 10 (2.8%) | 0 (0.0%) |
| $10,000 to $12,499 | 3 (0.8%) | 15 (4.2%) |
| $12,500 to $14,999 | 0 (0.0%) | 2 (0.6%) |
| $15,000 to $17,499 | 5 (1.4%) | 15 (4.2%) |
| $17,500 to $19,999 | 29 (8.0%) | 3 (0.9%) |
| $20,000 to $22,499 | 0 (0.0%) | 8 (2.2%) |
| $22,500 to $24,999 | 0 (0.0%) | 26 (7.3%) |
| $25,000 to $29,999 | 1 (0.3%) | 87 (24.5%) |
| $30,000 to $34,999 | 3 (0.8%) | 11 (3.1%) |
| $35,000 to $39,999 | 23 (6.4%) | 19 (5.3%) |
| $40,000 to $44,999 | 13 (3.6%) | 15 (4.2%) |
| $45,000 to $49,999 | 18 (5.0%) | 19 (5.3%) |
| $50,000 to $54,999 | 37 (10.2%) | 6 (1.7%) |
| $55,000 to $64,999 | 51 (14.1%) | 18 (5.1%) |
| $65,000 to $74,999 | 12 (3.3%) | 17 (4.8%) |
| $75,000 to $99,999 | 62 (17.2%) | 38 (10.7%) |
| $100,000+ | 41 (11.4%) | 15 (4.2%) |
| Total | 361 (100.0%) | 355 (100.0%) |
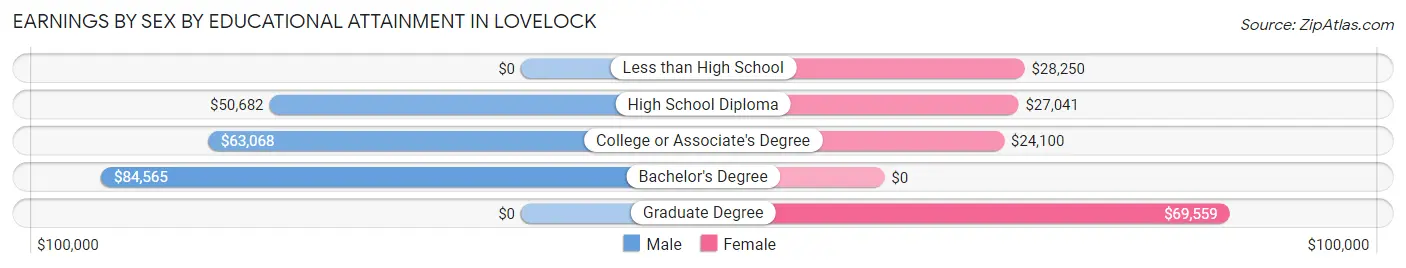
Earnings by Sex by Educational Attainment in Lovelock
Average earnings in Lovelock are $58,250 for men and $29,226 for women, a difference of 49.8%. Men with an educational attainment of bachelor's degree enjoy the highest average annual earnings of $84,565, while those with high school diploma education earn the least with $50,682. Women with an educational attainment of graduate degree earn the most with the average annual earnings of $69,559, while those with college or associate's degree education have the smallest earnings of $24,100.
| Educational Attainment | Male Income | Female Income |
| Less than High School | - | - |
| High School Diploma | $50,682 | $27,041 |
| College or Associate's Degree | $63,068 | $24,100 |
| Bachelor's Degree | $84,565 | $0 |
| Graduate Degree | - | - |
| Total | $58,250 | $29,226 |
Family Income in Lovelock
Family Income Brackets in Lovelock
According to the Lovelock family income data, there are 55 families falling into the $35,000 to $49,999 income range, which is the most common income bracket and makes up 14.4% of all families.
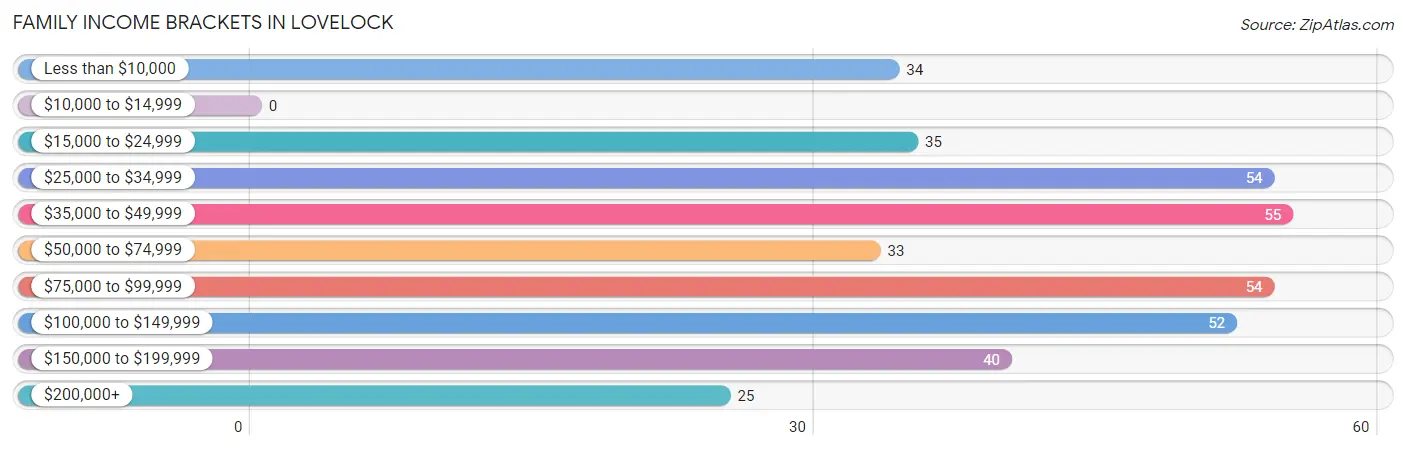
| Income Bracket | # Families | % Families |
| Less than $10,000 | 34 | 8.9% |
| $10,000 to $14,999 | 0 | 0.0% |
| $15,000 to $24,999 | 35 | 9.2% |
| $25,000 to $34,999 | 54 | 14.1% |
| $35,000 to $49,999 | 55 | 14.4% |
| $50,000 to $74,999 | 33 | 8.6% |
| $75,000 to $99,999 | 54 | 14.1% |
| $100,000 to $149,999 | 52 | 13.6% |
| $150,000 to $199,999 | 40 | 10.5% |
| $200,000+ | 25 | 6.5% |
Family Income by Famaliy Size in Lovelock
6-person families (28 | 7.3%) account for the highest median family income in Lovelock with $153,235 per family, while 6-person families (28 | 7.3%) have the highest median income of $25,539 per family member.
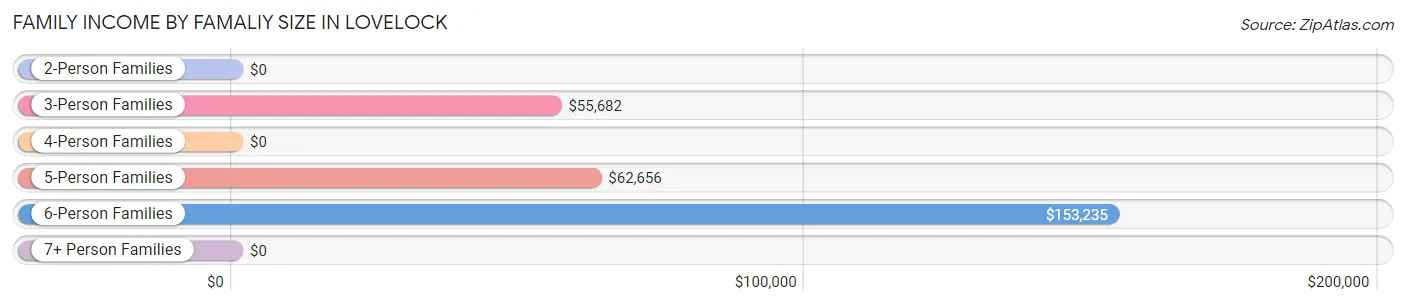
| Income Bracket | # Families | Median Income |
| 2-Person Families | 161 (42.1%) | $0 |
| 3-Person Families | 138 (36.1%) | $55,682 |
| 4-Person Families | 23 (6.0%) | $0 |
| 5-Person Families | 27 (7.1%) | $62,656 |
| 6-Person Families | 28 (7.3%) | $153,235 |
| 7+ Person Families | 5 (1.3%) | $0 |
| Total | 382 (100.0%) | $59,167 |
Family Income by Number of Earners in Lovelock
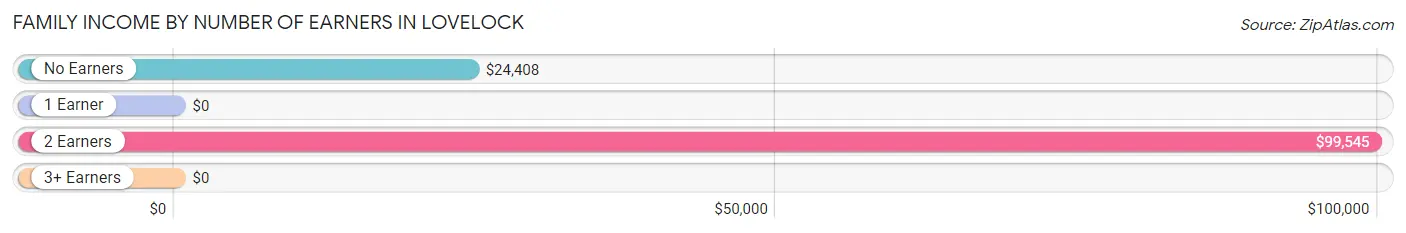
| Number of Earners | # Families | Median Income |
| No Earners | 91 (23.8%) | $24,408 |
| 1 Earner | 147 (38.5%) | $0 |
| 2 Earners | 112 (29.3%) | $99,545 |
| 3+ Earners | 32 (8.4%) | $0 |
| Total | 382 (100.0%) | $59,167 |
Household Income in Lovelock
Household Income Brackets in Lovelock
With 114 households falling in the category, the $25,000 to $34,999 income range is the most frequent in Lovelock, accounting for 16.9% of all households. In contrast, only 25 households (3.7%) fall into the $200,000+ income bracket, making it the least populous group.
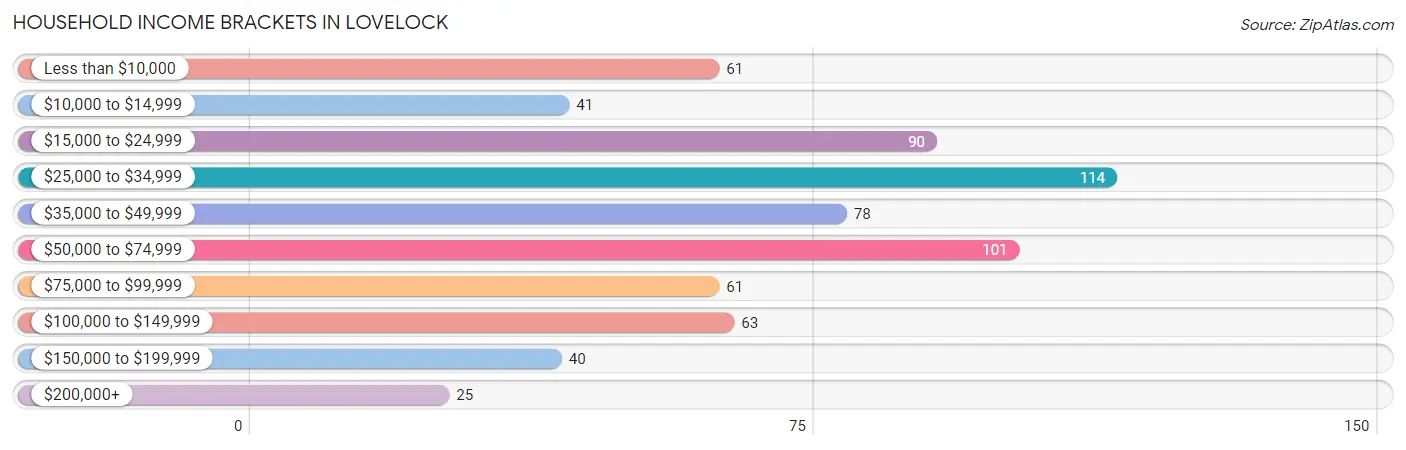
| Income Bracket | # Households | % Households |
| Less than $10,000 | 61 | 9.1% |
| $10,000 to $14,999 | 41 | 6.1% |
| $15,000 to $24,999 | 90 | 13.4% |
| $25,000 to $34,999 | 114 | 16.9% |
| $35,000 to $49,999 | 78 | 11.6% |
| $50,000 to $74,999 | 101 | 15.0% |
| $75,000 to $99,999 | 61 | 9.1% |
| $100,000 to $149,999 | 63 | 9.3% |
| $150,000 to $199,999 | 40 | 5.9% |
| $200,000+ | 25 | 3.7% |
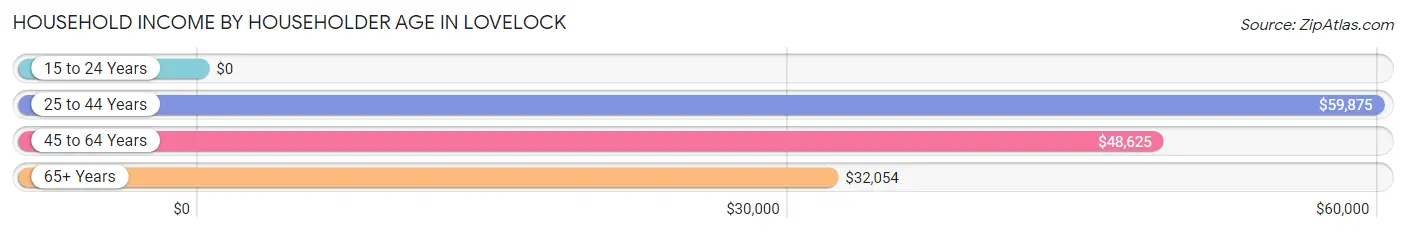
Household Income by Householder Age in Lovelock
The median household income in Lovelock is $42,955, with the highest median household income of $59,875 found in the 25 to 44 years age bracket for the primary householder. A total of 225 households (33.4%) fall into this category. Meanwhile, the 15 to 24 years age bracket for the primary householder has the lowest median household income of $0, with 7 households (1.0%) in this group.
| Income Bracket | # Households | Median Income |
| 15 to 24 Years | 7 (1.0%) | $0 |
| 25 to 44 Years | 225 (33.4%) | $59,875 |
| 45 to 64 Years | 269 (39.9%) | $48,625 |
| 65+ Years | 173 (25.7%) | $32,054 |
| Total | 674 (100.0%) | $42,955 |
Poverty in Lovelock
Income Below Poverty by Sex and Age in Lovelock
With 17.8% poverty level for males and 21.6% for females among the residents of Lovelock, 6 to 11 year old males and 16 and 17 year old females are the most vulnerable to poverty, with 31 males (47.0%) and 4 females (50.0%) in their respective age groups living below the poverty level.
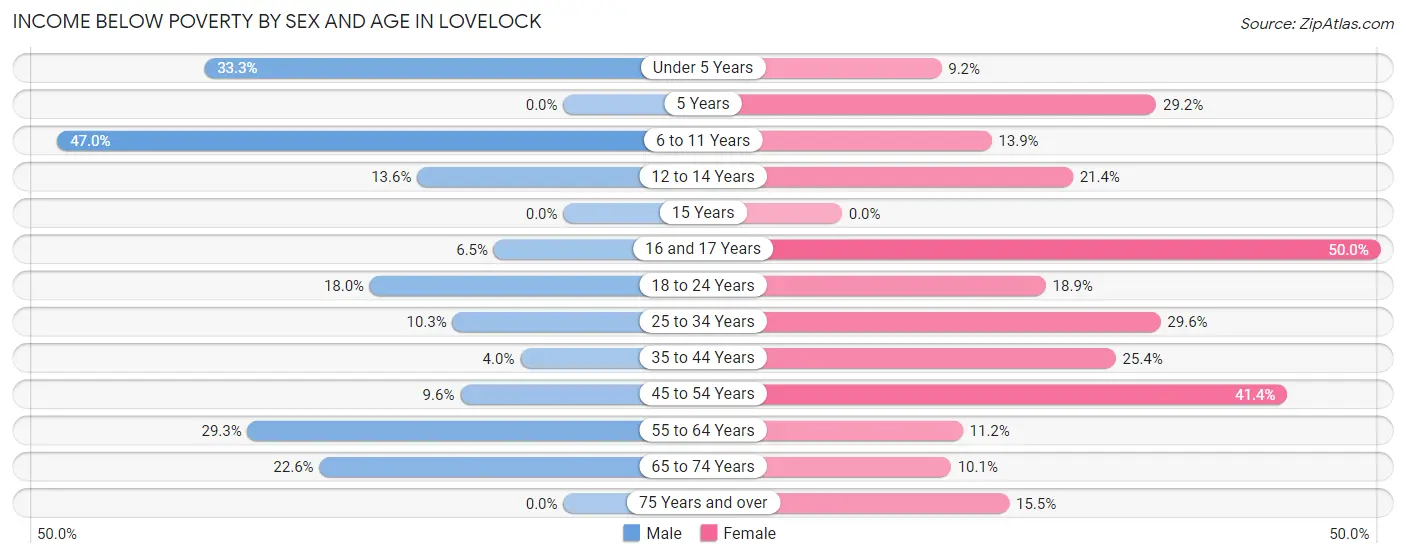
| Age Bracket | Male | Female |
| Under 5 Years | 15 (33.3%) | 6 (9.2%) |
| 5 Years | 0 (0.0%) | 7 (29.2%) |
| 6 to 11 Years | 31 (47.0%) | 5 (13.9%) |
| 12 to 14 Years | 8 (13.6%) | 12 (21.4%) |
| 15 Years | 0 (0.0%) | 0 (0.0%) |
| 16 and 17 Years | 2 (6.5%) | 4 (50.0%) |
| 18 to 24 Years | 7 (17.9%) | 7 (18.9%) |
| 25 to 34 Years | 11 (10.3%) | 34 (29.6%) |
| 35 to 44 Years | 3 (4.0%) | 31 (25.4%) |
| 45 to 54 Years | 9 (9.6%) | 43 (41.3%) |
| 55 to 64 Years | 34 (29.3%) | 12 (11.2%) |
| 65 to 74 Years | 12 (22.6%) | 9 (10.1%) |
| 75 Years and over | 0 (0.0%) | 9 (15.5%) |
| Total | 132 (17.8%) | 179 (21.6%) |
Income Above Poverty by Sex and Age in Lovelock
According to the poverty statistics in Lovelock, males aged 5 years and females aged 15 years are the age groups that are most secure financially, with 100.0% of males and 100.0% of females in these age groups living above the poverty line.
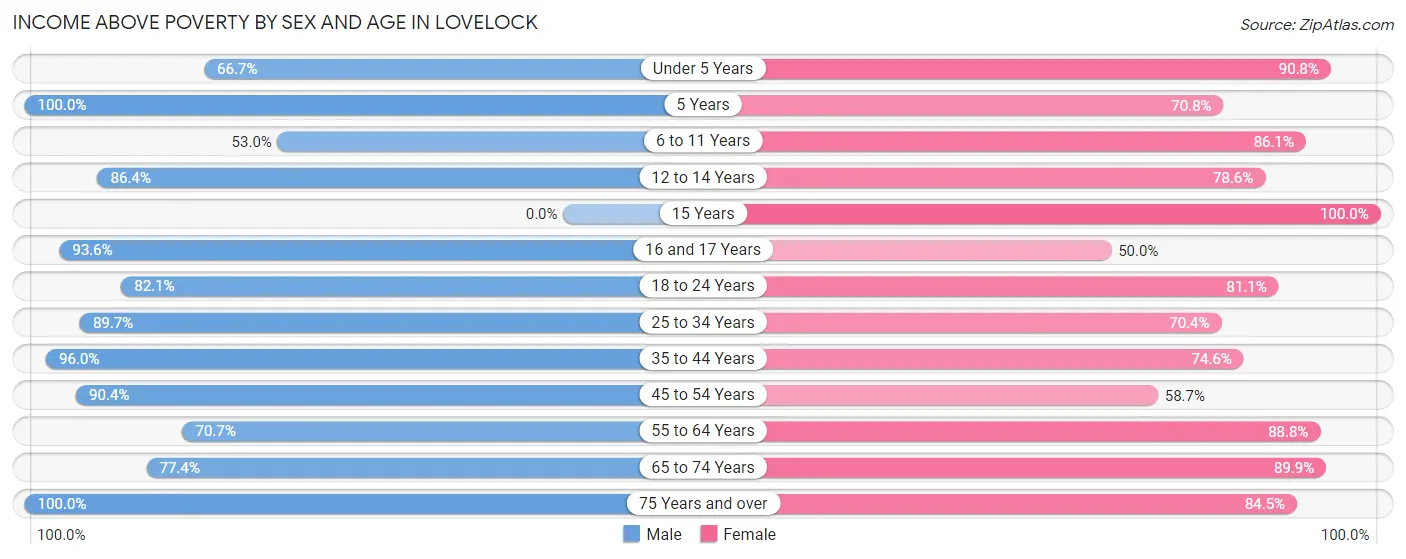
| Age Bracket | Male | Female |
| Under 5 Years | 30 (66.7%) | 59 (90.8%) |
| 5 Years | 15 (100.0%) | 17 (70.8%) |
| 6 to 11 Years | 35 (53.0%) | 31 (86.1%) |
| 12 to 14 Years | 51 (86.4%) | 44 (78.6%) |
| 15 Years | 0 (0.0%) | 8 (100.0%) |
| 16 and 17 Years | 29 (93.5%) | 4 (50.0%) |
| 18 to 24 Years | 32 (82.1%) | 30 (81.1%) |
| 25 to 34 Years | 96 (89.7%) | 81 (70.4%) |
| 35 to 44 Years | 72 (96.0%) | 91 (74.6%) |
| 45 to 54 Years | 85 (90.4%) | 61 (58.7%) |
| 55 to 64 Years | 82 (70.7%) | 95 (88.8%) |
| 65 to 74 Years | 41 (77.4%) | 80 (89.9%) |
| 75 Years and over | 42 (100.0%) | 49 (84.5%) |
| Total | 610 (82.2%) | 650 (78.4%) |
Income Below Poverty Among Married-Couple Families in Lovelock
The poverty statistics for married-couple families in Lovelock show that 5.0% or 13 of the total 259 families live below the poverty line. Families with 1 or 2 children have the highest poverty rate of 12.1%, comprising of 7 families. On the other hand, families with no children have the lowest poverty rate of 0.6%, which includes 1 families.
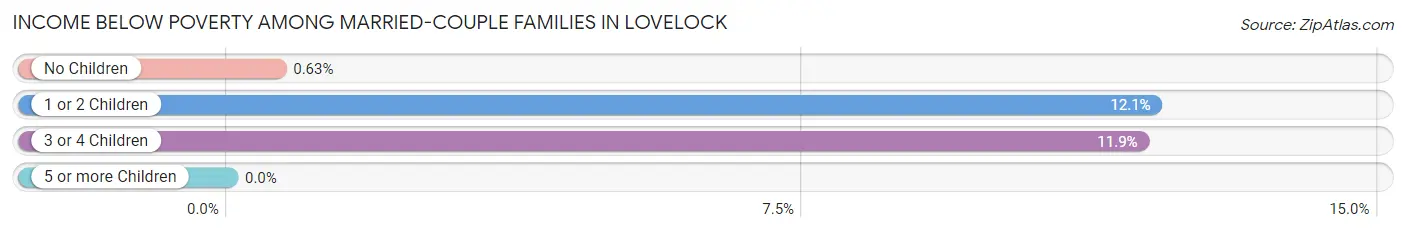
| Children | Above Poverty | Below Poverty |
| No Children | 158 (99.4%) | 1 (0.6%) |
| 1 or 2 Children | 51 (87.9%) | 7 (12.1%) |
| 3 or 4 Children | 37 (88.1%) | 5 (11.9%) |
| 5 or more Children | 0 (0.0%) | 0 (0.0%) |
| Total | 246 (95.0%) | 13 (5.0%) |
Income Below Poverty Among Single-Parent Households in Lovelock
According to the poverty data in Lovelock, 40.0% or 6 single-father households and 28.7% or 31 single-mother households are living below the poverty line. Among single-father households, those with 1 or 2 children have the highest poverty rate, with 6 households (40.0%) experiencing poverty. Likewise, among single-mother households, those with no children have the highest poverty rate, with 13 households (68.4%) falling below the poverty line.
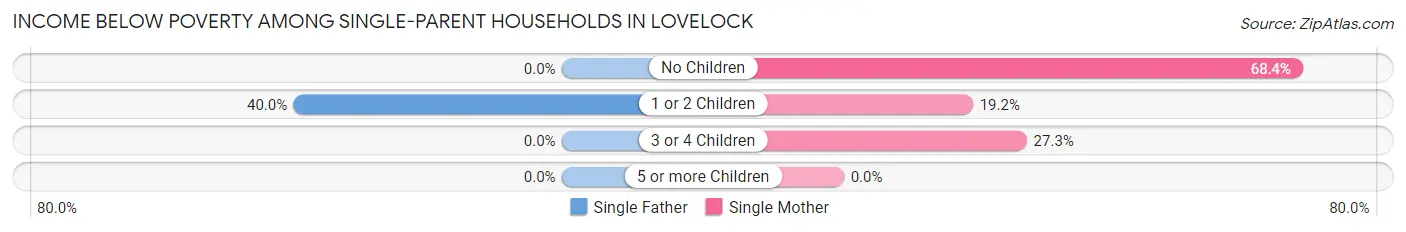
| Children | Single Father | Single Mother |
| No Children | 0 (0.0%) | 13 (68.4%) |
| 1 or 2 Children | 6 (40.0%) | 15 (19.2%) |
| 3 or 4 Children | 0 (0.0%) | 3 (27.3%) |
| 5 or more Children | 0 (0.0%) | 0 (0.0%) |
| Total | 6 (40.0%) | 31 (28.7%) |
Income Below Poverty Among Married-Couple vs Single-Parent Households in Lovelock
The poverty data for Lovelock shows that 13 of the married-couple family households (5.0%) and 37 of the single-parent households (30.1%) are living below the poverty level. Within the married-couple family households, those with 1 or 2 children have the highest poverty rate, with 7 households (12.1%) falling below the poverty line. Among the single-parent households, those with no children have the highest poverty rate, with 13 household (68.4%) living below poverty.
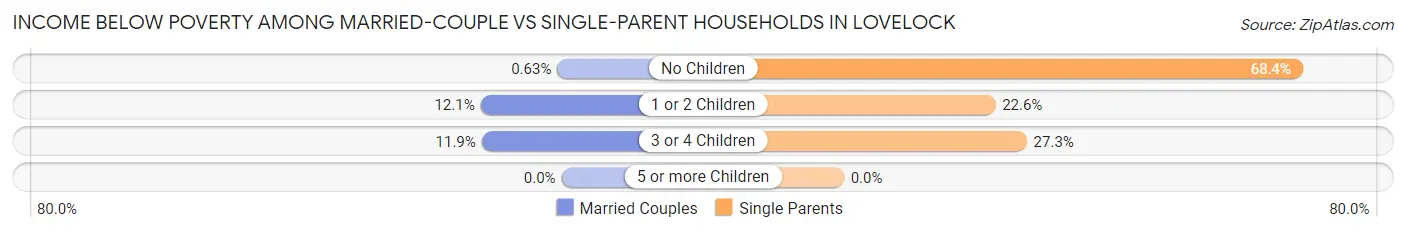
| Children | Married-Couple Families | Single-Parent Households |
| No Children | 1 (0.6%) | 13 (68.4%) |
| 1 or 2 Children | 7 (12.1%) | 21 (22.6%) |
| 3 or 4 Children | 5 (11.9%) | 3 (27.3%) |
| 5 or more Children | 0 (0.0%) | 0 (0.0%) |
| Total | 13 (5.0%) | 37 (30.1%) |
Race in Lovelock
The most populous races in Lovelock are White / Caucasian (1,102 | 65.8%), Hispanic or Latino (516 | 30.8%), and Some other Race (201 | 12.0%).
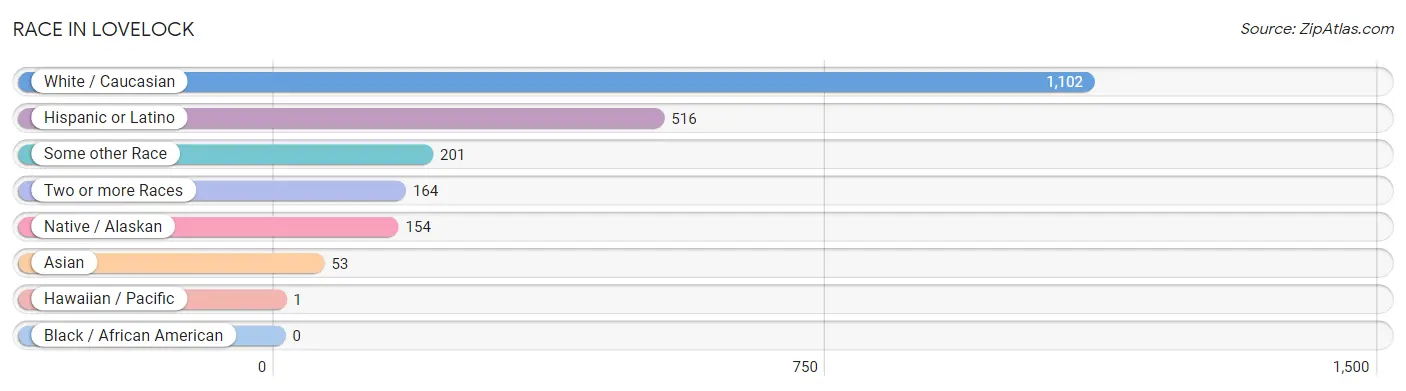
| Race | # Population | % Population |
| Asian | 53 | 3.2% |
| Black / African American | 0 | 0.0% |
| Hawaiian / Pacific | 1 | 0.1% |
| Hispanic or Latino | 516 | 30.8% |
| Native / Alaskan | 154 | 9.2% |
| White / Caucasian | 1,102 | 65.8% |
| Two or more Races | 164 | 9.8% |
| Some other Race | 201 | 12.0% |
| Total | 1,675 | 100.0% |
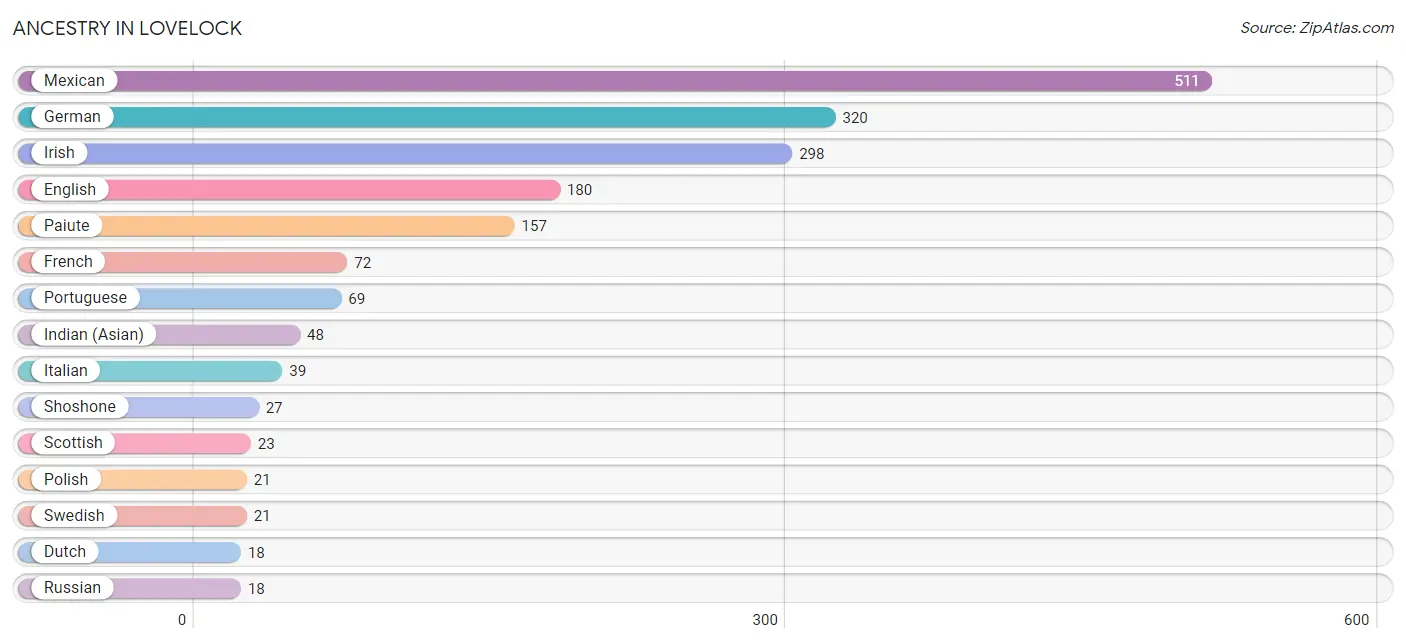
Ancestry in Lovelock
The most populous ancestries reported in Lovelock are Mexican (511 | 30.5%), German (320 | 19.1%), Irish (298 | 17.8%), English (180 | 10.7%), and Paiute (157 | 9.4%), together accounting for 87.5% of all Lovelock residents.
| Ancestry | # Population | % Population |
| American | 7 | 0.4% |
| Arab | 8 | 0.5% |
| British | 3 | 0.2% |
| Central American | 3 | 0.2% |
| Cherokee | 10 | 0.6% |
| Dutch | 18 | 1.1% |
| Eastern European | 8 | 0.5% |
| English | 180 | 10.7% |
| European | 12 | 0.7% |
| Finnish | 15 | 0.9% |
| French | 72 | 4.3% |
| German | 320 | 19.1% |
| Indian (Asian) | 48 | 2.9% |
| Irish | 298 | 17.8% |
| Italian | 39 | 2.3% |
| Korean | 16 | 1.0% |
| Lebanese | 8 | 0.5% |
| Mexican | 511 | 30.5% |
| Navajo | 2 | 0.1% |
| Paiute | 157 | 9.4% |
| Polish | 21 | 1.3% |
| Portuguese | 69 | 4.1% |
| Puget Sound Salish | 13 | 0.8% |
| Russian | 18 | 1.1% |
| Salvadoran | 3 | 0.2% |
| Samoan | 1 | 0.1% |
| Scandinavian | 10 | 0.6% |
| Scotch-Irish | 2 | 0.1% |
| Scottish | 23 | 1.4% |
| Shoshone | 27 | 1.6% |
| Spaniard | 2 | 0.1% |
| Swedish | 21 | 1.3% |
| Ukrainian | 18 | 1.1% |
| Welsh | 10 | 0.6% | View All 34 Rows |
Immigrants in Lovelock
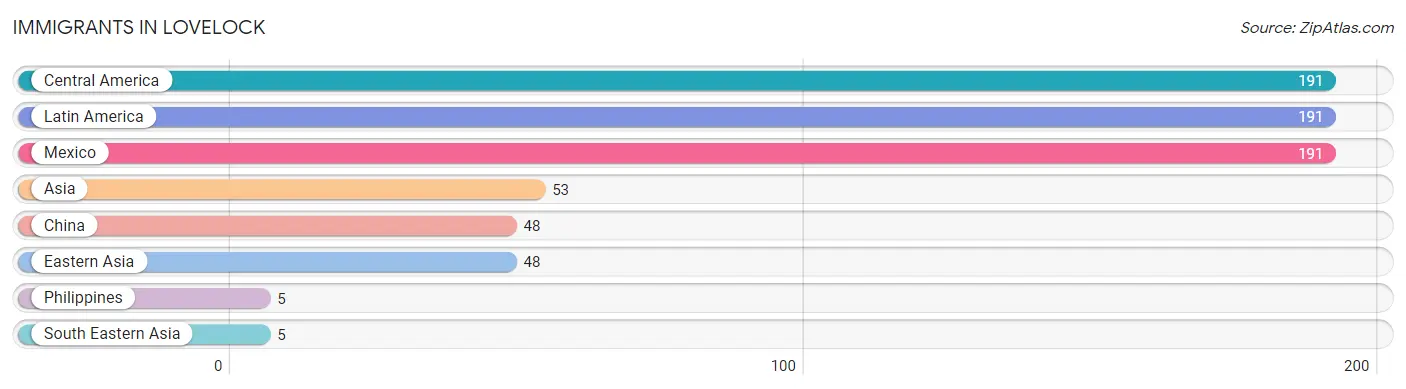
The most numerous immigrant groups reported in Lovelock came from Central America (191 | 11.4%), Latin America (191 | 11.4%), Mexico (191 | 11.4%), Asia (53 | 3.2%), and China (48 | 2.9%), together accounting for 40.2% of all Lovelock residents.
| Immigration Origin | # Population | % Population |
| Asia | 53 | 3.2% |
| Central America | 191 | 11.4% |
| China | 48 | 2.9% |
| Eastern Asia | 48 | 2.9% |
| Latin America | 191 | 11.4% |
| Mexico | 191 | 11.4% |
| Philippines | 5 | 0.3% |
| South Eastern Asia | 5 | 0.3% | View All 8 Rows |
Sex and Age in Lovelock
Sex and Age in Lovelock
The most populous age groups in Lovelock are 60 to 64 Years (104 | 12.6%) for men and 25 to 29 Years (80 | 9.5%) for women.
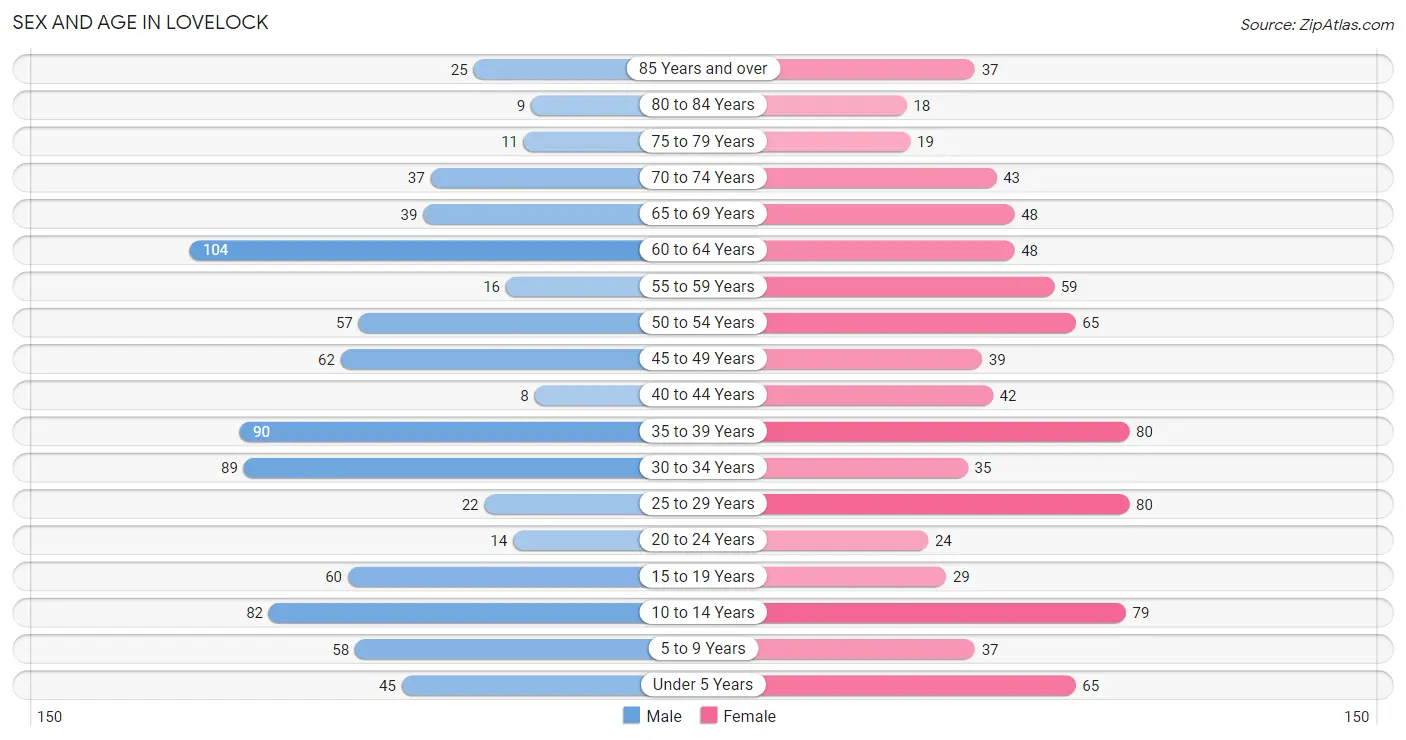
| Age Bracket | Male | Female |
| Under 5 Years | 45 (5.4%) | 65 (7.7%) |
| 5 to 9 Years | 58 (7.0%) | 37 (4.4%) |
| 10 to 14 Years | 82 (9.9%) | 79 (9.3%) |
| 15 to 19 Years | 60 (7.2%) | 29 (3.4%) |
| 20 to 24 Years | 14 (1.7%) | 24 (2.8%) |
| 25 to 29 Years | 22 (2.7%) | 80 (9.5%) |
| 30 to 34 Years | 89 (10.7%) | 35 (4.1%) |
| 35 to 39 Years | 90 (10.9%) | 80 (9.5%) |
| 40 to 44 Years | 8 (1.0%) | 42 (5.0%) |
| 45 to 49 Years | 62 (7.5%) | 39 (4.6%) |
| 50 to 54 Years | 57 (6.9%) | 65 (7.7%) |
| 55 to 59 Years | 16 (1.9%) | 59 (7.0%) |
| 60 to 64 Years | 104 (12.6%) | 48 (5.7%) |
| 65 to 69 Years | 39 (4.7%) | 48 (5.7%) |
| 70 to 74 Years | 37 (4.5%) | 43 (5.1%) |
| 75 to 79 Years | 11 (1.3%) | 19 (2.2%) |
| 80 to 84 Years | 9 (1.1%) | 18 (2.1%) |
| 85 Years and over | 25 (3.0%) | 37 (4.4%) |
| Total | 828 (100.0%) | 847 (100.0%) |
Families and Households in Lovelock
Median Family Size in Lovelock
The median family size in Lovelock is 3.23 persons per family, with single male/father families (15 | 3.9%) accounting for the largest median family size of 5.87 persons per family. On the other hand, married-couple families (259 | 67.8%) represent the smallest median family size with 3.12 persons per family.
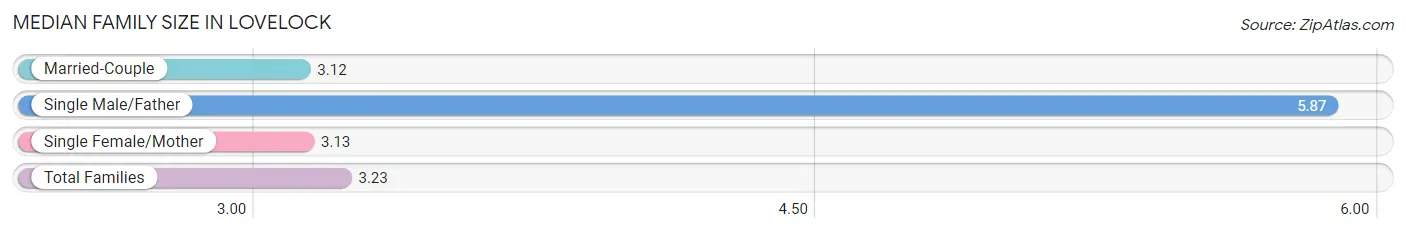
| Family Type | # Families | Family Size |
| Married-Couple | 259 (67.8%) | 3.12 |
| Single Male/Father | 15 (3.9%) | 5.87 |
| Single Female/Mother | 108 (28.3%) | 3.13 |
| Total Families | 382 (100.0%) | 3.23 |
Median Household Size in Lovelock
The median household size in Lovelock is 2.32 persons per household, with single male/father households (15 | 2.2%) accounting for the largest median household size of 7.13 persons per household. non-family households (292 | 43.3%) represent the smallest median household size with 1.07 persons per household.
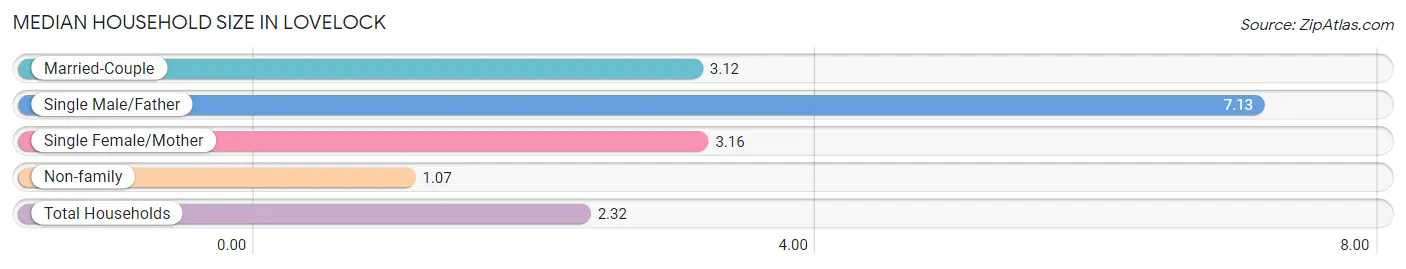
| Household Type | # Households | Household Size |
| Married-Couple | 259 (38.4%) | 3.12 |
| Single Male/Father | 15 (2.2%) | 7.13 |
| Single Female/Mother | 108 (16.0%) | 3.16 |
| Non-family | 292 (43.3%) | 1.07 |
| Total Households | 674 (100.0%) | 2.32 |
Household Size by Marriage Status in Lovelock
Out of a total of 674 households in Lovelock, 382 (56.7%) are family households, while 292 (43.3%) are nonfamily households. The most numerous type of family households are 2-person households, comprising 156, and the most common type of nonfamily households are 1-person households, comprising 274.
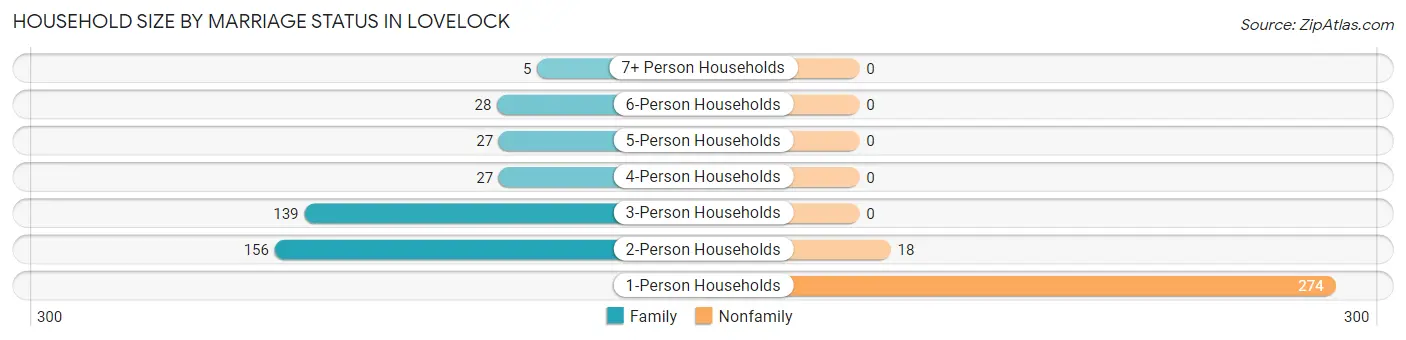
| Household Size | Family Households | Nonfamily Households |
| 1-Person Households | - | 274 (40.6%) |
| 2-Person Households | 156 (23.2%) | 18 (2.7%) |
| 3-Person Households | 139 (20.6%) | 0 (0.0%) |
| 4-Person Households | 27 (4.0%) | 0 (0.0%) |
| 5-Person Households | 27 (4.0%) | 0 (0.0%) |
| 6-Person Households | 28 (4.2%) | 0 (0.0%) |
| 7+ Person Households | 5 (0.7%) | 0 (0.0%) |
| Total | 382 (56.7%) | 292 (43.3%) |
Female Fertility in Lovelock
Fertility by Age in Lovelock
Average fertility rate in Lovelock is 14.0 births per 1,000 women. Women in the age bracket of 35 to 50 years have the highest fertility rate with 28.0 births per 1,000 women. Women in the age bracket of 35 to 50 years acount for 100.0% of all women with births.
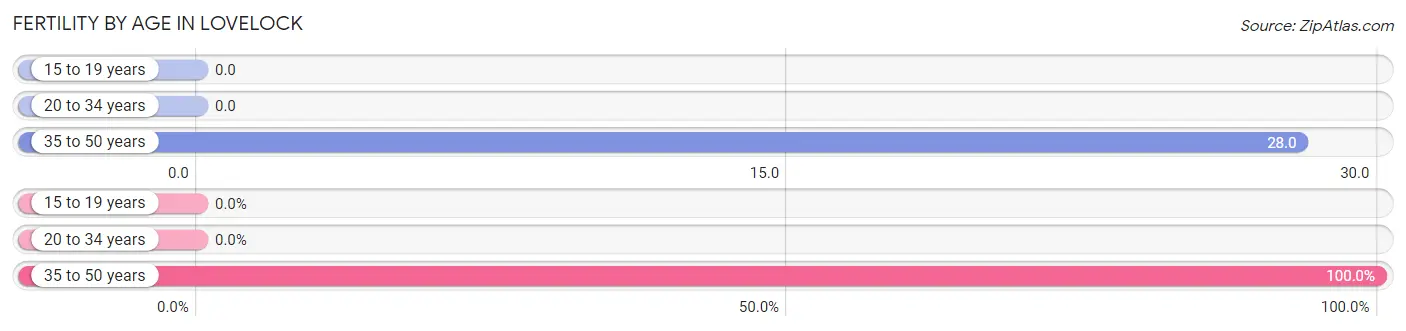
| Age Bracket | Women with Births | Births / 1,000 Women |
| 15 to 19 years | 0 (0.0%) | 0.0 |
| 20 to 34 years | 0 (0.0%) | 0.0 |
| 35 to 50 years | 5 (100.0%) | 28.0 |
| Total | 5 (100.0%) | 14.0 |
Fertility by Age by Marriage Status in Lovelock
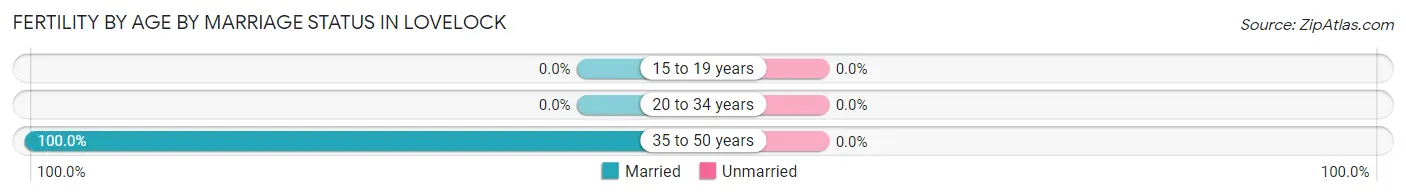
| Age Bracket | Married | Unmarried |
| 15 to 19 years | 0 (0.0%) | 0 (0.0%) |
| 20 to 34 years | 0 (0.0%) | 0 (0.0%) |
| 35 to 50 years | 5 (100.0%) | 0 (0.0%) |
| Total | 5 (100.0%) | 0 (0.0%) |
Fertility by Education in Lovelock
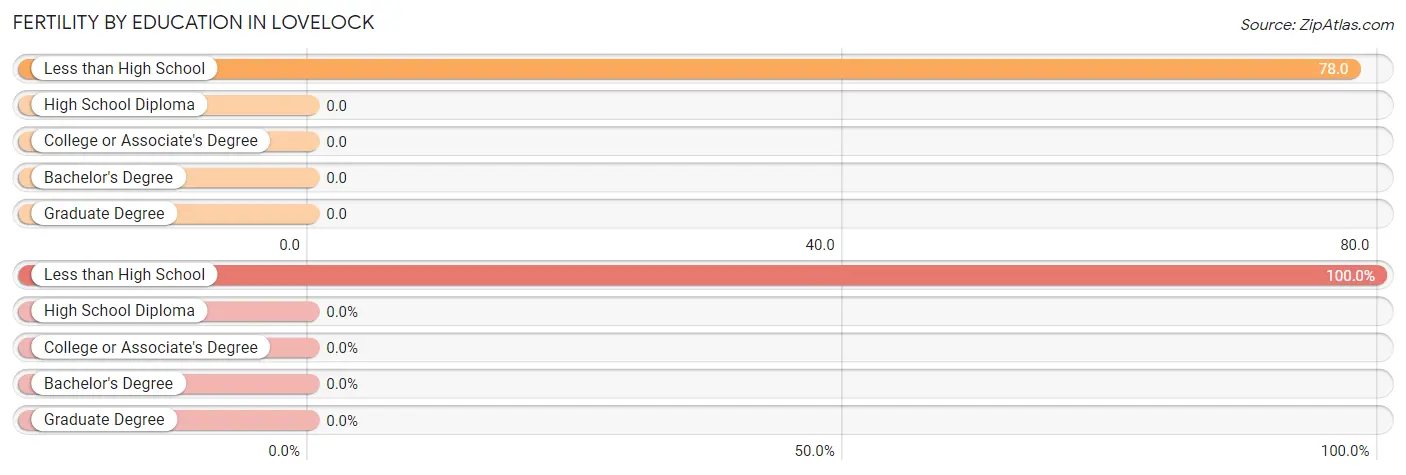
| Educational Attainment | Women with Births | Births / 1,000 Women |
| Less than High School | 5 (100.0%) | 78.0 |
| High School Diploma | 0 (0.0%) | 0.0 |
| College or Associate's Degree | 0 (0.0%) | 0.0 |
| Bachelor's Degree | 0 (0.0%) | 0.0 |
| Graduate Degree | 0 (0.0%) | 0.0 |
| Total | 5 (100.0%) | 14.0 |
Fertility by Education by Marriage Status in Lovelock
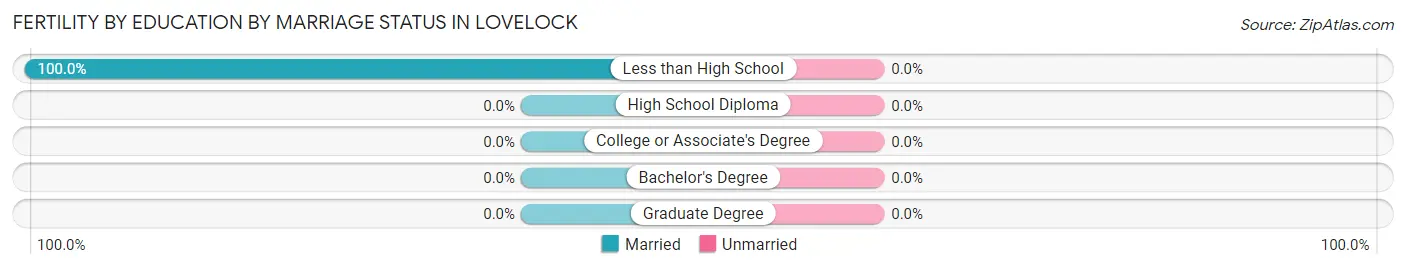
| Educational Attainment | Married | Unmarried |
| Less than High School | 5 (100.0%) | 0 (0.0%) |
| High School Diploma | 0 (0.0%) | 0 (0.0%) |
| College or Associate's Degree | 0 (0.0%) | 0 (0.0%) |
| Bachelor's Degree | 0 (0.0%) | 0 (0.0%) |
| Graduate Degree | 0 (0.0%) | 0 (0.0%) |
| Total | 5 (100.0%) | 0 (0.0%) |
Employment Characteristics in Lovelock
Employment by Class of Employer in Lovelock
Among the 562 employed individuals in Lovelock, private company employees (354 | 63.0%), local government employees (108 | 19.2%), and state government employees (41 | 7.3%) make up the most common classes of employment.
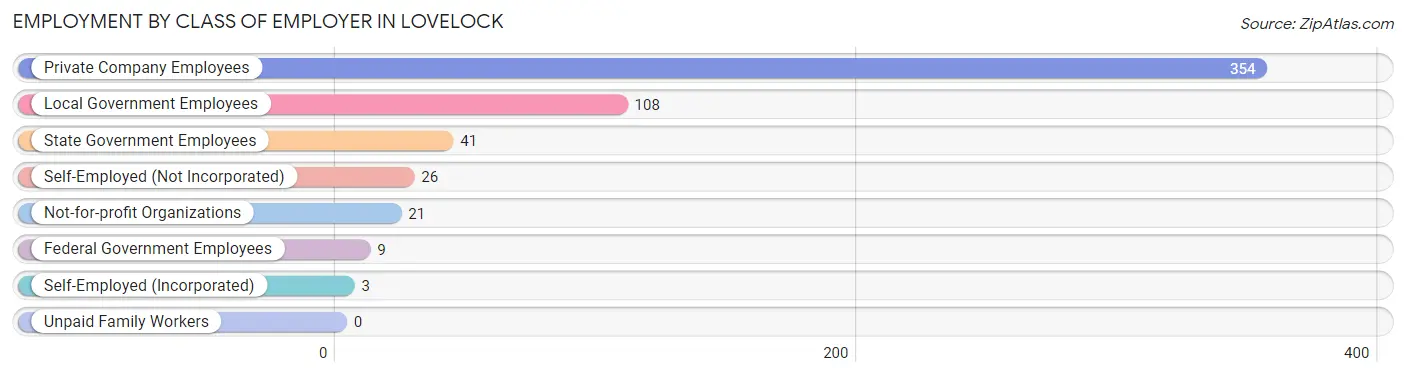
| Employer Class | # Employees | % Employees |
| Private Company Employees | 354 | 63.0% |
| Self-Employed (Incorporated) | 3 | 0.5% |
| Self-Employed (Not Incorporated) | 26 | 4.6% |
| Not-for-profit Organizations | 21 | 3.7% |
| Local Government Employees | 108 | 19.2% |
| State Government Employees | 41 | 7.3% |
| Federal Government Employees | 9 | 1.6% |
| Unpaid Family Workers | 0 | 0.0% |
| Total | 562 | 100.0% |
Employment Status by Age in Lovelock
According to the labor force statistics for Lovelock, out of the total population over 16 years of age (1,301), 52.3% or 680 individuals are in the labor force, with 14.2% or 97 of them unemployed. The age group with the highest labor force participation rate is 20 to 24 years, with 89.5% or 34 individuals in the labor force. Within the labor force, the 16 to 19 years age range has the highest percentage of unemployed individuals, with 50.0% or 23 of them being unemployed.
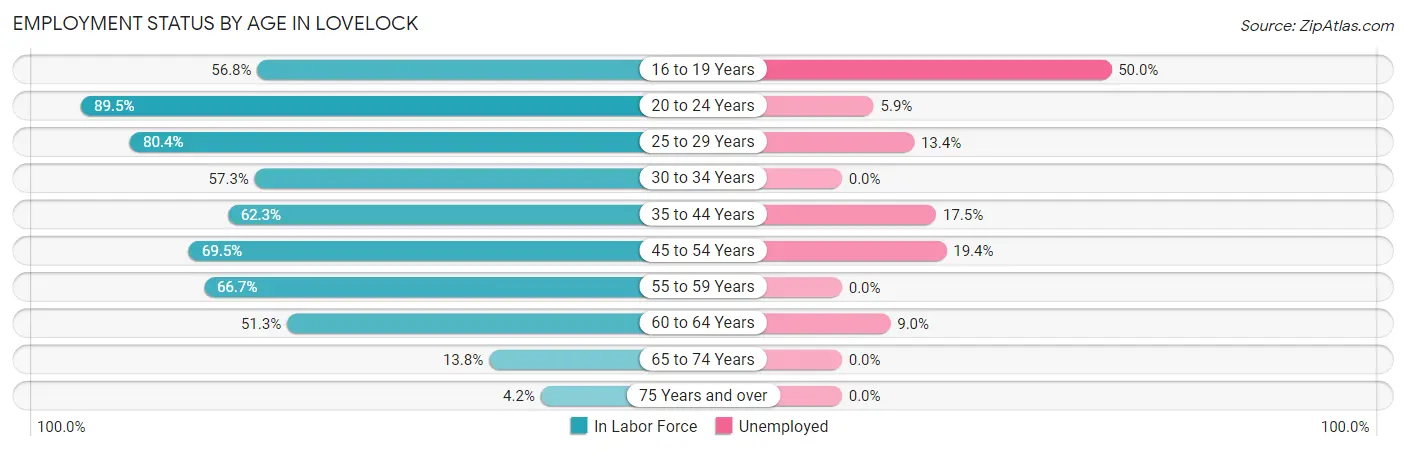
| Age Bracket | In Labor Force | Unemployed |
| 16 to 19 Years | 46 (56.8%) | 23 (50.0%) |
| 20 to 24 Years | 34 (89.5%) | 2 (5.9%) |
| 25 to 29 Years | 82 (80.4%) | 11 (13.4%) |
| 30 to 34 Years | 71 (57.3%) | 0 (0.0%) |
| 35 to 44 Years | 137 (62.3%) | 24 (17.5%) |
| 45 to 54 Years | 155 (69.5%) | 30 (19.4%) |
| 55 to 59 Years | 50 (66.7%) | 0 (0.0%) |
| 60 to 64 Years | 78 (51.3%) | 7 (9.0%) |
| 65 to 74 Years | 23 (13.8%) | 0 (0.0%) |
| 75 Years and over | 5 (4.2%) | 0 (0.0%) |
| Total | 680 (52.3%) | 97 (14.2%) |
Employment Status by Educational Attainment in Lovelock
According to labor force statistics for Lovelock, 64.0% of individuals (573) out of the total population between 25 and 64 years of age (896) are in the labor force, with 12.6% or 72 of them being unemployed. The group with the highest labor force participation rate are those with the educational attainment of bachelor's degree or higher, with 89.4% or 127 individuals in the labor force. Within the labor force, individuals with less than high school education have the highest percentage of unemployment, with 49.5% or 48 of them being unemployed.
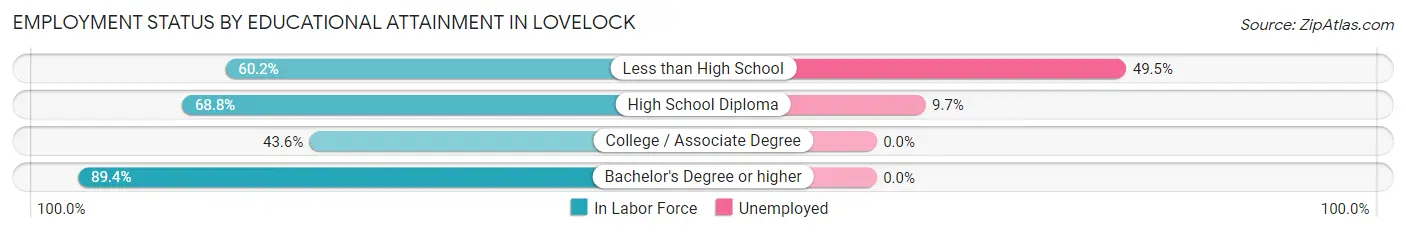
| Educational Attainment | In Labor Force | Unemployed |
| Less than High School | 97 (60.2%) | 80 (49.5%) |
| High School Diploma | 247 (68.8%) | 35 (9.7%) |
| College / Associate Degree | 102 (43.6%) | 0 (0.0%) |
| Bachelor's Degree or higher | 127 (89.4%) | 0 (0.0%) |
| Total | 573 (64.0%) | 113 (12.6%) |
Employment Occupations by Sex in Lovelock
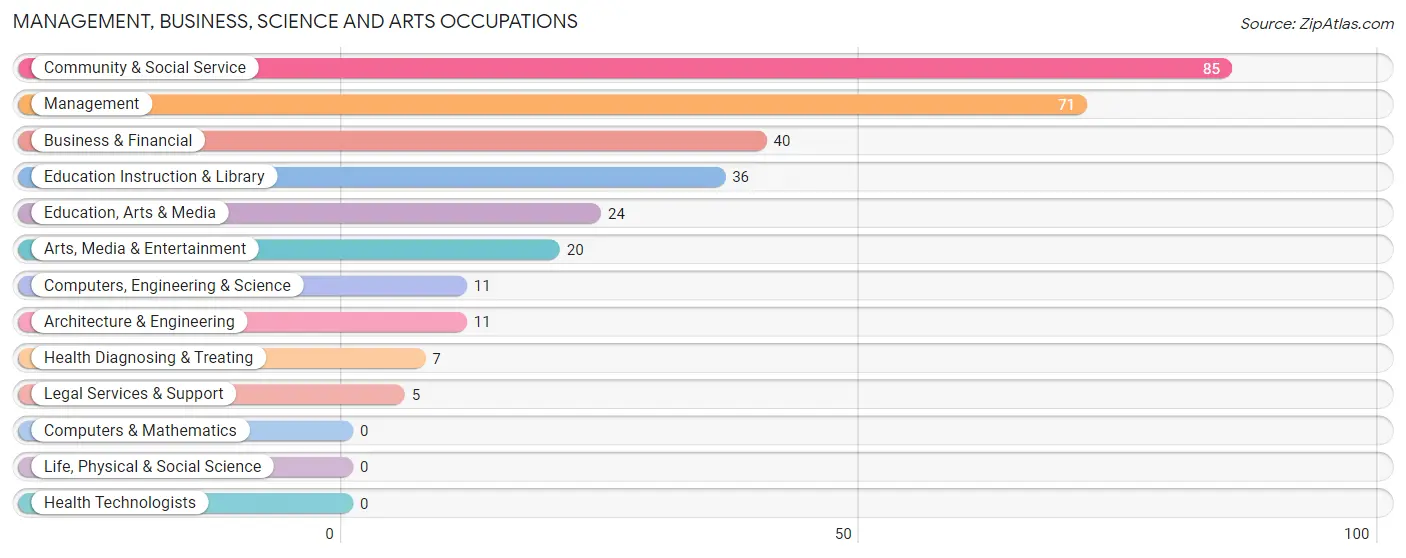
Management, Business, Science and Arts Occupations
The most common Management, Business, Science and Arts occupations in Lovelock are Community & Social Service (85 | 14.5%), Management (71 | 12.2%), Business & Financial (40 | 6.9%), Education Instruction & Library (36 | 6.2%), and Education, Arts & Media (24 | 4.1%).
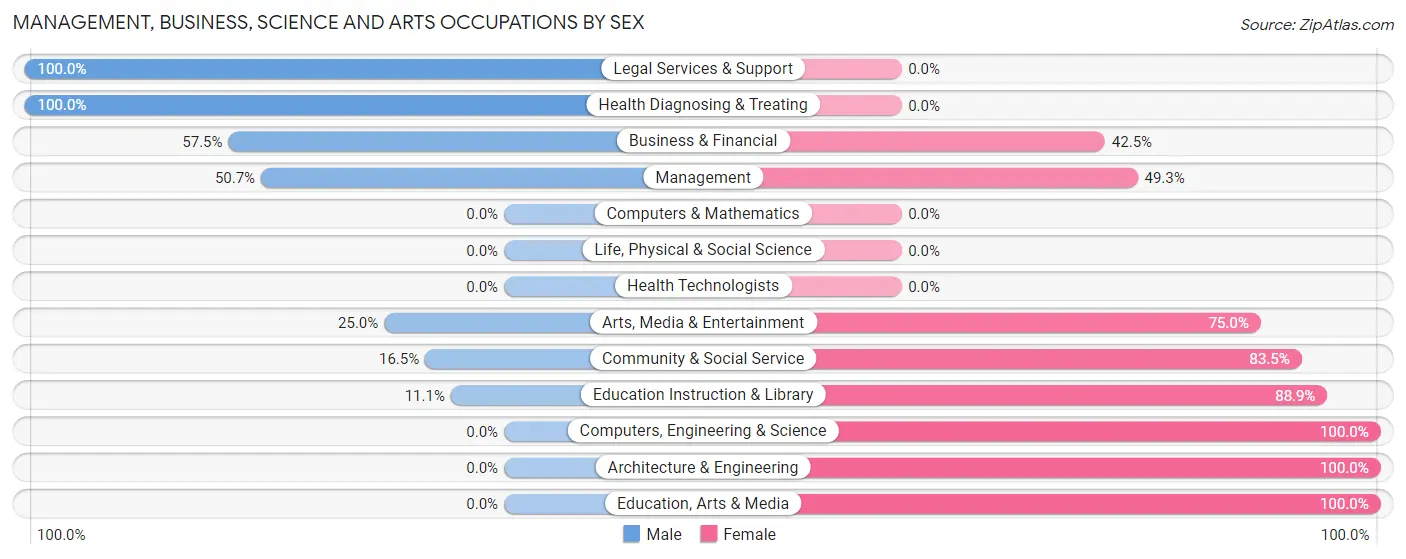
Management, Business, Science and Arts Occupations by Sex
Within the Management, Business, Science and Arts occupations in Lovelock, the most male-oriented occupations are Legal Services & Support (100.0%), Health Diagnosing & Treating (100.0%), and Business & Financial (57.5%), while the most female-oriented occupations are Computers, Engineering & Science (100.0%), Architecture & Engineering (100.0%), and Education, Arts & Media (100.0%).
| Occupation | Male | Female |
| Management | 36 (50.7%) | 35 (49.3%) |
| Business & Financial | 23 (57.5%) | 17 (42.5%) |
| Computers, Engineering & Science | 0 (0.0%) | 11 (100.0%) |
| Computers & Mathematics | 0 (0.0%) | 0 (0.0%) |
| Architecture & Engineering | 0 (0.0%) | 11 (100.0%) |
| Life, Physical & Social Science | 0 (0.0%) | 0 (0.0%) |
| Community & Social Service | 14 (16.5%) | 71 (83.5%) |
| Education, Arts & Media | 0 (0.0%) | 24 (100.0%) |
| Legal Services & Support | 5 (100.0%) | 0 (0.0%) |
| Education Instruction & Library | 4 (11.1%) | 32 (88.9%) |
| Arts, Media & Entertainment | 5 (25.0%) | 15 (75.0%) |
| Health Diagnosing & Treating | 7 (100.0%) | 0 (0.0%) |
| Health Technologists | 0 (0.0%) | 0 (0.0%) |
| Total (Category) | 80 (37.4%) | 134 (62.6%) |
| Total (Overall) | 276 (47.3%) | 308 (52.7%) |
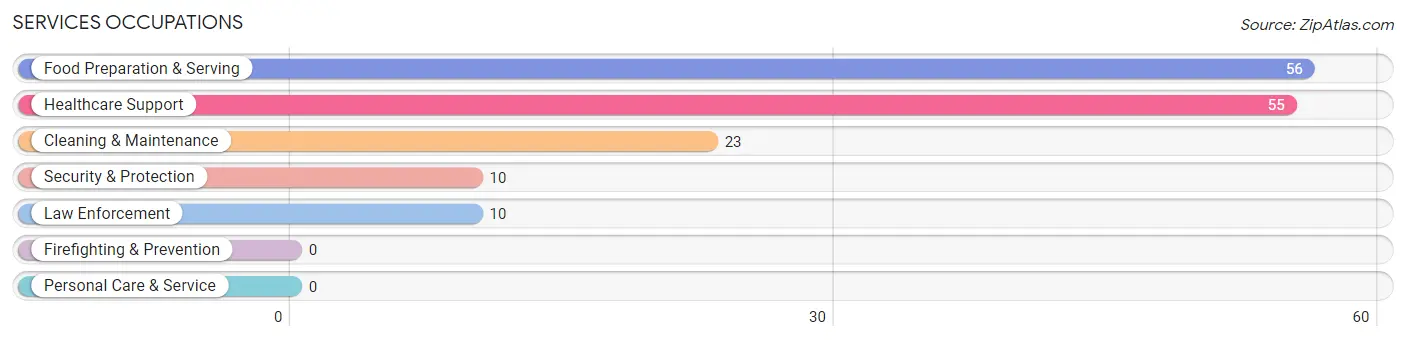
Services Occupations
The most common Services occupations in Lovelock are Food Preparation & Serving (56 | 9.6%), Healthcare Support (55 | 9.4%), Cleaning & Maintenance (23 | 3.9%), Security & Protection (10 | 1.7%), and Law Enforcement (10 | 1.7%).
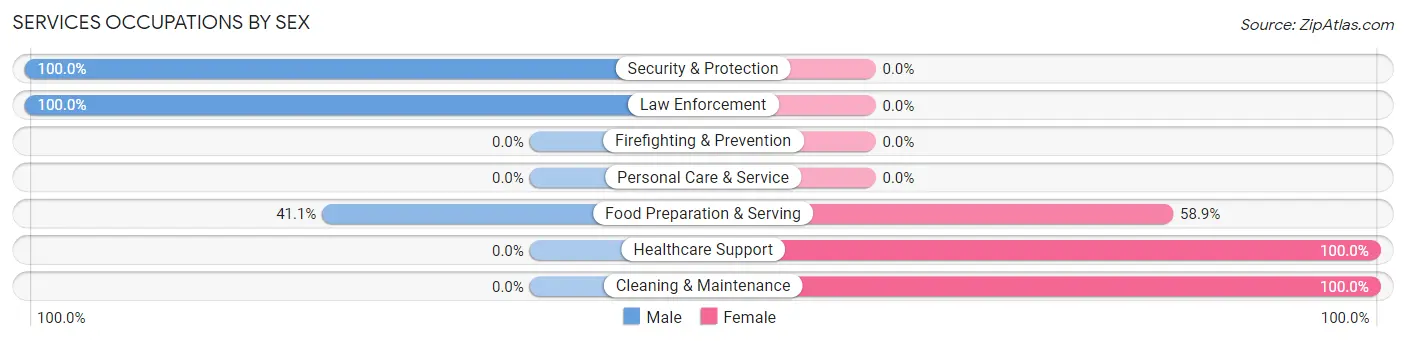
Services Occupations by Sex
Within the Services occupations in Lovelock, the most male-oriented occupations are Security & Protection (100.0%), Law Enforcement (100.0%), and Food Preparation & Serving (41.1%), while the most female-oriented occupations are Healthcare Support (100.0%), Cleaning & Maintenance (100.0%), and Food Preparation & Serving (58.9%).
| Occupation | Male | Female |
| Healthcare Support | 0 (0.0%) | 55 (100.0%) |
| Security & Protection | 10 (100.0%) | 0 (0.0%) |
| Firefighting & Prevention | 0 (0.0%) | 0 (0.0%) |
| Law Enforcement | 10 (100.0%) | 0 (0.0%) |
| Food Preparation & Serving | 23 (41.1%) | 33 (58.9%) |
| Cleaning & Maintenance | 0 (0.0%) | 23 (100.0%) |
| Personal Care & Service | 0 (0.0%) | 0 (0.0%) |
| Total (Category) | 33 (22.9%) | 111 (77.1%) |
| Total (Overall) | 276 (47.3%) | 308 (52.7%) |
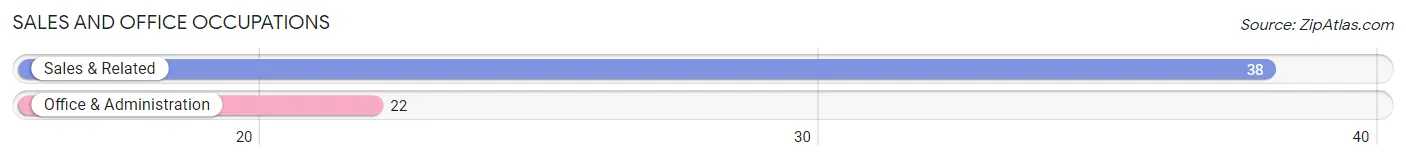
Sales and Office Occupations
The most common Sales and Office occupations in Lovelock are Sales & Related (38 | 6.5%), and Office & Administration (22 | 3.8%).
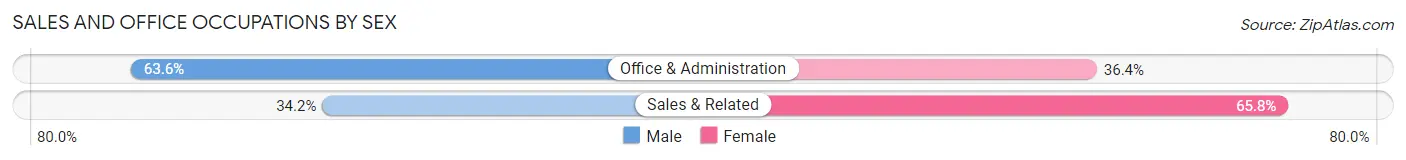
Sales and Office Occupations by Sex
| Occupation | Male | Female |
| Sales & Related | 13 (34.2%) | 25 (65.8%) |
| Office & Administration | 14 (63.6%) | 8 (36.4%) |
| Total (Category) | 27 (45.0%) | 33 (55.0%) |
| Total (Overall) | 276 (47.3%) | 308 (52.7%) |
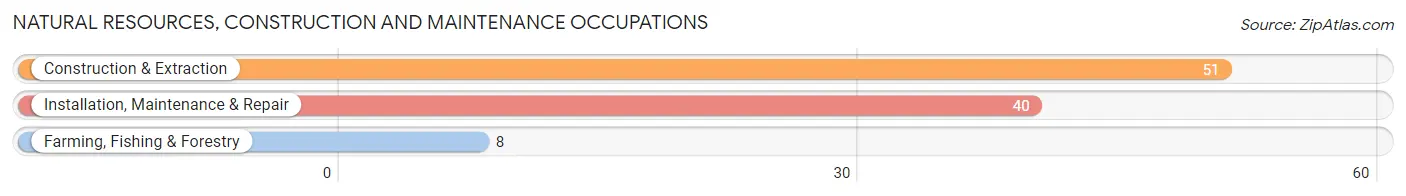
Natural Resources, Construction and Maintenance Occupations
The most common Natural Resources, Construction and Maintenance occupations in Lovelock are Construction & Extraction (51 | 8.7%), Installation, Maintenance & Repair (40 | 6.9%), and Farming, Fishing & Forestry (8 | 1.4%).
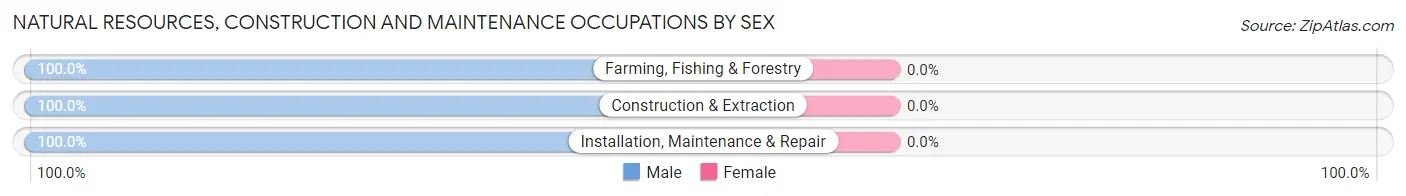
Natural Resources, Construction and Maintenance Occupations by Sex
| Occupation | Male | Female |
| Farming, Fishing & Forestry | 8 (100.0%) | 0 (0.0%) |
| Construction & Extraction | 51 (100.0%) | 0 (0.0%) |
| Installation, Maintenance & Repair | 40 (100.0%) | 0 (0.0%) |
| Total (Category) | 99 (100.0%) | 0 (0.0%) |
| Total (Overall) | 276 (47.3%) | 308 (52.7%) |
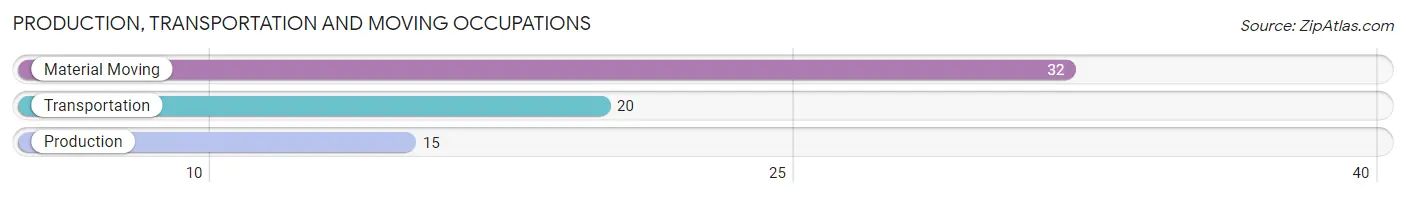
Production, Transportation and Moving Occupations
The most common Production, Transportation and Moving occupations in Lovelock are Material Moving (32 | 5.5%), Transportation (20 | 3.4%), and Production (15 | 2.6%).
Production, Transportation and Moving Occupations by Sex
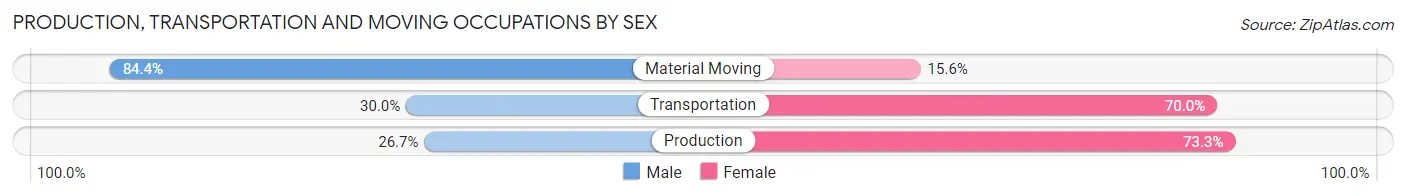
| Occupation | Male | Female |
| Production | 4 (26.7%) | 11 (73.3%) |
| Transportation | 6 (30.0%) | 14 (70.0%) |
| Material Moving | 27 (84.4%) | 5 (15.6%) |
| Total (Category) | 37 (55.2%) | 30 (44.8%) |
| Total (Overall) | 276 (47.3%) | 308 (52.7%) |
Employment Industries by Sex in Lovelock
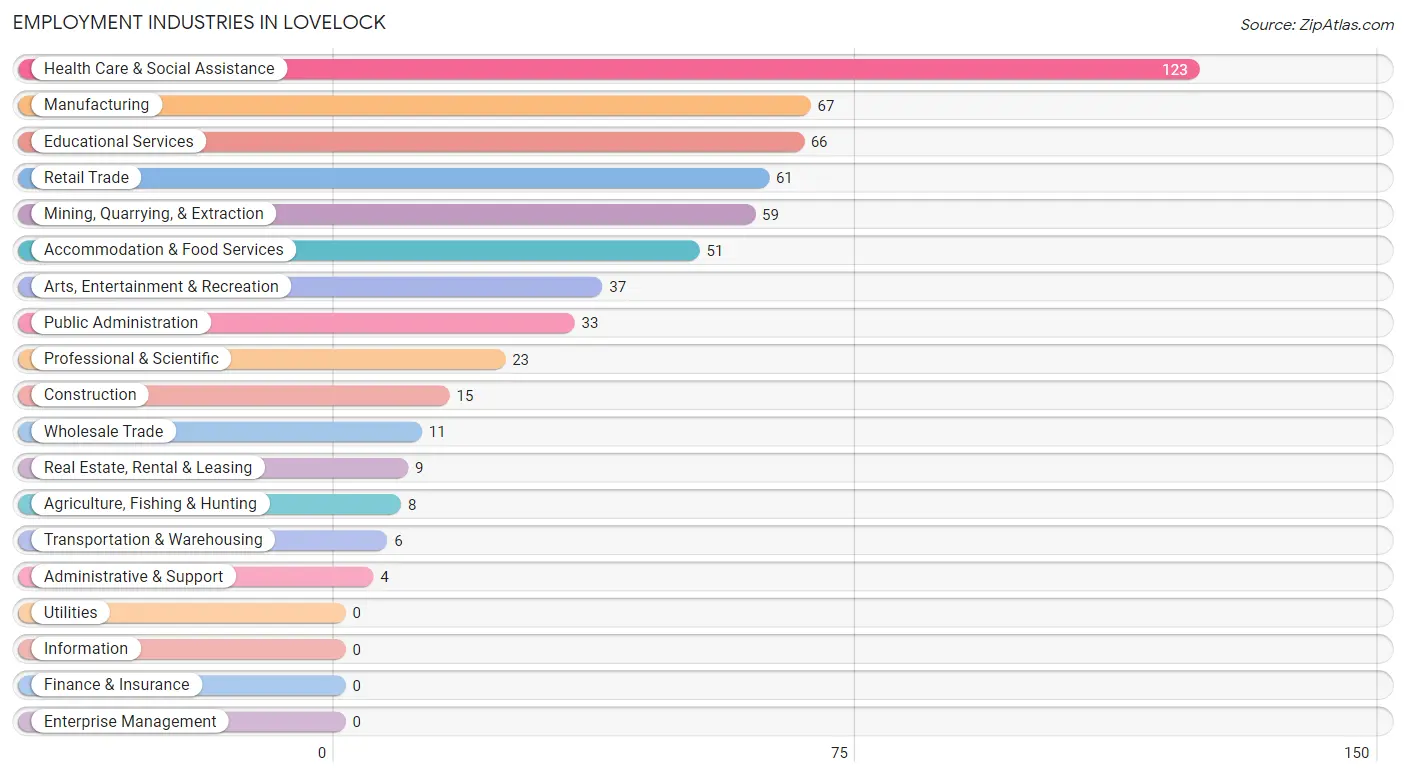
Employment Industries in Lovelock
The major employment industries in Lovelock include Health Care & Social Assistance (123 | 21.1%), Manufacturing (67 | 11.5%), Educational Services (66 | 11.3%), Retail Trade (61 | 10.4%), and Mining, Quarrying, & Extraction (59 | 10.1%).
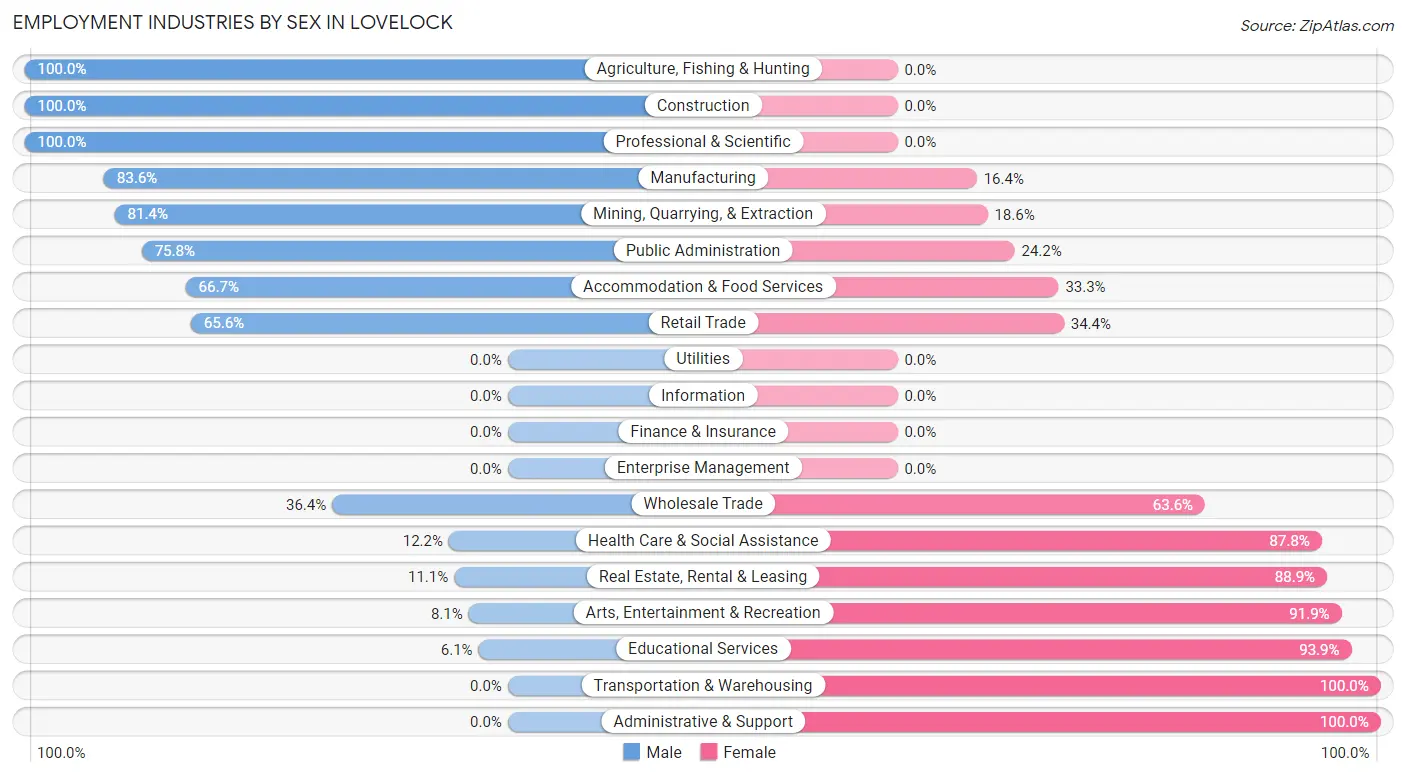
Employment Industries by Sex in Lovelock
The Lovelock industries that see more men than women are Agriculture, Fishing & Hunting (100.0%), Construction (100.0%), and Professional & Scientific (100.0%), whereas the industries that tend to have a higher number of women are Transportation & Warehousing (100.0%), Administrative & Support (100.0%), and Educational Services (93.9%).
| Industry | Male | Female |
| Agriculture, Fishing & Hunting | 8 (100.0%) | 0 (0.0%) |
| Mining, Quarrying, & Extraction | 48 (81.4%) | 11 (18.6%) |
| Construction | 15 (100.0%) | 0 (0.0%) |
| Manufacturing | 56 (83.6%) | 11 (16.4%) |
| Wholesale Trade | 4 (36.4%) | 7 (63.6%) |
| Retail Trade | 40 (65.6%) | 21 (34.4%) |
| Transportation & Warehousing | 0 (0.0%) | 6 (100.0%) |
| Utilities | 0 (0.0%) | 0 (0.0%) |
| Information | 0 (0.0%) | 0 (0.0%) |
| Finance & Insurance | 0 (0.0%) | 0 (0.0%) |
| Real Estate, Rental & Leasing | 1 (11.1%) | 8 (88.9%) |
| Professional & Scientific | 23 (100.0%) | 0 (0.0%) |
| Enterprise Management | 0 (0.0%) | 0 (0.0%) |
| Administrative & Support | 0 (0.0%) | 4 (100.0%) |
| Educational Services | 4 (6.1%) | 62 (93.9%) |
| Health Care & Social Assistance | 15 (12.2%) | 108 (87.8%) |
| Arts, Entertainment & Recreation | 3 (8.1%) | 34 (91.9%) |
| Accommodation & Food Services | 34 (66.7%) | 17 (33.3%) |
| Public Administration | 25 (75.8%) | 8 (24.2%) |
| Total | 276 (47.3%) | 308 (52.7%) |
Education in Lovelock
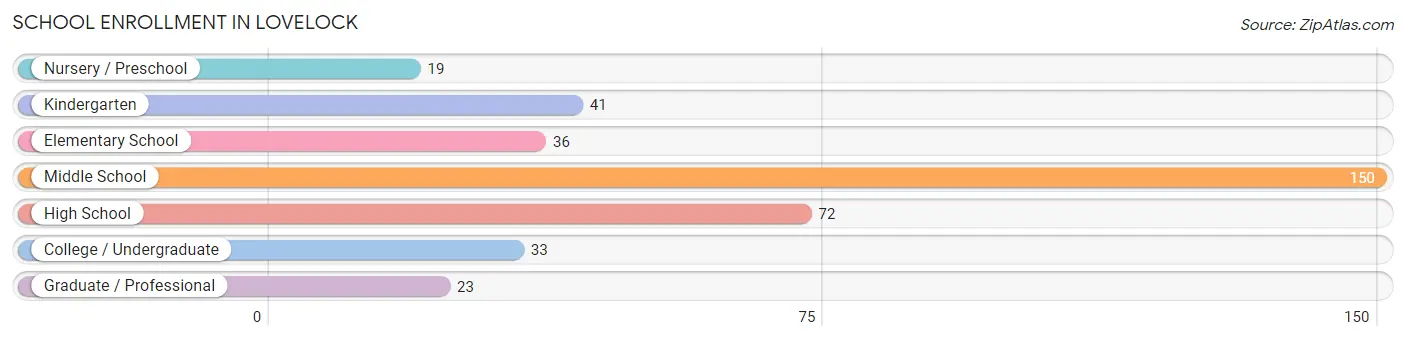
School Enrollment in Lovelock
The most common levels of schooling among the 374 students in Lovelock are middle school (150 | 40.1%), high school (72 | 19.3%), and kindergarten (41 | 11.0%).
| School Level | # Students | % Students |
| Nursery / Preschool | 19 | 5.1% |
| Kindergarten | 41 | 11.0% |
| Elementary School | 36 | 9.6% |
| Middle School | 150 | 40.1% |
| High School | 72 | 19.3% |
| College / Undergraduate | 33 | 8.8% |
| Graduate / Professional | 23 | 6.1% |
| Total | 374 | 100.0% |
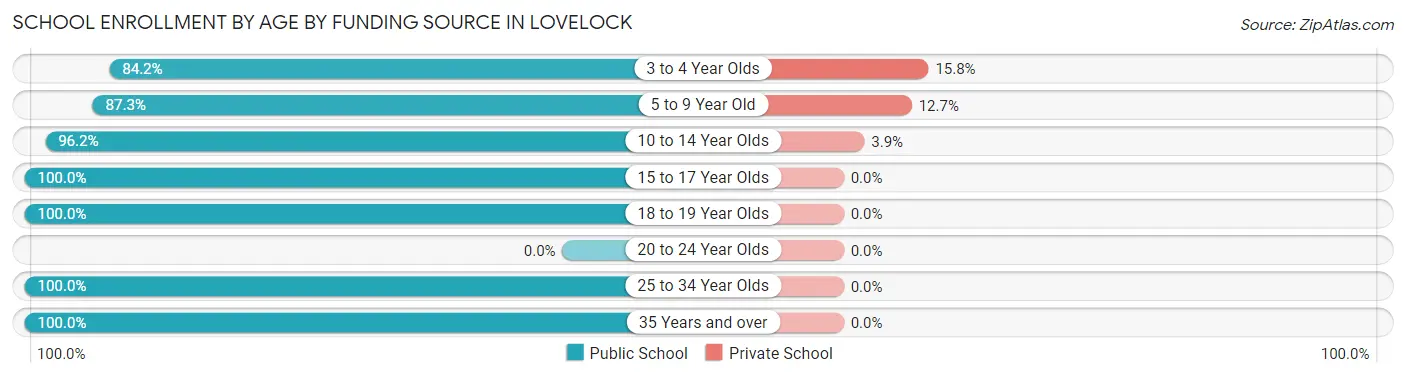
School Enrollment by Age by Funding Source in Lovelock
Out of a total of 374 students who are enrolled in schools in Lovelock, 18 (4.8%) attend a private institution, while the remaining 356 (95.2%) are enrolled in public schools. The age group of 3 to 4 year olds has the highest likelihood of being enrolled in private schools, with 3 (15.8% in the age bracket) enrolled. Conversely, the age group of 15 to 17 year olds has the lowest likelihood of being enrolled in a private school, with 46 (100.0% in the age bracket) attending a public institution.
| Age Bracket | Public School | Private School |
| 3 to 4 Year Olds | 16 (84.2%) | 3 (15.8%) |
| 5 to 9 Year Old | 62 (87.3%) | 9 (12.7%) |
| 10 to 14 Year Olds | 150 (96.2%) | 6 (3.8%) |
| 15 to 17 Year Olds | 46 (100.0%) | 0 (0.0%) |
| 18 to 19 Year Olds | 25 (100.0%) | 0 (0.0%) |
| 20 to 24 Year Olds | 0 (0.0%) | 0 (0.0%) |
| 25 to 34 Year Olds | 29 (100.0%) | 0 (0.0%) |
| 35 Years and over | 28 (100.0%) | 0 (0.0%) |
| Total | 356 (95.2%) | 18 (4.8%) |
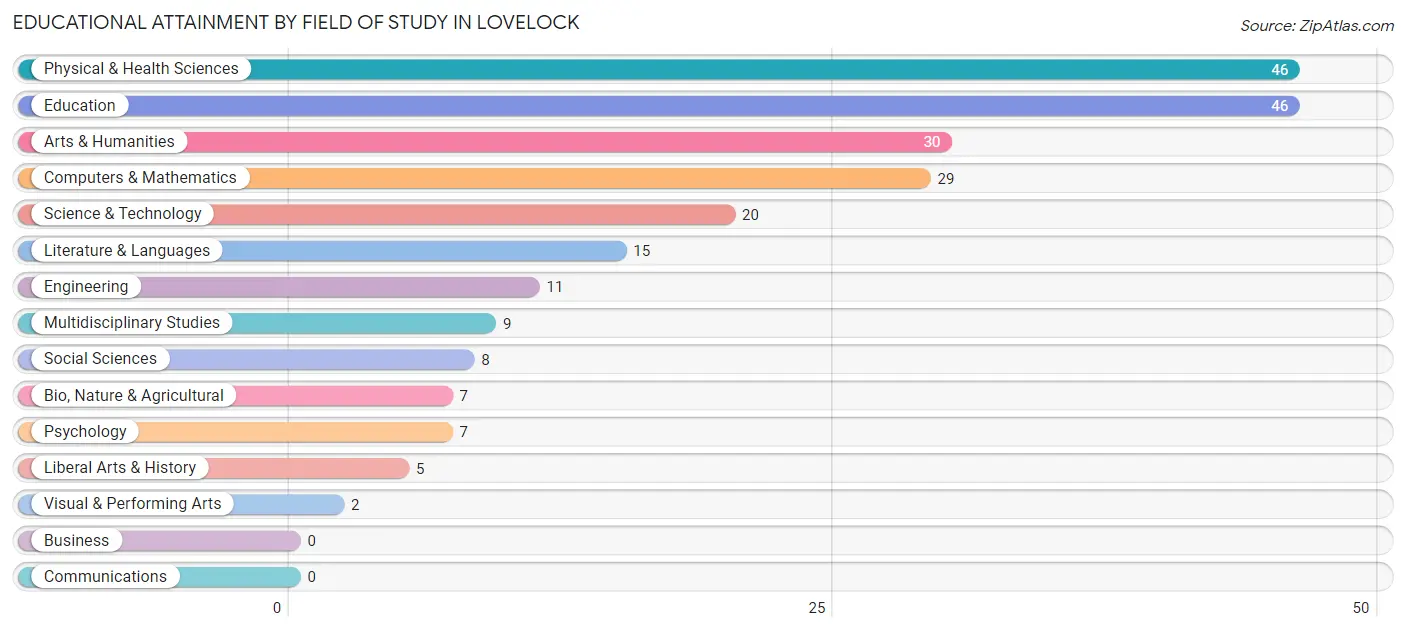
Educational Attainment by Field of Study in Lovelock
Physical & health sciences (46 | 19.6%), education (46 | 19.6%), arts & humanities (30 | 12.8%), computers & mathematics (29 | 12.3%), and science & technology (20 | 8.5%) are the most common fields of study among 235 individuals in Lovelock who have obtained a bachelor's degree or higher.
| Field of Study | # Graduates | % Graduates |
| Computers & Mathematics | 29 | 12.3% |
| Bio, Nature & Agricultural | 7 | 3.0% |
| Physical & Health Sciences | 46 | 19.6% |
| Psychology | 7 | 3.0% |
| Social Sciences | 8 | 3.4% |
| Engineering | 11 | 4.7% |
| Multidisciplinary Studies | 9 | 3.8% |
| Science & Technology | 20 | 8.5% |
| Business | 0 | 0.0% |
| Education | 46 | 19.6% |
| Literature & Languages | 15 | 6.4% |
| Liberal Arts & History | 5 | 2.1% |
| Visual & Performing Arts | 2 | 0.9% |
| Communications | 0 | 0.0% |
| Arts & Humanities | 30 | 12.8% |
| Total | 235 | 100.0% |
Transportation & Commute in Lovelock
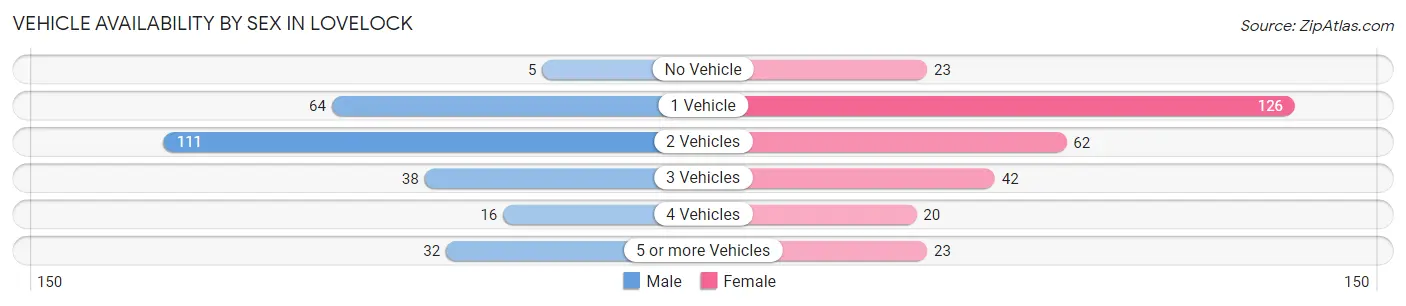
Vehicle Availability by Sex in Lovelock
The most prevalent vehicle ownership categories in Lovelock are males with 2 vehicles (111, accounting for 41.7%) and females with 2 vehicles (62, making up 37.5%).
| Vehicles Available | Male | Female |
| No Vehicle | 5 (1.9%) | 23 (7.8%) |
| 1 Vehicle | 64 (24.1%) | 126 (42.6%) |
| 2 Vehicles | 111 (41.7%) | 62 (20.9%) |
| 3 Vehicles | 38 (14.3%) | 42 (14.2%) |
| 4 Vehicles | 16 (6.0%) | 20 (6.8%) |
| 5 or more Vehicles | 32 (12.0%) | 23 (7.8%) |
| Total | 266 (100.0%) | 296 (100.0%) |
Commute Time in Lovelock
The most frequently occuring commute durations in Lovelock are 5 to 9 minutes (135 commuters, 25.6%), less than 5 minutes (104 commuters, 19.7%), and 10 to 14 minutes (66 commuters, 12.5%).
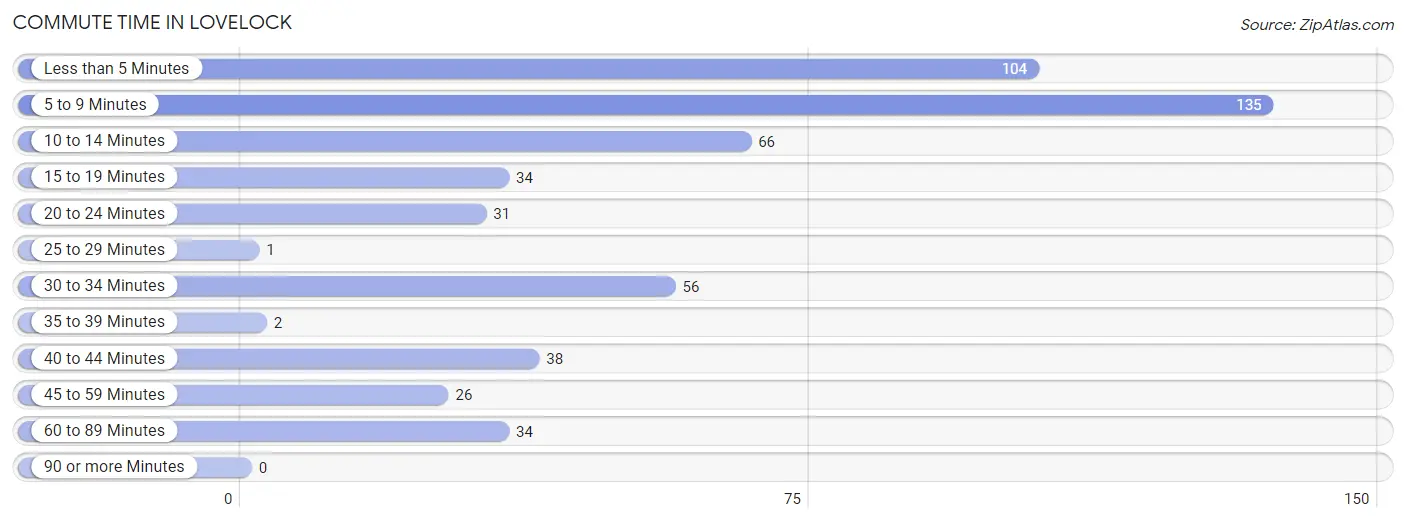
| Commute Time | # Commuters | % Commuters |
| Less than 5 Minutes | 104 | 19.7% |
| 5 to 9 Minutes | 135 | 25.6% |
| 10 to 14 Minutes | 66 | 12.5% |
| 15 to 19 Minutes | 34 | 6.5% |
| 20 to 24 Minutes | 31 | 5.9% |
| 25 to 29 Minutes | 1 | 0.2% |
| 30 to 34 Minutes | 56 | 10.6% |
| 35 to 39 Minutes | 2 | 0.4% |
| 40 to 44 Minutes | 38 | 7.2% |
| 45 to 59 Minutes | 26 | 4.9% |
| 60 to 89 Minutes | 34 | 6.5% |
| 90 or more Minutes | 0 | 0.0% |
Commute Time by Sex in Lovelock
The most common commute times in Lovelock are 5 to 9 minutes (65 commuters, 24.4%) for males and 5 to 9 minutes (70 commuters, 26.8%) for females.
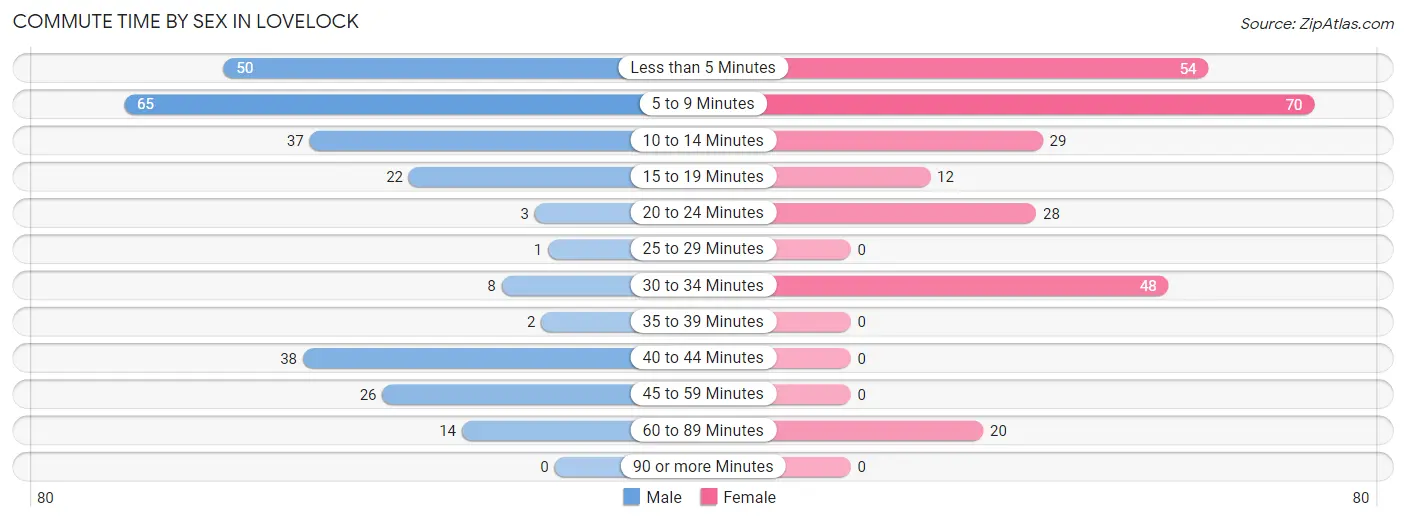
| Commute Time | Male | Female |
| Less than 5 Minutes | 50 (18.8%) | 54 (20.7%) |
| 5 to 9 Minutes | 65 (24.4%) | 70 (26.8%) |
| 10 to 14 Minutes | 37 (13.9%) | 29 (11.1%) |
| 15 to 19 Minutes | 22 (8.3%) | 12 (4.6%) |
| 20 to 24 Minutes | 3 (1.1%) | 28 (10.7%) |
| 25 to 29 Minutes | 1 (0.4%) | 0 (0.0%) |
| 30 to 34 Minutes | 8 (3.0%) | 48 (18.4%) |
| 35 to 39 Minutes | 2 (0.7%) | 0 (0.0%) |
| 40 to 44 Minutes | 38 (14.3%) | 0 (0.0%) |
| 45 to 59 Minutes | 26 (9.8%) | 0 (0.0%) |
| 60 to 89 Minutes | 14 (5.3%) | 20 (7.7%) |
| 90 or more Minutes | 0 (0.0%) | 0 (0.0%) |
Time of Departure to Work by Sex in Lovelock
The most frequent times of departure to work in Lovelock are 4:00 PM to 11:59 PM (48, 18.0%) for males and 7:00 AM to 7:29 AM (52, 19.9%) for females.
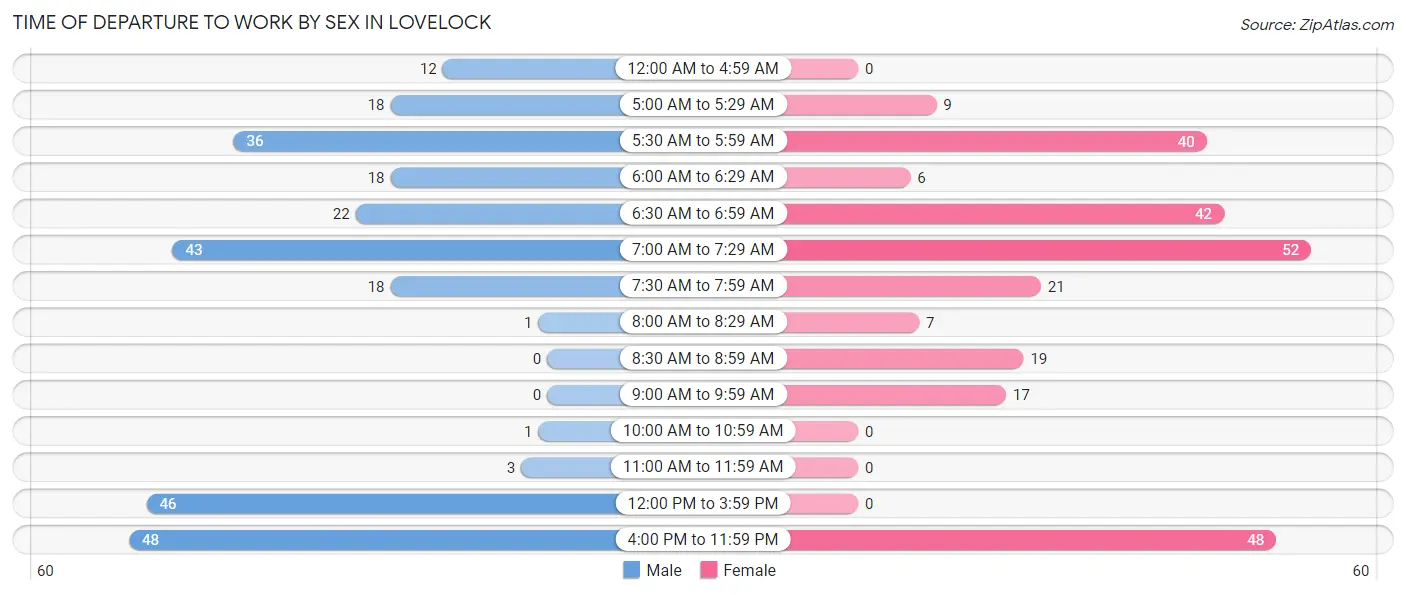
| Time of Departure | Male | Female |
| 12:00 AM to 4:59 AM | 12 (4.5%) | 0 (0.0%) |
| 5:00 AM to 5:29 AM | 18 (6.8%) | 9 (3.5%) |
| 5:30 AM to 5:59 AM | 36 (13.5%) | 40 (15.3%) |
| 6:00 AM to 6:29 AM | 18 (6.8%) | 6 (2.3%) |
| 6:30 AM to 6:59 AM | 22 (8.3%) | 42 (16.1%) |
| 7:00 AM to 7:29 AM | 43 (16.2%) | 52 (19.9%) |
| 7:30 AM to 7:59 AM | 18 (6.8%) | 21 (8.1%) |
| 8:00 AM to 8:29 AM | 1 (0.4%) | 7 (2.7%) |
| 8:30 AM to 8:59 AM | 0 (0.0%) | 19 (7.3%) |
| 9:00 AM to 9:59 AM | 0 (0.0%) | 17 (6.5%) |
| 10:00 AM to 10:59 AM | 1 (0.4%) | 0 (0.0%) |
| 11:00 AM to 11:59 AM | 3 (1.1%) | 0 (0.0%) |
| 12:00 PM to 3:59 PM | 46 (17.3%) | 0 (0.0%) |
| 4:00 PM to 11:59 PM | 48 (18.0%) | 48 (18.4%) |
| Total | 266 (100.0%) | 261 (100.0%) |
Housing Occupancy in Lovelock
Occupancy by Ownership in Lovelock
Of the total 674 dwellings in Lovelock, owner-occupied units account for 329 (48.8%), while renter-occupied units make up 345 (51.2%).
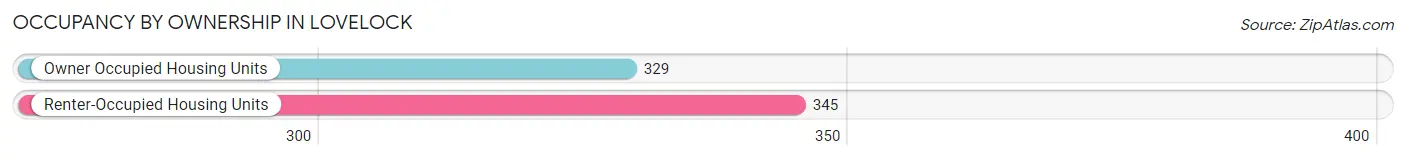
| Occupancy | # Housing Units | % Housing Units |
| Owner Occupied Housing Units | 329 | 48.8% |
| Renter-Occupied Housing Units | 345 | 51.2% |
| Total Occupied Housing Units | 674 | 100.0% |
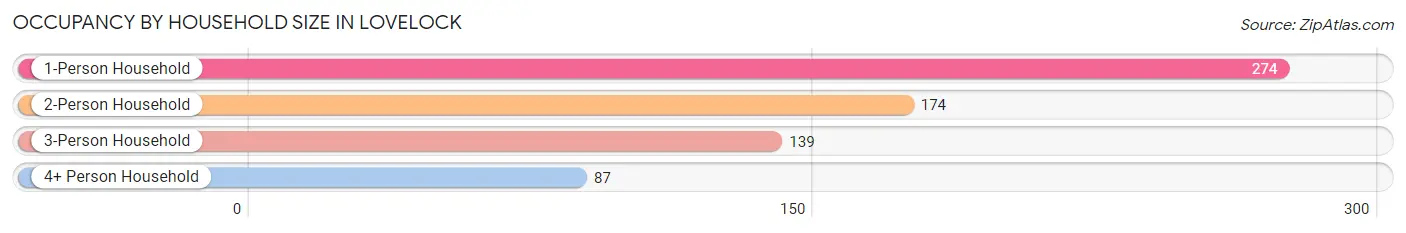
Occupancy by Household Size in Lovelock
| Household Size | # Housing Units | % Housing Units |
| 1-Person Household | 274 | 40.6% |
| 2-Person Household | 174 | 25.8% |
| 3-Person Household | 139 | 20.6% |
| 4+ Person Household | 87 | 12.9% |
| Total Housing Units | 674 | 100.0% |
Occupancy by Ownership by Household Size in Lovelock
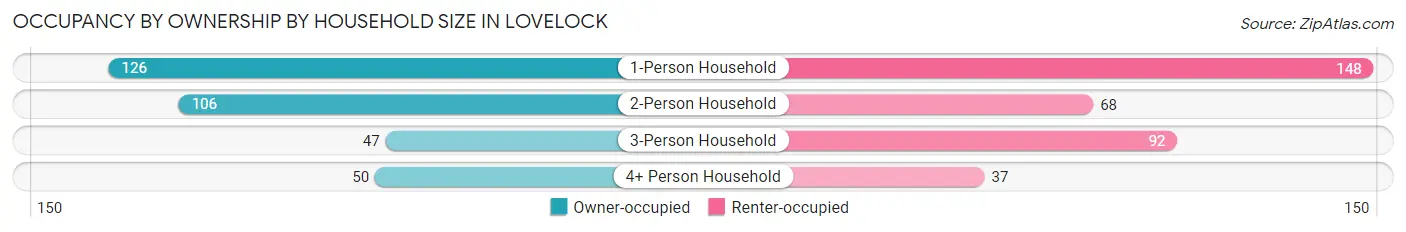
| Household Size | Owner-occupied | Renter-occupied |
| 1-Person Household | 126 (46.0%) | 148 (54.0%) |
| 2-Person Household | 106 (60.9%) | 68 (39.1%) |
| 3-Person Household | 47 (33.8%) | 92 (66.2%) |
| 4+ Person Household | 50 (57.5%) | 37 (42.5%) |
| Total Housing Units | 329 (48.8%) | 345 (51.2%) |
Occupancy by Educational Attainment in Lovelock
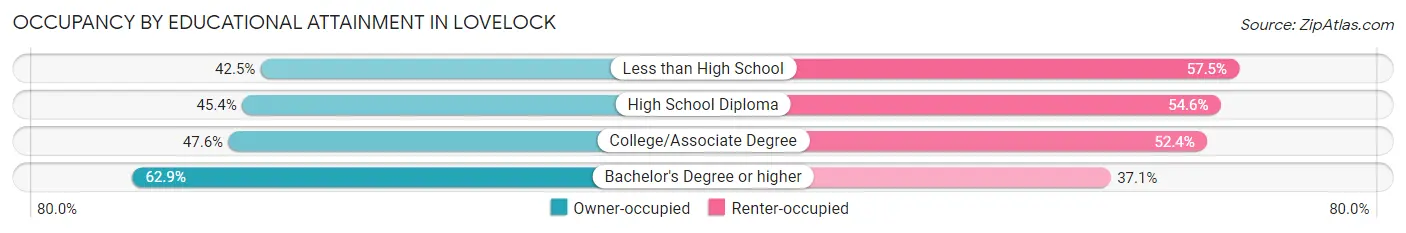
| Household Size | Owner-occupied | Renter-occupied |
| Less than High School | 48 (42.5%) | 65 (57.5%) |
| High School Diploma | 129 (45.4%) | 155 (54.6%) |
| College/Associate Degree | 69 (47.6%) | 76 (52.4%) |
| Bachelor's Degree or higher | 83 (62.9%) | 49 (37.1%) |
Occupancy by Age of Householder in Lovelock
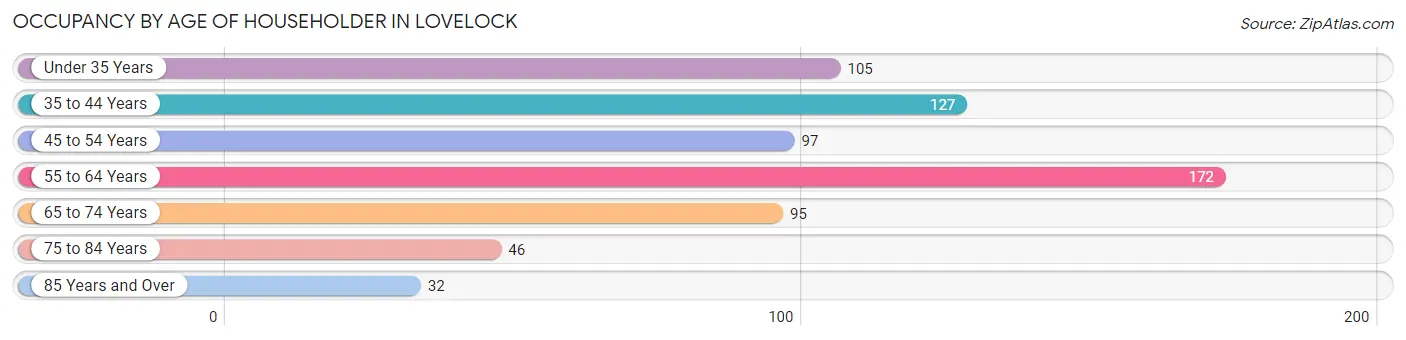
| Age Bracket | # Households | % Households |
| Under 35 Years | 105 | 15.6% |
| 35 to 44 Years | 127 | 18.8% |
| 45 to 54 Years | 97 | 14.4% |
| 55 to 64 Years | 172 | 25.5% |
| 65 to 74 Years | 95 | 14.1% |
| 75 to 84 Years | 46 | 6.8% |
| 85 Years and Over | 32 | 4.8% |
| Total | 674 | 100.0% |
Housing Finances in Lovelock
Median Income by Occupancy in Lovelock
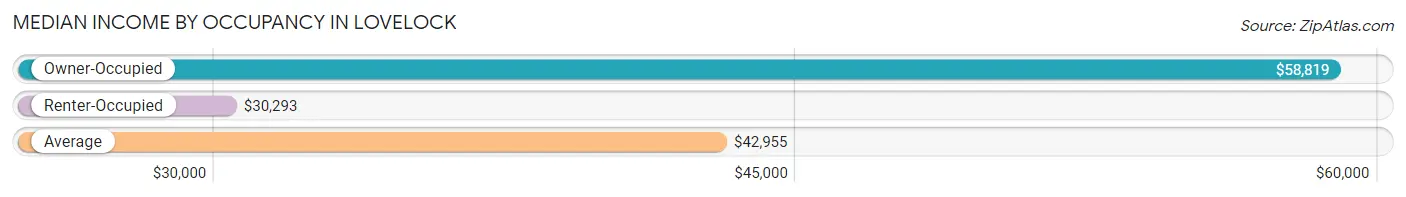
| Occupancy Type | # Households | Median Income |
| Owner-Occupied | 329 (48.8%) | $58,819 |
| Renter-Occupied | 345 (51.2%) | $30,293 |
| Average | 674 (100.0%) | $42,955 |
Occupancy by Householder Income Bracket in Lovelock
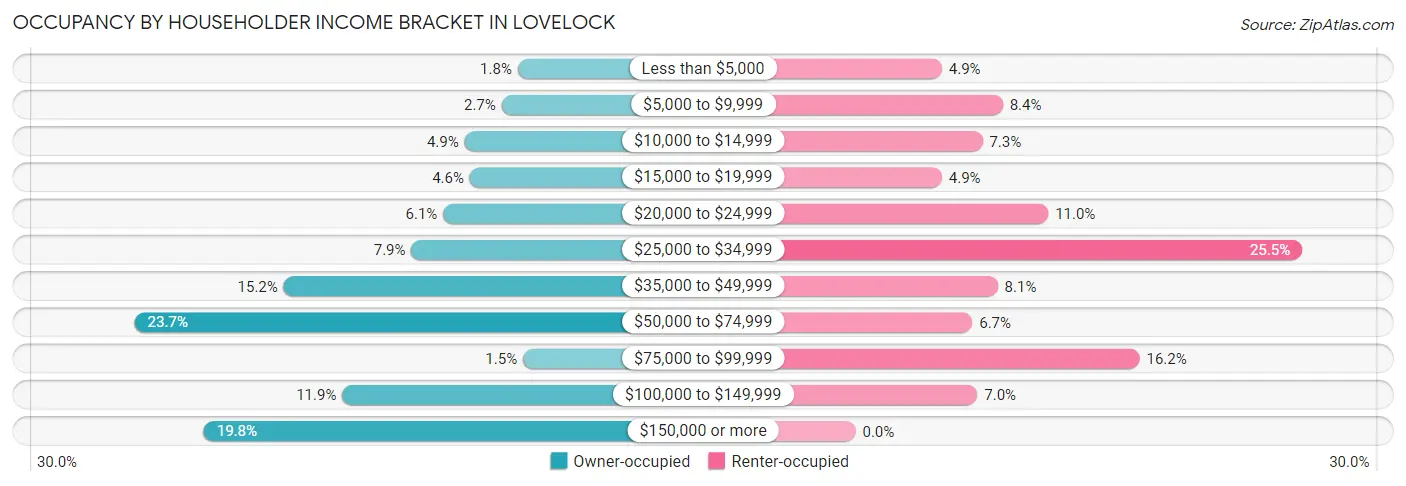
| Income Bracket | Owner-occupied | Renter-occupied |
| Less than $5,000 | 6 (1.8%) | 17 (4.9%) |
| $5,000 to $9,999 | 9 (2.7%) | 29 (8.4%) |
| $10,000 to $14,999 | 16 (4.9%) | 25 (7.2%) |
| $15,000 to $19,999 | 15 (4.6%) | 17 (4.9%) |
| $20,000 to $24,999 | 20 (6.1%) | 38 (11.0%) |
| $25,000 to $34,999 | 26 (7.9%) | 88 (25.5%) |
| $35,000 to $49,999 | 50 (15.2%) | 28 (8.1%) |
| $50,000 to $74,999 | 78 (23.7%) | 23 (6.7%) |
| $75,000 to $99,999 | 5 (1.5%) | 56 (16.2%) |
| $100,000 to $149,999 | 39 (11.8%) | 24 (7.0%) |
| $150,000 or more | 65 (19.8%) | 0 (0.0%) |
| Total | 329 (100.0%) | 345 (100.0%) |
Monthly Housing Cost Tiers in Lovelock
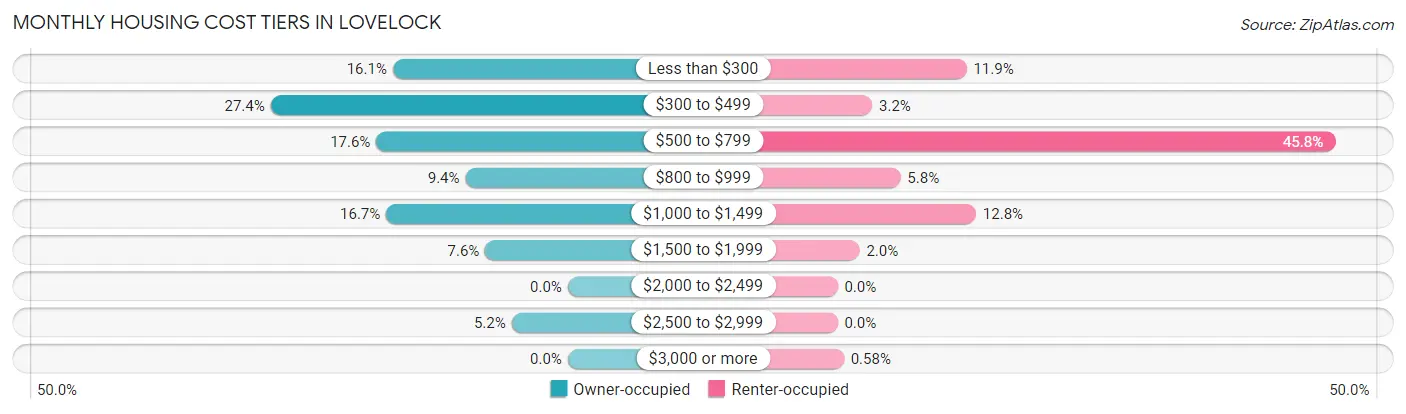
| Monthly Cost | Owner-occupied | Renter-occupied |
| Less than $300 | 53 (16.1%) | 41 (11.9%) |
| $300 to $499 | 90 (27.4%) | 11 (3.2%) |
| $500 to $799 | 58 (17.6%) | 158 (45.8%) |
| $800 to $999 | 31 (9.4%) | 20 (5.8%) |
| $1,000 to $1,499 | 55 (16.7%) | 44 (12.8%) |
| $1,500 to $1,999 | 25 (7.6%) | 7 (2.0%) |
| $2,000 to $2,499 | 0 (0.0%) | 0 (0.0%) |
| $2,500 to $2,999 | 17 (5.2%) | 0 (0.0%) |
| $3,000 or more | 0 (0.0%) | 2 (0.6%) |
| Total | 329 (100.0%) | 345 (100.0%) |
Physical Housing Characteristics in Lovelock
Housing Structures in Lovelock
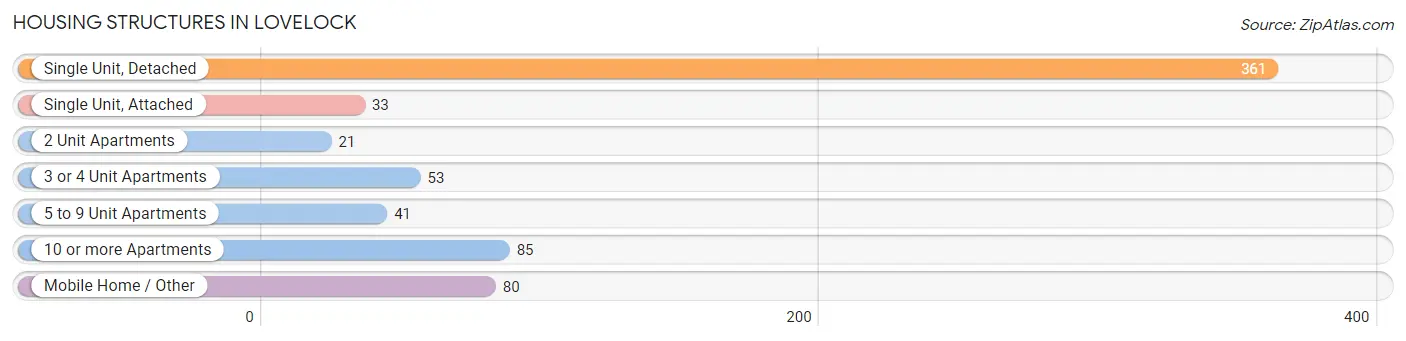
| Structure Type | # Housing Units | % Housing Units |
| Single Unit, Detached | 361 | 53.6% |
| Single Unit, Attached | 33 | 4.9% |
| 2 Unit Apartments | 21 | 3.1% |
| 3 or 4 Unit Apartments | 53 | 7.9% |
| 5 to 9 Unit Apartments | 41 | 6.1% |
| 10 or more Apartments | 85 | 12.6% |
| Mobile Home / Other | 80 | 11.9% |
| Total | 674 | 100.0% |
Housing Structures by Occupancy in Lovelock
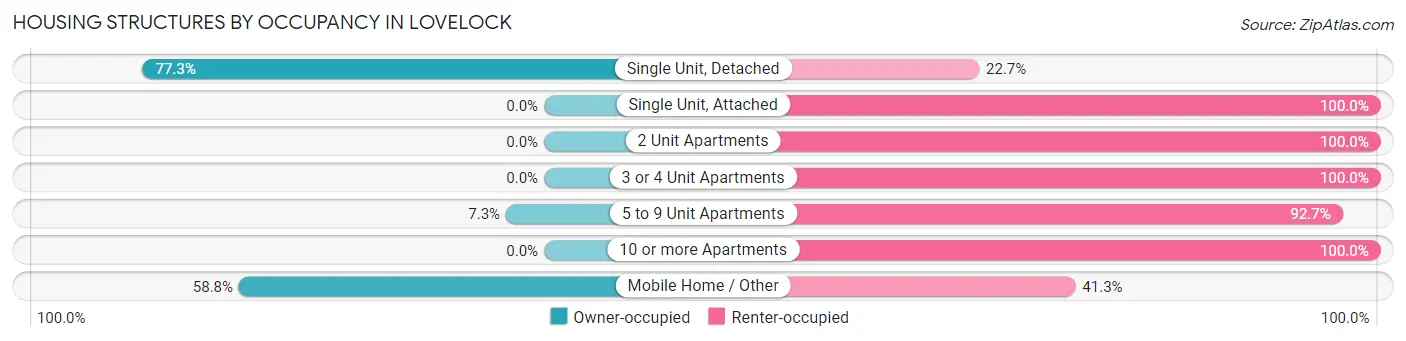
| Structure Type | Owner-occupied | Renter-occupied |
| Single Unit, Detached | 279 (77.3%) | 82 (22.7%) |
| Single Unit, Attached | 0 (0.0%) | 33 (100.0%) |
| 2 Unit Apartments | 0 (0.0%) | 21 (100.0%) |
| 3 or 4 Unit Apartments | 0 (0.0%) | 53 (100.0%) |
| 5 to 9 Unit Apartments | 3 (7.3%) | 38 (92.7%) |
| 10 or more Apartments | 0 (0.0%) | 85 (100.0%) |
| Mobile Home / Other | 47 (58.8%) | 33 (41.2%) |
| Total | 329 (48.8%) | 345 (51.2%) |
Housing Structures by Number of Rooms in Lovelock
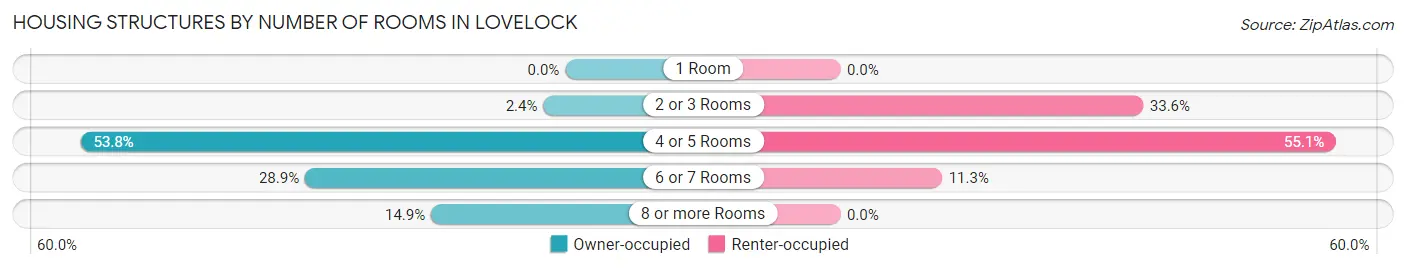
| Number of Rooms | Owner-occupied | Renter-occupied |
| 1 Room | 0 (0.0%) | 0 (0.0%) |
| 2 or 3 Rooms | 8 (2.4%) | 116 (33.6%) |
| 4 or 5 Rooms | 177 (53.8%) | 190 (55.1%) |
| 6 or 7 Rooms | 95 (28.9%) | 39 (11.3%) |
| 8 or more Rooms | 49 (14.9%) | 0 (0.0%) |
| Total | 329 (100.0%) | 345 (100.0%) |
Housing Structure by Heating Type in Lovelock
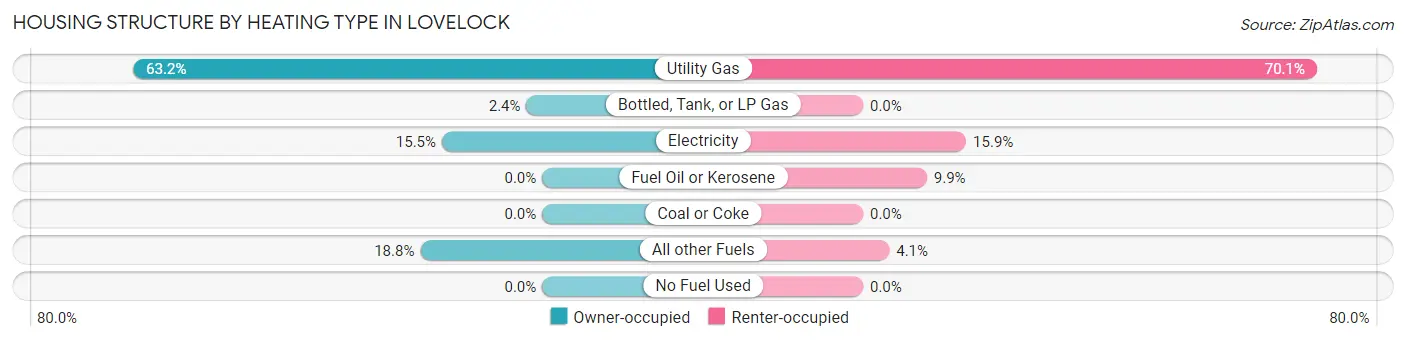
| Heating Type | Owner-occupied | Renter-occupied |
| Utility Gas | 208 (63.2%) | 242 (70.1%) |
| Bottled, Tank, or LP Gas | 8 (2.4%) | 0 (0.0%) |
| Electricity | 51 (15.5%) | 55 (15.9%) |
| Fuel Oil or Kerosene | 0 (0.0%) | 34 (9.9%) |
| Coal or Coke | 0 (0.0%) | 0 (0.0%) |
| All other Fuels | 62 (18.8%) | 14 (4.1%) |
| No Fuel Used | 0 (0.0%) | 0 (0.0%) |
| Total | 329 (100.0%) | 345 (100.0%) |
Household Vehicle Usage in Lovelock
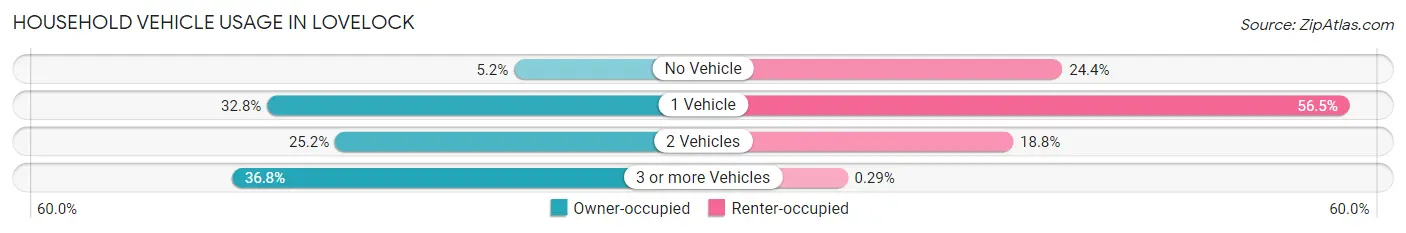
| Vehicles per Household | Owner-occupied | Renter-occupied |
| No Vehicle | 17 (5.2%) | 84 (24.3%) |
| 1 Vehicle | 108 (32.8%) | 195 (56.5%) |
| 2 Vehicles | 83 (25.2%) | 65 (18.8%) |
| 3 or more Vehicles | 121 (36.8%) | 1 (0.3%) |
| Total | 329 (100.0%) | 345 (100.0%) |
Real Estate & Mortgages in Lovelock
Real Estate and Mortgage Overview in Lovelock
| Characteristic | Without Mortgage | With Mortgage |
| Housing Units | 168 | 161 |
| Median Property Value | $117,900 | $175,500 |
| Median Household Income | $42,647 | $43 |
| Monthly Housing Costs | $339 | $0 |
| Real Estate Taxes | $974 | $0 |
Property Value by Mortgage Status in Lovelock
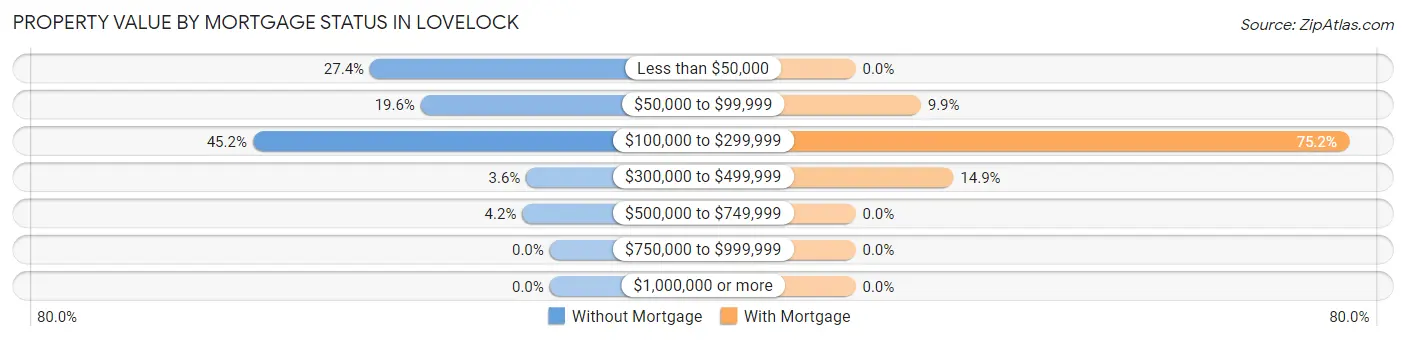
| Property Value | Without Mortgage | With Mortgage |
| Less than $50,000 | 46 (27.4%) | 0 (0.0%) |
| $50,000 to $99,999 | 33 (19.6%) | 16 (9.9%) |
| $100,000 to $299,999 | 76 (45.2%) | 121 (75.2%) |
| $300,000 to $499,999 | 6 (3.6%) | 24 (14.9%) |
| $500,000 to $749,999 | 7 (4.2%) | 0 (0.0%) |
| $750,000 to $999,999 | 0 (0.0%) | 0 (0.0%) |
| $1,000,000 or more | 0 (0.0%) | 0 (0.0%) |
| Total | 168 (100.0%) | 161 (100.0%) |
Household Income by Mortgage Status in Lovelock
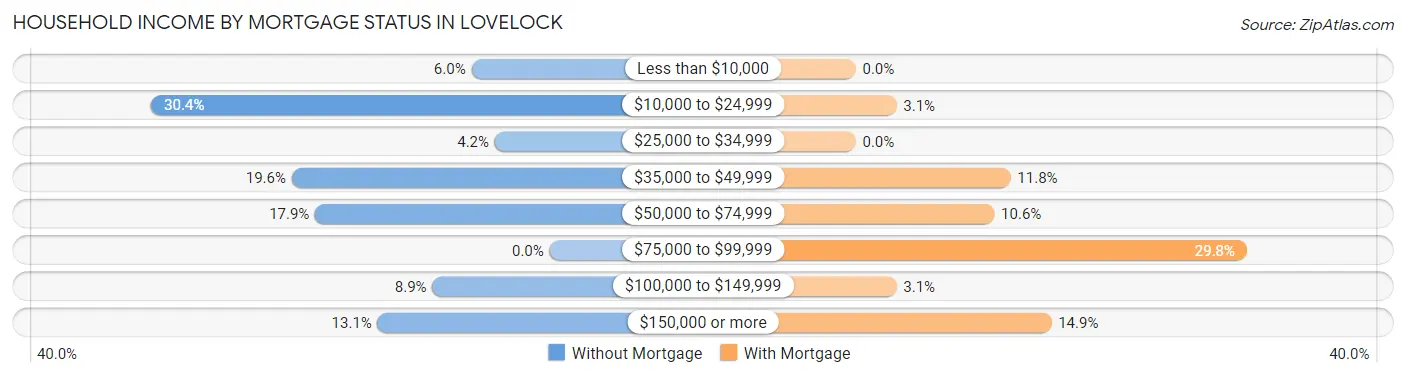
| Household Income | Without Mortgage | With Mortgage |
| Less than $10,000 | 10 (5.9%) | 0 (0.0%) |
| $10,000 to $24,999 | 51 (30.4%) | 5 (3.1%) |
| $25,000 to $34,999 | 7 (4.2%) | 0 (0.0%) |
| $35,000 to $49,999 | 33 (19.6%) | 19 (11.8%) |
| $50,000 to $74,999 | 30 (17.9%) | 17 (10.6%) |
| $75,000 to $99,999 | 0 (0.0%) | 48 (29.8%) |
| $100,000 to $149,999 | 15 (8.9%) | 5 (3.1%) |
| $150,000 or more | 22 (13.1%) | 24 (14.9%) |
| Total | 168 (100.0%) | 161 (100.0%) |
Property Value to Household Income Ratio in Lovelock
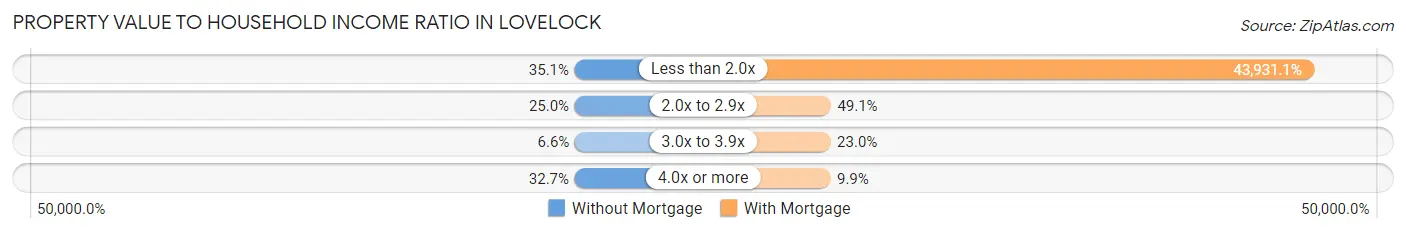
| Value-to-Income Ratio | Without Mortgage | With Mortgage |
| Less than 2.0x | 59 (35.1%) | 70,729 (43,931.1%) |
| 2.0x to 2.9x | 42 (25.0%) | 79 (49.1%) |
| 3.0x to 3.9x | 11 (6.6%) | 37 (23.0%) |
| 4.0x or more | 55 (32.7%) | 16 (9.9%) |
| Total | 168 (100.0%) | 161 (100.0%) |
Real Estate Taxes by Mortgage Status in Lovelock
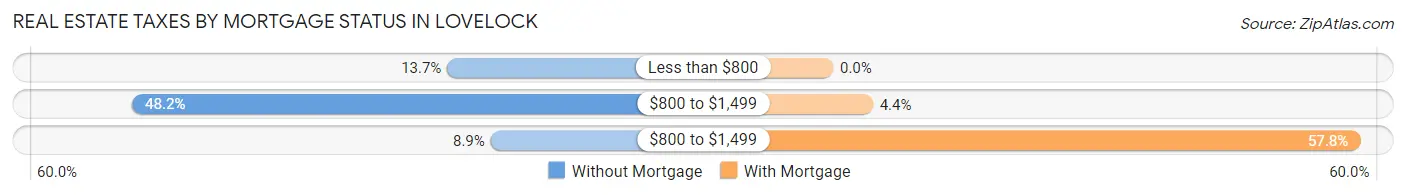
| Property Taxes | Without Mortgage | With Mortgage |
| Less than $800 | 23 (13.7%) | 0 (0.0%) |
| $800 to $1,499 | 81 (48.2%) | 7 (4.3%) |
| $800 to $1,499 | 15 (8.9%) | 93 (57.8%) |
| Total | 168 (100.0%) | 161 (100.0%) |
Health & Disability in Lovelock
Health Insurance Coverage by Age in Lovelock
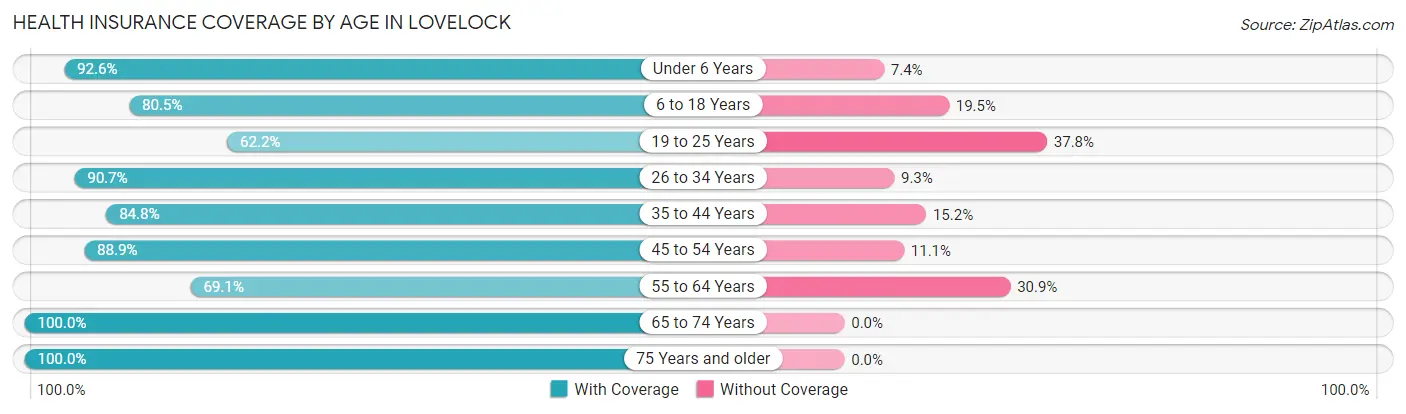
| Age Bracket | With Coverage | Without Coverage |
| Under 6 Years | 138 (92.6%) | 11 (7.4%) |
| 6 to 18 Years | 215 (80.5%) | 52 (19.5%) |
| 19 to 25 Years | 56 (62.2%) | 34 (37.8%) |
| 26 to 34 Years | 186 (90.7%) | 19 (9.3%) |
| 35 to 44 Years | 167 (84.8%) | 30 (15.2%) |
| 45 to 54 Years | 176 (88.9%) | 22 (11.1%) |
| 55 to 64 Years | 154 (69.1%) | 69 (30.9%) |
| 65 to 74 Years | 142 (100.0%) | 0 (0.0%) |
| 75 Years and older | 100 (100.0%) | 0 (0.0%) |
| Total | 1,334 (84.9%) | 237 (15.1%) |
Health Insurance Coverage by Citizenship Status in Lovelock
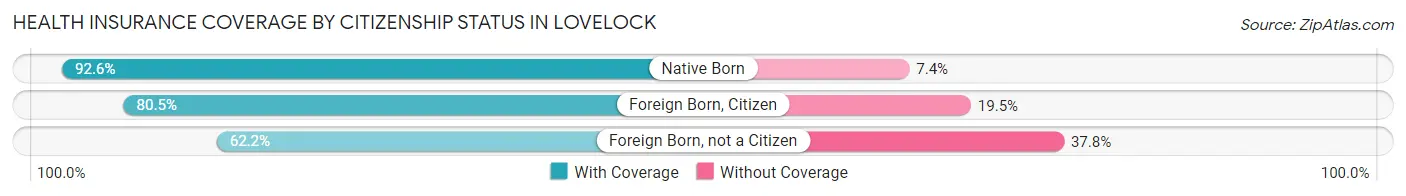
| Citizenship Status | With Coverage | Without Coverage |
| Native Born | 138 (92.6%) | 11 (7.4%) |
| Foreign Born, Citizen | 215 (80.5%) | 52 (19.5%) |
| Foreign Born, not a Citizen | 56 (62.2%) | 34 (37.8%) |
Health Insurance Coverage by Household Income in Lovelock
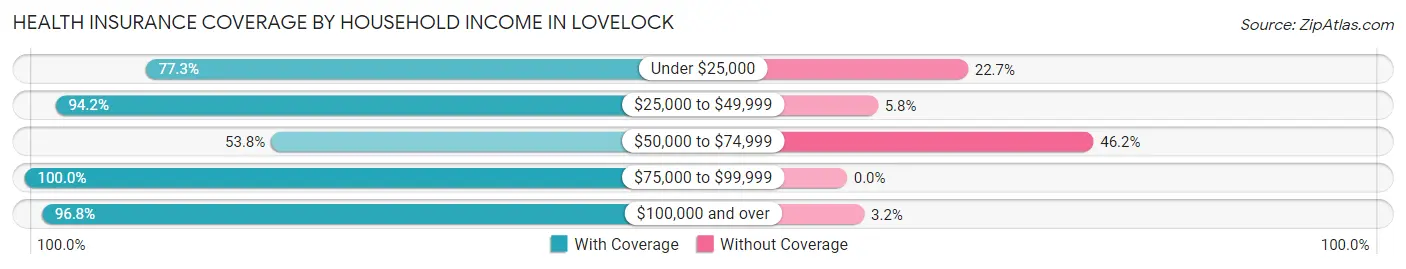
| Household Income | With Coverage | Without Coverage |
| Under $25,000 | 249 (77.3%) | 73 (22.7%) |
| $25,000 to $49,999 | 423 (94.2%) | 26 (5.8%) |
| $50,000 to $74,999 | 148 (53.8%) | 127 (46.2%) |
| $75,000 to $99,999 | 180 (100.0%) | 0 (0.0%) |
| $100,000 and over | 329 (96.8%) | 11 (3.2%) |
Public vs Private Health Insurance Coverage by Age in Lovelock
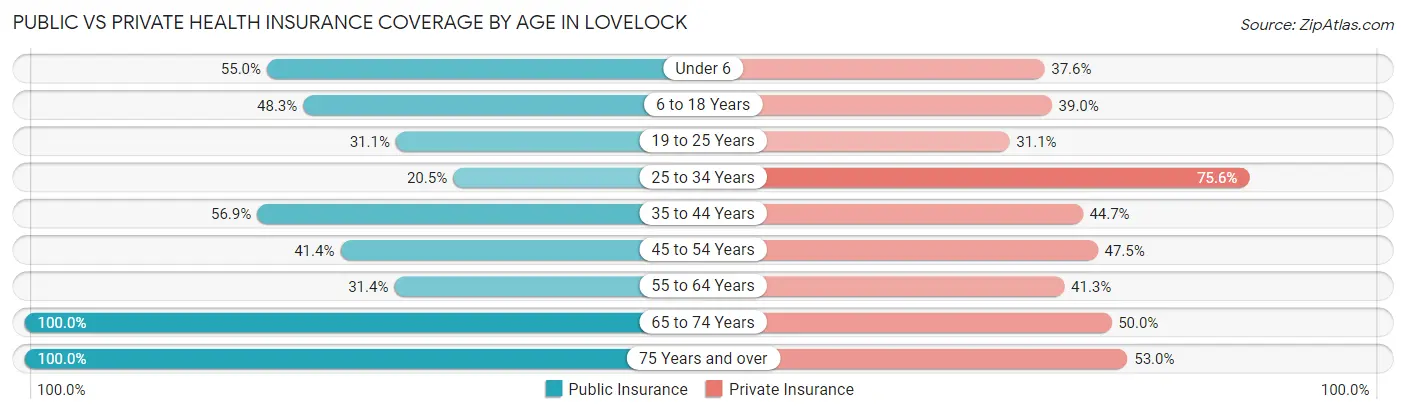
| Age Bracket | Public Insurance | Private Insurance |
| Under 6 | 82 (55.0%) | 56 (37.6%) |
| 6 to 18 Years | 129 (48.3%) | 104 (39.0%) |
| 19 to 25 Years | 28 (31.1%) | 28 (31.1%) |
| 25 to 34 Years | 42 (20.5%) | 155 (75.6%) |
| 35 to 44 Years | 112 (56.9%) | 88 (44.7%) |
| 45 to 54 Years | 82 (41.4%) | 94 (47.5%) |
| 55 to 64 Years | 70 (31.4%) | 92 (41.3%) |
| 65 to 74 Years | 142 (100.0%) | 71 (50.0%) |
| 75 Years and over | 100 (100.0%) | 53 (53.0%) |
| Total | 787 (50.1%) | 741 (47.2%) |
Disability Status by Sex by Age in Lovelock
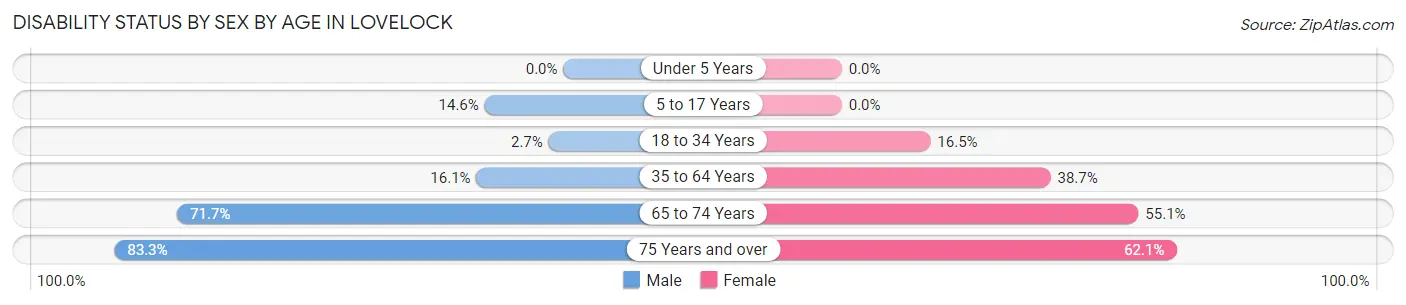
| Age Bracket | Male | Female |
| Under 5 Years | 0 (0.0%) | 0 (0.0%) |
| 5 to 17 Years | 25 (14.6%) | 0 (0.0%) |
| 18 to 34 Years | 4 (2.7%) | 25 (16.5%) |
| 35 to 64 Years | 46 (16.1%) | 129 (38.7%) |
| 65 to 74 Years | 38 (71.7%) | 49 (55.1%) |
| 75 Years and over | 35 (83.3%) | 36 (62.1%) |
Disability Class by Sex by Age in Lovelock
Disability Class: Hearing Difficulty
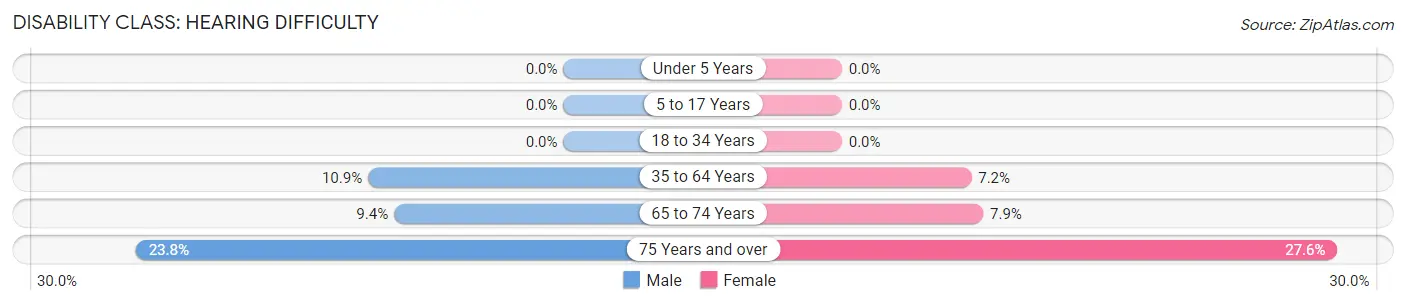
| Age Bracket | Male | Female |
| Under 5 Years | 0 (0.0%) | 0 (0.0%) |
| 5 to 17 Years | 0 (0.0%) | 0 (0.0%) |
| 18 to 34 Years | 0 (0.0%) | 0 (0.0%) |
| 35 to 64 Years | 31 (10.9%) | 24 (7.2%) |
| 65 to 74 Years | 5 (9.4%) | 7 (7.9%) |
| 75 Years and over | 10 (23.8%) | 16 (27.6%) |
Disability Class: Vision Difficulty
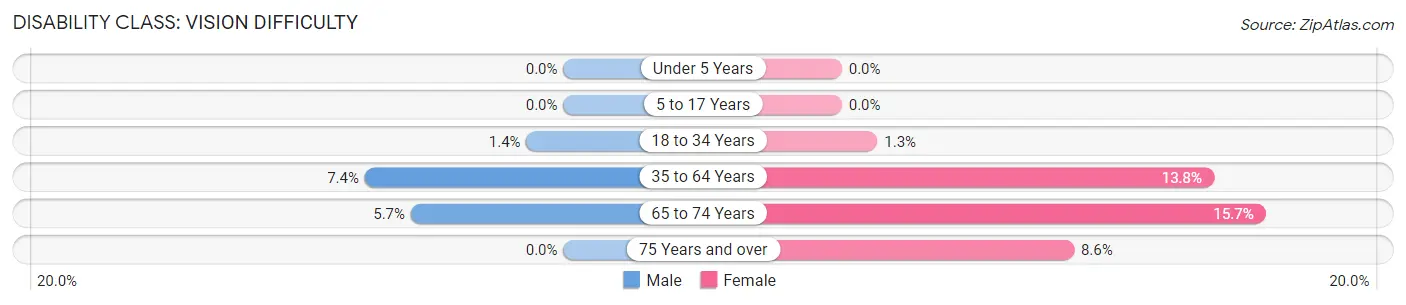
| Age Bracket | Male | Female |
| Under 5 Years | 0 (0.0%) | 0 (0.0%) |
| 5 to 17 Years | 0 (0.0%) | 0 (0.0%) |
| 18 to 34 Years | 2 (1.4%) | 2 (1.3%) |
| 35 to 64 Years | 21 (7.4%) | 46 (13.8%) |
| 65 to 74 Years | 3 (5.7%) | 14 (15.7%) |
| 75 Years and over | 0 (0.0%) | 5 (8.6%) |
Disability Class: Cognitive Difficulty
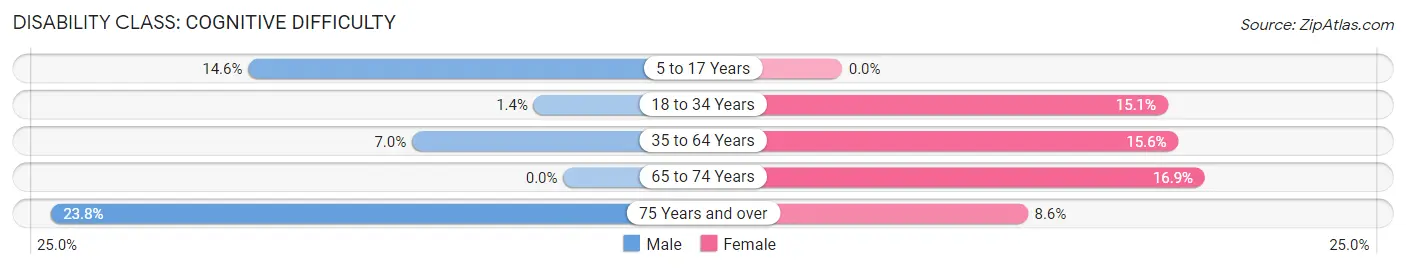
| Age Bracket | Male | Female |
| 5 to 17 Years | 25 (14.6%) | 0 (0.0%) |
| 18 to 34 Years | 2 (1.4%) | 23 (15.1%) |
| 35 to 64 Years | 20 (7.0%) | 52 (15.6%) |
| 65 to 74 Years | 0 (0.0%) | 15 (16.9%) |
| 75 Years and over | 10 (23.8%) | 5 (8.6%) |
Disability Class: Ambulatory Difficulty
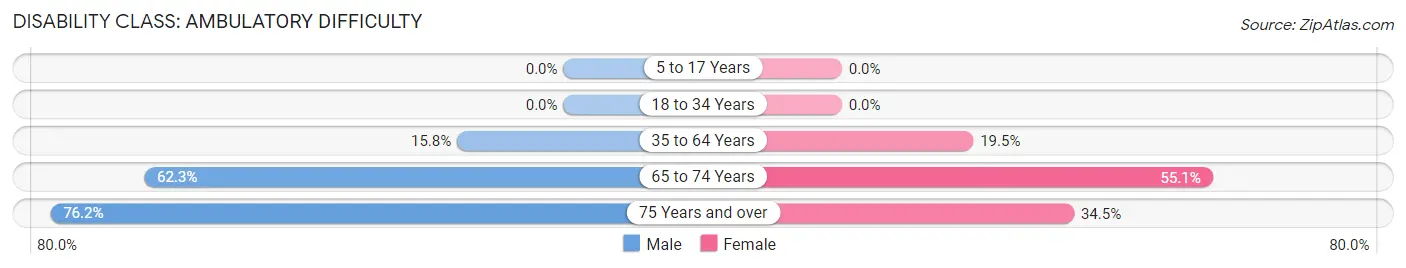
| Age Bracket | Male | Female |
| 5 to 17 Years | 0 (0.0%) | 0 (0.0%) |
| 18 to 34 Years | 0 (0.0%) | 0 (0.0%) |
| 35 to 64 Years | 45 (15.8%) | 65 (19.5%) |
| 65 to 74 Years | 33 (62.3%) | 49 (55.1%) |
| 75 Years and over | 32 (76.2%) | 20 (34.5%) |
Disability Class: Self-Care Difficulty
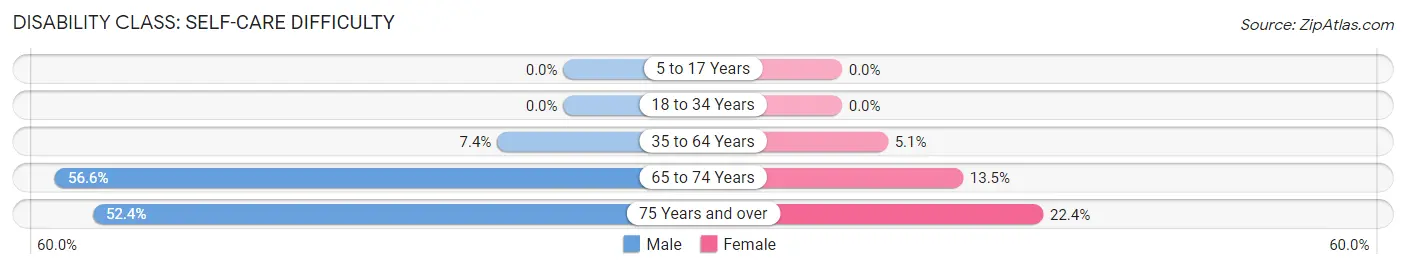
| Age Bracket | Male | Female |
| 5 to 17 Years | 0 (0.0%) | 0 (0.0%) |
| 18 to 34 Years | 0 (0.0%) | 0 (0.0%) |
| 35 to 64 Years | 21 (7.4%) | 17 (5.1%) |
| 65 to 74 Years | 30 (56.6%) | 12 (13.5%) |
| 75 Years and over | 22 (52.4%) | 13 (22.4%) |
Technology Access in Lovelock
Computing Device Access in Lovelock
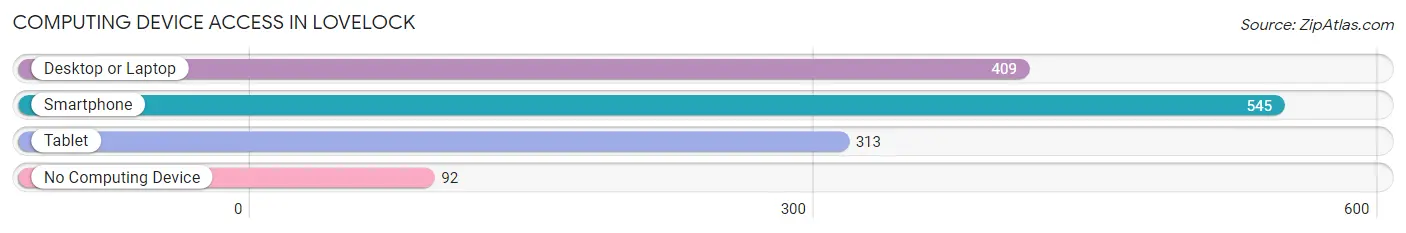
| Device Type | # Households | % Households |
| Desktop or Laptop | 409 | 60.7% |
| Smartphone | 545 | 80.9% |
| Tablet | 313 | 46.4% |
| No Computing Device | 92 | 13.7% |
| Total | 674 | 100.0% |
Internet Access in Lovelock
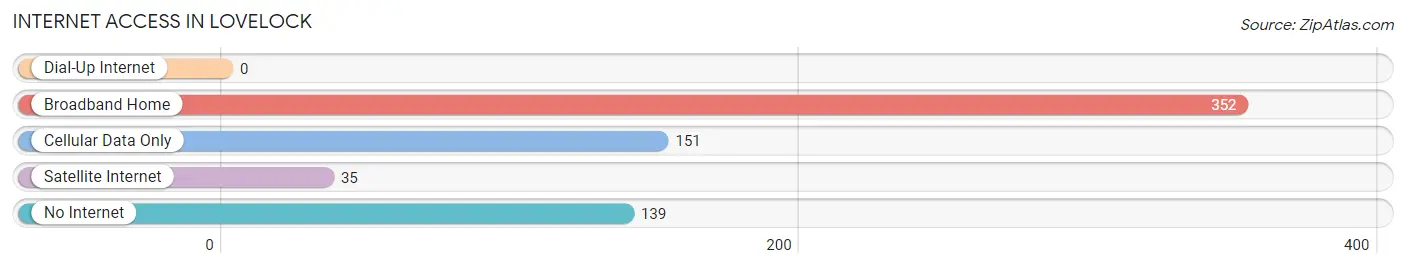
| Internet Type | # Households | % Households |
| Dial-Up Internet | 0 | 0.0% |
| Broadband Home | 352 | 52.2% |
| Cellular Data Only | 151 | 22.4% |
| Satellite Internet | 35 | 5.2% |
| No Internet | 139 | 20.6% |
| Total | 674 | 100.0% |
Lovelock Summary
Lovelock is a small city located in the western part of Nevada, in the county of Pershing. It is situated in the Humboldt River Valley, about 90 miles east of Reno and about 100 miles northeast of Carson City. The city is located at the intersection of Interstate 80 and U.S. Route 95. The population of Lovelock was 2,003 at the 2010 census.
History
The area around Lovelock was first inhabited by the Northern Paiute people. The first European settlers arrived in the area in the late 19th century. The city was founded in 1868 by a rancher named George Lovelock, who named the city after himself. The city was incorporated in 1917.
In the early 20th century, Lovelock was a major stop on the transcontinental railroad. The city was also a major hub for the mining industry, with several gold and silver mines in the area.
Geography
Lovelock is located in the Humboldt River Valley, at the intersection of Interstate 80 and U.S. Route 95. The city is situated at an elevation of 4,077 feet (1,243 m). The city covers an area of 4.2 square miles (10.8 km2).
The climate in Lovelock is semi-arid, with hot summers and cold winters. The average annual temperature is 54 °F (12 °C). The average annual precipitation is 6.5 inches (165 mm).
Economy
The economy of Lovelock is largely based on agriculture and mining. The city is home to several large farms, which produce a variety of crops, including alfalfa, hay, wheat, and barley. The city is also home to several gold and silver mines.
The city is also home to several manufacturing companies, including a factory that produces plastic products. The city is also home to several retail stores, restaurants, and hotels.
Demographics
As of the 2010 census, the population of Lovelock was 2,003. The racial makeup of the city was 79.3% White, 0.7% African American, 1.2% Native American, 0.3% Asian, 0.1% Pacific Islander, 16.2% from other races, and 2.4% from two or more races. Hispanic or Latino of any race were 28.2% of the population.
The median income for a household in Lovelock was $37,917, and the median income for a family was $45,313. The per capita income for the city was $18,945. About 16.2% of families and 20.2% of the population were below the poverty line, including 28.2% of those under age 18 and 8.3% of those age 65 or over.
Common Questions
What is Per Capita Income in Lovelock?
Per Capita income in Lovelock is $25,484.
What is the Median Family Income in Lovelock?
Median Family Income in Lovelock is $59,167.
What is the Median Household income in Lovelock?
Median Household Income in Lovelock is $42,955.
What is Income or Wage Gap in Lovelock?
Income or Wage Gap in Lovelock is 46.5%.
Women in Lovelock earn 53.5 cents for every dollar earned by a man.
What is Inequality or Gini Index in Lovelock?
Inequality or Gini Index in Lovelock is 0.47.
What is the Total Population of Lovelock?
Total Population of Lovelock is 1,675.
What is the Total Male Population of Lovelock?
Total Male Population of Lovelock is 828.
What is the Total Female Population of Lovelock?
Total Female Population of Lovelock is 847.
What is the Ratio of Males per 100 Females in Lovelock?
There are 97.76 Males per 100 Females in Lovelock.
What is the Ratio of Females per 100 Males in Lovelock?
There are 102.29 Females per 100 Males in Lovelock.
What is the Median Population Age in Lovelock?
Median Population Age in Lovelock is 39.4 Years.
What is the Average Family Size in Lovelock
Average Family Size in Lovelock is 3.2 People.
What is the Average Household Size in Lovelock
Average Household Size in Lovelock is 2.3 People.
How Large is the Labor Force in Lovelock?
There are 680 People in the Labor Forcein in Lovelock.
What is the Percentage of People in the Labor Force in Lovelock?
52.3% of People are in the Labor Force in Lovelock.
What is the Unemployment Rate in Lovelock?
Unemployment Rate in Lovelock is 14.2%.