West Wendover, NV Map & Demographics
West Wendover Map
West Wendover Overview
$28,708
PER CAPITA INCOME
$81,509
AVG FAMILY INCOME
$80,342
AVG HOUSEHOLD INCOME
51.5%
WAGE / INCOME GAP [ % ]
48.5¢/ $1
WAGE / INCOME GAP [ $ ]
0.35
INEQUALITY / GINI INDEX
4,513
TOTAL POPULATION
2,078
MALE POPULATION
2,435
FEMALE POPULATION
85.34
MALES / 100 FEMALES
117.18
FEMALES / 100 MALES
33.9
MEDIAN AGE
3.1
AVG FAMILY SIZE
2.5
AVG HOUSEHOLD SIZE
2,490
LABOR FORCE [ PEOPLE ]
79.0%
PERCENT IN LABOR FORCE
3.0%
UNEMPLOYMENT RATE
West Wendover Zip Codes
West Wendover Area Codes
Income in West Wendover
Income Overview in West Wendover
Per Capita Income in West Wendover is $28,708, while median incomes of families and households are $81,509 and $80,342 respectively.
| Characteristic | Number | Measure |
| Per Capita Income | 4,513 | $28,708 |
| Median Family Income | 1,289 | $81,509 |
| Mean Family Income | 1,289 | $88,693 |
| Median Household Income | 1,771 | $80,342 |
| Mean Household Income | 1,771 | $73,955 |
| Income Deficit | 1,289 | $0 |
| Wage / Income Gap (%) | 4,513 | 51.50% |
| Wage / Income Gap ($) | 4,513 | 48.50¢ per $1 |
| Gini / Inequality Index | 4,513 | 0.35 |
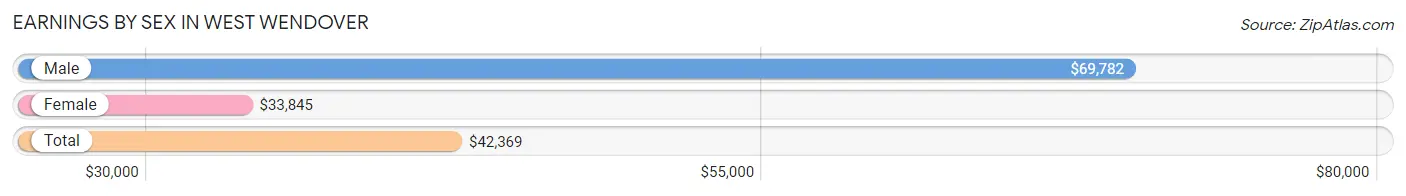
Earnings by Sex in West Wendover
Average Earnings in West Wendover are $42,369, $69,782 for men and $33,845 for women, a difference of 51.5%.
| Sex | Number | Average Earnings |
| Male | 1,423 (58.9%) | $69,782 |
| Female | 992 (41.1%) | $33,845 |
| Total | 2,415 (100.0%) | $42,369 |
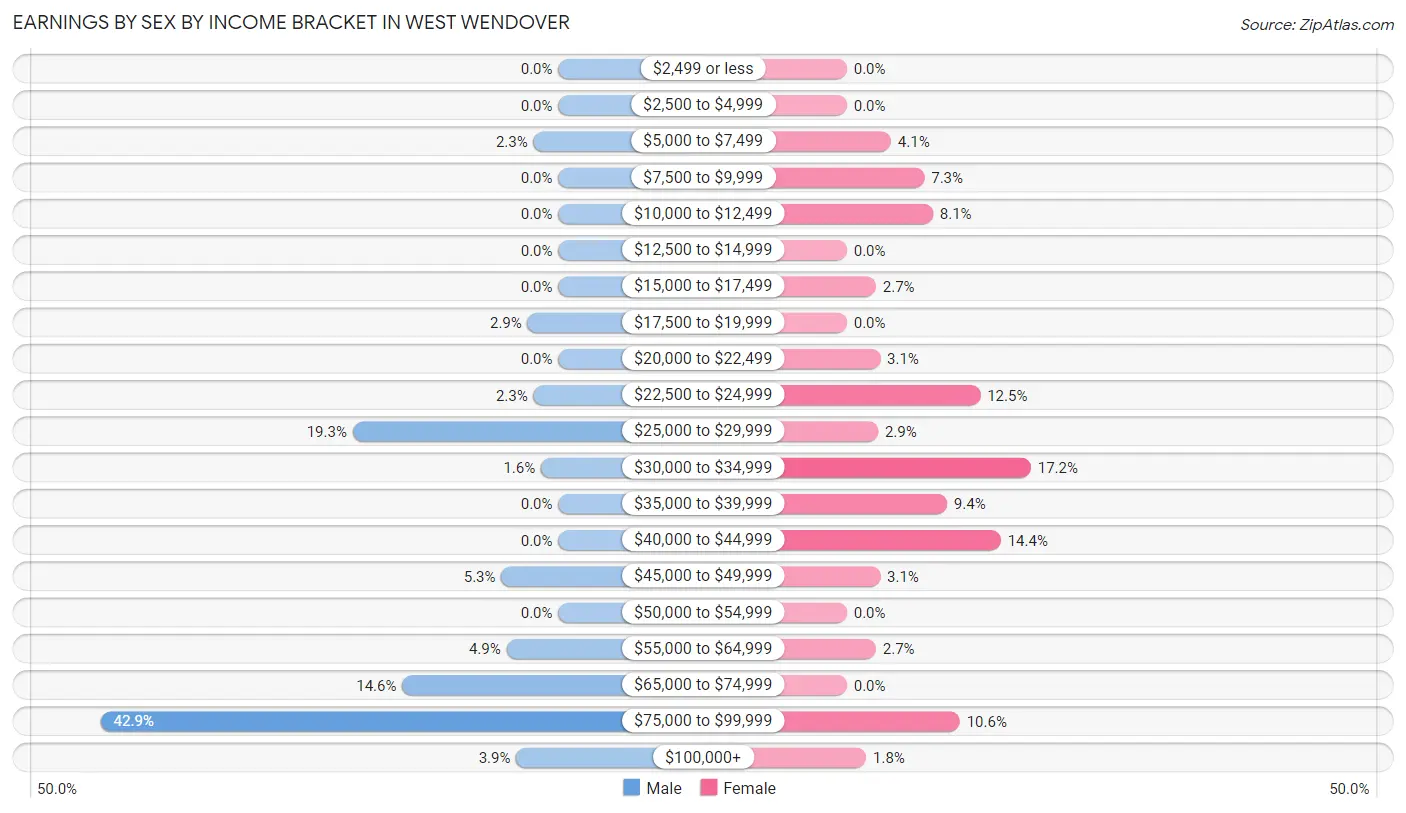
Earnings by Sex by Income Bracket in West Wendover
The most common earnings brackets in West Wendover are $75,000 to $99,999 for men (610 | 42.9%) and $30,000 to $34,999 for women (171 | 17.2%).
| Income | Male | Female |
| $2,499 or less | 0 (0.0%) | 0 (0.0%) |
| $2,500 to $4,999 | 0 (0.0%) | 0 (0.0%) |
| $5,000 to $7,499 | 33 (2.3%) | 41 (4.1%) |
| $7,500 to $9,999 | 0 (0.0%) | 72 (7.3%) |
| $10,000 to $12,499 | 0 (0.0%) | 80 (8.1%) |
| $12,500 to $14,999 | 0 (0.0%) | 0 (0.0%) |
| $15,000 to $17,499 | 0 (0.0%) | 27 (2.7%) |
| $17,500 to $19,999 | 41 (2.9%) | 0 (0.0%) |
| $20,000 to $22,499 | 0 (0.0%) | 31 (3.1%) |
| $22,500 to $24,999 | 33 (2.3%) | 124 (12.5%) |
| $25,000 to $29,999 | 274 (19.3%) | 29 (2.9%) |
| $30,000 to $34,999 | 23 (1.6%) | 171 (17.2%) |
| $35,000 to $39,999 | 0 (0.0%) | 93 (9.4%) |
| $40,000 to $44,999 | 0 (0.0%) | 143 (14.4%) |
| $45,000 to $49,999 | 76 (5.3%) | 31 (3.1%) |
| $50,000 to $54,999 | 0 (0.0%) | 0 (0.0%) |
| $55,000 to $64,999 | 69 (4.9%) | 27 (2.7%) |
| $65,000 to $74,999 | 208 (14.6%) | 0 (0.0%) |
| $75,000 to $99,999 | 610 (42.9%) | 105 (10.6%) |
| $100,000+ | 56 (3.9%) | 18 (1.8%) |
| Total | 1,423 (100.0%) | 992 (100.0%) |
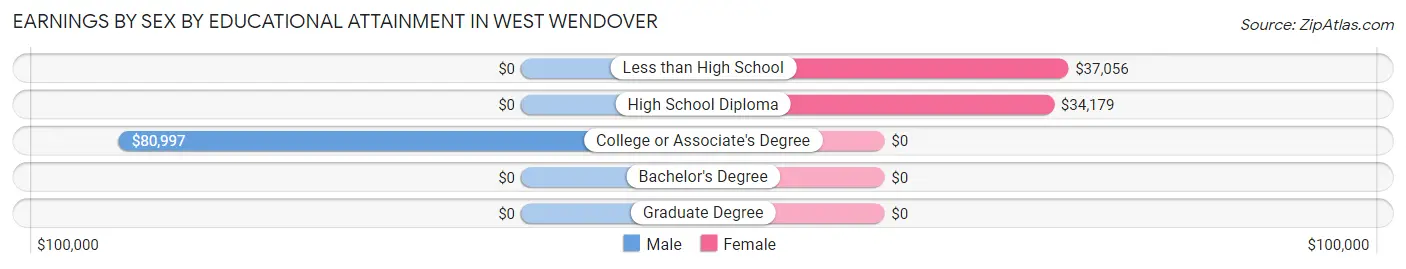
Earnings by Sex by Educational Attainment in West Wendover
Average earnings in West Wendover are $69,782 for men and $36,667 for women, a difference of 47.4%. Men with an educational attainment of college or associate's degree enjoy the highest average annual earnings of $80,997, while those with college or associate's degree education earn the least with $80,997. Women with an educational attainment of less than high school earn the most with the average annual earnings of $37,056, while those with high school diploma education have the smallest earnings of $34,179.
| Educational Attainment | Male Income | Female Income |
| Less than High School | - | - |
| High School Diploma | - | - |
| College or Associate's Degree | $80,997 | $0 |
| Bachelor's Degree | - | - |
| Graduate Degree | - | - |
| Total | $69,782 | $36,667 |
Family Income in West Wendover
Family Income Brackets in West Wendover
According to the West Wendover family income data, there are 625 families falling into the $75,000 to $99,999 income range, which is the most common income bracket and makes up 48.5% of all families.
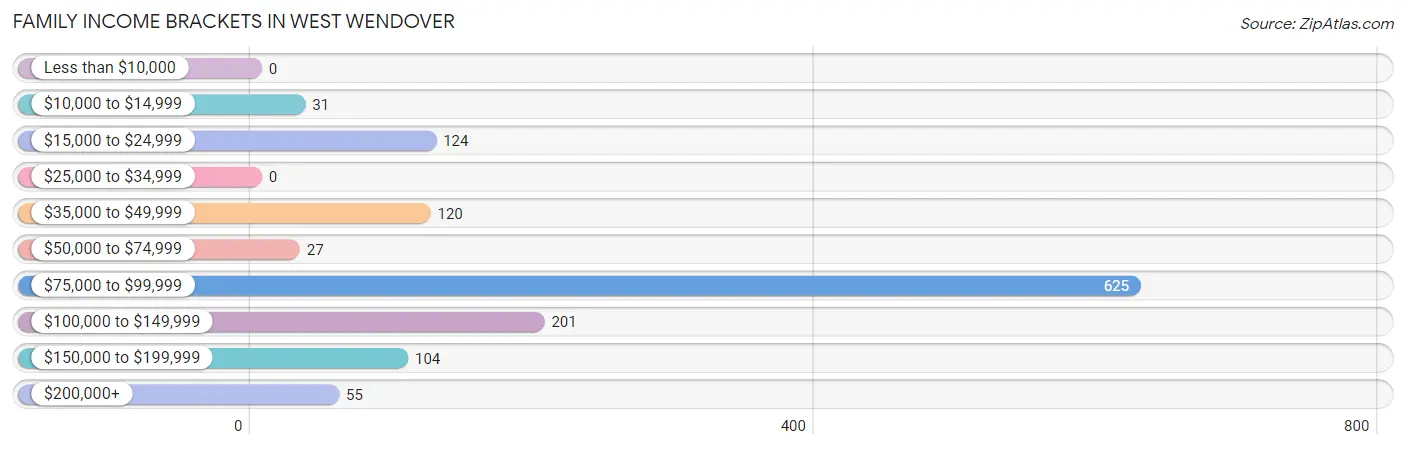
| Income Bracket | # Families | % Families |
| Less than $10,000 | 0 | 0.0% |
| $10,000 to $14,999 | 31 | 2.4% |
| $15,000 to $24,999 | 124 | 9.6% |
| $25,000 to $34,999 | 0 | 0.0% |
| $35,000 to $49,999 | 120 | 9.3% |
| $50,000 to $74,999 | 27 | 2.1% |
| $75,000 to $99,999 | 625 | 48.5% |
| $100,000 to $149,999 | 201 | 15.6% |
| $150,000 to $199,999 | 104 | 8.1% |
| $200,000+ | 55 | 4.3% |
Family Income by Famaliy Size in West Wendover
2-person families (557 | 43.2%) account for the highest median family income in West Wendover with $96,743 per family, while 2-person families (557 | 43.2%) have the highest median income of $48,372 per family member.
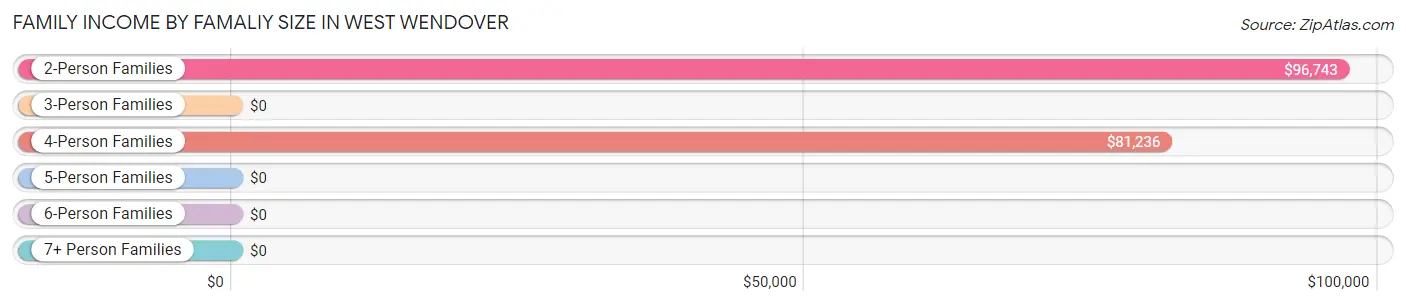
| Income Bracket | # Families | Median Income |
| 2-Person Families | 557 (43.2%) | $96,743 |
| 3-Person Families | 0 (0.0%) | $0 |
| 4-Person Families | 590 (45.8%) | $81,236 |
| 5-Person Families | 50 (3.9%) | $0 |
| 6-Person Families | 38 (2.9%) | $0 |
| 7+ Person Families | 54 (4.2%) | $0 |
| Total | 1,289 (100.0%) | $81,509 |
Family Income by Number of Earners in West Wendover
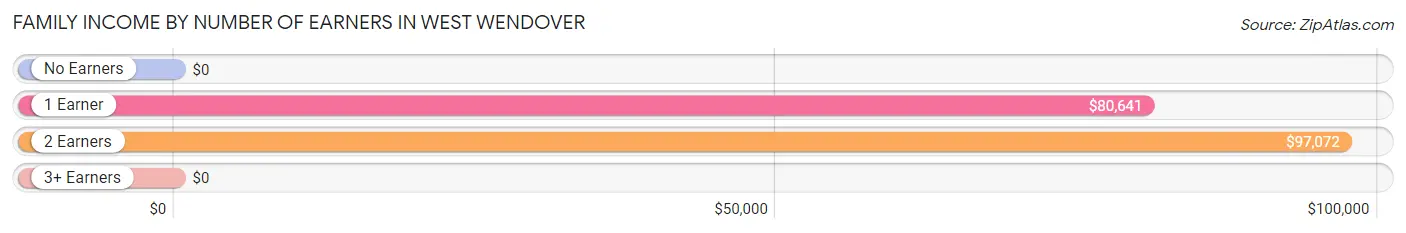
| Number of Earners | # Families | Median Income |
| No Earners | 0 (0.0%) | $0 |
| 1 Earner | 647 (50.2%) | $80,641 |
| 2 Earners | 547 (42.4%) | $97,072 |
| 3+ Earners | 95 (7.4%) | $0 |
| Total | 1,289 (100.0%) | $81,509 |
Household Income in West Wendover
Household Income Brackets in West Wendover
With 625 households falling in the category, the $75,000 to $99,999 income range is the most frequent in West Wendover, accounting for 35.3% of all households. In contrast, only 35 households (2.0%) fall into the less than $10,000 income bracket, making it the least populous group.
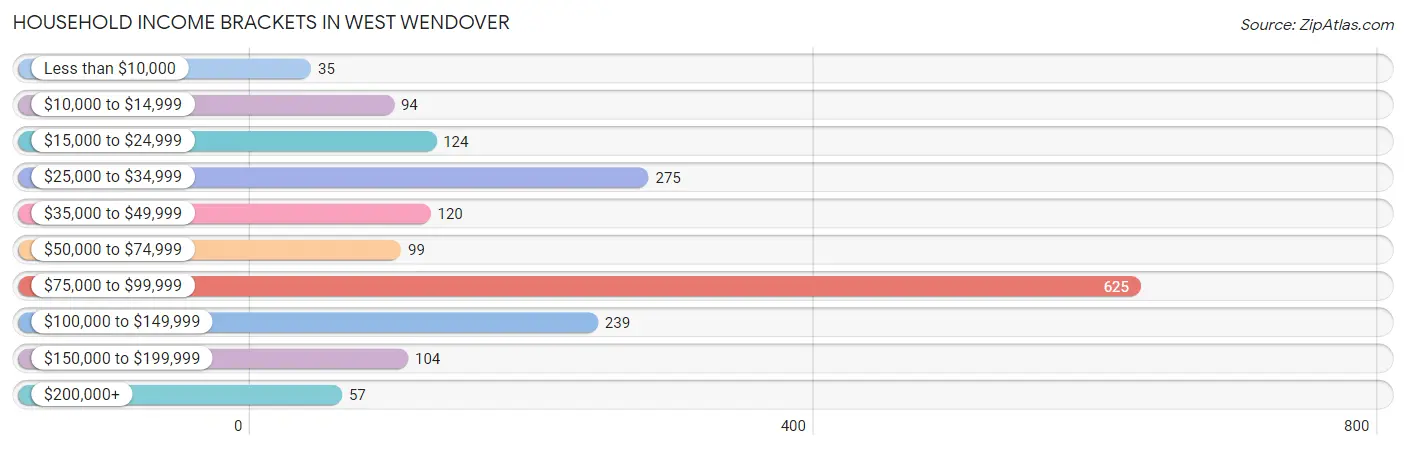
| Income Bracket | # Households | % Households |
| Less than $10,000 | 35 | 2.0% |
| $10,000 to $14,999 | 94 | 5.3% |
| $15,000 to $24,999 | 124 | 7.0% |
| $25,000 to $34,999 | 275 | 15.5% |
| $35,000 to $49,999 | 120 | 6.8% |
| $50,000 to $74,999 | 99 | 5.6% |
| $75,000 to $99,999 | 625 | 35.3% |
| $100,000 to $149,999 | 239 | 13.5% |
| $150,000 to $199,999 | 104 | 5.9% |
| $200,000+ | 57 | 3.2% |
Household Income by Householder Age in West Wendover
The median household income in West Wendover is $80,342, with the highest median household income of $100,617 found in the 45 to 64 years age bracket for the primary householder. A total of 653 households (36.9%) fall into this category. Meanwhile, the 15 to 24 years age bracket for the primary householder has the lowest median household income of $0, with 80 households (4.5%) in this group.
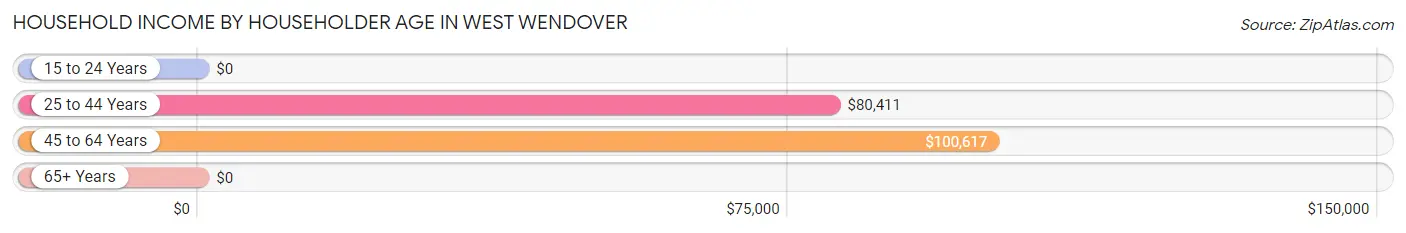
| Income Bracket | # Households | Median Income |
| 15 to 24 Years | 80 (4.5%) | $0 |
| 25 to 44 Years | 979 (55.3%) | $80,411 |
| 45 to 64 Years | 653 (36.9%) | $100,617 |
| 65+ Years | 59 (3.3%) | $0 |
| Total | 1,771 (100.0%) | $80,342 |
Poverty in West Wendover
Income Below Poverty by Sex and Age in West Wendover
With 11.1% poverty level for males and 10.3% for females among the residents of West Wendover, 6 to 11 year old males and under 5 year old females are the most vulnerable to poverty, with 89 males (68.5%) and 57 females (65.5%) in their respective age groups living below the poverty level.
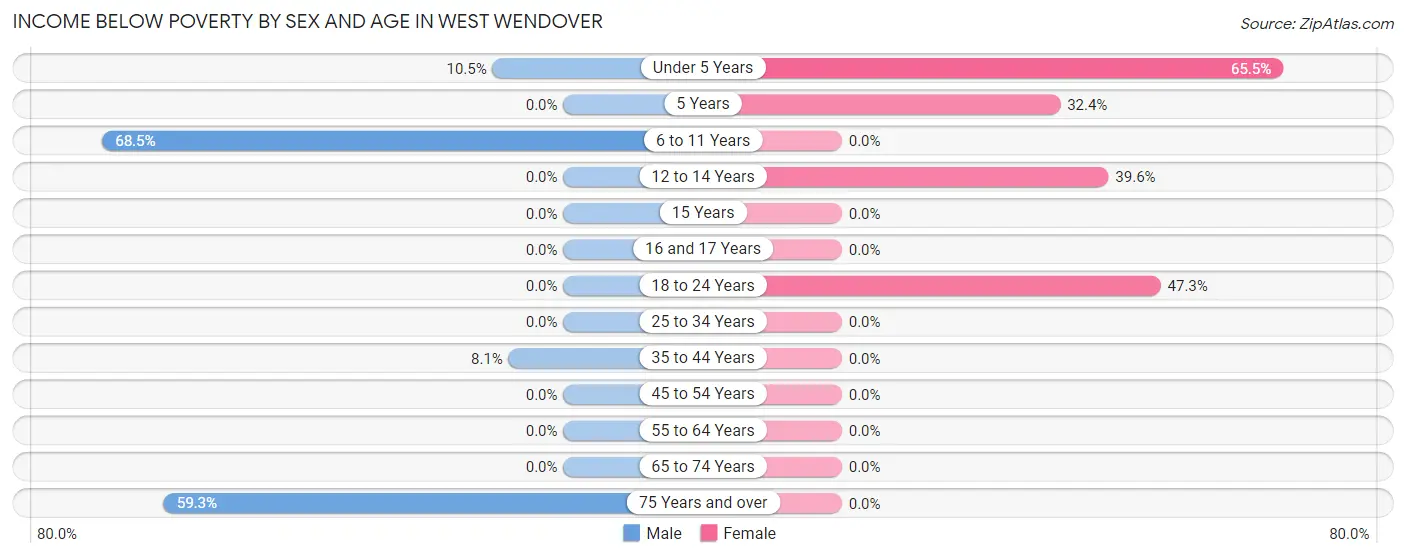
| Age Bracket | Male | Female |
| Under 5 Years | 37 (10.5%) | 57 (65.5%) |
| 5 Years | 0 (0.0%) | 36 (32.4%) |
| 6 to 11 Years | 89 (68.5%) | 0 (0.0%) |
| 12 to 14 Years | 0 (0.0%) | 78 (39.6%) |
| 15 Years | 0 (0.0%) | 0 (0.0%) |
| 16 and 17 Years | 0 (0.0%) | 0 (0.0%) |
| 18 to 24 Years | 0 (0.0%) | 80 (47.3%) |
| 25 to 34 Years | 0 (0.0%) | 0 (0.0%) |
| 35 to 44 Years | 69 (8.1%) | 0 (0.0%) |
| 45 to 54 Years | 0 (0.0%) | 0 (0.0%) |
| 55 to 64 Years | 0 (0.0%) | 0 (0.0%) |
| 65 to 74 Years | 0 (0.0%) | 0 (0.0%) |
| 75 Years and over | 35 (59.3%) | 0 (0.0%) |
| Total | 230 (11.1%) | 251 (10.3%) |
Income Above Poverty by Sex and Age in West Wendover
According to the poverty statistics in West Wendover, males aged 16 and 17 years and females aged 6 to 11 years are the age groups that are most secure financially, with 100.0% of males and 100.0% of females in these age groups living above the poverty line.
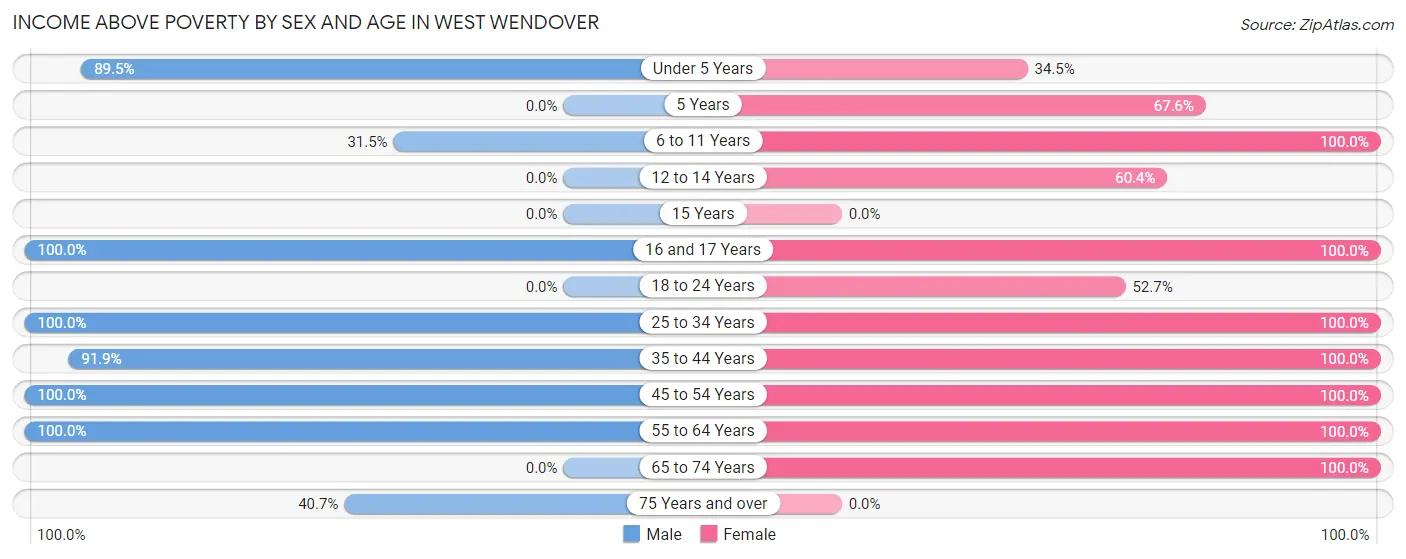
| Age Bracket | Male | Female |
| Under 5 Years | 315 (89.5%) | 30 (34.5%) |
| 5 Years | 0 (0.0%) | 75 (67.6%) |
| 6 to 11 Years | 41 (31.5%) | 484 (100.0%) |
| 12 to 14 Years | 0 (0.0%) | 119 (60.4%) |
| 15 Years | 0 (0.0%) | 0 (0.0%) |
| 16 and 17 Years | 45 (100.0%) | 113 (100.0%) |
| 18 to 24 Years | 0 (0.0%) | 89 (52.7%) |
| 25 to 34 Years | 37 (100.0%) | 553 (100.0%) |
| 35 to 44 Years | 781 (91.9%) | 54 (100.0%) |
| 45 to 54 Years | 372 (100.0%) | 434 (100.0%) |
| 55 to 64 Years | 233 (100.0%) | 163 (100.0%) |
| 65 to 74 Years | 0 (0.0%) | 70 (100.0%) |
| 75 Years and over | 24 (40.7%) | 0 (0.0%) |
| Total | 1,848 (88.9%) | 2,184 (89.7%) |
Income Below Poverty Among Married-Couple Families in West Wendover
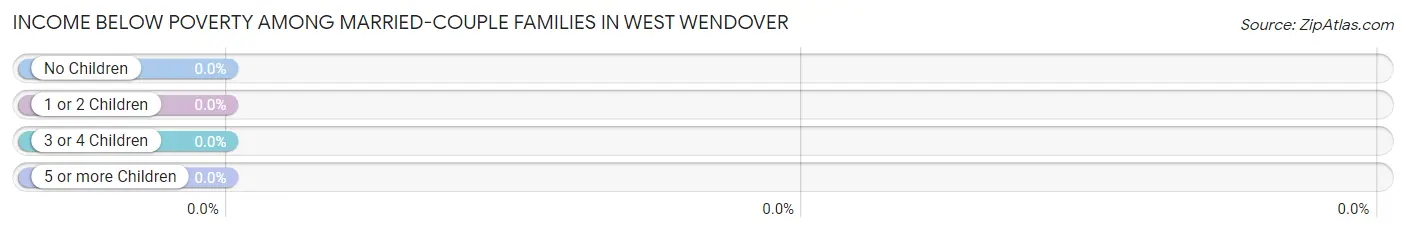
| Children | Above Poverty | Below Poverty |
| No Children | 389 (100.0%) | 0 (0.0%) |
| 1 or 2 Children | 560 (100.0%) | 0 (0.0%) |
| 3 or 4 Children | 92 (100.0%) | 0 (0.0%) |
| 5 or more Children | 0 (0.0%) | 0 (0.0%) |
| Total | 1,041 (100.0%) | 0 (0.0%) |
Income Below Poverty Among Single-Parent Households in West Wendover
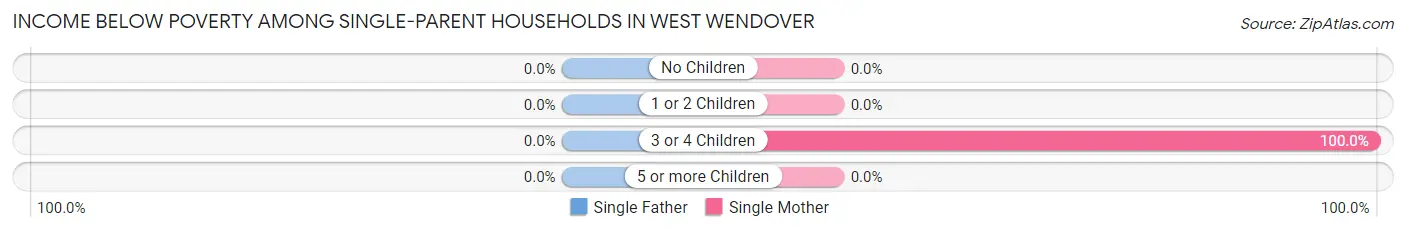
| Children | Single Father | Single Mother |
| No Children | 0 (0.0%) | 0 (0.0%) |
| 1 or 2 Children | 0 (0.0%) | 0 (0.0%) |
| 3 or 4 Children | 0 (0.0%) | 80 (100.0%) |
| 5 or more Children | 0 (0.0%) | 0 (0.0%) |
| Total | 0 (0.0%) | 80 (32.3%) |
Income Below Poverty Among Married-Couple vs Single-Parent Households in West Wendover
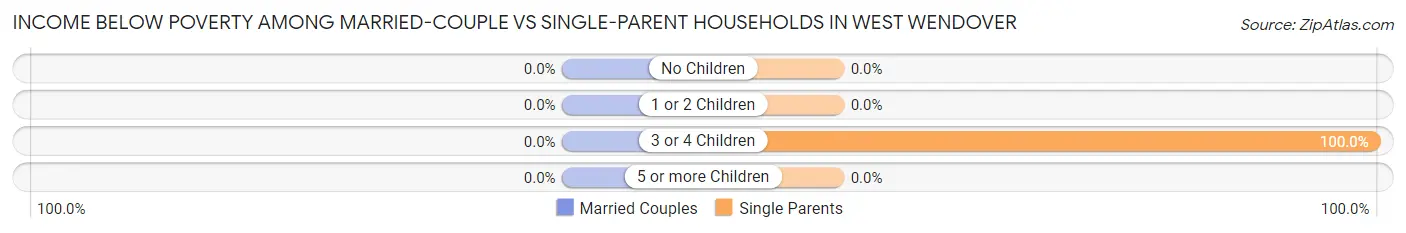
| Children | Married-Couple Families | Single-Parent Households |
| No Children | 0 (0.0%) | 0 (0.0%) |
| 1 or 2 Children | 0 (0.0%) | 0 (0.0%) |
| 3 or 4 Children | 0 (0.0%) | 80 (100.0%) |
| 5 or more Children | 0 (0.0%) | 0 (0.0%) |
| Total | 0 (0.0%) | 80 (32.3%) |
Race in West Wendover
The most populous races in West Wendover are White / Caucasian (2,938 | 65.1%), Hispanic or Latino (2,268 | 50.2%), and Two or more Races (1,130 | 25.0%).
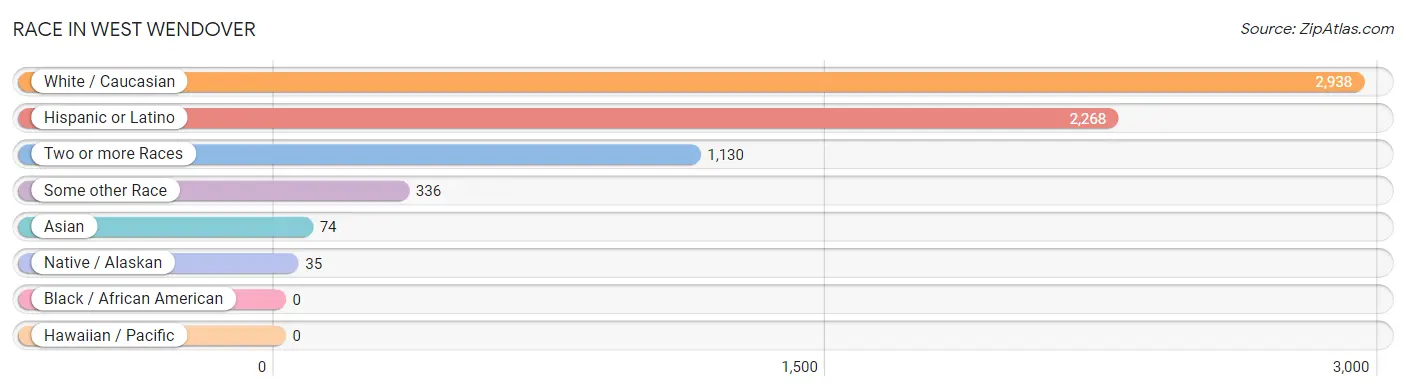
| Race | # Population | % Population |
| Asian | 74 | 1.6% |
| Black / African American | 0 | 0.0% |
| Hawaiian / Pacific | 0 | 0.0% |
| Hispanic or Latino | 2,268 | 50.2% |
| Native / Alaskan | 35 | 0.8% |
| White / Caucasian | 2,938 | 65.1% |
| Two or more Races | 1,130 | 25.0% |
| Some other Race | 336 | 7.4% |
| Total | 4,513 | 100.0% |
Ancestry in West Wendover
The most populous ancestries reported in West Wendover are Mexican (2,230 | 49.4%), European (233 | 5.2%), German (205 | 4.5%), Irish (106 | 2.4%), and Dutch (105 | 2.3%), together accounting for 63.8% of all West Wendover residents.
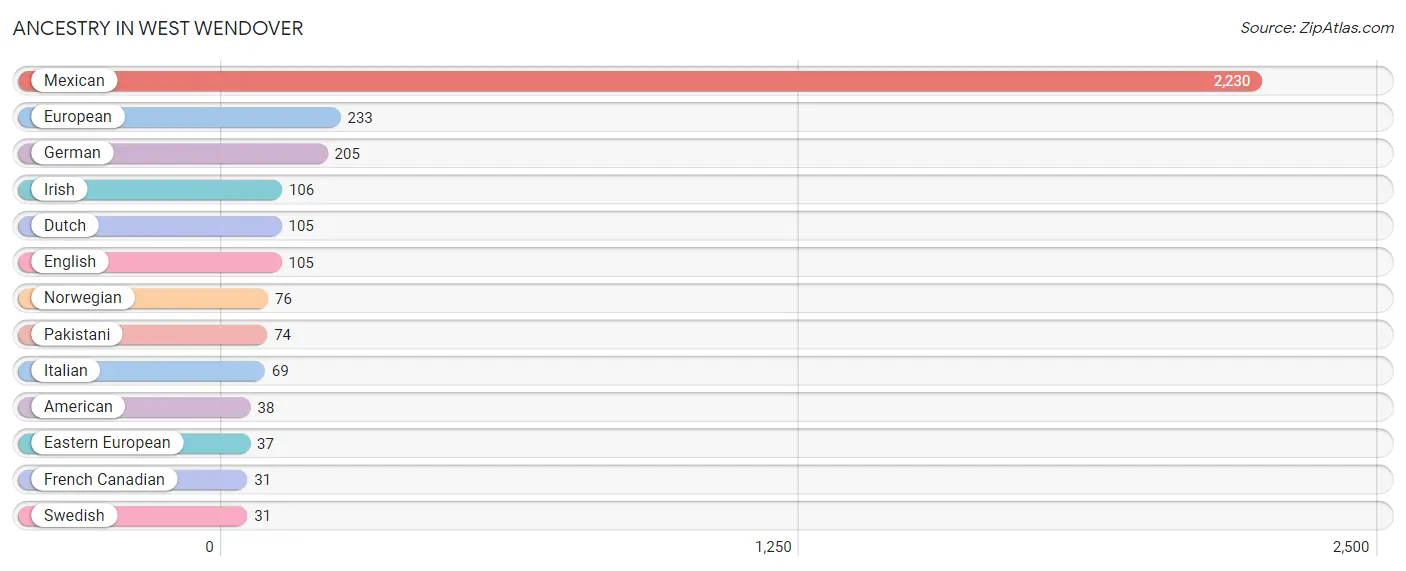
| Ancestry | # Population | % Population |
| American | 38 | 0.8% |
| Dutch | 105 | 2.3% |
| Eastern European | 37 | 0.8% |
| English | 105 | 2.3% |
| European | 233 | 5.2% |
| French Canadian | 31 | 0.7% |
| German | 205 | 4.5% |
| Irish | 106 | 2.4% |
| Italian | 69 | 1.5% |
| Mexican | 2,230 | 49.4% |
| Norwegian | 76 | 1.7% |
| Pakistani | 74 | 1.6% |
| Swedish | 31 | 0.7% | View All 13 Rows |
Immigrants in West Wendover
The most numerous immigrant groups reported in West Wendover came from Central America (772 | 17.1%), Latin America (772 | 17.1%), Mexico (772 | 17.1%), Asia (74 | 1.6%), and South Eastern Asia (74 | 1.6%), together accounting for 54.6% of all West Wendover residents.
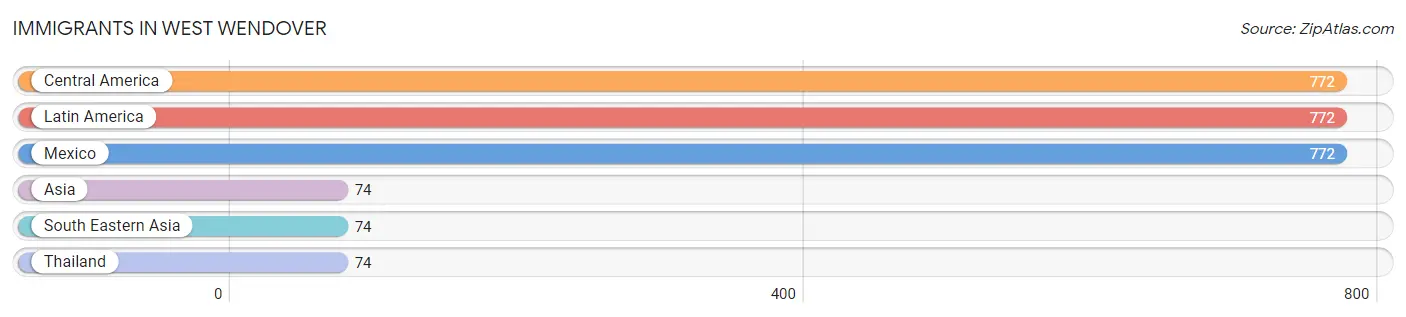
| Immigration Origin | # Population | % Population |
| Asia | 74 | 1.6% |
| Central America | 772 | 17.1% |
| Latin America | 772 | 17.1% |
| Mexico | 772 | 17.1% |
| South Eastern Asia | 74 | 1.6% |
| Thailand | 74 | 1.6% | View All 6 Rows |
Sex and Age in West Wendover
Sex and Age in West Wendover
The most populous age groups in West Wendover are 35 to 39 Years (850 | 40.9%) for men and 5 to 9 Years (595 | 24.4%) for women.
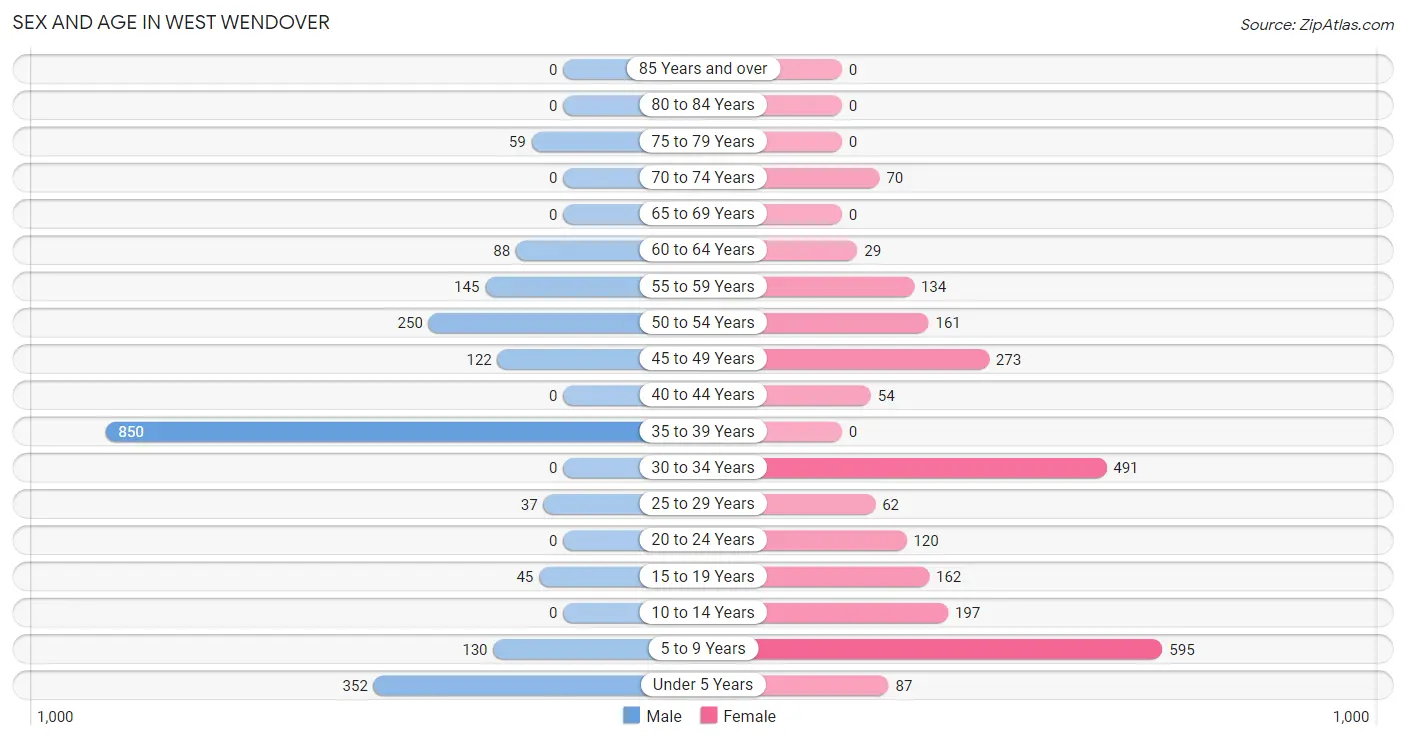
| Age Bracket | Male | Female |
| Under 5 Years | 352 (16.9%) | 87 (3.6%) |
| 5 to 9 Years | 130 (6.3%) | 595 (24.4%) |
| 10 to 14 Years | 0 (0.0%) | 197 (8.1%) |
| 15 to 19 Years | 45 (2.2%) | 162 (6.7%) |
| 20 to 24 Years | 0 (0.0%) | 120 (4.9%) |
| 25 to 29 Years | 37 (1.8%) | 62 (2.5%) |
| 30 to 34 Years | 0 (0.0%) | 491 (20.2%) |
| 35 to 39 Years | 850 (40.9%) | 0 (0.0%) |
| 40 to 44 Years | 0 (0.0%) | 54 (2.2%) |
| 45 to 49 Years | 122 (5.9%) | 273 (11.2%) |
| 50 to 54 Years | 250 (12.0%) | 161 (6.6%) |
| 55 to 59 Years | 145 (7.0%) | 134 (5.5%) |
| 60 to 64 Years | 88 (4.2%) | 29 (1.2%) |
| 65 to 69 Years | 0 (0.0%) | 0 (0.0%) |
| 70 to 74 Years | 0 (0.0%) | 70 (2.9%) |
| 75 to 79 Years | 59 (2.8%) | 0 (0.0%) |
| 80 to 84 Years | 0 (0.0%) | 0 (0.0%) |
| 85 Years and over | 0 (0.0%) | 0 (0.0%) |
| Total | 2,078 (100.0%) | 2,435 (100.0%) |
Families and Households in West Wendover
Median Family Size in West Wendover
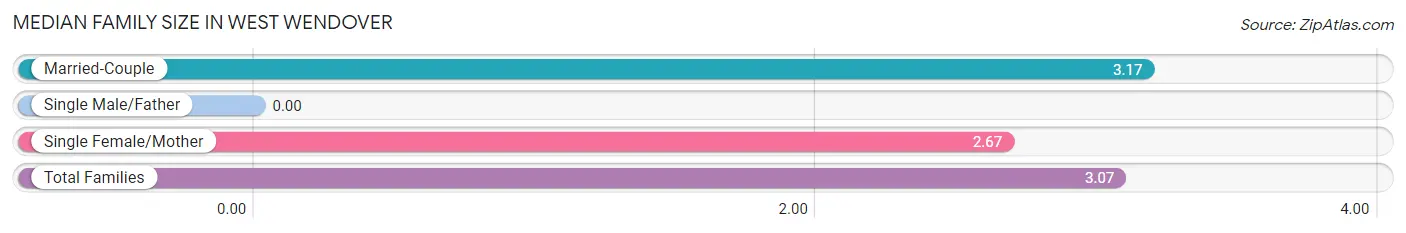
| Family Type | # Families | Family Size |
| Married-Couple | 1,041 (80.8%) | 3.17 |
| Single Male/Father | 0 (0.0%) | - |
| Single Female/Mother | 248 (19.2%) | 2.67 |
| Total Families | 1,289 (100.0%) | 3.07 |
Median Household Size in West Wendover
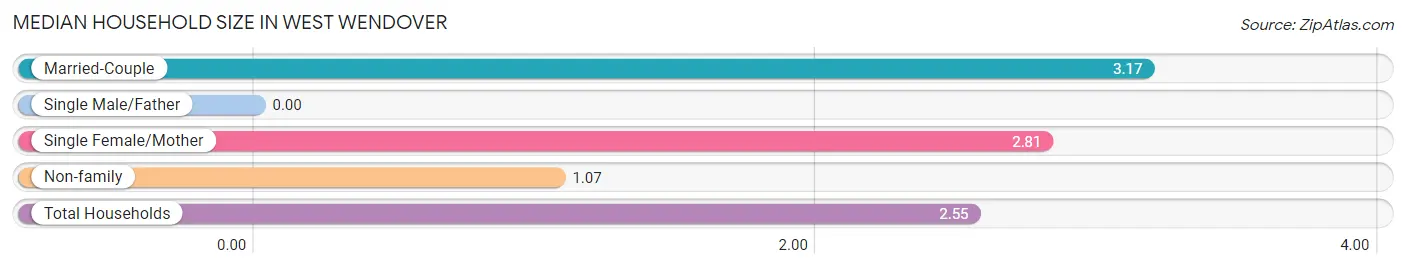
| Household Type | # Households | Household Size |
| Married-Couple | 1,041 (58.8%) | 3.17 |
| Single Male/Father | 0 (0.0%) | - |
| Single Female/Mother | 248 (14.0%) | 2.81 |
| Non-family | 482 (27.2%) | 1.07 |
| Total Households | 1,771 (100.0%) | 2.55 |
Household Size by Marriage Status in West Wendover
Out of a total of 1,771 households in West Wendover, 1,289 (72.8%) are family households, while 482 (27.2%) are nonfamily households. The most numerous type of family households are 4-person households, comprising 559, and the most common type of nonfamily households are 1-person households, comprising 444.
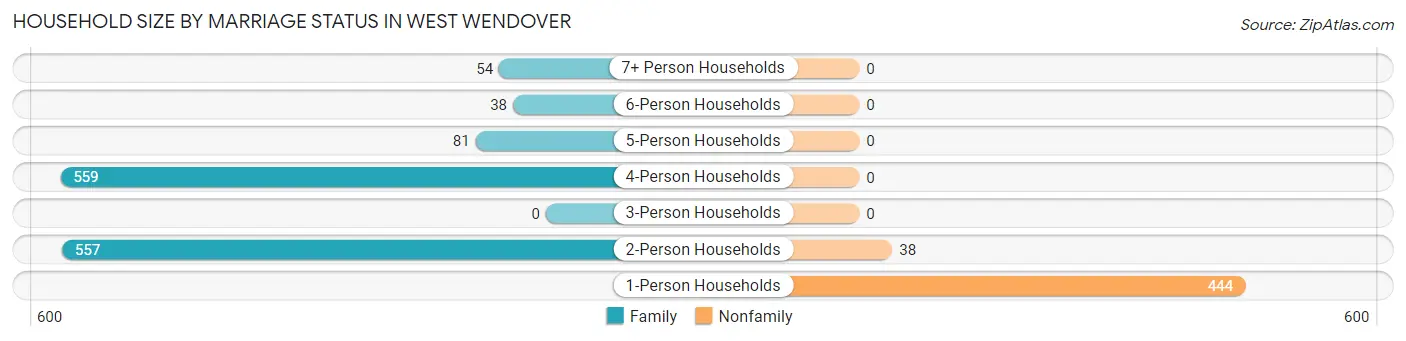
| Household Size | Family Households | Nonfamily Households |
| 1-Person Households | - | 444 (25.1%) |
| 2-Person Households | 557 (31.5%) | 38 (2.1%) |
| 3-Person Households | 0 (0.0%) | 0 (0.0%) |
| 4-Person Households | 559 (31.6%) | 0 (0.0%) |
| 5-Person Households | 81 (4.6%) | 0 (0.0%) |
| 6-Person Households | 38 (2.1%) | 0 (0.0%) |
| 7+ Person Households | 54 (3.0%) | 0 (0.0%) |
| Total | 1,289 (72.8%) | 482 (27.2%) |
Female Fertility in West Wendover
Fertility by Age in West Wendover
Average fertility rate in West Wendover is 69.0 births per 1,000 women. Women in the age bracket of 20 to 34 years have the highest fertility rate with 119.0 births per 1,000 women. Women in the age bracket of 20 to 34 years acount for 100.0% of all women with births.
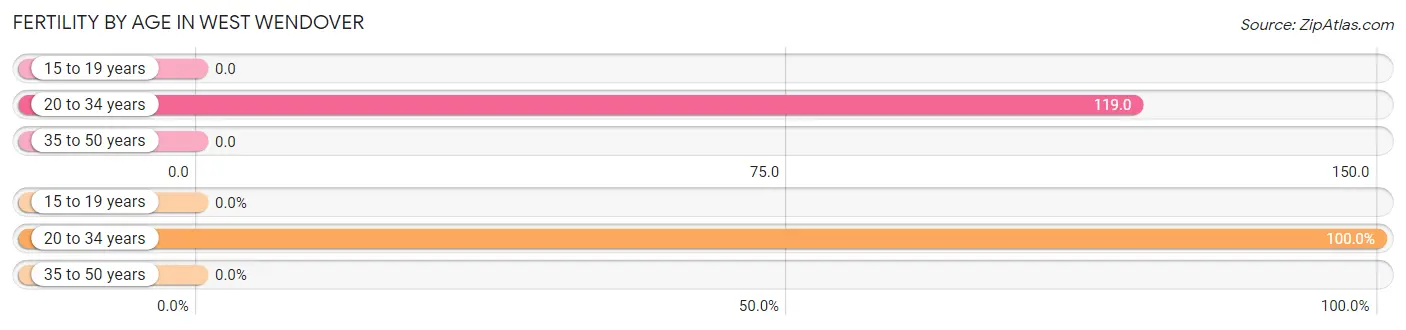
| Age Bracket | Women with Births | Births / 1,000 Women |
| 15 to 19 years | 0 (0.0%) | 0.0 |
| 20 to 34 years | 80 (100.0%) | 119.0 |
| 35 to 50 years | 0 (0.0%) | 0.0 |
| Total | 80 (100.0%) | 69.0 |
Fertility by Age by Marriage Status in West Wendover
38.8% of women with births (80) in West Wendover are married. The highest percentage of unmarried women with births falls into 20 to 34 years age bracket with 61.3% of them unmarried at the time of birth, while the lowest percentage of unmarried women with births belong to 20 to 34 years age bracket with 61.3% of them unmarried.
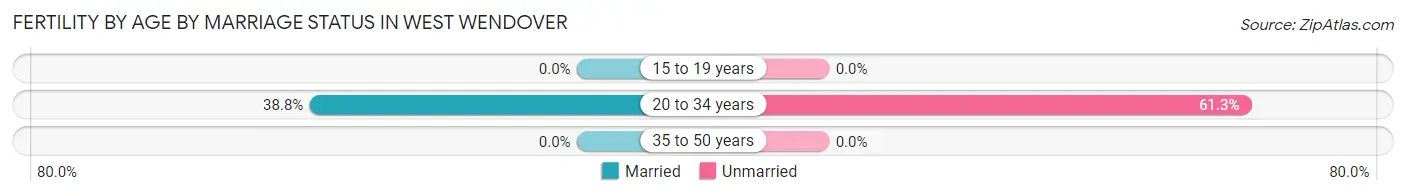
| Age Bracket | Married | Unmarried |
| 15 to 19 years | 0 (0.0%) | 0 (0.0%) |
| 20 to 34 years | 31 (38.8%) | 49 (61.3%) |
| 35 to 50 years | 0 (0.0%) | 0 (0.0%) |
| Total | 31 (38.8%) | 49 (61.3%) |
Fertility by Education in West Wendover
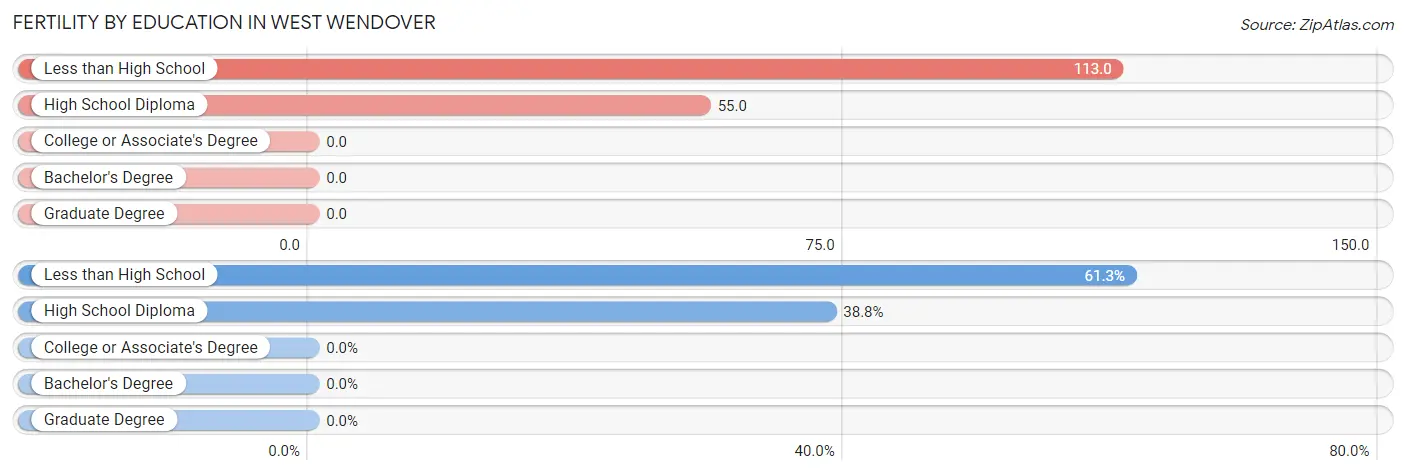
| Educational Attainment | Women with Births | Births / 1,000 Women |
| Less than High School | 49 (61.3%) | 113.0 |
| High School Diploma | 31 (38.8%) | 55.0 |
| College or Associate's Degree | 0 (0.0%) | 0.0 |
| Bachelor's Degree | 0 (0.0%) | 0.0 |
| Graduate Degree | 0 (0.0%) | 0.0 |
| Total | 80 (100.0%) | 69.0 |
Fertility by Education by Marriage Status in West Wendover
61.3% of women with births in West Wendover are unmarried. Women with the educational attainment of high school diploma are most likely to be married with 100.0% of them married at childbirth, while women with the educational attainment of less than high school are least likely to be married with 100.0% of them unmarried at childbirth.
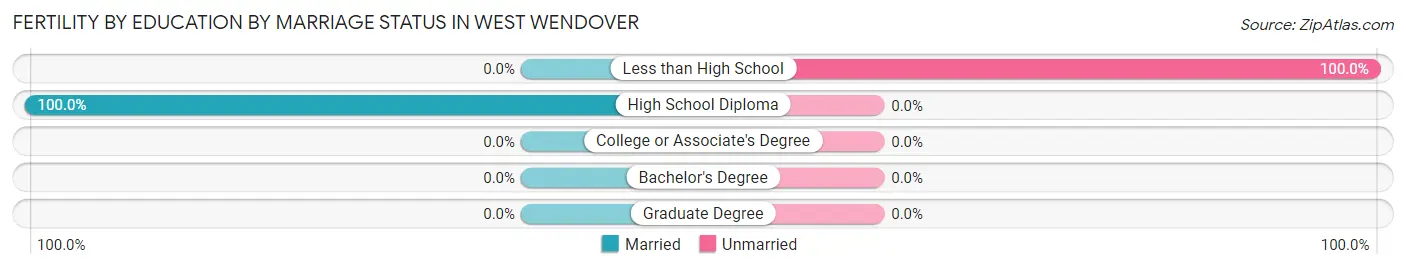
| Educational Attainment | Married | Unmarried |
| Less than High School | 0 (0.0%) | 49 (100.0%) |
| High School Diploma | 31 (100.0%) | 0 (0.0%) |
| College or Associate's Degree | 0 (0.0%) | 0 (0.0%) |
| Bachelor's Degree | 0 (0.0%) | 0 (0.0%) |
| Graduate Degree | 0 (0.0%) | 0 (0.0%) |
| Total | 31 (38.8%) | 49 (61.3%) |
Employment Characteristics in West Wendover
Employment by Class of Employer in West Wendover
Among the 2,373 employed individuals in West Wendover, private company employees (2,071 | 87.3%), local government employees (219 | 9.2%), and federal government employees (42 | 1.8%) make up the most common classes of employment.
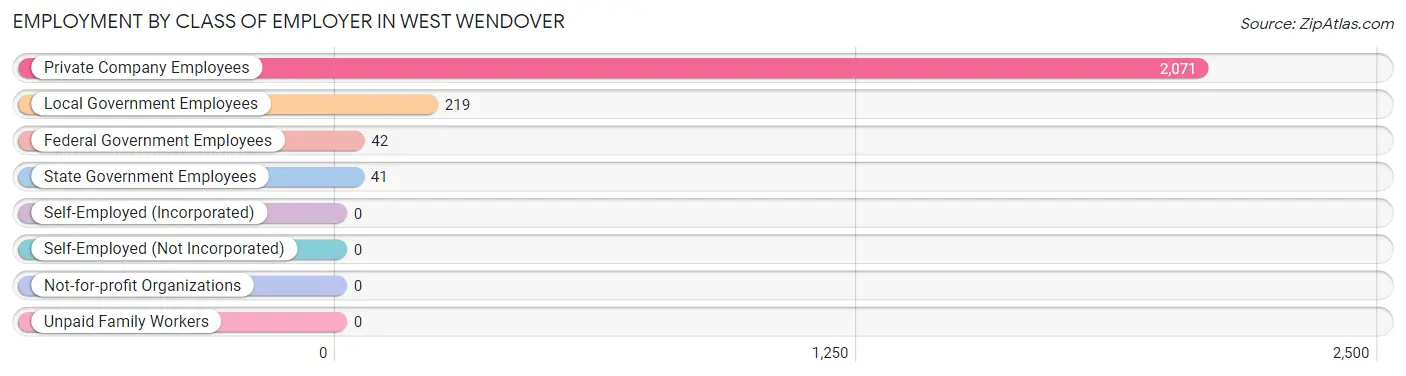
| Employer Class | # Employees | % Employees |
| Private Company Employees | 2,071 | 87.3% |
| Self-Employed (Incorporated) | 0 | 0.0% |
| Self-Employed (Not Incorporated) | 0 | 0.0% |
| Not-for-profit Organizations | 0 | 0.0% |
| Local Government Employees | 219 | 9.2% |
| State Government Employees | 41 | 1.7% |
| Federal Government Employees | 42 | 1.8% |
| Unpaid Family Workers | 0 | 0.0% |
| Total | 2,373 | 100.0% |
Employment Status by Age in West Wendover
According to the labor force statistics for West Wendover, out of the total population over 16 years of age (3,152), 79.0% or 2,490 individuals are in the labor force, with 3.0% or 75 of them unemployed. The age group with the highest labor force participation rate is 20 to 24 years, with 100.0% or 120 individuals in the labor force. Within the labor force, the 45 to 54 years age range has the highest percentage of unemployed individuals, with 9.2% or 74 of them being unemployed.
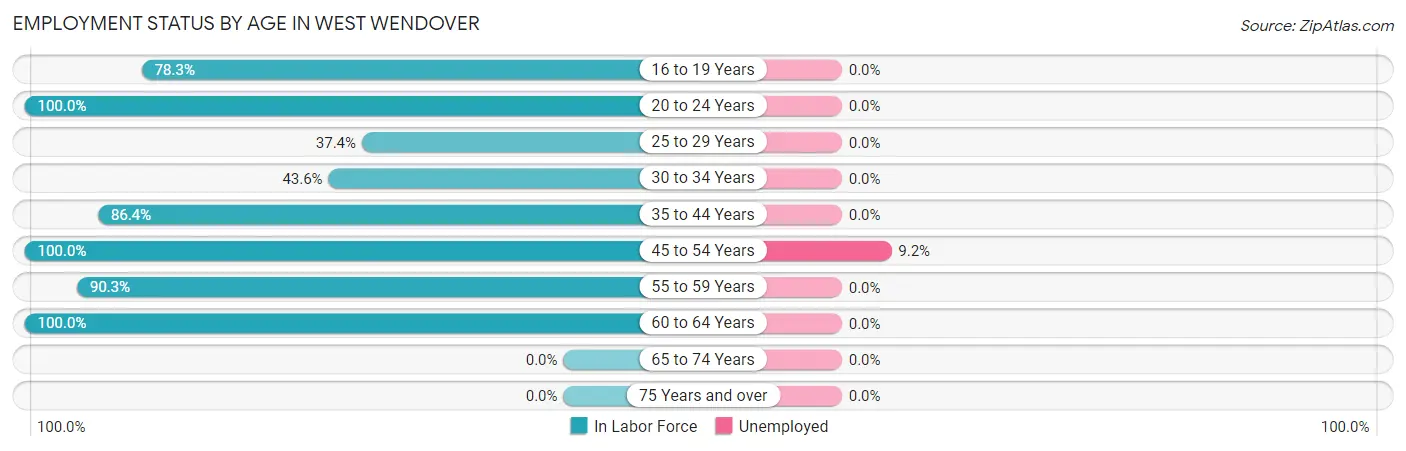
| Age Bracket | In Labor Force | Unemployed |
| 16 to 19 Years | 162 (78.3%) | 0 (0.0%) |
| 20 to 24 Years | 120 (100.0%) | 0 (0.0%) |
| 25 to 29 Years | 37 (37.4%) | 0 (0.0%) |
| 30 to 34 Years | 214 (43.6%) | 0 (0.0%) |
| 35 to 44 Years | 781 (86.4%) | 0 (0.0%) |
| 45 to 54 Years | 806 (100.0%) | 74 (9.2%) |
| 55 to 59 Years | 252 (90.3%) | 0 (0.0%) |
| 60 to 64 Years | 117 (100.0%) | 0 (0.0%) |
| 65 to 74 Years | 0 (0.0%) | 0 (0.0%) |
| 75 Years and over | 0 (0.0%) | 0 (0.0%) |
| Total | 2,490 (79.0%) | 75 (3.0%) |
Employment Status by Educational Attainment in West Wendover
According to labor force statistics for West Wendover, 81.9% of individuals (2,208) out of the total population between 25 and 64 years of age (2,696) are in the labor force, with 3.4% or 75 of them being unemployed. The group with the highest labor force participation rate are those with the educational attainment of less than high school, with 100.0% or 337 individuals in the labor force. Within the labor force, individuals with less than high school education have the highest percentage of unemployment, with 22.0% or 74 of them being unemployed.
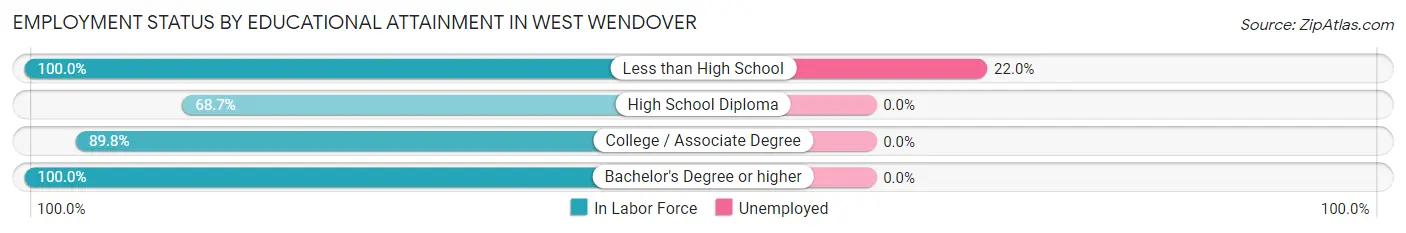
| Educational Attainment | In Labor Force | Unemployed |
| Less than High School | 337 (100.0%) | 74 (22.0%) |
| High School Diploma | 877 (68.7%) | 0 (0.0%) |
| College / Associate Degree | 785 (89.8%) | 0 (0.0%) |
| Bachelor's Degree or higher | 209 (100.0%) | 0 (0.0%) |
| Total | 2,208 (81.9%) | 92 (3.4%) |
Employment Occupations by Sex in West Wendover
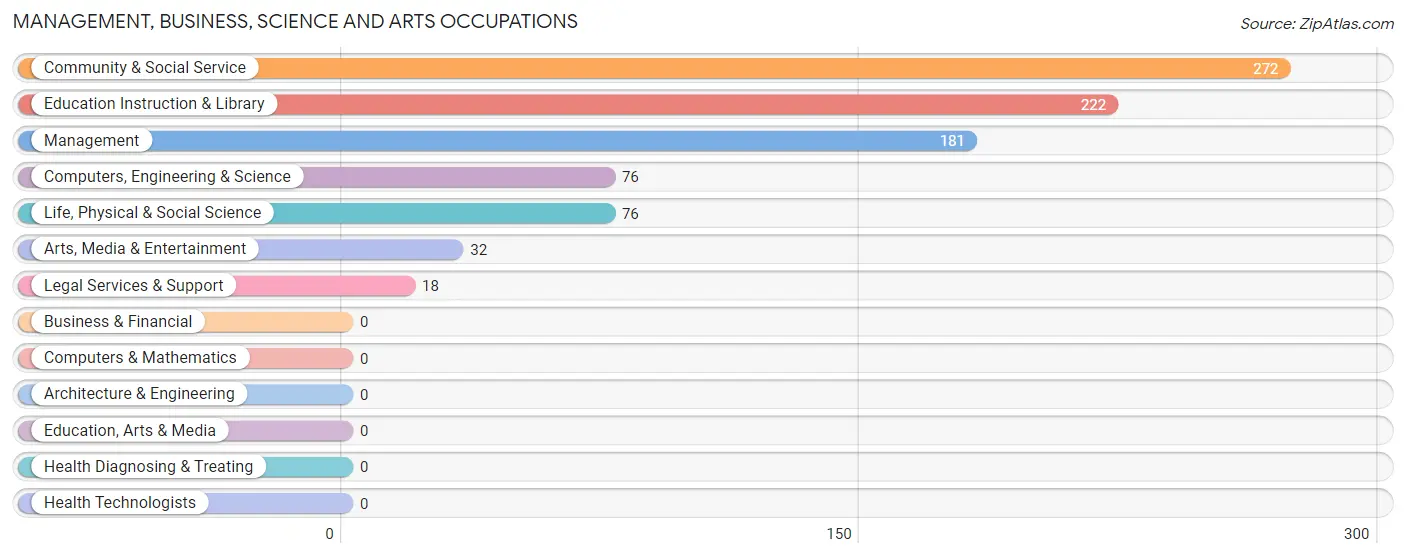
Management, Business, Science and Arts Occupations
The most common Management, Business, Science and Arts occupations in West Wendover are Community & Social Service (272 | 11.3%), Education Instruction & Library (222 | 9.2%), Management (181 | 7.5%), Computers, Engineering & Science (76 | 3.2%), and Life, Physical & Social Science (76 | 3.2%).
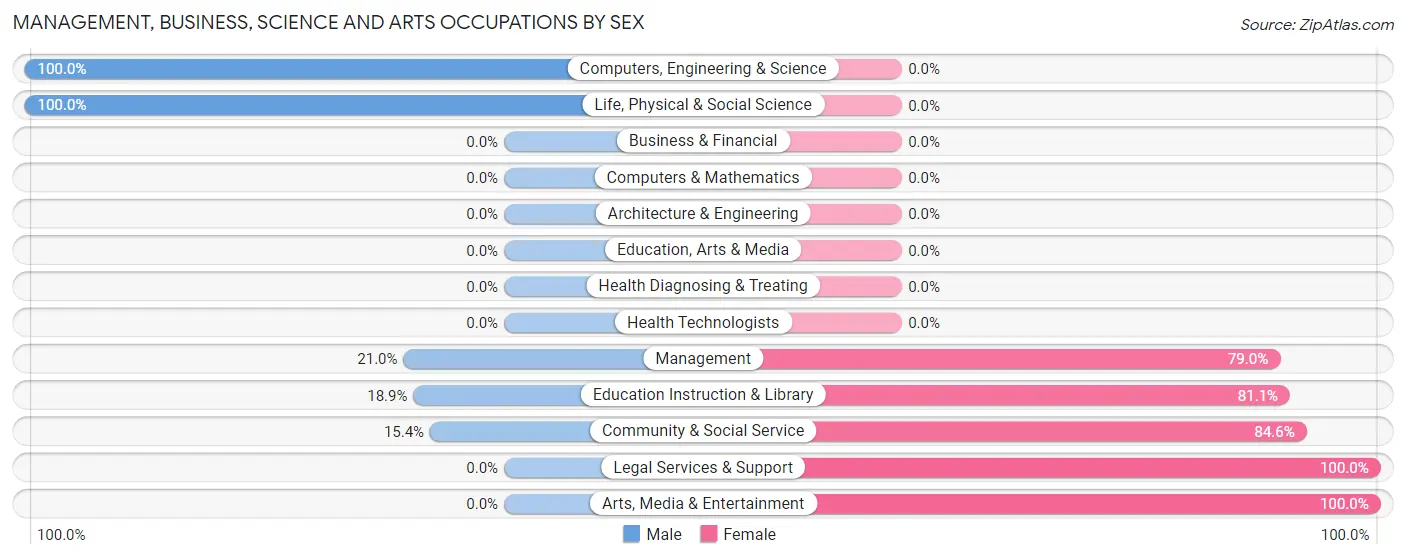
Management, Business, Science and Arts Occupations by Sex
Within the Management, Business, Science and Arts occupations in West Wendover, the most male-oriented occupations are Computers, Engineering & Science (100.0%), Life, Physical & Social Science (100.0%), and Management (21.0%), while the most female-oriented occupations are Legal Services & Support (100.0%), Arts, Media & Entertainment (100.0%), and Community & Social Service (84.6%).
| Occupation | Male | Female |
| Management | 38 (21.0%) | 143 (79.0%) |
| Business & Financial | 0 (0.0%) | 0 (0.0%) |
| Computers, Engineering & Science | 76 (100.0%) | 0 (0.0%) |
| Computers & Mathematics | 0 (0.0%) | 0 (0.0%) |
| Architecture & Engineering | 0 (0.0%) | 0 (0.0%) |
| Life, Physical & Social Science | 76 (100.0%) | 0 (0.0%) |
| Community & Social Service | 42 (15.4%) | 230 (84.6%) |
| Education, Arts & Media | 0 (0.0%) | 0 (0.0%) |
| Legal Services & Support | 0 (0.0%) | 18 (100.0%) |
| Education Instruction & Library | 42 (18.9%) | 180 (81.1%) |
| Arts, Media & Entertainment | 0 (0.0%) | 32 (100.0%) |
| Health Diagnosing & Treating | 0 (0.0%) | 0 (0.0%) |
| Health Technologists | 0 (0.0%) | 0 (0.0%) |
| Total (Category) | 156 (29.5%) | 373 (70.5%) |
| Total (Overall) | 1,423 (58.9%) | 992 (41.1%) |
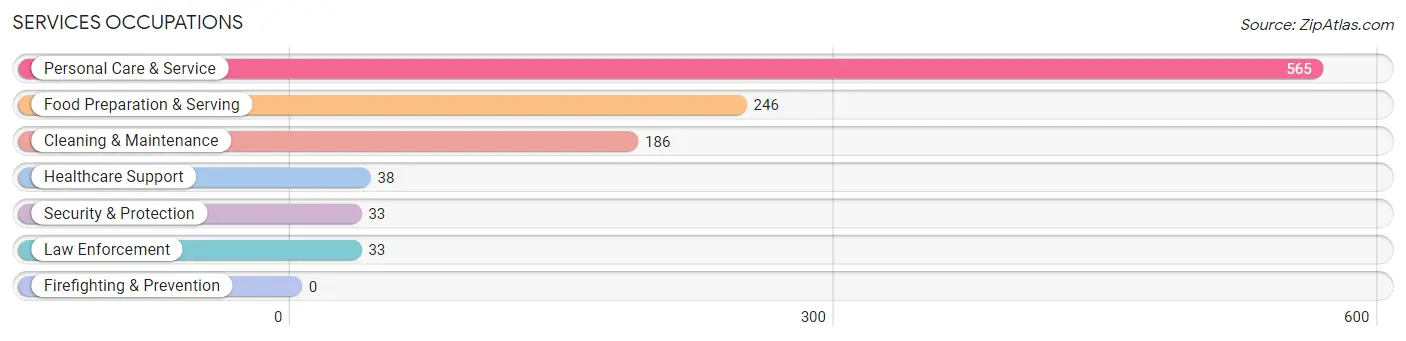
Services Occupations
The most common Services occupations in West Wendover are Personal Care & Service (565 | 23.4%), Food Preparation & Serving (246 | 10.2%), Cleaning & Maintenance (186 | 7.7%), Healthcare Support (38 | 1.6%), and Security & Protection (33 | 1.4%).
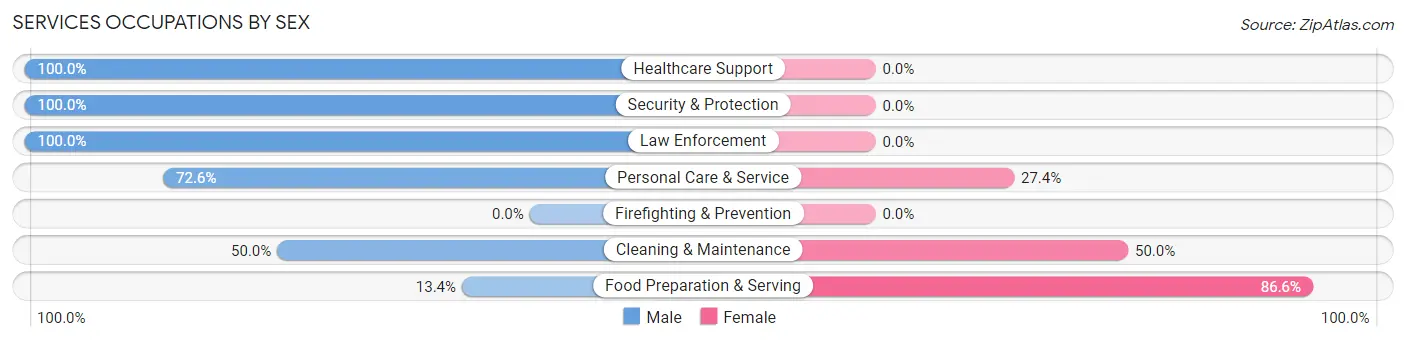
Services Occupations by Sex
Within the Services occupations in West Wendover, the most male-oriented occupations are Healthcare Support (100.0%), Security & Protection (100.0%), and Law Enforcement (100.0%), while the most female-oriented occupations are Food Preparation & Serving (86.6%), Cleaning & Maintenance (50.0%), and Personal Care & Service (27.4%).
| Occupation | Male | Female |
| Healthcare Support | 38 (100.0%) | 0 (0.0%) |
| Security & Protection | 33 (100.0%) | 0 (0.0%) |
| Firefighting & Prevention | 0 (0.0%) | 0 (0.0%) |
| Law Enforcement | 33 (100.0%) | 0 (0.0%) |
| Food Preparation & Serving | 33 (13.4%) | 213 (86.6%) |
| Cleaning & Maintenance | 93 (50.0%) | 93 (50.0%) |
| Personal Care & Service | 410 (72.6%) | 155 (27.4%) |
| Total (Category) | 607 (56.8%) | 461 (43.2%) |
| Total (Overall) | 1,423 (58.9%) | 992 (41.1%) |
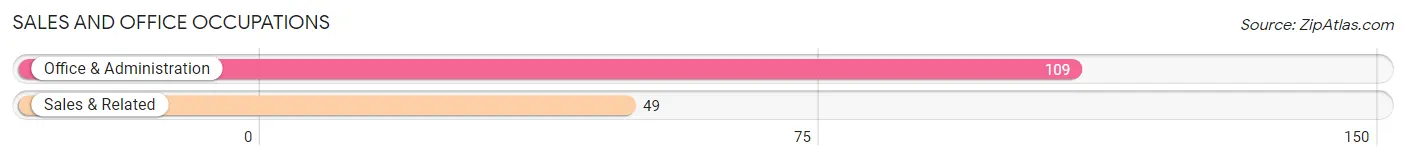
Sales and Office Occupations
The most common Sales and Office occupations in West Wendover are Office & Administration (109 | 4.5%), and Sales & Related (49 | 2.0%).
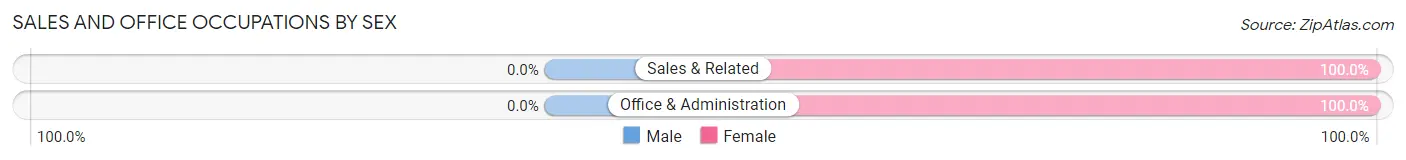
Sales and Office Occupations by Sex
| Occupation | Male | Female |
| Sales & Related | 0 (0.0%) | 49 (100.0%) |
| Office & Administration | 0 (0.0%) | 109 (100.0%) |
| Total (Category) | 0 (0.0%) | 158 (100.0%) |
| Total (Overall) | 1,423 (58.9%) | 992 (41.1%) |
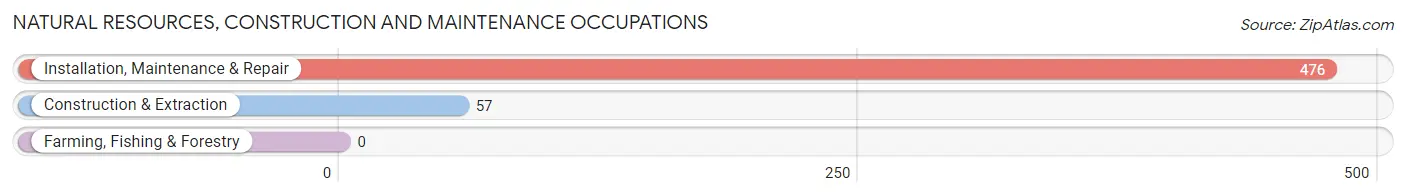
Natural Resources, Construction and Maintenance Occupations
The most common Natural Resources, Construction and Maintenance occupations in West Wendover are Installation, Maintenance & Repair (476 | 19.7%), and Construction & Extraction (57 | 2.4%).
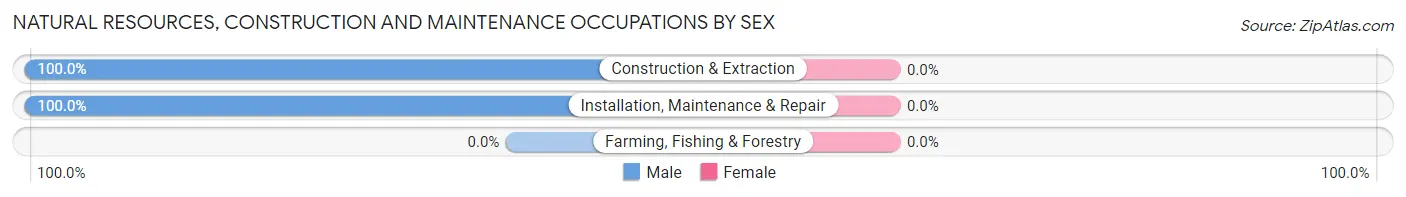
Natural Resources, Construction and Maintenance Occupations by Sex
| Occupation | Male | Female |
| Farming, Fishing & Forestry | 0 (0.0%) | 0 (0.0%) |
| Construction & Extraction | 57 (100.0%) | 0 (0.0%) |
| Installation, Maintenance & Repair | 476 (100.0%) | 0 (0.0%) |
| Total (Category) | 533 (100.0%) | 0 (0.0%) |
| Total (Overall) | 1,423 (58.9%) | 992 (41.1%) |
Production, Transportation and Moving Occupations
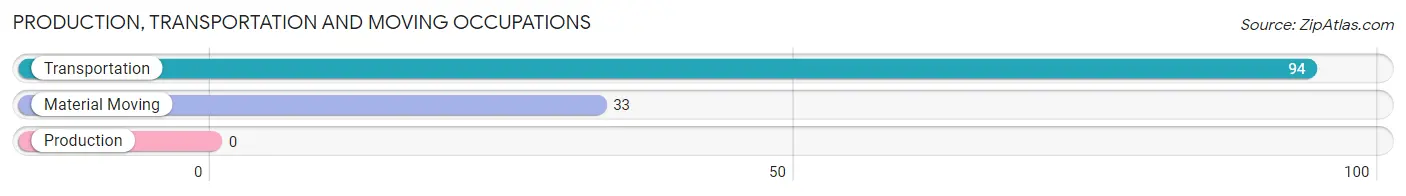
The most common Production, Transportation and Moving occupations in West Wendover are Transportation (94 | 3.9%), and Material Moving (33 | 1.4%).
Production, Transportation and Moving Occupations by Sex
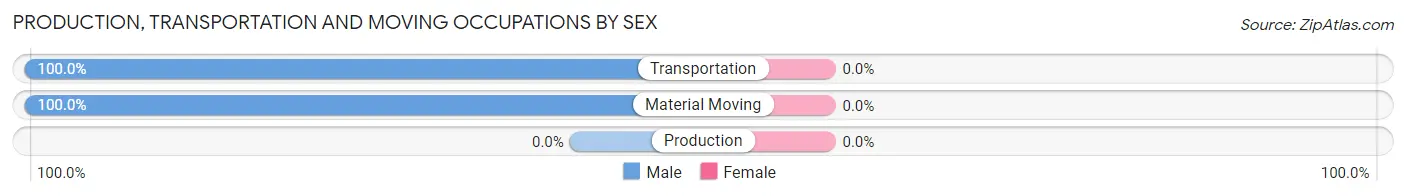
| Occupation | Male | Female |
| Production | 0 (0.0%) | 0 (0.0%) |
| Transportation | 94 (100.0%) | 0 (0.0%) |
| Material Moving | 33 (100.0%) | 0 (0.0%) |
| Total (Category) | 127 (100.0%) | 0 (0.0%) |
| Total (Overall) | 1,423 (58.9%) | 992 (41.1%) |
Employment Industries by Sex in West Wendover
Employment Industries in West Wendover
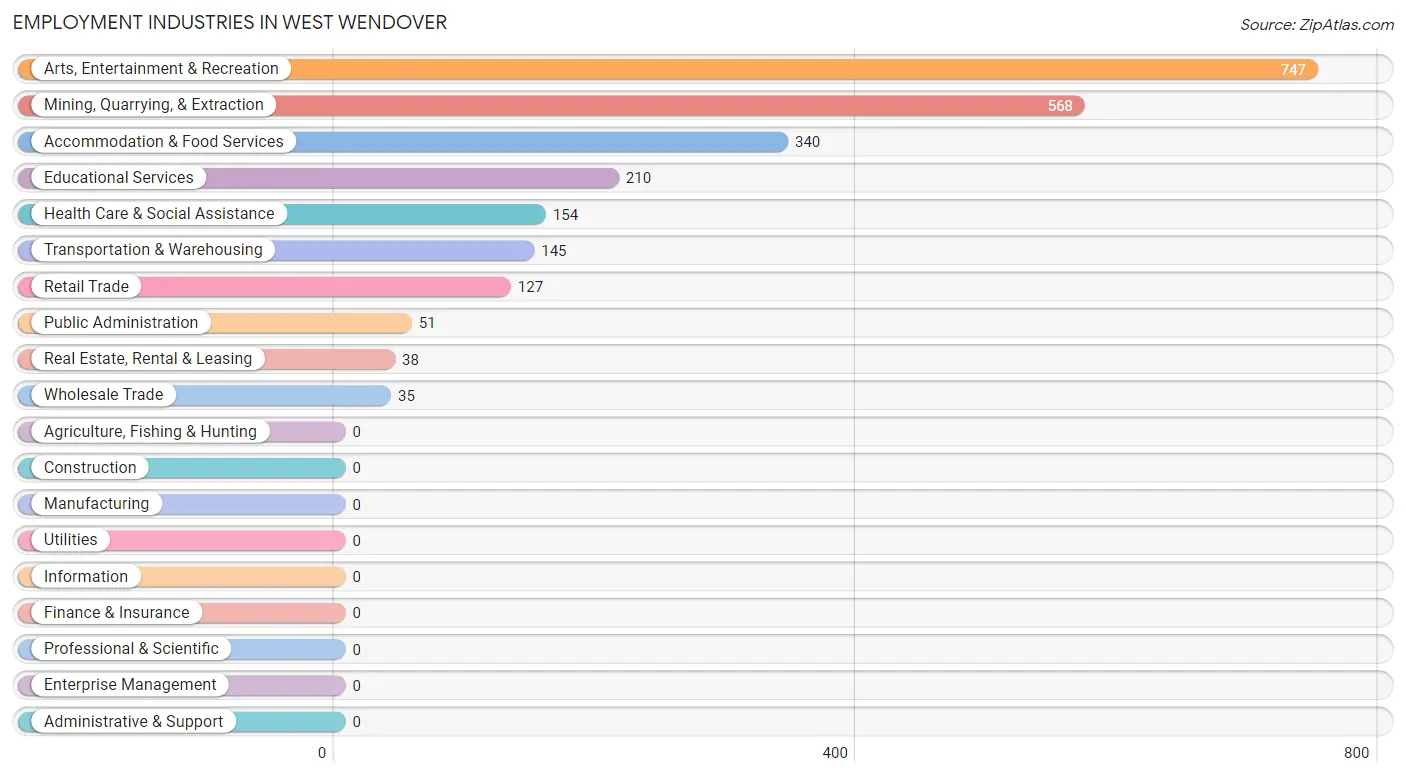
The major employment industries in West Wendover include Arts, Entertainment & Recreation (747 | 30.9%), Mining, Quarrying, & Extraction (568 | 23.5%), Accommodation & Food Services (340 | 14.1%), Educational Services (210 | 8.7%), and Health Care & Social Assistance (154 | 6.4%).
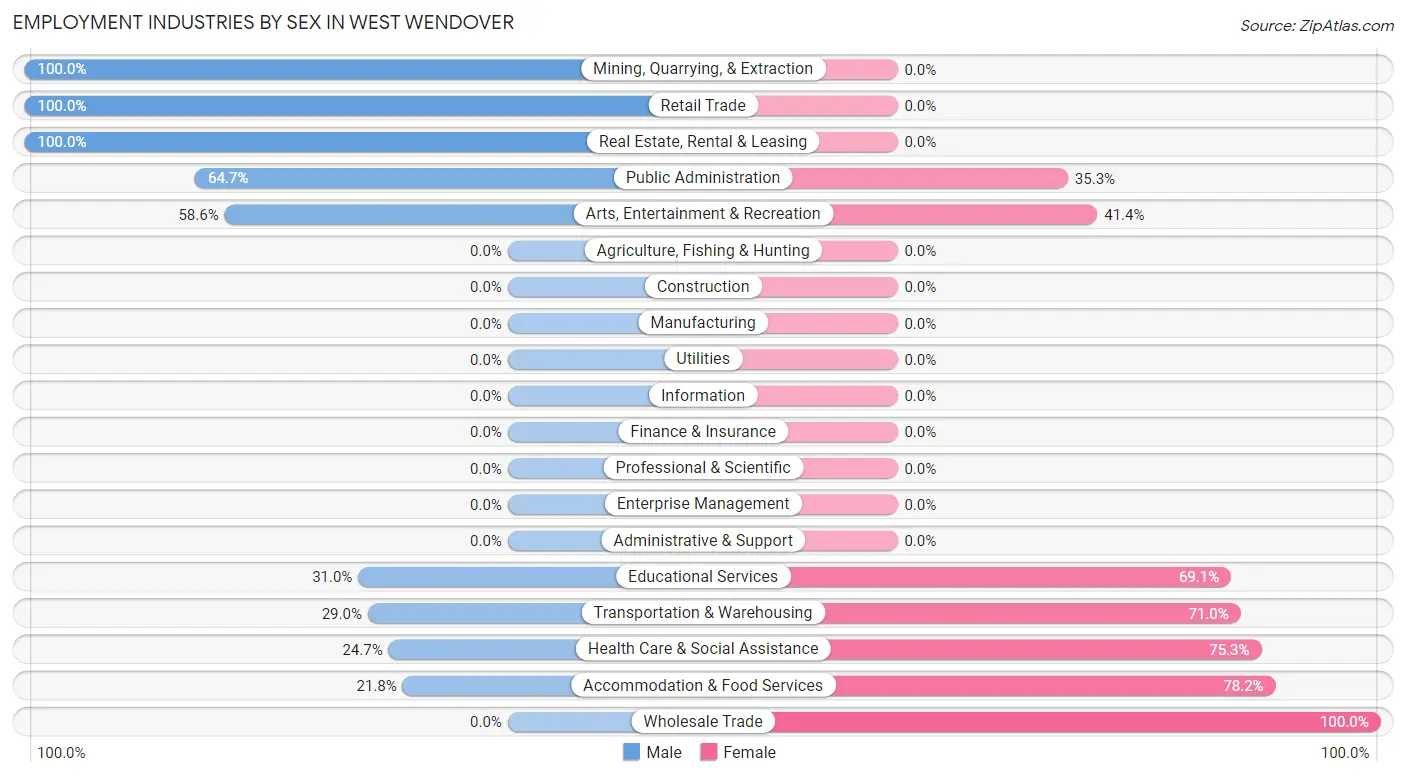
Employment Industries by Sex in West Wendover
The West Wendover industries that see more men than women are Mining, Quarrying, & Extraction (100.0%), Retail Trade (100.0%), and Real Estate, Rental & Leasing (100.0%), whereas the industries that tend to have a higher number of women are Wholesale Trade (100.0%), Accommodation & Food Services (78.2%), and Health Care & Social Assistance (75.3%).
| Industry | Male | Female |
| Agriculture, Fishing & Hunting | 0 (0.0%) | 0 (0.0%) |
| Mining, Quarrying, & Extraction | 568 (100.0%) | 0 (0.0%) |
| Construction | 0 (0.0%) | 0 (0.0%) |
| Manufacturing | 0 (0.0%) | 0 (0.0%) |
| Wholesale Trade | 0 (0.0%) | 35 (100.0%) |
| Retail Trade | 127 (100.0%) | 0 (0.0%) |
| Transportation & Warehousing | 42 (29.0%) | 103 (71.0%) |
| Utilities | 0 (0.0%) | 0 (0.0%) |
| Information | 0 (0.0%) | 0 (0.0%) |
| Finance & Insurance | 0 (0.0%) | 0 (0.0%) |
| Real Estate, Rental & Leasing | 38 (100.0%) | 0 (0.0%) |
| Professional & Scientific | 0 (0.0%) | 0 (0.0%) |
| Enterprise Management | 0 (0.0%) | 0 (0.0%) |
| Administrative & Support | 0 (0.0%) | 0 (0.0%) |
| Educational Services | 65 (30.9%) | 145 (69.1%) |
| Health Care & Social Assistance | 38 (24.7%) | 116 (75.3%) |
| Arts, Entertainment & Recreation | 438 (58.6%) | 309 (41.4%) |
| Accommodation & Food Services | 74 (21.8%) | 266 (78.2%) |
| Public Administration | 33 (64.7%) | 18 (35.3%) |
| Total | 1,423 (58.9%) | 992 (41.1%) |
Education in West Wendover
School Enrollment in West Wendover
The most common levels of schooling among the 1,717 students in West Wendover are elementary school (614 | 35.8%), college / undergraduate (559 | 32.6%), and high school (275 | 16.0%).
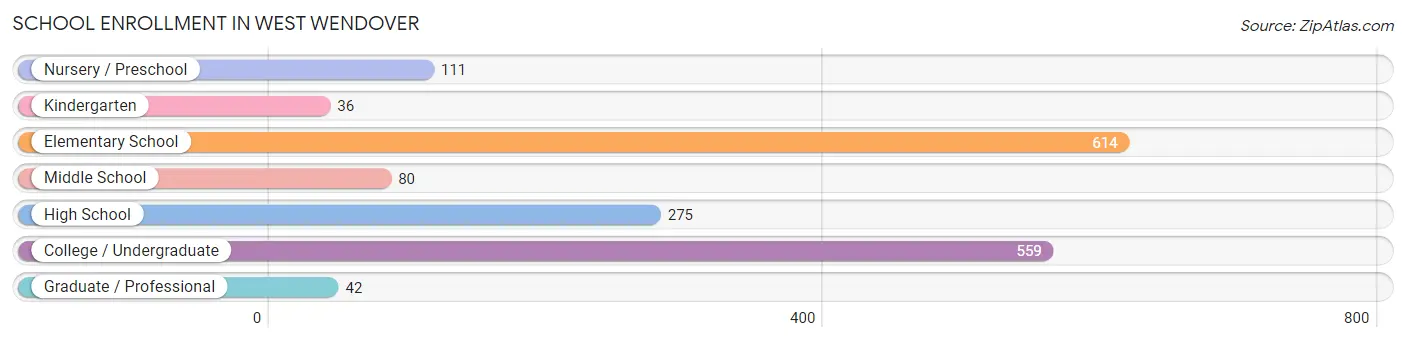
| School Level | # Students | % Students |
| Nursery / Preschool | 111 | 6.5% |
| Kindergarten | 36 | 2.1% |
| Elementary School | 614 | 35.8% |
| Middle School | 80 | 4.7% |
| High School | 275 | 16.0% |
| College / Undergraduate | 559 | 32.6% |
| Graduate / Professional | 42 | 2.5% |
| Total | 1,717 | 100.0% |
School Enrollment by Age by Funding Source in West Wendover
Out of a total of 1,717 students who are enrolled in schools in West Wendover, 124 (7.2%) attend a private institution, while the remaining 1,593 (92.8%) are enrolled in public schools. The age group of 18 to 19 year olds has the highest likelihood of being enrolled in private schools, with 49 (100.0% in the age bracket) enrolled. Conversely, the age group of 3 to 4 year olds has the lowest likelihood of being enrolled in a private school, with 36 (100.0% in the age bracket) attending a public institution.
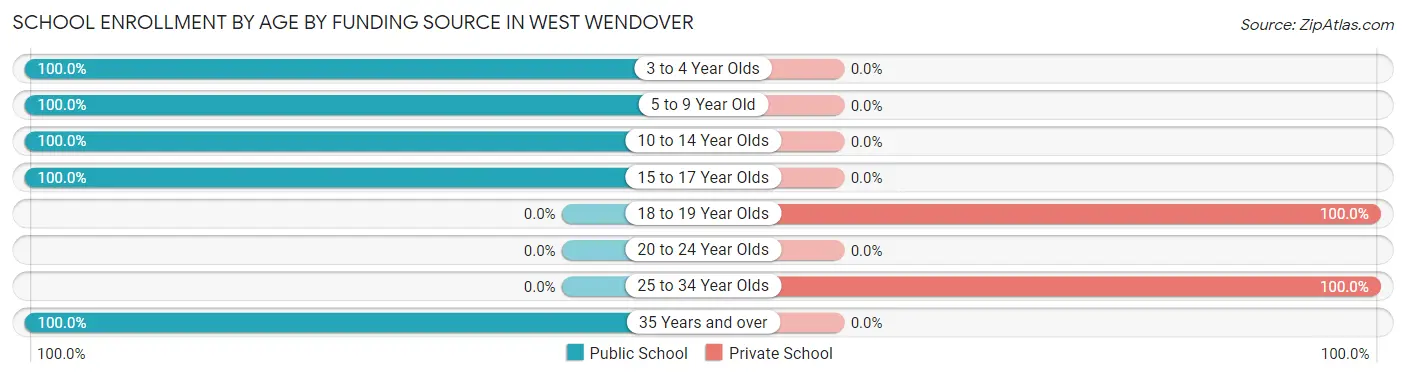
| Age Bracket | Public School | Private School |
| 3 to 4 Year Olds | 36 (100.0%) | 0 (0.0%) |
| 5 to 9 Year Old | 725 (100.0%) | 0 (0.0%) |
| 10 to 14 Year Olds | 197 (100.0%) | 0 (0.0%) |
| 15 to 17 Year Olds | 158 (100.0%) | 0 (0.0%) |
| 18 to 19 Year Olds | 0 (0.0%) | 49 (100.0%) |
| 20 to 24 Year Olds | 0 (0.0%) | 0 (0.0%) |
| 25 to 34 Year Olds | 0 (0.0%) | 75 (100.0%) |
| 35 Years and over | 477 (100.0%) | 0 (0.0%) |
| Total | 1,593 (92.8%) | 124 (7.2%) |
Educational Attainment by Field of Study in West Wendover
Education (176 | 84.2%), and business (33 | 15.8%) are the most common fields of study among 209 individuals in West Wendover who have obtained a bachelor's degree or higher.
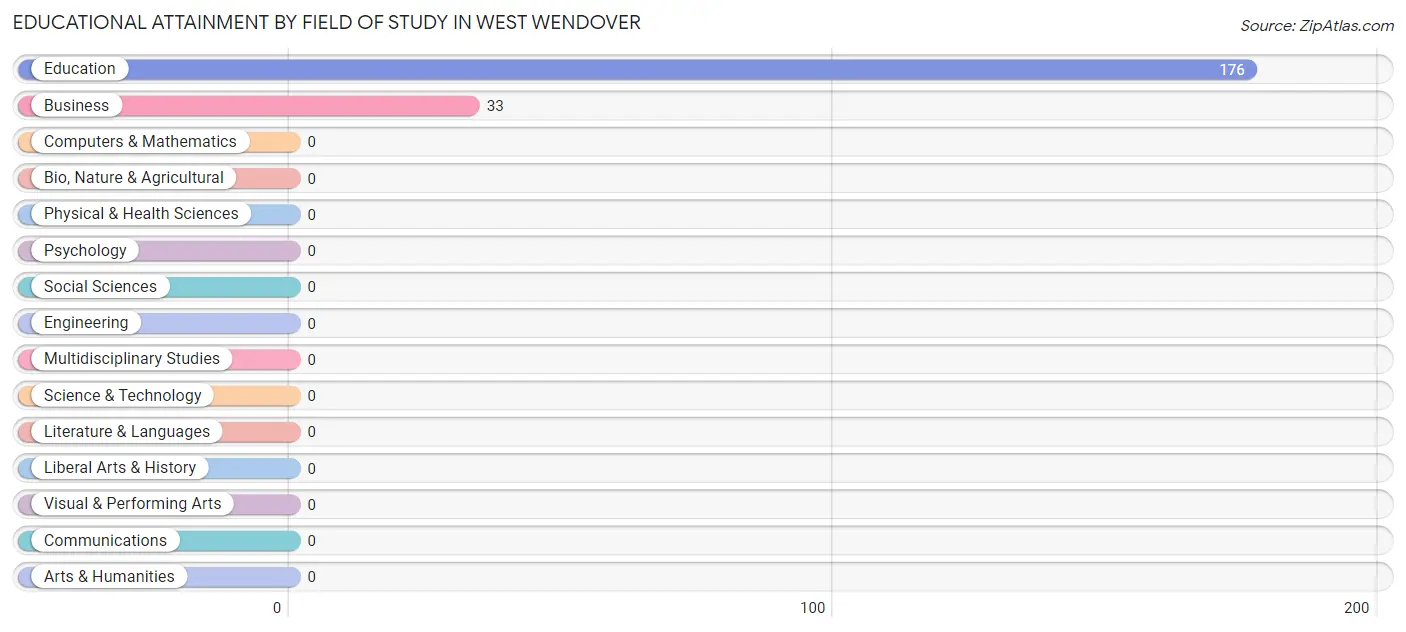
| Field of Study | # Graduates | % Graduates |
| Computers & Mathematics | 0 | 0.0% |
| Bio, Nature & Agricultural | 0 | 0.0% |
| Physical & Health Sciences | 0 | 0.0% |
| Psychology | 0 | 0.0% |
| Social Sciences | 0 | 0.0% |
| Engineering | 0 | 0.0% |
| Multidisciplinary Studies | 0 | 0.0% |
| Science & Technology | 0 | 0.0% |
| Business | 33 | 15.8% |
| Education | 176 | 84.2% |
| Literature & Languages | 0 | 0.0% |
| Liberal Arts & History | 0 | 0.0% |
| Visual & Performing Arts | 0 | 0.0% |
| Communications | 0 | 0.0% |
| Arts & Humanities | 0 | 0.0% |
| Total | 209 | 100.0% |
Transportation & Commute in West Wendover
Vehicle Availability by Sex in West Wendover
The most prevalent vehicle ownership categories in West Wendover are males with 1 vehicle (468, accounting for 33.9%) and females with 1 vehicle (164, making up 47.2%).
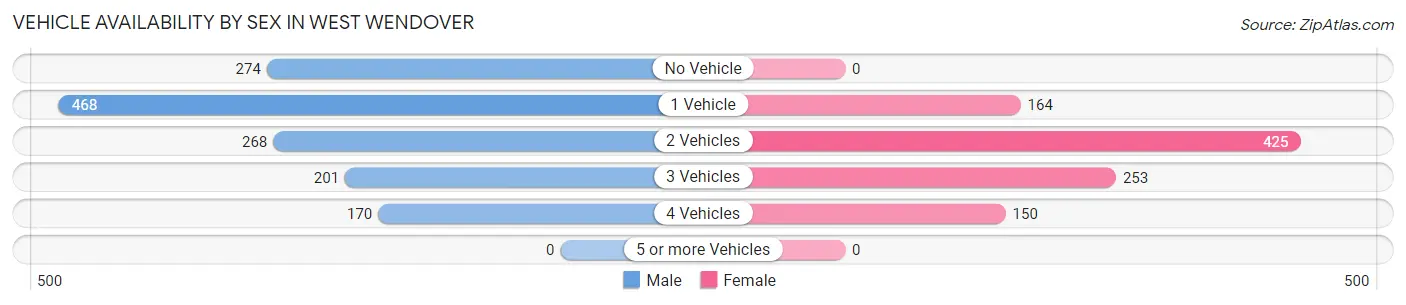
| Vehicles Available | Male | Female |
| No Vehicle | 274 (19.8%) | 0 (0.0%) |
| 1 Vehicle | 468 (33.9%) | 164 (16.5%) |
| 2 Vehicles | 268 (19.4%) | 425 (42.8%) |
| 3 Vehicles | 201 (14.5%) | 253 (25.5%) |
| 4 Vehicles | 170 (12.3%) | 150 (15.1%) |
| 5 or more Vehicles | 0 (0.0%) | 0 (0.0%) |
| Total | 1,381 (100.0%) | 992 (100.0%) |
Commute Time in West Wendover
The most frequently occuring commute durations in West Wendover are 5 to 9 minutes (980 commuters, 42.0%), 25 to 29 minutes (593 commuters, 25.4%), and less than 5 minutes (297 commuters, 12.7%).
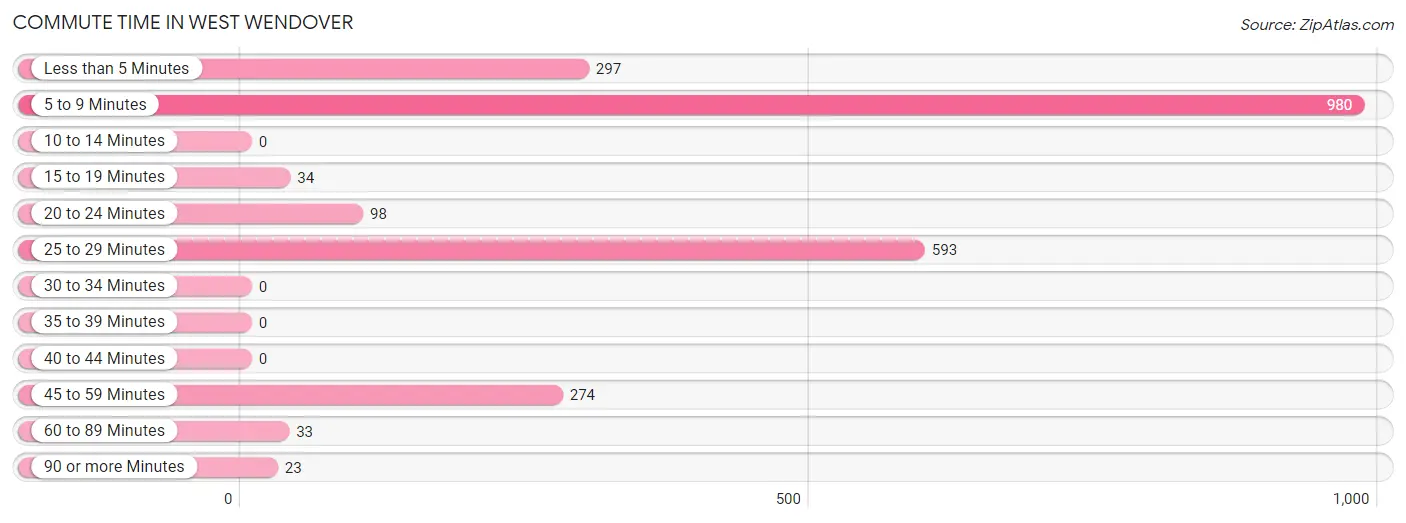
| Commute Time | # Commuters | % Commuters |
| Less than 5 Minutes | 297 | 12.7% |
| 5 to 9 Minutes | 980 | 42.0% |
| 10 to 14 Minutes | 0 | 0.0% |
| 15 to 19 Minutes | 34 | 1.5% |
| 20 to 24 Minutes | 98 | 4.2% |
| 25 to 29 Minutes | 593 | 25.4% |
| 30 to 34 Minutes | 0 | 0.0% |
| 35 to 39 Minutes | 0 | 0.0% |
| 40 to 44 Minutes | 0 | 0.0% |
| 45 to 59 Minutes | 274 | 11.7% |
| 60 to 89 Minutes | 33 | 1.4% |
| 90 or more Minutes | 23 | 1.0% |
Commute Time by Sex in West Wendover
The most common commute times in West Wendover are 25 to 29 minutes (553 commuters, 40.0%) for males and 5 to 9 minutes (690 commuters, 72.6%) for females.
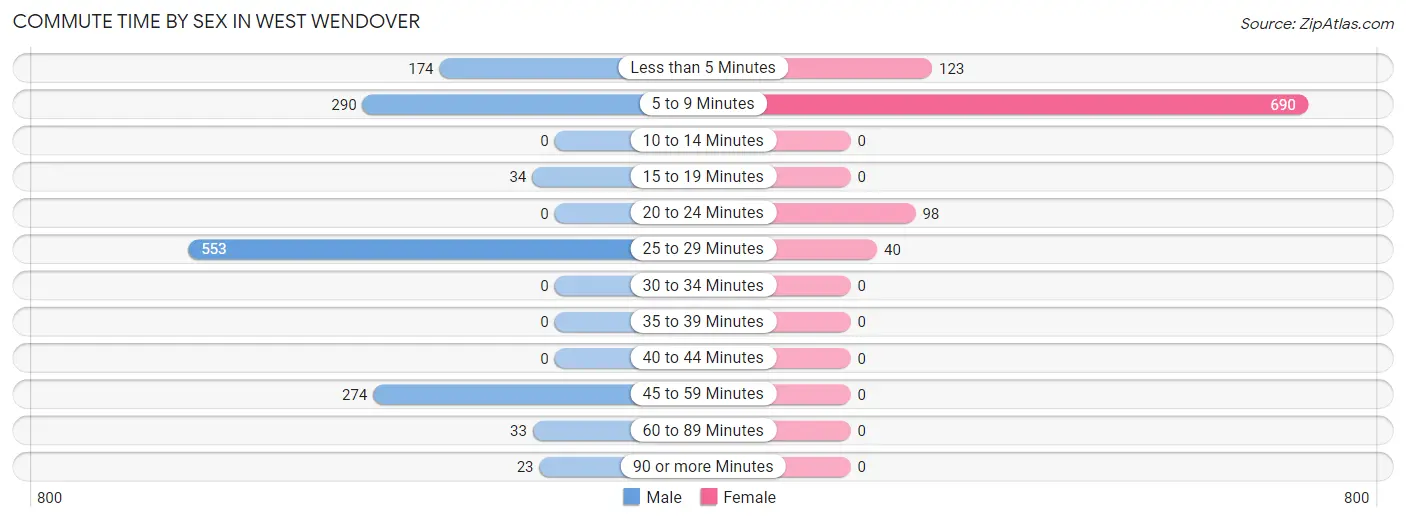
| Commute Time | Male | Female |
| Less than 5 Minutes | 174 (12.6%) | 123 (12.9%) |
| 5 to 9 Minutes | 290 (21.0%) | 690 (72.6%) |
| 10 to 14 Minutes | 0 (0.0%) | 0 (0.0%) |
| 15 to 19 Minutes | 34 (2.5%) | 0 (0.0%) |
| 20 to 24 Minutes | 0 (0.0%) | 98 (10.3%) |
| 25 to 29 Minutes | 553 (40.0%) | 40 (4.2%) |
| 30 to 34 Minutes | 0 (0.0%) | 0 (0.0%) |
| 35 to 39 Minutes | 0 (0.0%) | 0 (0.0%) |
| 40 to 44 Minutes | 0 (0.0%) | 0 (0.0%) |
| 45 to 59 Minutes | 274 (19.8%) | 0 (0.0%) |
| 60 to 89 Minutes | 33 (2.4%) | 0 (0.0%) |
| 90 or more Minutes | 23 (1.7%) | 0 (0.0%) |
Time of Departure to Work by Sex in West Wendover
The most frequent times of departure to work in West Wendover are 5:30 AM to 5:59 AM (435, 31.5%) for males and 7:00 AM to 7:29 AM (249, 26.2%) for females.
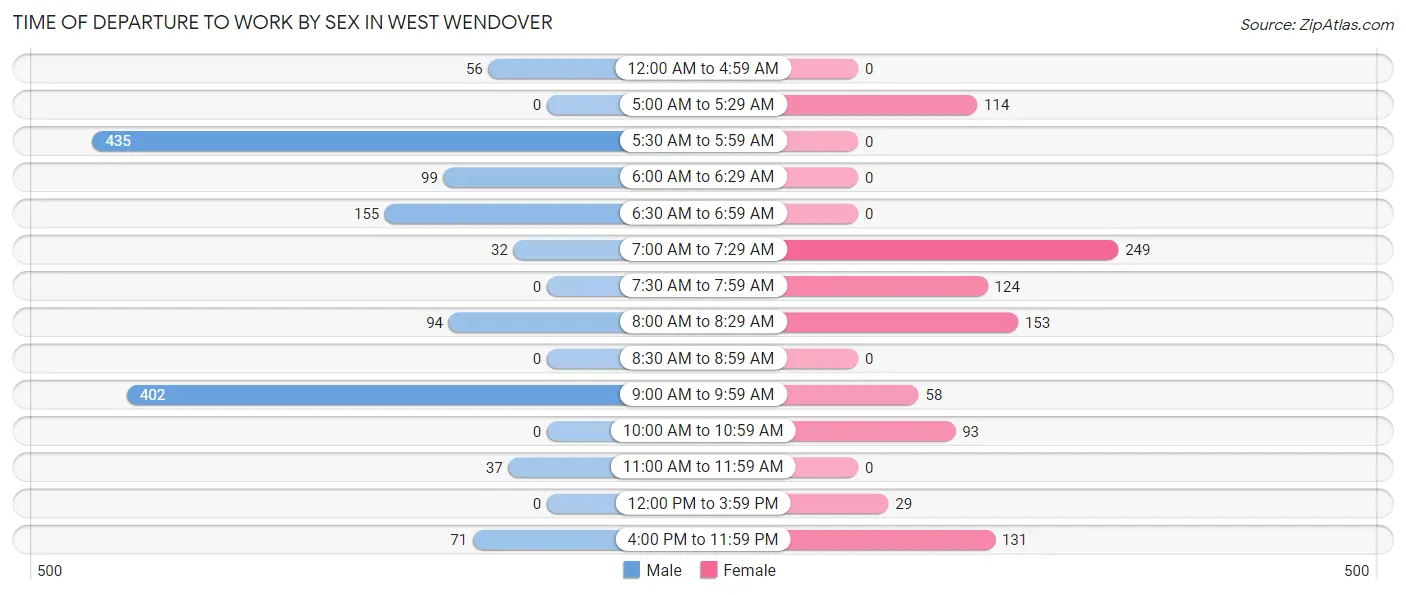
| Time of Departure | Male | Female |
| 12:00 AM to 4:59 AM | 56 (4.1%) | 0 (0.0%) |
| 5:00 AM to 5:29 AM | 0 (0.0%) | 114 (12.0%) |
| 5:30 AM to 5:59 AM | 435 (31.5%) | 0 (0.0%) |
| 6:00 AM to 6:29 AM | 99 (7.2%) | 0 (0.0%) |
| 6:30 AM to 6:59 AM | 155 (11.2%) | 0 (0.0%) |
| 7:00 AM to 7:29 AM | 32 (2.3%) | 249 (26.2%) |
| 7:30 AM to 7:59 AM | 0 (0.0%) | 124 (13.0%) |
| 8:00 AM to 8:29 AM | 94 (6.8%) | 153 (16.1%) |
| 8:30 AM to 8:59 AM | 0 (0.0%) | 0 (0.0%) |
| 9:00 AM to 9:59 AM | 402 (29.1%) | 58 (6.1%) |
| 10:00 AM to 10:59 AM | 0 (0.0%) | 93 (9.8%) |
| 11:00 AM to 11:59 AM | 37 (2.7%) | 0 (0.0%) |
| 12:00 PM to 3:59 PM | 0 (0.0%) | 29 (3.0%) |
| 4:00 PM to 11:59 PM | 71 (5.1%) | 131 (13.8%) |
| Total | 1,381 (100.0%) | 951 (100.0%) |
Housing Occupancy in West Wendover
Occupancy by Ownership in West Wendover
Of the total 1,771 dwellings in West Wendover, owner-occupied units account for 731 (41.3%), while renter-occupied units make up 1,040 (58.7%).
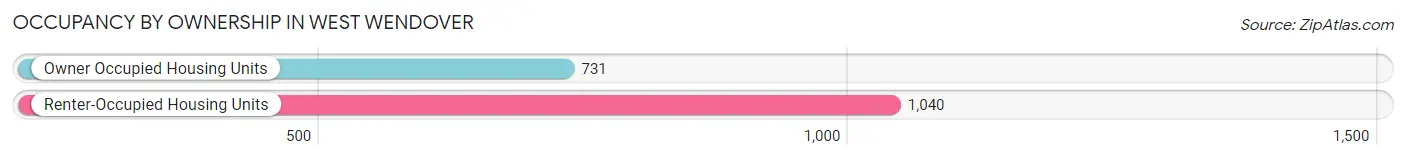
| Occupancy | # Housing Units | % Housing Units |
| Owner Occupied Housing Units | 731 | 41.3% |
| Renter-Occupied Housing Units | 1,040 | 58.7% |
| Total Occupied Housing Units | 1,771 | 100.0% |
Occupancy by Household Size in West Wendover
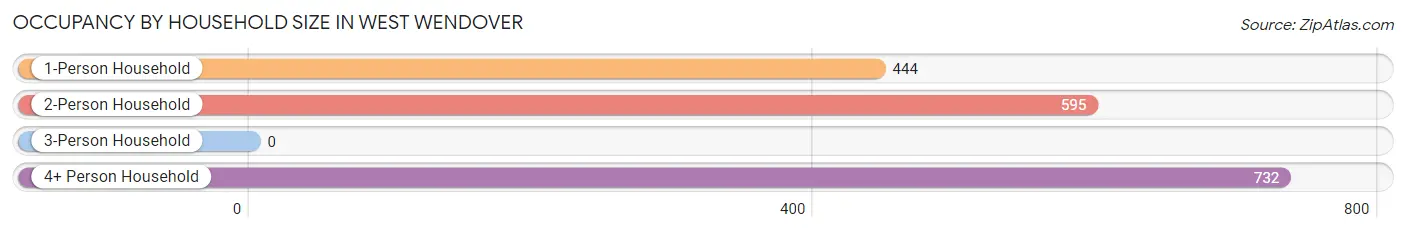
| Household Size | # Housing Units | % Housing Units |
| 1-Person Household | 444 | 25.1% |
| 2-Person Household | 595 | 33.6% |
| 3-Person Household | 0 | 0.0% |
| 4+ Person Household | 732 | 41.3% |
| Total Housing Units | 1,771 | 100.0% |
Occupancy by Ownership by Household Size in West Wendover
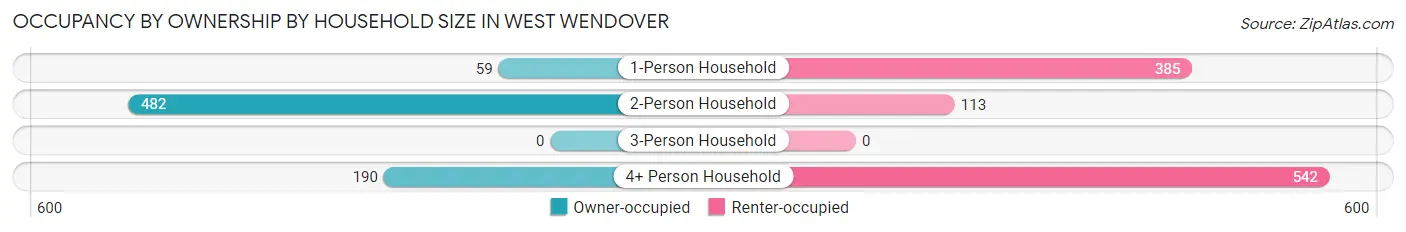
| Household Size | Owner-occupied | Renter-occupied |
| 1-Person Household | 59 (13.3%) | 385 (86.7%) |
| 2-Person Household | 482 (81.0%) | 113 (19.0%) |
| 3-Person Household | 0 (0.0%) | 0 (0.0%) |
| 4+ Person Household | 190 (26.0%) | 542 (74.0%) |
| Total Housing Units | 731 (41.3%) | 1,040 (58.7%) |
Occupancy by Educational Attainment in West Wendover
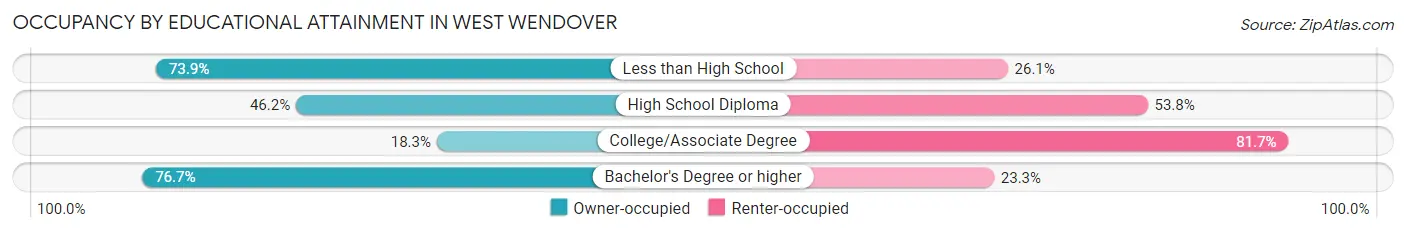
| Household Size | Owner-occupied | Renter-occupied |
| Less than High School | 139 (73.9%) | 49 (26.1%) |
| High School Diploma | 327 (46.2%) | 381 (53.8%) |
| College/Associate Degree | 127 (18.3%) | 568 (81.7%) |
| Bachelor's Degree or higher | 138 (76.7%) | 42 (23.3%) |
Occupancy by Age of Householder in West Wendover
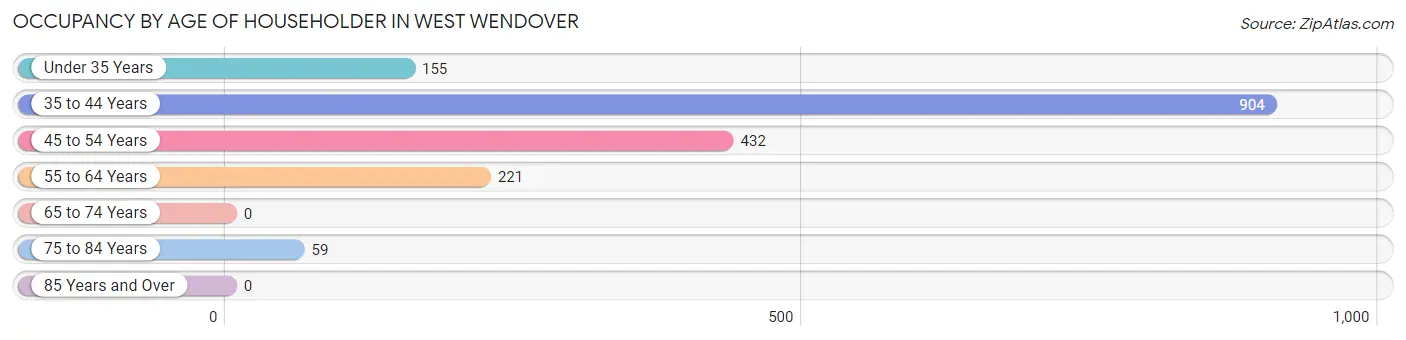
| Age Bracket | # Households | % Households |
| Under 35 Years | 155 | 8.7% |
| 35 to 44 Years | 904 | 51.0% |
| 45 to 54 Years | 432 | 24.4% |
| 55 to 64 Years | 221 | 12.5% |
| 65 to 74 Years | 0 | 0.0% |
| 75 to 84 Years | 59 | 3.3% |
| 85 Years and Over | 0 | 0.0% |
| Total | 1,771 | 100.0% |
Housing Finances in West Wendover
Median Income by Occupancy in West Wendover
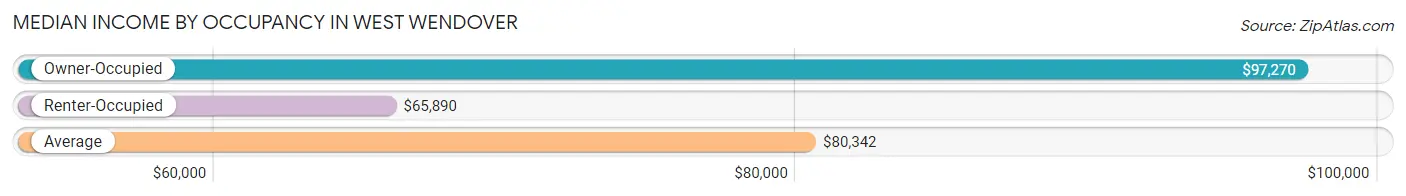
| Occupancy Type | # Households | Median Income |
| Owner-Occupied | 731 (41.3%) | $97,270 |
| Renter-Occupied | 1,040 (58.7%) | $65,890 |
| Average | 1,771 (100.0%) | $80,342 |
Occupancy by Householder Income Bracket in West Wendover
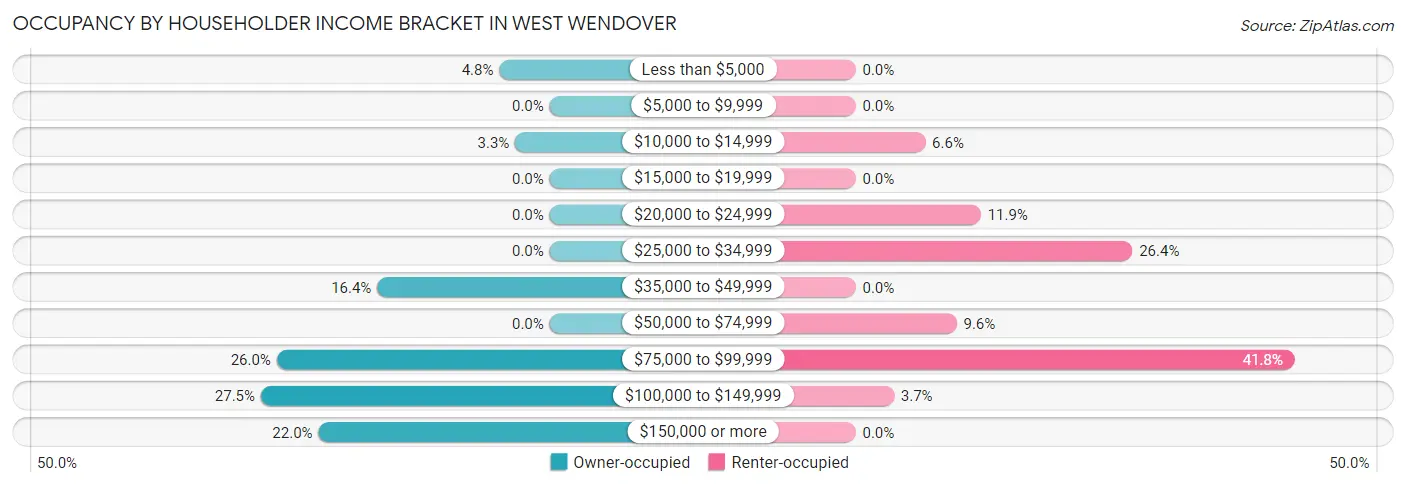
| Income Bracket | Owner-occupied | Renter-occupied |
| Less than $5,000 | 35 (4.8%) | 0 (0.0%) |
| $5,000 to $9,999 | 0 (0.0%) | 0 (0.0%) |
| $10,000 to $14,999 | 24 (3.3%) | 69 (6.6%) |
| $15,000 to $19,999 | 0 (0.0%) | 0 (0.0%) |
| $20,000 to $24,999 | 0 (0.0%) | 124 (11.9%) |
| $25,000 to $34,999 | 0 (0.0%) | 274 (26.4%) |
| $35,000 to $49,999 | 120 (16.4%) | 0 (0.0%) |
| $50,000 to $74,999 | 0 (0.0%) | 100 (9.6%) |
| $75,000 to $99,999 | 190 (26.0%) | 435 (41.8%) |
| $100,000 to $149,999 | 201 (27.5%) | 38 (3.6%) |
| $150,000 or more | 161 (22.0%) | 0 (0.0%) |
| Total | 731 (100.0%) | 1,040 (100.0%) |
Monthly Housing Cost Tiers in West Wendover
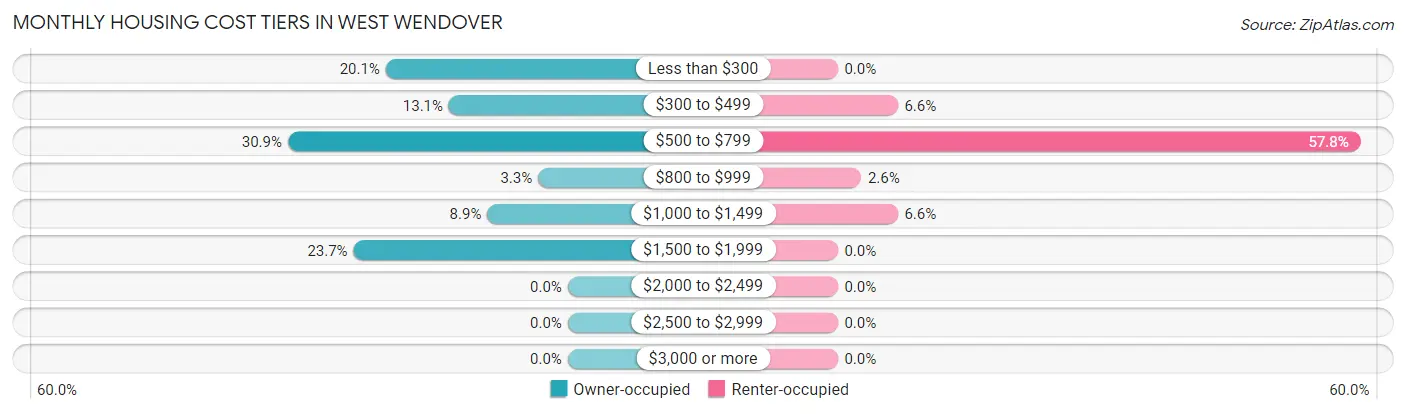
| Monthly Cost | Owner-occupied | Renter-occupied |
| Less than $300 | 147 (20.1%) | 0 (0.0%) |
| $300 to $499 | 96 (13.1%) | 69 (6.6%) |
| $500 to $799 | 226 (30.9%) | 601 (57.8%) |
| $800 to $999 | 24 (3.3%) | 27 (2.6%) |
| $1,000 to $1,499 | 65 (8.9%) | 69 (6.6%) |
| $1,500 to $1,999 | 173 (23.7%) | 0 (0.0%) |
| $2,000 to $2,499 | 0 (0.0%) | 0 (0.0%) |
| $2,500 to $2,999 | 0 (0.0%) | 0 (0.0%) |
| $3,000 or more | 0 (0.0%) | 0 (0.0%) |
| Total | 731 (100.0%) | 1,040 (100.0%) |
Physical Housing Characteristics in West Wendover
Housing Structures in West Wendover
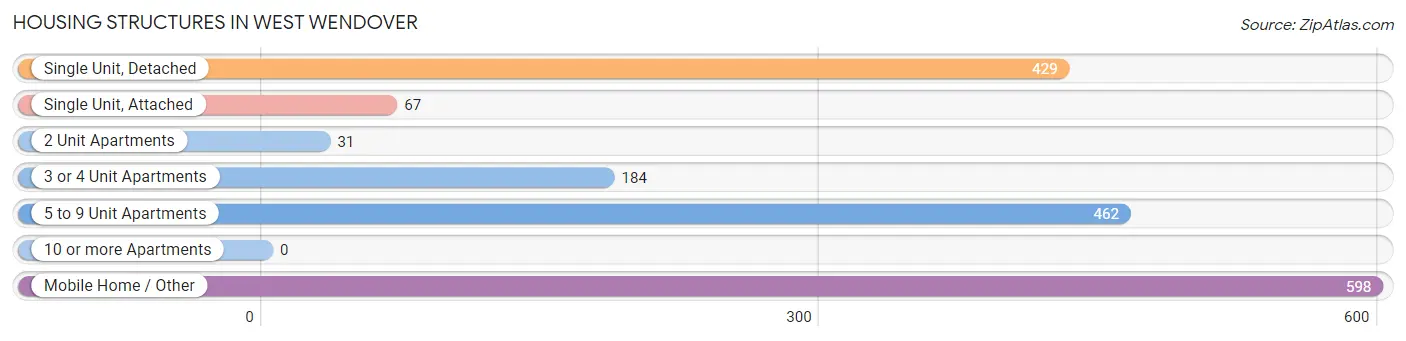
| Structure Type | # Housing Units | % Housing Units |
| Single Unit, Detached | 429 | 24.2% |
| Single Unit, Attached | 67 | 3.8% |
| 2 Unit Apartments | 31 | 1.8% |
| 3 or 4 Unit Apartments | 184 | 10.4% |
| 5 to 9 Unit Apartments | 462 | 26.1% |
| 10 or more Apartments | 0 | 0.0% |
| Mobile Home / Other | 598 | 33.8% |
| Total | 1,771 | 100.0% |
Housing Structures by Occupancy in West Wendover
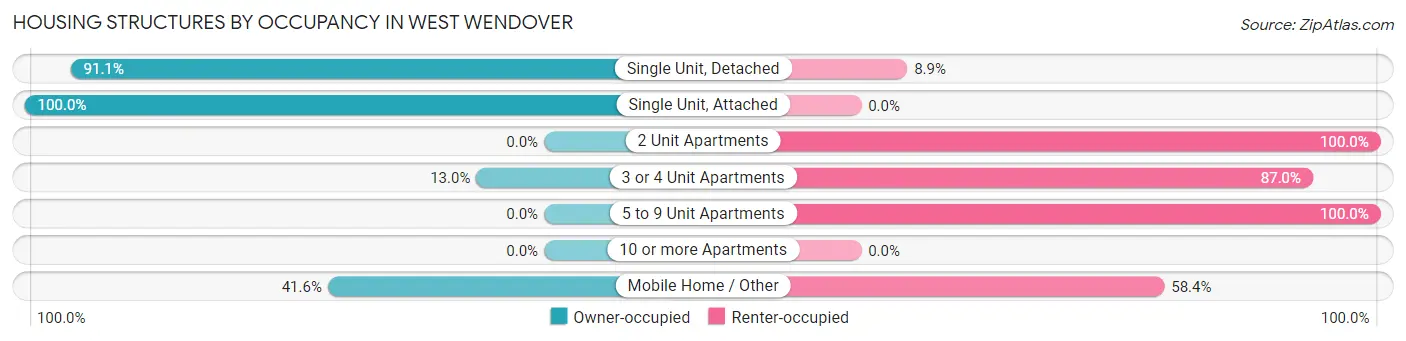
| Structure Type | Owner-occupied | Renter-occupied |
| Single Unit, Detached | 391 (91.1%) | 38 (8.9%) |
| Single Unit, Attached | 67 (100.0%) | 0 (0.0%) |
| 2 Unit Apartments | 0 (0.0%) | 31 (100.0%) |
| 3 or 4 Unit Apartments | 24 (13.0%) | 160 (87.0%) |
| 5 to 9 Unit Apartments | 0 (0.0%) | 462 (100.0%) |
| 10 or more Apartments | 0 (0.0%) | 0 (0.0%) |
| Mobile Home / Other | 249 (41.6%) | 349 (58.4%) |
| Total | 731 (41.3%) | 1,040 (58.7%) |
Housing Structures by Number of Rooms in West Wendover
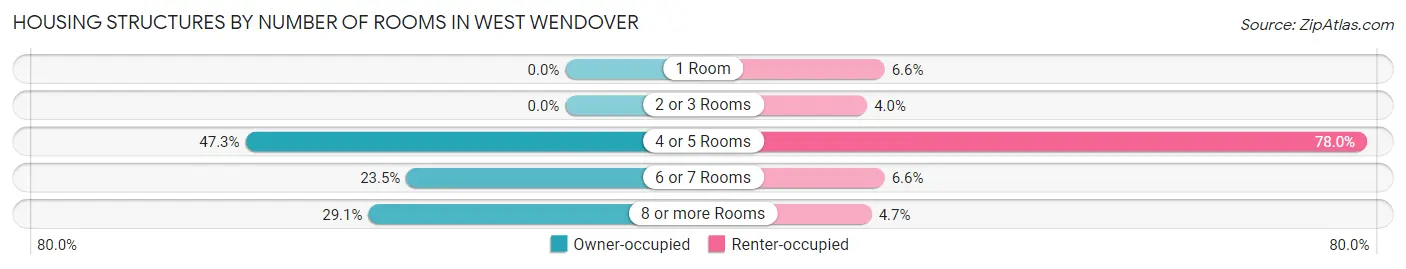
| Number of Rooms | Owner-occupied | Renter-occupied |
| 1 Room | 0 (0.0%) | 69 (6.6%) |
| 2 or 3 Rooms | 0 (0.0%) | 42 (4.0%) |
| 4 or 5 Rooms | 346 (47.3%) | 811 (78.0%) |
| 6 or 7 Rooms | 172 (23.5%) | 69 (6.6%) |
| 8 or more Rooms | 213 (29.1%) | 49 (4.7%) |
| Total | 731 (100.0%) | 1,040 (100.0%) |
Housing Structure by Heating Type in West Wendover
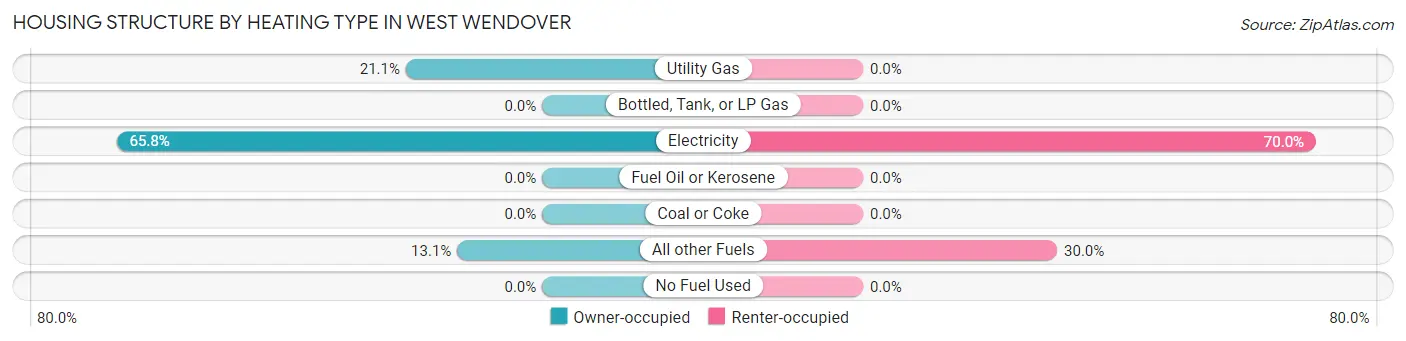
| Heating Type | Owner-occupied | Renter-occupied |
| Utility Gas | 154 (21.1%) | 0 (0.0%) |
| Bottled, Tank, or LP Gas | 0 (0.0%) | 0 (0.0%) |
| Electricity | 481 (65.8%) | 728 (70.0%) |
| Fuel Oil or Kerosene | 0 (0.0%) | 0 (0.0%) |
| Coal or Coke | 0 (0.0%) | 0 (0.0%) |
| All other Fuels | 96 (13.1%) | 312 (30.0%) |
| No Fuel Used | 0 (0.0%) | 0 (0.0%) |
| Total | 731 (100.0%) | 1,040 (100.0%) |
Household Vehicle Usage in West Wendover
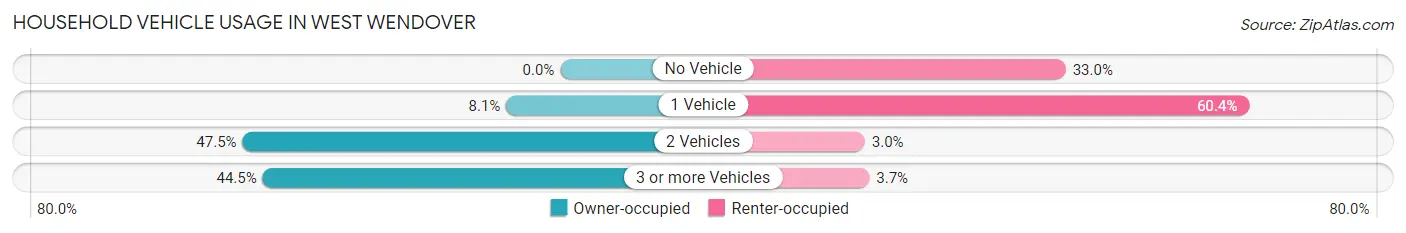
| Vehicles per Household | Owner-occupied | Renter-occupied |
| No Vehicle | 0 (0.0%) | 343 (33.0%) |
| 1 Vehicle | 59 (8.1%) | 628 (60.4%) |
| 2 Vehicles | 347 (47.5%) | 31 (3.0%) |
| 3 or more Vehicles | 325 (44.5%) | 38 (3.6%) |
| Total | 731 (100.0%) | 1,040 (100.0%) |
Real Estate & Mortgages in West Wendover
Real Estate and Mortgage Overview in West Wendover
| Characteristic | Without Mortgage | With Mortgage |
| Housing Units | 469 | 262 |
| Median Property Value | - | - |
| Median Household Income | $96,743 | $33 |
| Monthly Housing Costs | $463 | $0 |
| Real Estate Taxes | $2,775 | $0 |
Property Value by Mortgage Status in West Wendover
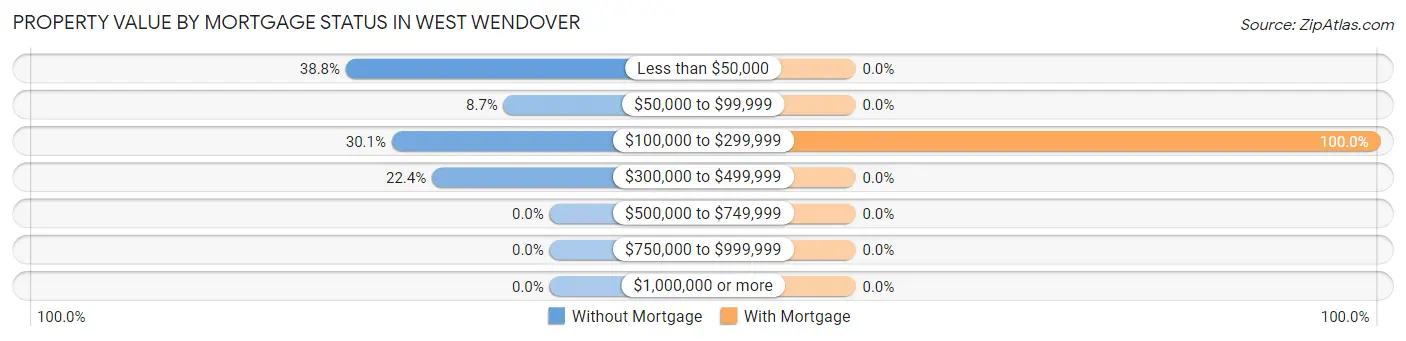
| Property Value | Without Mortgage | With Mortgage |
| Less than $50,000 | 182 (38.8%) | 0 (0.0%) |
| $50,000 to $99,999 | 41 (8.7%) | 0 (0.0%) |
| $100,000 to $299,999 | 141 (30.1%) | 262 (100.0%) |
| $300,000 to $499,999 | 105 (22.4%) | 0 (0.0%) |
| $500,000 to $749,999 | 0 (0.0%) | 0 (0.0%) |
| $750,000 to $999,999 | 0 (0.0%) | 0 (0.0%) |
| $1,000,000 or more | 0 (0.0%) | 0 (0.0%) |
| Total | 469 (100.0%) | 262 (100.0%) |
Household Income by Mortgage Status in West Wendover
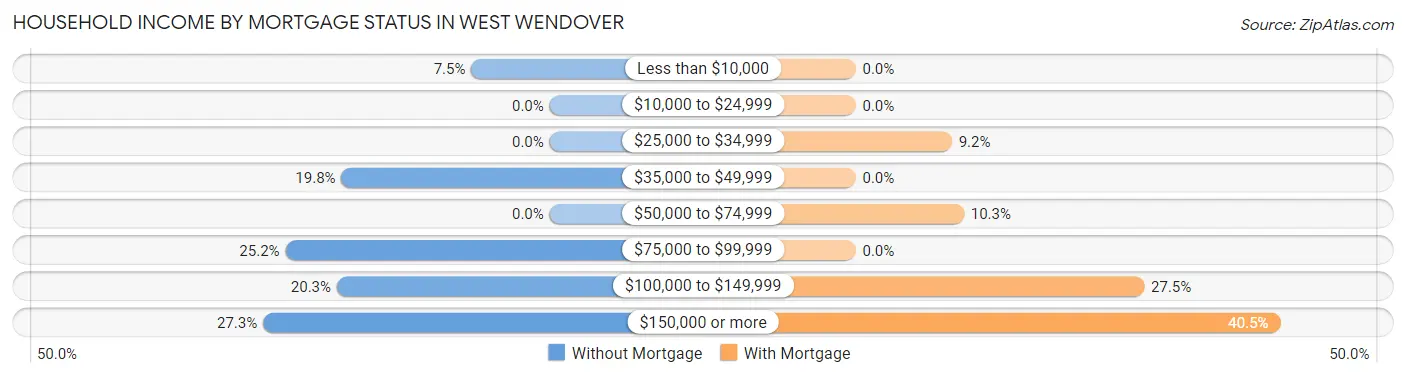
| Household Income | Without Mortgage | With Mortgage |
| Less than $10,000 | 35 (7.5%) | 0 (0.0%) |
| $10,000 to $24,999 | 0 (0.0%) | 0 (0.0%) |
| $25,000 to $34,999 | 0 (0.0%) | 24 (9.2%) |
| $35,000 to $49,999 | 93 (19.8%) | 0 (0.0%) |
| $50,000 to $74,999 | 0 (0.0%) | 27 (10.3%) |
| $75,000 to $99,999 | 118 (25.2%) | 0 (0.0%) |
| $100,000 to $149,999 | 95 (20.3%) | 72 (27.5%) |
| $150,000 or more | 128 (27.3%) | 106 (40.5%) |
| Total | 469 (100.0%) | 262 (100.0%) |
Property Value to Household Income Ratio in West Wendover
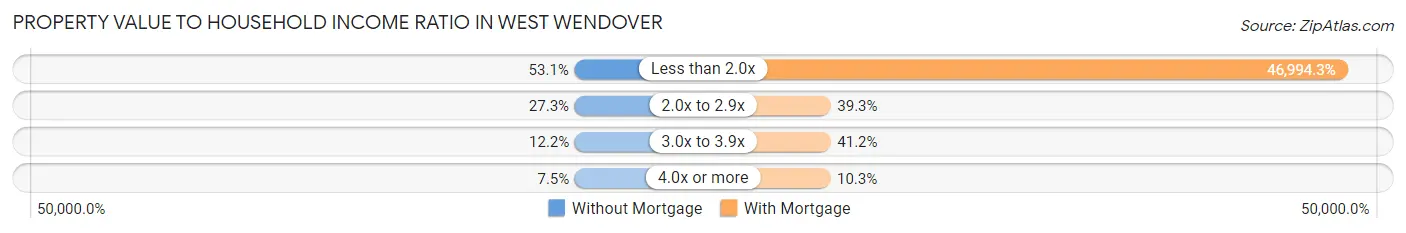
| Value-to-Income Ratio | Without Mortgage | With Mortgage |
| Less than 2.0x | 249 (53.1%) | 123,125 (46,994.3%) |
| 2.0x to 2.9x | 128 (27.3%) | 103 (39.3%) |
| 3.0x to 3.9x | 57 (12.1%) | 108 (41.2%) |
| 4.0x or more | 35 (7.5%) | 27 (10.3%) |
| Total | 469 (100.0%) | 262 (100.0%) |
Real Estate Taxes by Mortgage Status in West Wendover
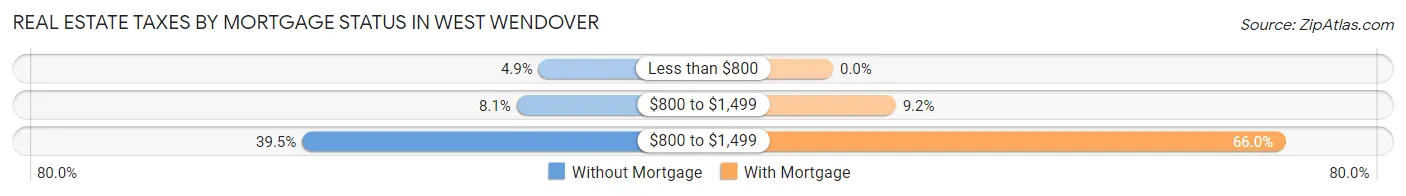
| Property Taxes | Without Mortgage | With Mortgage |
| Less than $800 | 23 (4.9%) | 0 (0.0%) |
| $800 to $1,499 | 38 (8.1%) | 24 (9.2%) |
| $800 to $1,499 | 185 (39.5%) | 173 (66.0%) |
| Total | 469 (100.0%) | 262 (100.0%) |
Health & Disability in West Wendover
Health Insurance Coverage by Age in West Wendover
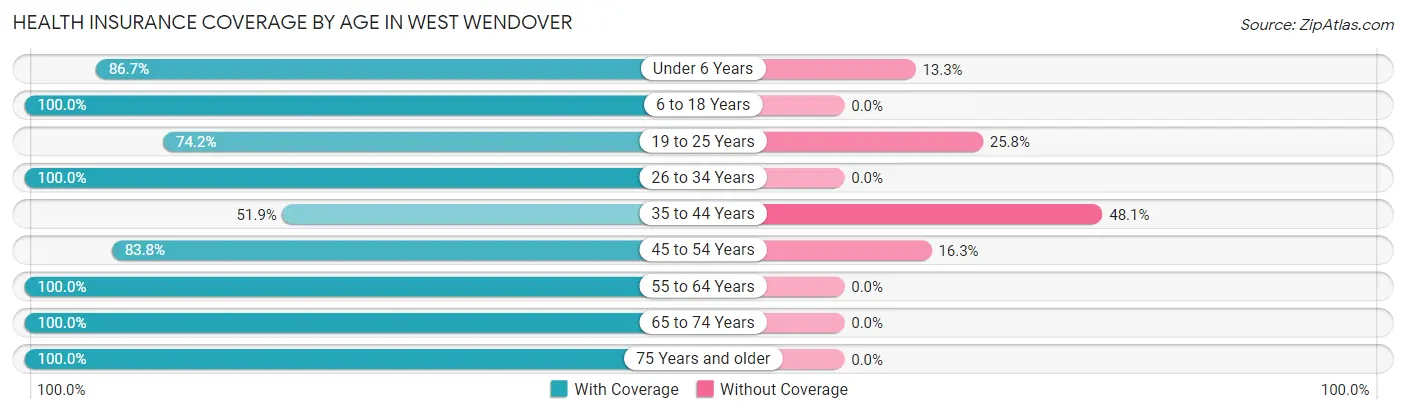
| Age Bracket | With Coverage | Without Coverage |
| Under 6 Years | 477 (86.7%) | 73 (13.3%) |
| 6 to 18 Years | 1,018 (100.0%) | 0 (0.0%) |
| 19 to 25 Years | 89 (74.2%) | 31 (25.8%) |
| 26 to 34 Years | 590 (100.0%) | 0 (0.0%) |
| 35 to 44 Years | 469 (51.9%) | 435 (48.1%) |
| 45 to 54 Years | 675 (83.8%) | 131 (16.3%) |
| 55 to 64 Years | 396 (100.0%) | 0 (0.0%) |
| 65 to 74 Years | 70 (100.0%) | 0 (0.0%) |
| 75 Years and older | 59 (100.0%) | 0 (0.0%) |
| Total | 3,843 (85.2%) | 670 (14.8%) |
Health Insurance Coverage by Citizenship Status in West Wendover
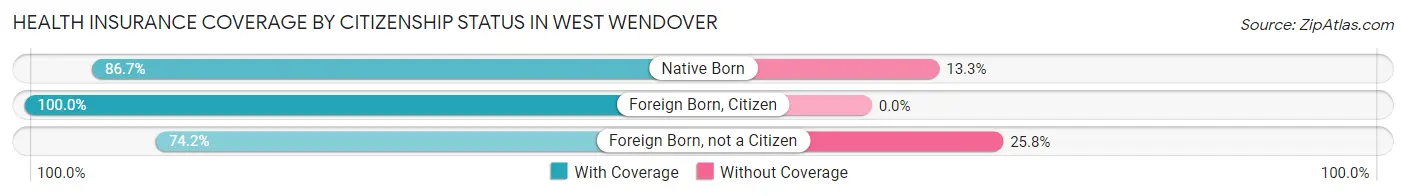
| Citizenship Status | With Coverage | Without Coverage |
| Native Born | 477 (86.7%) | 73 (13.3%) |
| Foreign Born, Citizen | 1,018 (100.0%) | 0 (0.0%) |
| Foreign Born, not a Citizen | 89 (74.2%) | 31 (25.8%) |
Health Insurance Coverage by Household Income in West Wendover
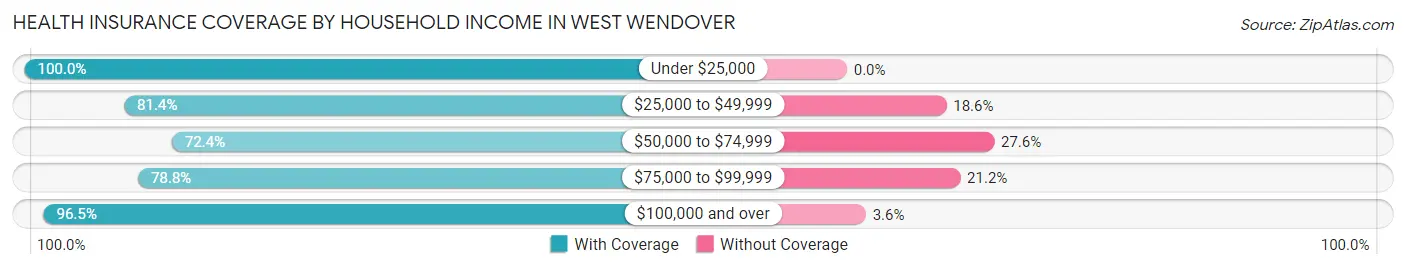
| Household Income | With Coverage | Without Coverage |
| Under $25,000 | 520 (100.0%) | 0 (0.0%) |
| $25,000 to $49,999 | 406 (81.4%) | 93 (18.6%) |
| $50,000 to $74,999 | 273 (72.4%) | 104 (27.6%) |
| $75,000 to $99,999 | 1,613 (78.8%) | 435 (21.2%) |
| $100,000 and over | 1,031 (96.5%) | 38 (3.5%) |
Public vs Private Health Insurance Coverage by Age in West Wendover
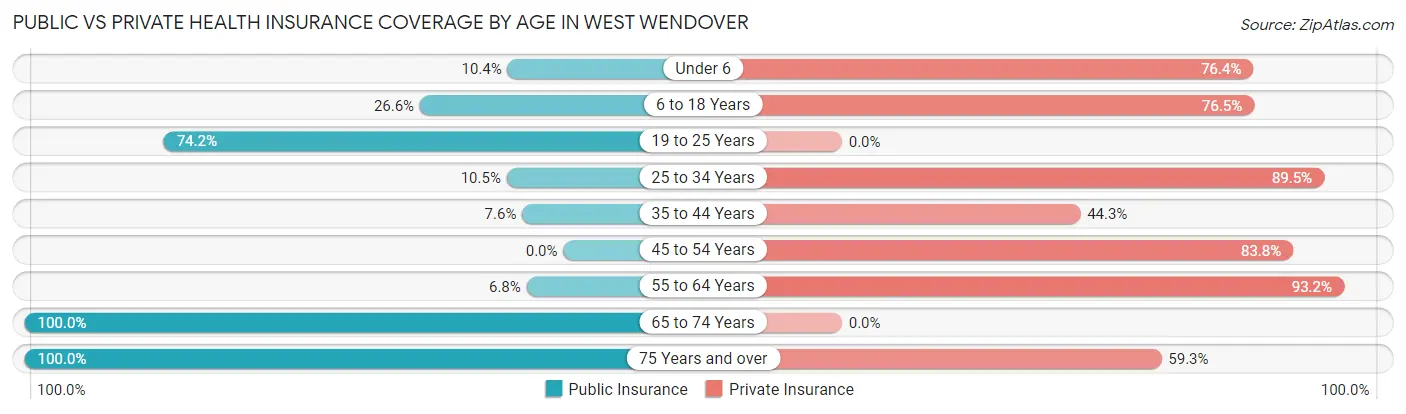
| Age Bracket | Public Insurance | Private Insurance |
| Under 6 | 57 (10.4%) | 420 (76.4%) |
| 6 to 18 Years | 271 (26.6%) | 779 (76.5%) |
| 19 to 25 Years | 89 (74.2%) | 0 (0.0%) |
| 25 to 34 Years | 62 (10.5%) | 528 (89.5%) |
| 35 to 44 Years | 69 (7.6%) | 400 (44.3%) |
| 45 to 54 Years | 0 (0.0%) | 675 (83.8%) |
| 55 to 64 Years | 27 (6.8%) | 369 (93.2%) |
| 65 to 74 Years | 70 (100.0%) | 0 (0.0%) |
| 75 Years and over | 59 (100.0%) | 35 (59.3%) |
| Total | 704 (15.6%) | 3,206 (71.0%) |
Disability Status by Sex by Age in West Wendover
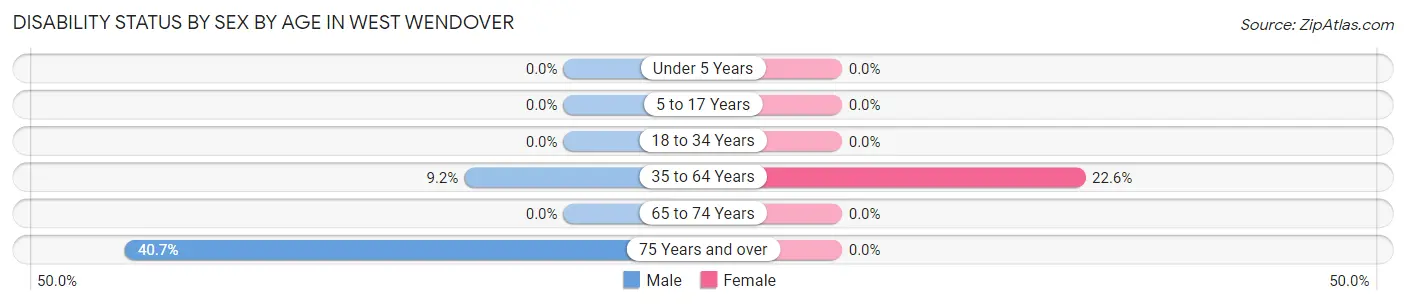
| Age Bracket | Male | Female |
| Under 5 Years | 0 (0.0%) | 0 (0.0%) |
| 5 to 17 Years | 0 (0.0%) | 0 (0.0%) |
| 18 to 34 Years | 0 (0.0%) | 0 (0.0%) |
| 35 to 64 Years | 134 (9.2%) | 147 (22.6%) |
| 65 to 74 Years | 0 (0.0%) | 0 (0.0%) |
| 75 Years and over | 24 (40.7%) | 0 (0.0%) |
Disability Class by Sex by Age in West Wendover
Disability Class: Hearing Difficulty
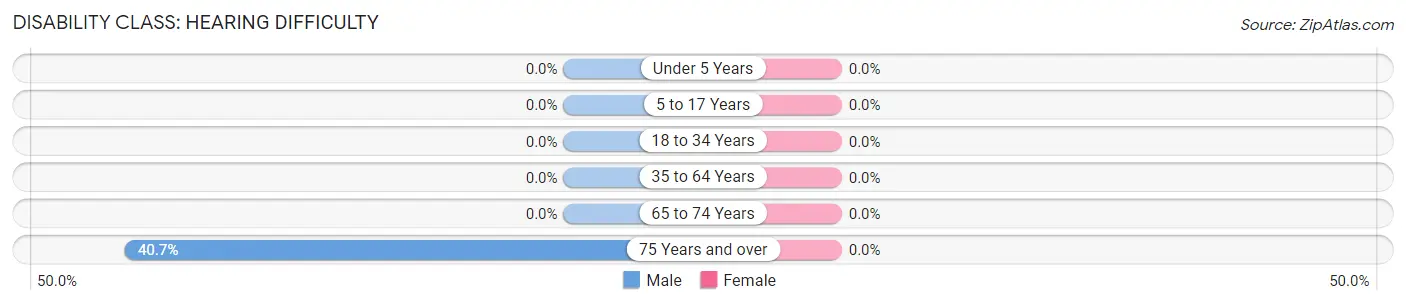
| Age Bracket | Male | Female |
| Under 5 Years | 0 (0.0%) | 0 (0.0%) |
| 5 to 17 Years | 0 (0.0%) | 0 (0.0%) |
| 18 to 34 Years | 0 (0.0%) | 0 (0.0%) |
| 35 to 64 Years | 0 (0.0%) | 0 (0.0%) |
| 65 to 74 Years | 0 (0.0%) | 0 (0.0%) |
| 75 Years and over | 24 (40.7%) | 0 (0.0%) |
Disability Class: Vision Difficulty
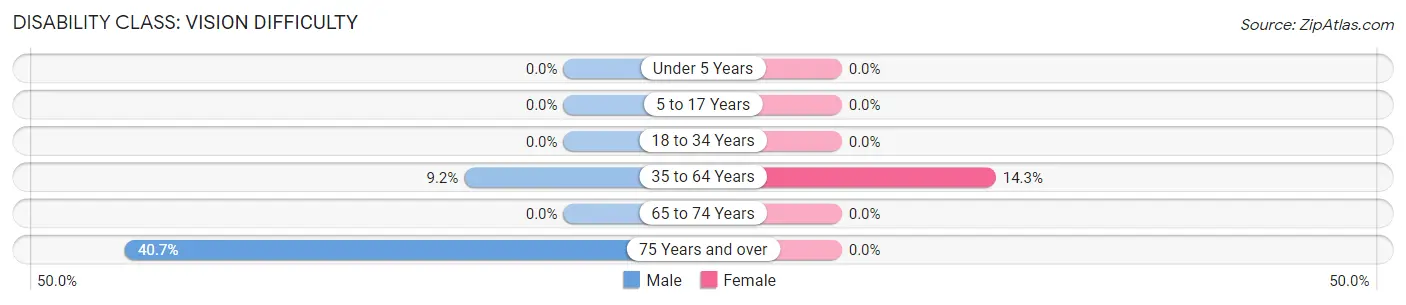
| Age Bracket | Male | Female |
| Under 5 Years | 0 (0.0%) | 0 (0.0%) |
| 5 to 17 Years | 0 (0.0%) | 0 (0.0%) |
| 18 to 34 Years | 0 (0.0%) | 0 (0.0%) |
| 35 to 64 Years | 134 (9.2%) | 93 (14.3%) |
| 65 to 74 Years | 0 (0.0%) | 0 (0.0%) |
| 75 Years and over | 24 (40.7%) | 0 (0.0%) |
Disability Class: Cognitive Difficulty
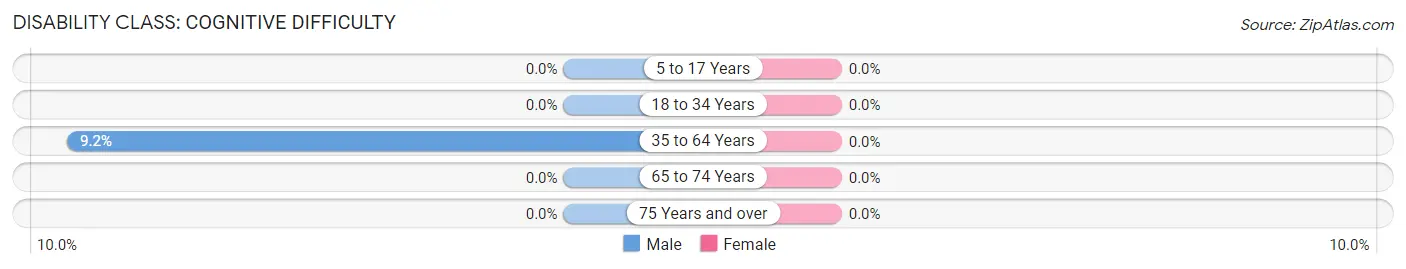
| Age Bracket | Male | Female |
| 5 to 17 Years | 0 (0.0%) | 0 (0.0%) |
| 18 to 34 Years | 0 (0.0%) | 0 (0.0%) |
| 35 to 64 Years | 134 (9.2%) | 0 (0.0%) |
| 65 to 74 Years | 0 (0.0%) | 0 (0.0%) |
| 75 Years and over | 0 (0.0%) | 0 (0.0%) |
Disability Class: Ambulatory Difficulty
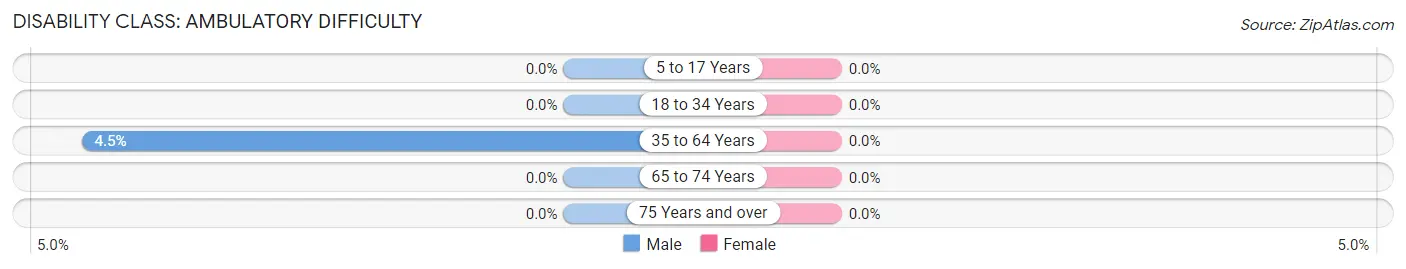
| Age Bracket | Male | Female |
| 5 to 17 Years | 0 (0.0%) | 0 (0.0%) |
| 18 to 34 Years | 0 (0.0%) | 0 (0.0%) |
| 35 to 64 Years | 65 (4.5%) | 0 (0.0%) |
| 65 to 74 Years | 0 (0.0%) | 0 (0.0%) |
| 75 Years and over | 0 (0.0%) | 0 (0.0%) |
Disability Class: Self-Care Difficulty
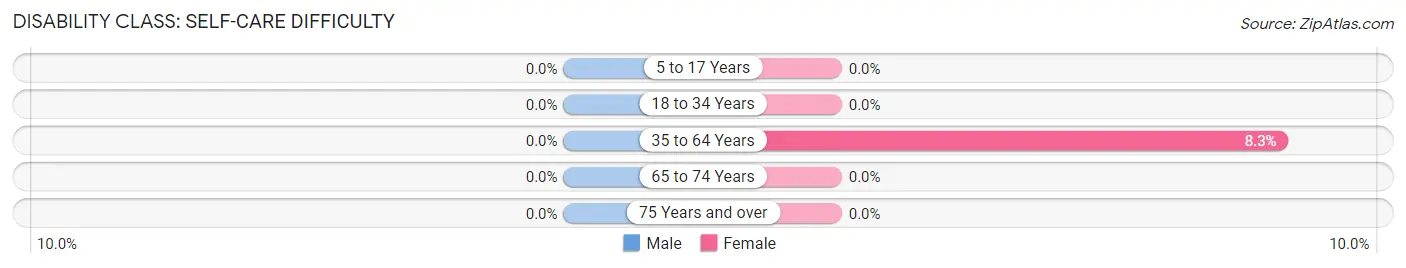
| Age Bracket | Male | Female |
| 5 to 17 Years | 0 (0.0%) | 0 (0.0%) |
| 18 to 34 Years | 0 (0.0%) | 0 (0.0%) |
| 35 to 64 Years | 0 (0.0%) | 54 (8.3%) |
| 65 to 74 Years | 0 (0.0%) | 0 (0.0%) |
| 75 Years and over | 0 (0.0%) | 0 (0.0%) |
Technology Access in West Wendover
Computing Device Access in West Wendover
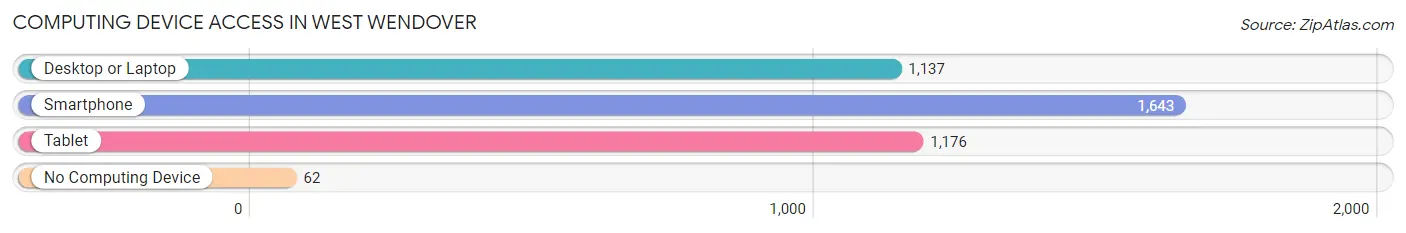
| Device Type | # Households | % Households |
| Desktop or Laptop | 1,137 | 64.2% |
| Smartphone | 1,643 | 92.8% |
| Tablet | 1,176 | 66.4% |
| No Computing Device | 62 | 3.5% |
| Total | 1,771 | 100.0% |
Internet Access in West Wendover
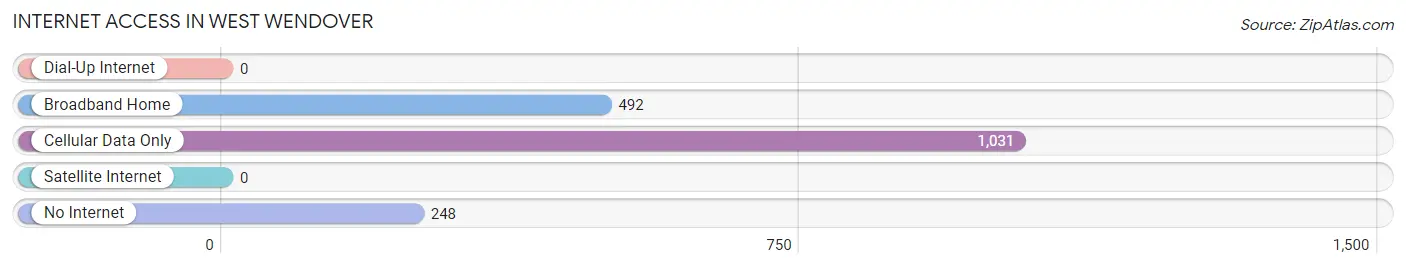
| Internet Type | # Households | % Households |
| Dial-Up Internet | 0 | 0.0% |
| Broadband Home | 492 | 27.8% |
| Cellular Data Only | 1,031 | 58.2% |
| Satellite Internet | 0 | 0.0% |
| No Internet | 248 | 14.0% |
| Total | 1,771 | 100.0% |
West Wendover Summary
Wendover, Nevada is a small city located on the border of Nevada and Utah. It is part of the Elko County, Nevada and is located in the Great Basin region of the United States. The city is located on the western edge of the Great Salt Lake Desert and is home to the Wendover Air Force Base. The city has a population of 1,521 as of the 2010 census.
History
The area that is now Wendover was first inhabited by the Western Shoshone Native American tribe. The first non-native settlers arrived in the area in the late 19th century. The town was originally known as West Wendover and was established in 1908. The town was named after a nearby railroad station that was named after a nearby ranch owned by a man named Wendover.
The town was initially a small farming community, but it began to grow in the 1920s when the Union Pacific Railroad built a line through the area. The railroad brought in new settlers and businesses, and the town began to grow.
In 1941, the United States Army Air Corps established the Wendover Air Force Base in the area. The base was used to train bomber crews during World War II and was later used as a testing site for the atomic bomb. The base was closed in 1969, but the city of Wendover still benefits from the presence of the base.
Geography
Wendover is located in the Great Basin region of the United States. The city is located on the western edge of the Great Salt Lake Desert and is bordered by the Nevada-Utah state line. The city is located at an elevation of 4,400 feet and has a total area of 4.2 square miles.
The city is located in a semi-arid climate zone and has hot summers and cold winters. The average annual temperature is 54 degrees Fahrenheit and the average annual precipitation is 8.5 inches.
Economy
The economy of Wendover is largely based on tourism and gambling. The city is home to several casinos, including the Peppermill Casino and the Montego Bay Casino. The casinos attract visitors from all over the world and provide a significant source of revenue for the city.
The city is also home to several other businesses, including restaurants, hotels, and retail stores. The city is also home to the Wendover Airport, which provides air service to the city.
Demographics
As of the 2010 census, the population of Wendover was 1,521. The racial makeup of the city was 75.3% White, 0.7% African American, 0.7% Native American, 0.7% Asian, 0.2% Pacific Islander, and 21.7% from other races. Hispanic or Latino of any race were 28.2% of the population.
The median income for a household in the city was $37,500 and the median income for a family was $41,250. The per capita income for the city was $17,845. About 16.2% of the population was below the poverty line.
Common Questions
What is Per Capita Income in West Wendover?
Per Capita income in West Wendover is $28,708.
What is the Median Family Income in West Wendover?
Median Family Income in West Wendover is $81,509.
What is the Median Household income in West Wendover?
Median Household Income in West Wendover is $80,342.
What is Income or Wage Gap in West Wendover?
Income or Wage Gap in West Wendover is 51.5%.
Women in West Wendover earn 48.5 cents for every dollar earned by a man.
What is Inequality or Gini Index in West Wendover?
Inequality or Gini Index in West Wendover is 0.35.
What is the Total Population of West Wendover?
Total Population of West Wendover is 4,513.
What is the Total Male Population of West Wendover?
Total Male Population of West Wendover is 2,078.
What is the Total Female Population of West Wendover?
Total Female Population of West Wendover is 2,435.
What is the Ratio of Males per 100 Females in West Wendover?
There are 85.34 Males per 100 Females in West Wendover.
What is the Ratio of Females per 100 Males in West Wendover?
There are 117.18 Females per 100 Males in West Wendover.
What is the Median Population Age in West Wendover?
Median Population Age in West Wendover is 33.9 Years.
What is the Average Family Size in West Wendover
Average Family Size in West Wendover is 3.1 People.
What is the Average Household Size in West Wendover
Average Household Size in West Wendover is 2.5 People.
How Large is the Labor Force in West Wendover?
There are 2,490 People in the Labor Forcein in West Wendover.
What is the Percentage of People in the Labor Force in West Wendover?
79.0% of People are in the Labor Force in West Wendover.
What is the Unemployment Rate in West Wendover?
Unemployment Rate in West Wendover is 3.0%.