Spring Creek, NV Map & Demographics
Spring Creek Map
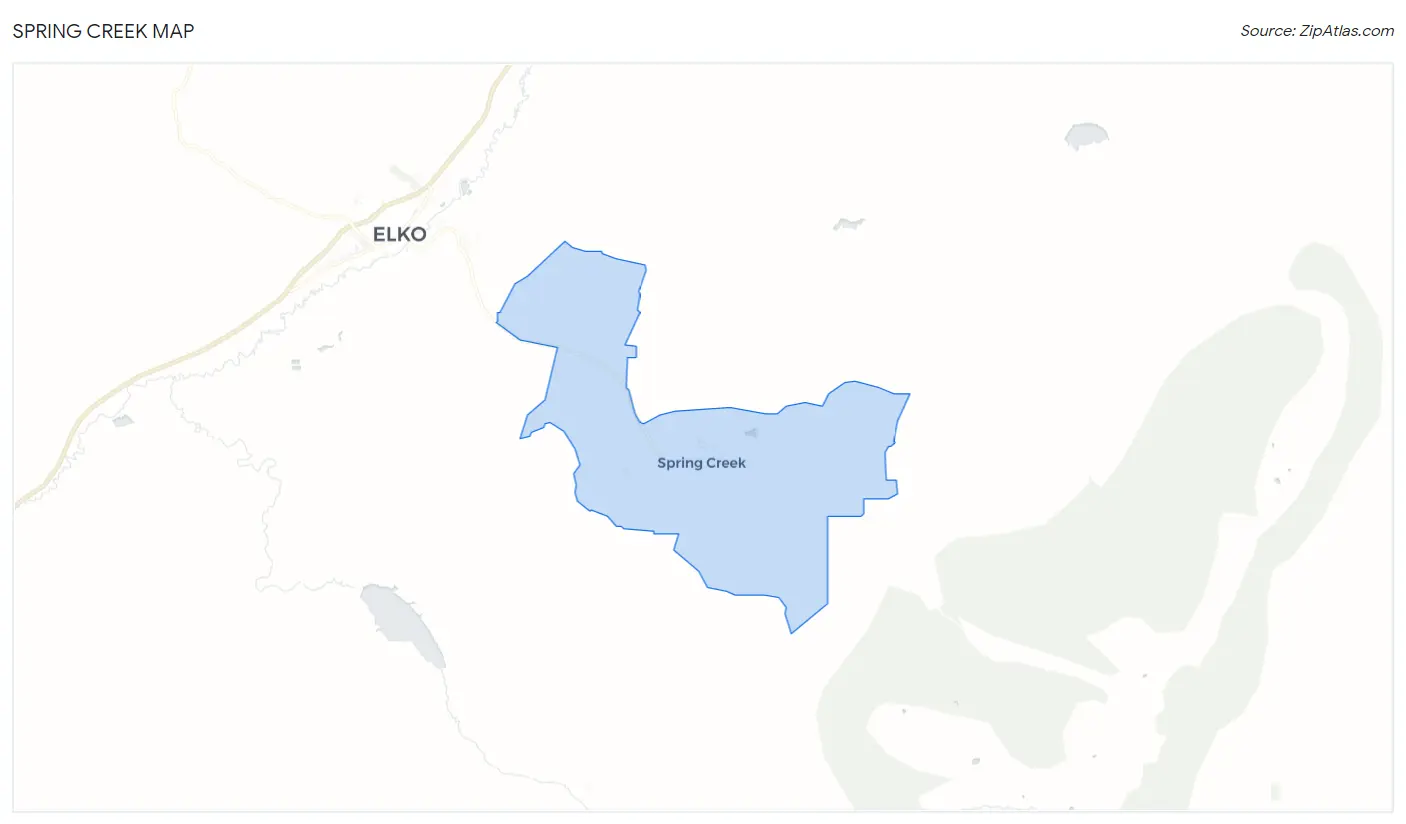
Spring Creek Overview
$42,837
PER CAPITA INCOME
$118,899
AVG FAMILY INCOME
$109,952
AVG HOUSEHOLD INCOME
54.8%
WAGE / INCOME GAP [ % ]
45.2¢/ $1
WAGE / INCOME GAP [ $ ]
$6,777
FAMILY INCOME DEFICIT
0.36
INEQUALITY / GINI INDEX
15,062
TOTAL POPULATION
7,890
MALE POPULATION
7,172
FEMALE POPULATION
110.01
MALES / 100 FEMALES
90.90
FEMALES / 100 MALES
34.4
MEDIAN AGE
3.6
AVG FAMILY SIZE
3.1
AVG HOUSEHOLD SIZE
7,468
LABOR FORCE [ PEOPLE ]
66.1%
PERCENT IN LABOR FORCE
3.7%
UNEMPLOYMENT RATE
Spring Creek Zip Codes
Spring Creek Area Codes
Income in Spring Creek
Income Overview in Spring Creek
Per Capita Income in Spring Creek is $42,837, while median incomes of families and households are $118,899 and $109,952 respectively.
| Characteristic | Number | Measure |
| Per Capita Income | 15,062 | $42,837 |
| Median Family Income | 3,650 | $118,899 |
| Mean Family Income | 3,650 | $134,074 |
| Median Household Income | 4,851 | $109,952 |
| Mean Household Income | 4,851 | $124,276 |
| Income Deficit | 3,650 | $6,777 |
| Wage / Income Gap (%) | 15,062 | 54.84% |
| Wage / Income Gap ($) | 15,062 | 45.16¢ per $1 |
| Gini / Inequality Index | 15,062 | 0.36 |
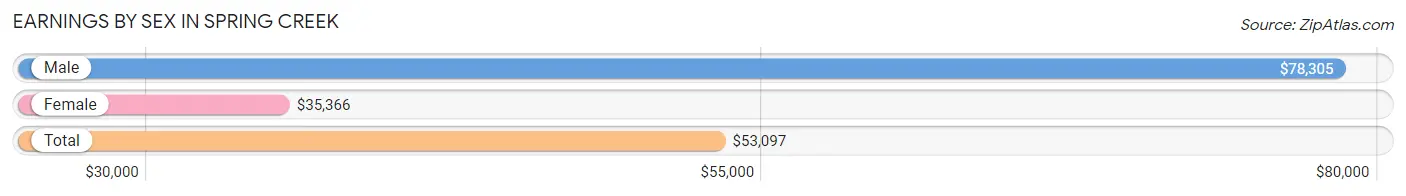
Earnings by Sex in Spring Creek
Average Earnings in Spring Creek are $53,097, $78,305 for men and $35,366 for women, a difference of 54.8%.
| Sex | Number | Average Earnings |
| Male | 4,504 (58.2%) | $78,305 |
| Female | 3,238 (41.8%) | $35,366 |
| Total | 7,742 (100.0%) | $53,097 |
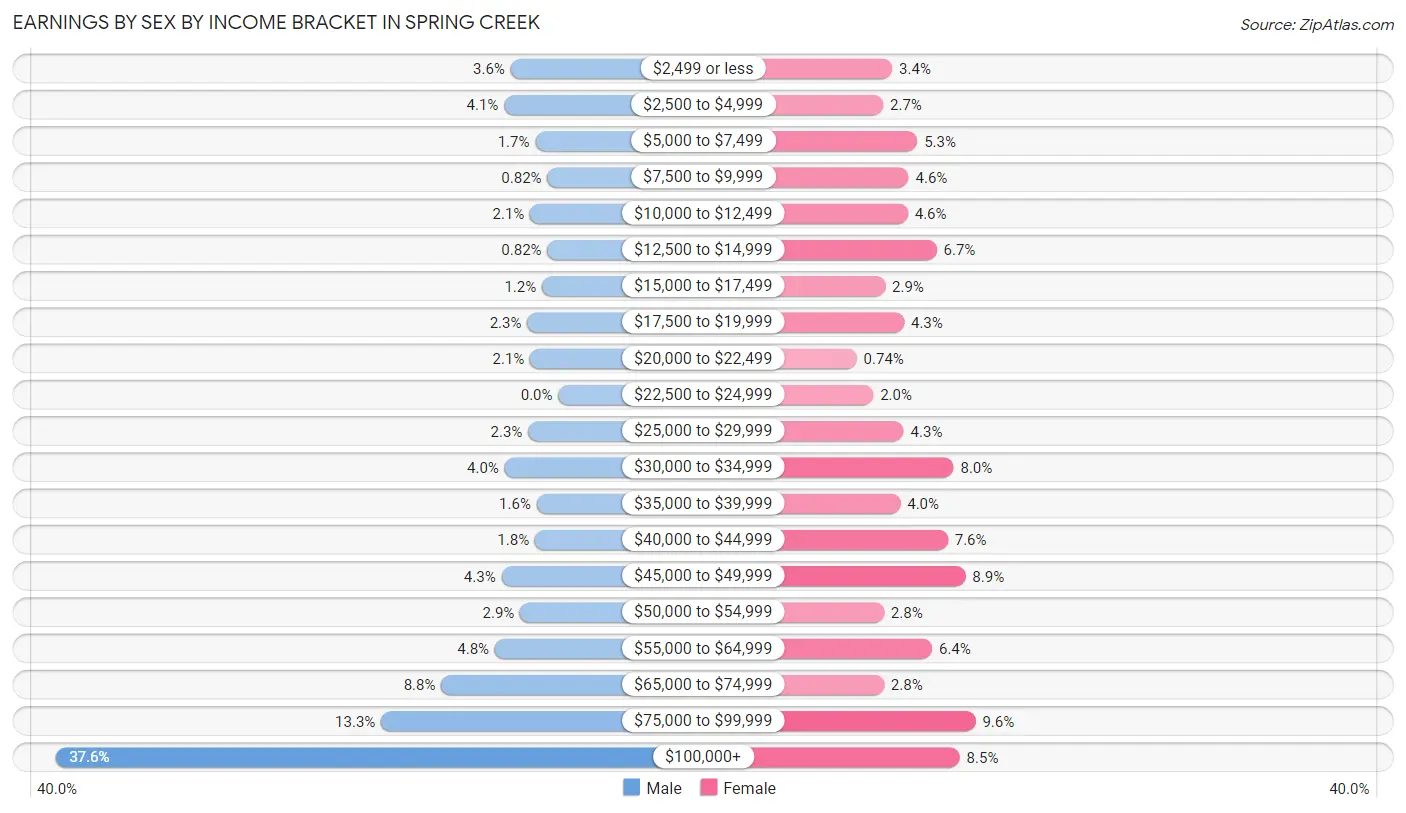
Earnings by Sex by Income Bracket in Spring Creek
The most common earnings brackets in Spring Creek are $100,000+ for men (1,695 | 37.6%) and $75,000 to $99,999 for women (312 | 9.6%).
| Income | Male | Female |
| $2,499 or less | 161 (3.6%) | 110 (3.4%) |
| $2,500 to $4,999 | 183 (4.1%) | 88 (2.7%) |
| $5,000 to $7,499 | 78 (1.7%) | 171 (5.3%) |
| $7,500 to $9,999 | 37 (0.8%) | 150 (4.6%) |
| $10,000 to $12,499 | 95 (2.1%) | 148 (4.6%) |
| $12,500 to $14,999 | 37 (0.8%) | 218 (6.7%) |
| $15,000 to $17,499 | 55 (1.2%) | 93 (2.9%) |
| $17,500 to $19,999 | 105 (2.3%) | 139 (4.3%) |
| $20,000 to $22,499 | 95 (2.1%) | 24 (0.7%) |
| $22,500 to $24,999 | 0 (0.0%) | 64 (2.0%) |
| $25,000 to $29,999 | 102 (2.3%) | 138 (4.3%) |
| $30,000 to $34,999 | 181 (4.0%) | 259 (8.0%) |
| $35,000 to $39,999 | 73 (1.6%) | 130 (4.0%) |
| $40,000 to $44,999 | 79 (1.8%) | 245 (7.6%) |
| $45,000 to $49,999 | 192 (4.3%) | 288 (8.9%) |
| $50,000 to $54,999 | 129 (2.9%) | 90 (2.8%) |
| $55,000 to $64,999 | 214 (4.8%) | 207 (6.4%) |
| $65,000 to $74,999 | 395 (8.8%) | 90 (2.8%) |
| $75,000 to $99,999 | 598 (13.3%) | 312 (9.6%) |
| $100,000+ | 1,695 (37.6%) | 274 (8.5%) |
| Total | 4,504 (100.0%) | 3,238 (100.0%) |
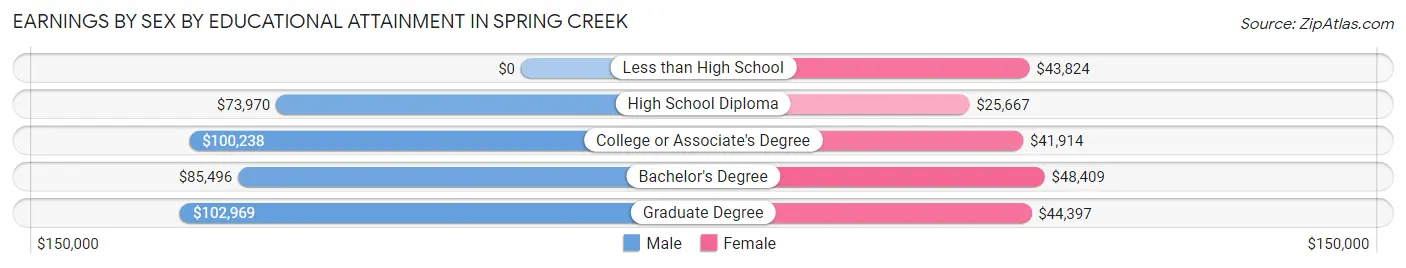
Earnings by Sex by Educational Attainment in Spring Creek
Average earnings in Spring Creek are $85,712 for men and $41,169 for women, a difference of 52.0%. Men with an educational attainment of graduate degree enjoy the highest average annual earnings of $102,969, while those with high school diploma education earn the least with $73,970. Women with an educational attainment of bachelor's degree earn the most with the average annual earnings of $48,409, while those with high school diploma education have the smallest earnings of $25,667.
| Educational Attainment | Male Income | Female Income |
| Less than High School | - | - |
| High School Diploma | $73,970 | $25,667 |
| College or Associate's Degree | $100,238 | $41,914 |
| Bachelor's Degree | $85,496 | $48,409 |
| Graduate Degree | $102,969 | $44,397 |
| Total | $85,712 | $41,169 |
Family Income in Spring Creek
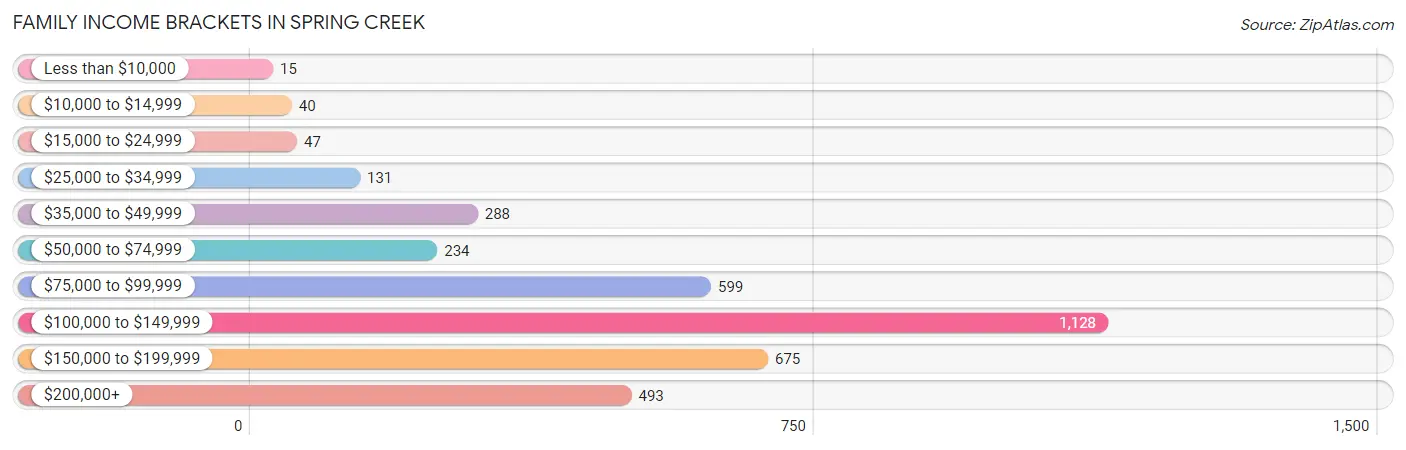
Family Income Brackets in Spring Creek
According to the Spring Creek family income data, there are 1,128 families falling into the $100,000 to $149,999 income range, which is the most common income bracket and makes up 30.9% of all families. Conversely, the less than $10,000 income bracket is the least frequent group with only 15 families (0.4%) belonging to this category.
| Income Bracket | # Families | % Families |
| Less than $10,000 | 15 | 0.4% |
| $10,000 to $14,999 | 40 | 1.1% |
| $15,000 to $24,999 | 47 | 1.3% |
| $25,000 to $34,999 | 131 | 3.6% |
| $35,000 to $49,999 | 288 | 7.9% |
| $50,000 to $74,999 | 234 | 6.4% |
| $75,000 to $99,999 | 599 | 16.4% |
| $100,000 to $149,999 | 1,128 | 30.9% |
| $150,000 to $199,999 | 675 | 18.5% |
| $200,000+ | 493 | 13.5% |
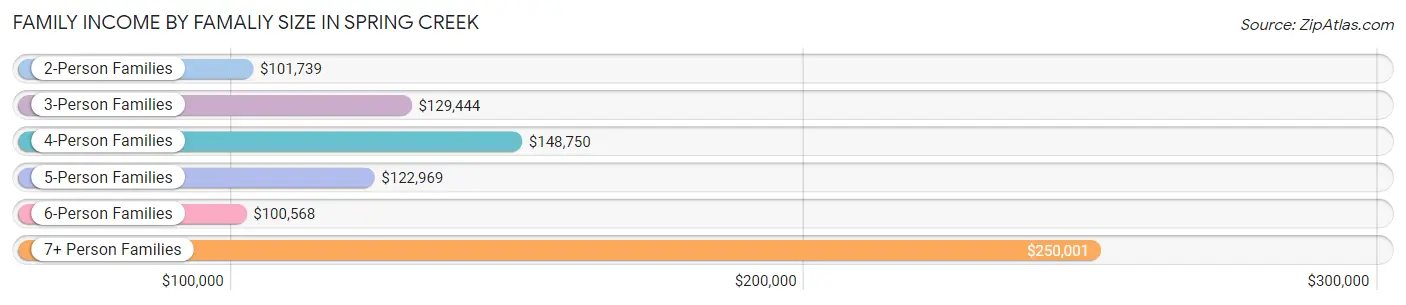
Family Income by Famaliy Size in Spring Creek
7+ person families (61 | 1.7%) account for the highest median family income in Spring Creek with $250,001 per family, while 2-person families (1,468 | 40.2%) have the highest median income of $50,870 per family member.
| Income Bracket | # Families | Median Income |
| 2-Person Families | 1,468 (40.2%) | $101,739 |
| 3-Person Families | 824 (22.6%) | $129,444 |
| 4-Person Families | 711 (19.5%) | $148,750 |
| 5-Person Families | 341 (9.3%) | $122,969 |
| 6-Person Families | 245 (6.7%) | $100,568 |
| 7+ Person Families | 61 (1.7%) | $250,001 |
| Total | 3,650 (100.0%) | $118,899 |
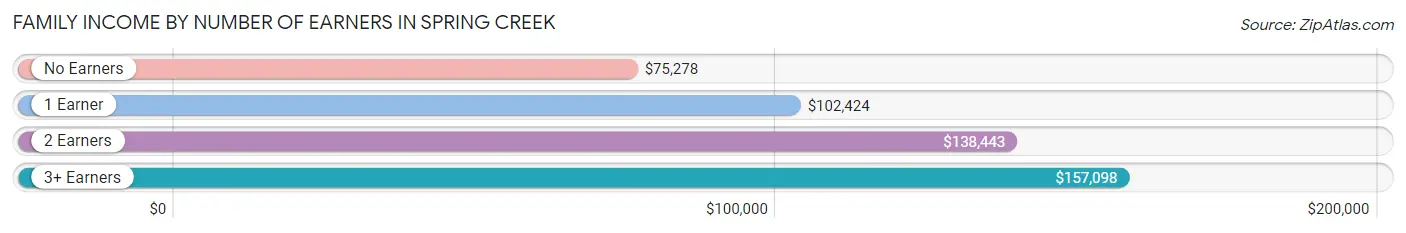
Family Income by Number of Earners in Spring Creek
The median family income in Spring Creek is $118,899, with families comprising 3+ earners (381) having the highest median family income of $157,098, while families with no earners (368) have the lowest median family income of $75,278, accounting for 10.4% and 10.1% of families, respectively.
| Number of Earners | # Families | Median Income |
| No Earners | 368 (10.1%) | $75,278 |
| 1 Earner | 1,470 (40.3%) | $102,424 |
| 2 Earners | 1,431 (39.2%) | $138,443 |
| 3+ Earners | 381 (10.4%) | $157,098 |
| Total | 3,650 (100.0%) | $118,899 |
Household Income in Spring Creek
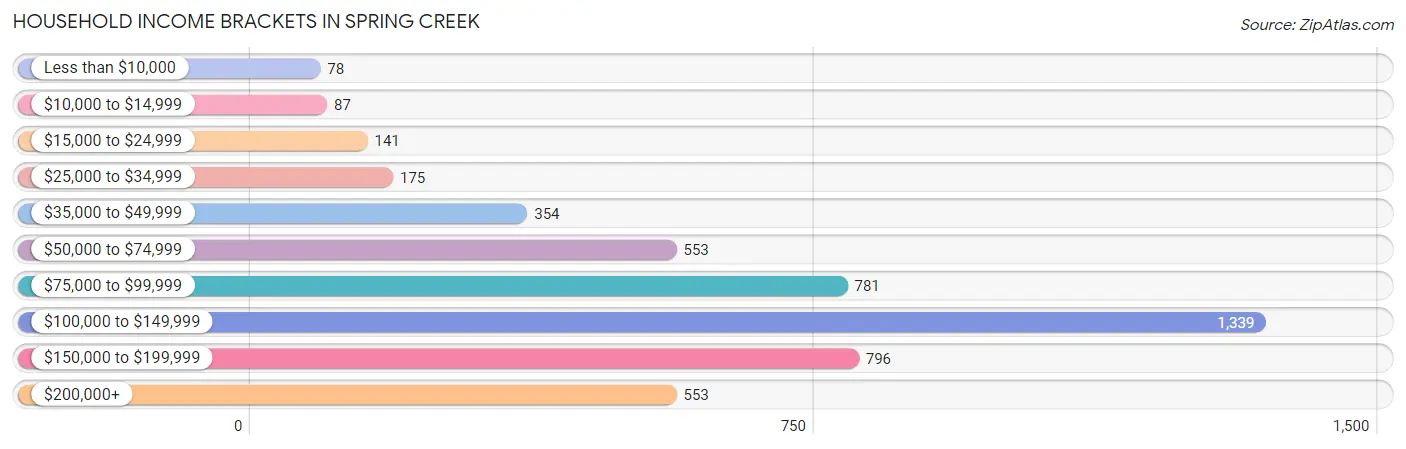
Household Income Brackets in Spring Creek
With 1,339 households falling in the category, the $100,000 to $149,999 income range is the most frequent in Spring Creek, accounting for 27.6% of all households. In contrast, only 78 households (1.6%) fall into the less than $10,000 income bracket, making it the least populous group.
| Income Bracket | # Households | % Households |
| Less than $10,000 | 78 | 1.6% |
| $10,000 to $14,999 | 87 | 1.8% |
| $15,000 to $24,999 | 141 | 2.9% |
| $25,000 to $34,999 | 175 | 3.6% |
| $35,000 to $49,999 | 354 | 7.3% |
| $50,000 to $74,999 | 553 | 11.4% |
| $75,000 to $99,999 | 781 | 16.1% |
| $100,000 to $149,999 | 1,339 | 27.6% |
| $150,000 to $199,999 | 796 | 16.4% |
| $200,000+ | 553 | 11.4% |
Household Income by Householder Age in Spring Creek
The median household income in Spring Creek is $109,952, with the highest median household income of $130,108 found in the 45 to 64 years age bracket for the primary householder. A total of 1,728 households (35.6%) fall into this category. Meanwhile, the 65+ years age bracket for the primary householder has the lowest median household income of $68,256, with 948 households (19.5%) in this group.
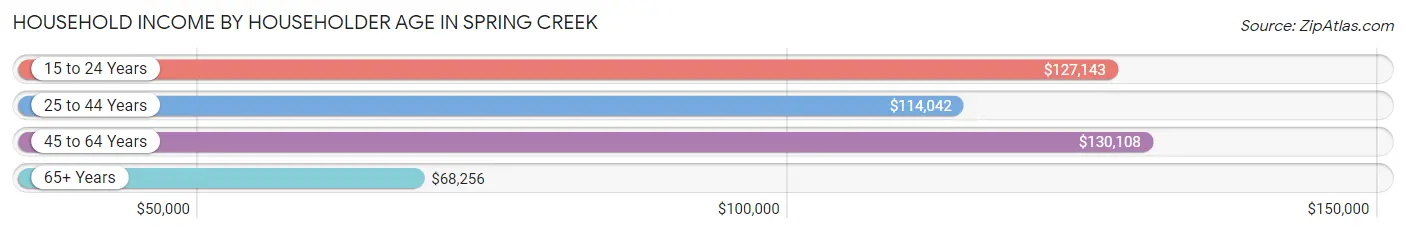
| Income Bracket | # Households | Median Income |
| 15 to 24 Years | 146 (3.0%) | $127,143 |
| 25 to 44 Years | 2,029 (41.8%) | $114,042 |
| 45 to 64 Years | 1,728 (35.6%) | $130,108 |
| 65+ Years | 948 (19.5%) | $68,256 |
| Total | 4,851 (100.0%) | $109,952 |
Poverty in Spring Creek
Income Below Poverty by Sex and Age in Spring Creek
With 7.2% poverty level for males and 10.6% for females among the residents of Spring Creek, 75 year old and over males and 16 and 17 year old females are the most vulnerable to poverty, with 86 males (29.0%) and 72 females (22.2%) in their respective age groups living below the poverty level.
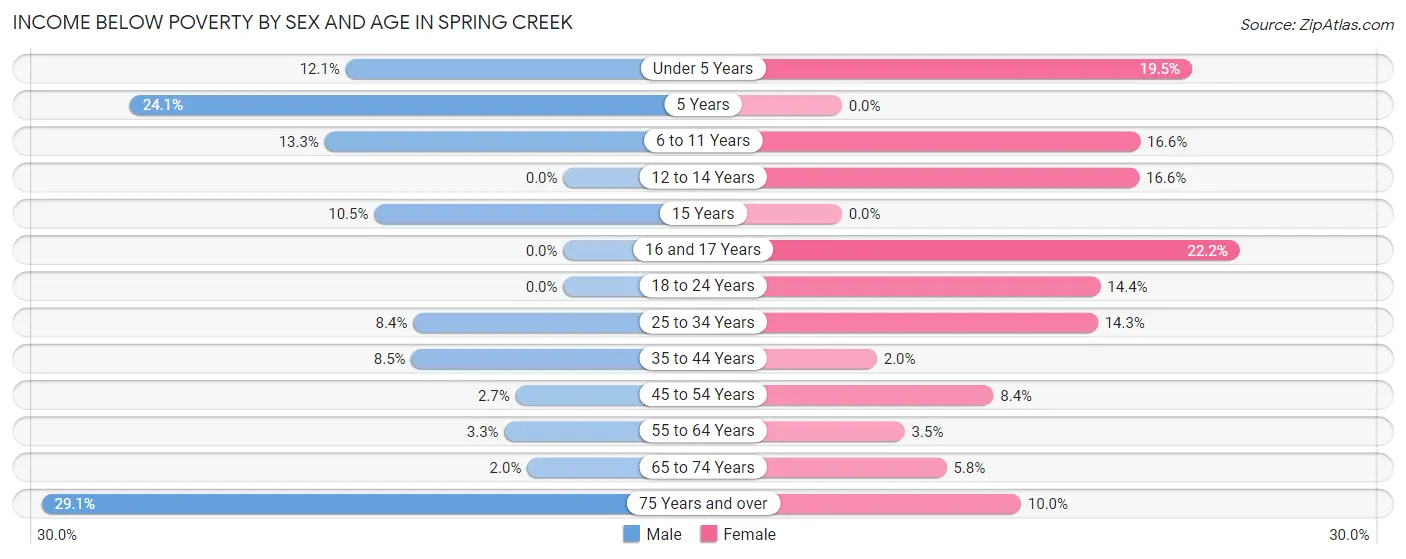
| Age Bracket | Male | Female |
| Under 5 Years | 71 (12.1%) | 100 (19.5%) |
| 5 Years | 49 (24.1%) | 0 (0.0%) |
| 6 to 11 Years | 90 (13.3%) | 106 (16.6%) |
| 12 to 14 Years | 0 (0.0%) | 47 (16.6%) |
| 15 Years | 28 (10.5%) | 0 (0.0%) |
| 16 and 17 Years | 0 (0.0%) | 72 (22.2%) |
| 18 to 24 Years | 0 (0.0%) | 94 (14.4%) |
| 25 to 34 Years | 93 (8.4%) | 155 (14.2%) |
| 35 to 44 Years | 81 (8.5%) | 18 (1.9%) |
| 45 to 54 Years | 21 (2.7%) | 76 (8.4%) |
| 55 to 64 Years | 38 (3.3%) | 30 (3.5%) |
| 65 to 74 Years | 15 (2.0%) | 27 (5.8%) |
| 75 Years and over | 86 (29.0%) | 30 (10.0%) |
| Total | 572 (7.2%) | 755 (10.6%) |
Income Above Poverty by Sex and Age in Spring Creek
According to the poverty statistics in Spring Creek, males aged 12 to 14 years and females aged 5 years are the age groups that are most secure financially, with 100.0% of males and 100.0% of females in these age groups living above the poverty line.
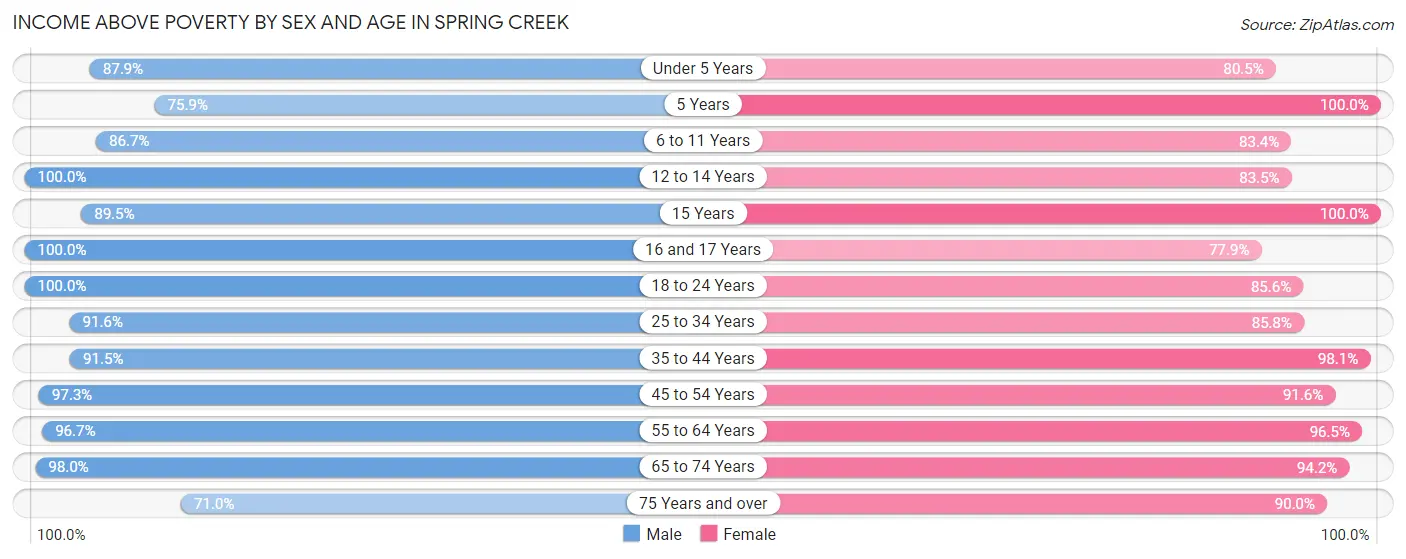
| Age Bracket | Male | Female |
| Under 5 Years | 515 (87.9%) | 413 (80.5%) |
| 5 Years | 154 (75.9%) | 110 (100.0%) |
| 6 to 11 Years | 587 (86.7%) | 532 (83.4%) |
| 12 to 14 Years | 370 (100.0%) | 237 (83.5%) |
| 15 Years | 238 (89.5%) | 79 (100.0%) |
| 16 and 17 Years | 319 (100.0%) | 253 (77.8%) |
| 18 to 24 Years | 408 (100.0%) | 559 (85.6%) |
| 25 to 34 Years | 1,019 (91.6%) | 933 (85.8%) |
| 35 to 44 Years | 877 (91.5%) | 903 (98.1%) |
| 45 to 54 Years | 769 (97.3%) | 825 (91.6%) |
| 55 to 64 Years | 1,120 (96.7%) | 828 (96.5%) |
| 65 to 74 Years | 732 (98.0%) | 436 (94.2%) |
| 75 Years and over | 210 (71.0%) | 271 (90.0%) |
| Total | 7,318 (92.7%) | 6,379 (89.4%) |
Income Below Poverty Among Married-Couple Families in Spring Creek
The poverty statistics for married-couple families in Spring Creek show that 4.2% or 127 of the total 3,036 families live below the poverty line. Families with 3 or 4 children have the highest poverty rate of 10.9%, comprising of 51 families. On the other hand, families with 5 or more children have the lowest poverty rate of 0.0%, which includes 0 families.
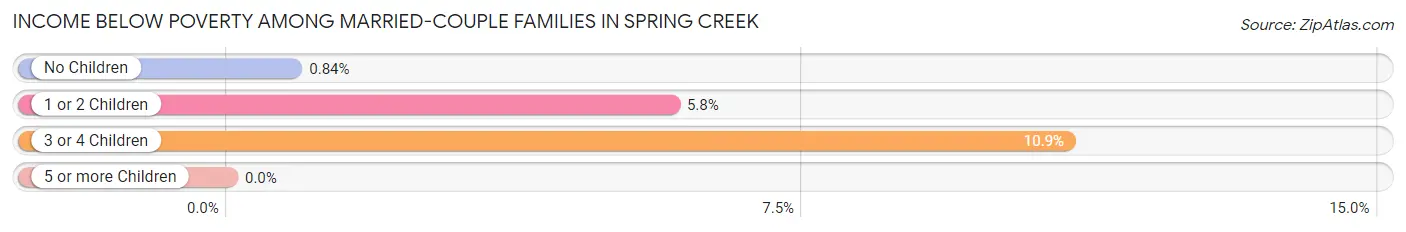
| Children | Above Poverty | Below Poverty |
| No Children | 1,421 (99.2%) | 12 (0.8%) |
| 1 or 2 Children | 1,046 (94.2%) | 64 (5.8%) |
| 3 or 4 Children | 415 (89.1%) | 51 (10.9%) |
| 5 or more Children | 27 (100.0%) | 0 (0.0%) |
| Total | 2,909 (95.8%) | 127 (4.2%) |
Income Below Poverty Among Single-Parent Households in Spring Creek
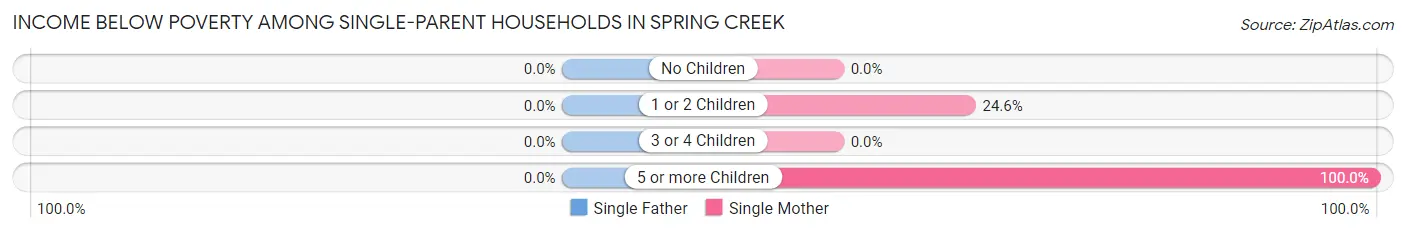
| Children | Single Father | Single Mother |
| No Children | 0 (0.0%) | 0 (0.0%) |
| 1 or 2 Children | 0 (0.0%) | 28 (24.6%) |
| 3 or 4 Children | 0 (0.0%) | 0 (0.0%) |
| 5 or more Children | 0 (0.0%) | 28 (100.0%) |
| Total | 0 (0.0%) | 56 (15.0%) |
Income Below Poverty Among Married-Couple vs Single-Parent Households in Spring Creek
The poverty data for Spring Creek shows that 127 of the married-couple family households (4.2%) and 56 of the single-parent households (9.1%) are living below the poverty level. Within the married-couple family households, those with 3 or 4 children have the highest poverty rate, with 51 households (10.9%) falling below the poverty line. Among the single-parent households, those with 5 or more children have the highest poverty rate, with 28 household (100.0%) living below poverty.
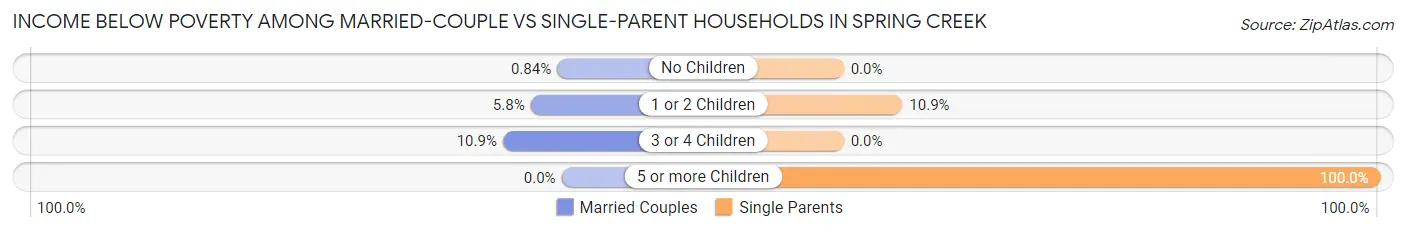
| Children | Married-Couple Families | Single-Parent Households |
| No Children | 12 (0.8%) | 0 (0.0%) |
| 1 or 2 Children | 64 (5.8%) | 28 (10.9%) |
| 3 or 4 Children | 51 (10.9%) | 0 (0.0%) |
| 5 or more Children | 0 (0.0%) | 28 (100.0%) |
| Total | 127 (4.2%) | 56 (9.1%) |
Race in Spring Creek
The most populous races in Spring Creek are White / Caucasian (13,303 | 88.3%), Hispanic or Latino (1,570 | 10.4%), and Some other Race (801 | 5.3%).
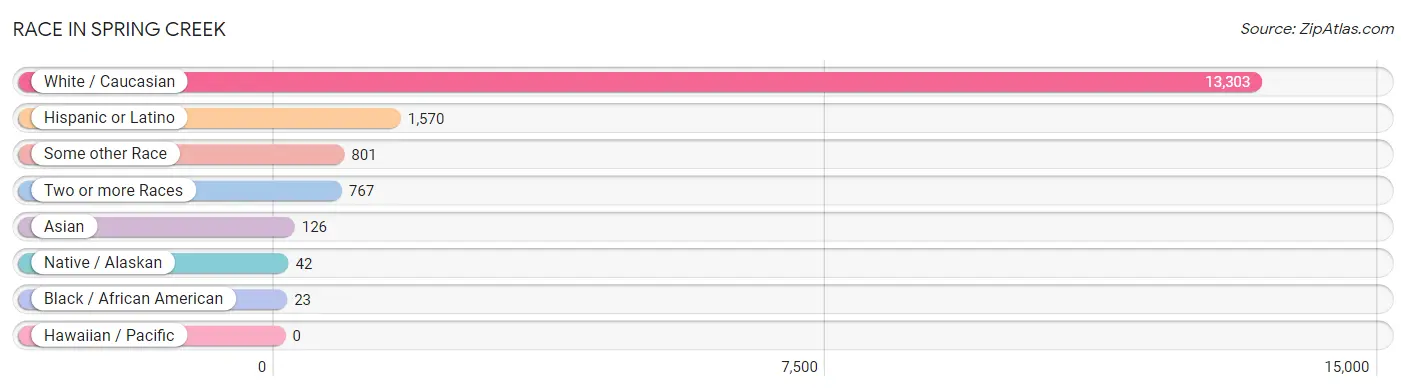
| Race | # Population | % Population |
| Asian | 126 | 0.8% |
| Black / African American | 23 | 0.2% |
| Hawaiian / Pacific | 0 | 0.0% |
| Hispanic or Latino | 1,570 | 10.4% |
| Native / Alaskan | 42 | 0.3% |
| White / Caucasian | 13,303 | 88.3% |
| Two or more Races | 767 | 5.1% |
| Some other Race | 801 | 5.3% |
| Total | 15,062 | 100.0% |
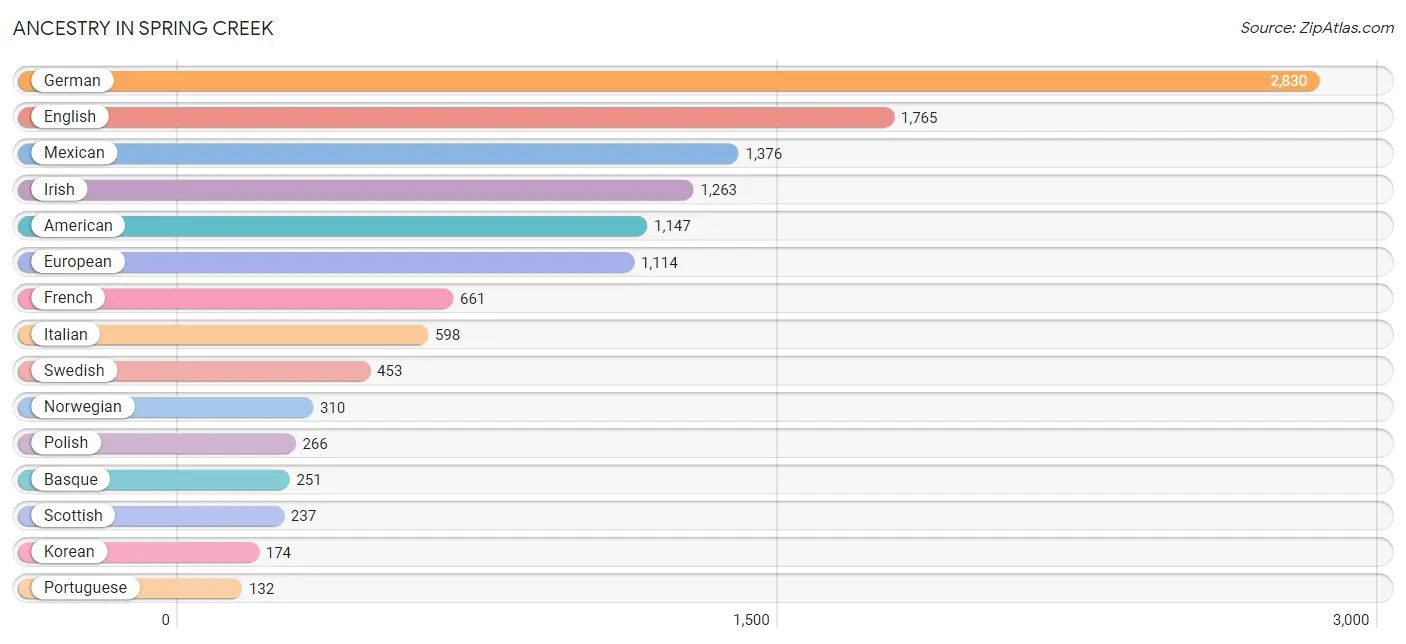
Ancestry in Spring Creek
The most populous ancestries reported in Spring Creek are German (2,830 | 18.8%), English (1,765 | 11.7%), Mexican (1,376 | 9.1%), Irish (1,263 | 8.4%), and American (1,147 | 7.6%), together accounting for 55.7% of all Spring Creek residents.
| Ancestry | # Population | % Population |
| American | 1,147 | 7.6% |
| Arab | 21 | 0.1% |
| Armenian | 32 | 0.2% |
| Austrian | 52 | 0.4% |
| Basque | 251 | 1.7% |
| Blackfeet | 17 | 0.1% |
| British | 28 | 0.2% |
| Canadian | 29 | 0.2% |
| Central American Indian | 53 | 0.4% |
| Cherokee | 14 | 0.1% |
| Croatian | 37 | 0.3% |
| Czech | 33 | 0.2% |
| Danish | 110 | 0.7% |
| Dutch | 66 | 0.4% |
| Eastern European | 14 | 0.1% |
| Ecuadorian | 18 | 0.1% |
| English | 1,765 | 11.7% |
| European | 1,114 | 7.4% |
| Finnish | 84 | 0.6% |
| French | 661 | 4.4% |
| French Canadian | 71 | 0.5% |
| German | 2,830 | 18.8% |
| Greek | 40 | 0.3% |
| Hungarian | 5 | 0.0% |
| Indian (Asian) | 42 | 0.3% |
| Iranian | 32 | 0.2% |
| Irish | 1,263 | 8.4% |
| Italian | 598 | 4.0% |
| Korean | 174 | 1.2% |
| Lithuanian | 101 | 0.7% |
| Mexican | 1,376 | 9.1% |
| New Zealander | 28 | 0.2% |
| Norwegian | 310 | 2.1% |
| Polish | 266 | 1.8% |
| Portuguese | 132 | 0.9% |
| Potawatomi | 11 | 0.1% |
| Puerto Rican | 12 | 0.1% |
| Russian | 106 | 0.7% |
| Scandinavian | 58 | 0.4% |
| Scotch-Irish | 55 | 0.4% |
| Scottish | 237 | 1.6% |
| Shoshone | 58 | 0.4% |
| Slovene | 24 | 0.2% |
| South African | 8 | 0.1% |
| South American | 18 | 0.1% |
| South American Indian | 53 | 0.4% |
| Spaniard | 9 | 0.1% |
| Spanish | 129 | 0.9% |
| Subsaharan African | 8 | 0.1% |
| Swedish | 453 | 3.0% |
| Swiss | 22 | 0.2% |
| Turkish | 13 | 0.1% |
| Welsh | 62 | 0.4% |
| Yugoslavian | 77 | 0.5% | View All 54 Rows |
Immigrants in Spring Creek
The most numerous immigrant groups reported in Spring Creek came from Latin America (223 | 1.5%), Central America (205 | 1.4%), Mexico (205 | 1.4%), Europe (81 | 0.5%), and Asia (73 | 0.5%), together accounting for 5.2% of all Spring Creek residents.
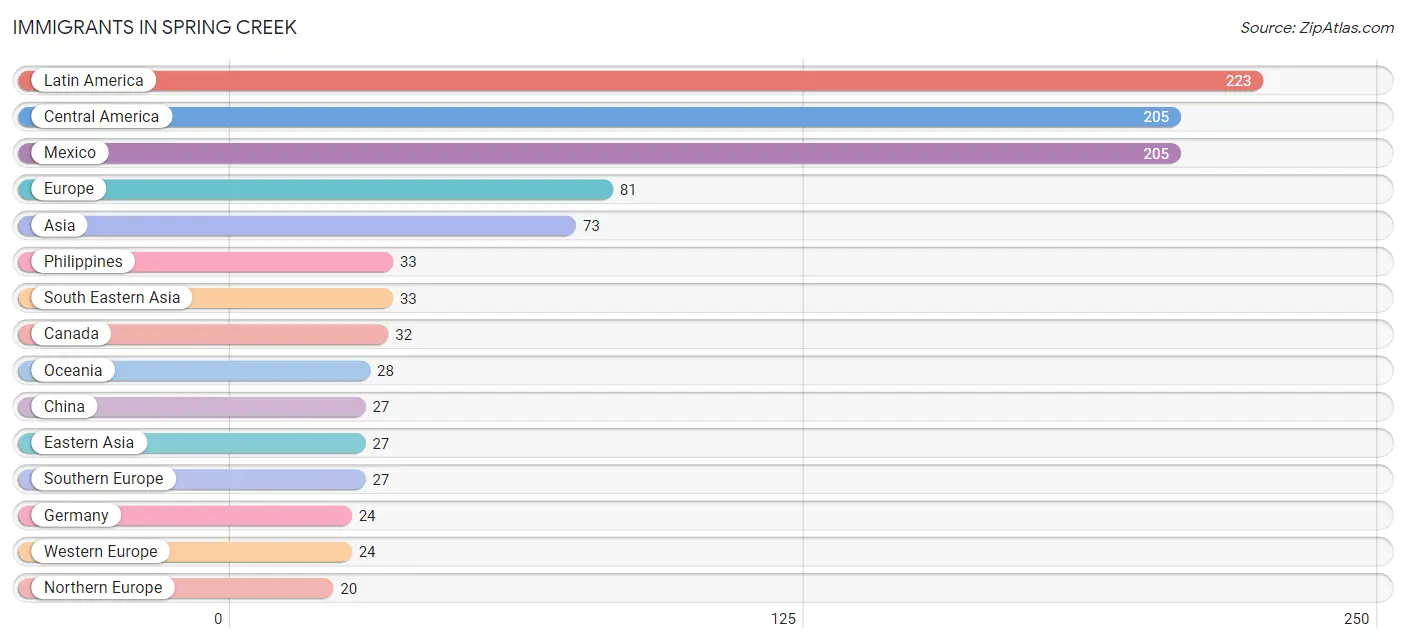
| Immigration Origin | # Population | % Population |
| Africa | 8 | 0.1% |
| Asia | 73 | 0.5% |
| Canada | 32 | 0.2% |
| Central America | 205 | 1.4% |
| China | 27 | 0.2% |
| Croatia | 10 | 0.1% |
| Eastern Asia | 27 | 0.2% |
| Eastern Europe | 10 | 0.1% |
| Ecuador | 18 | 0.1% |
| Europe | 81 | 0.5% |
| Germany | 24 | 0.2% |
| Ireland | 8 | 0.1% |
| Latin America | 223 | 1.5% |
| Mexico | 205 | 1.4% |
| Northern Europe | 20 | 0.1% |
| Norway | 12 | 0.1% |
| Oceania | 28 | 0.2% |
| Philippines | 33 | 0.2% |
| Portugal | 12 | 0.1% |
| South Africa | 8 | 0.1% |
| South America | 18 | 0.1% |
| South Eastern Asia | 33 | 0.2% |
| Southern Europe | 27 | 0.2% |
| Spain | 15 | 0.1% |
| Turkey | 13 | 0.1% |
| Western Asia | 13 | 0.1% |
| Western Europe | 24 | 0.2% | View All 27 Rows |
Sex and Age in Spring Creek
Sex and Age in Spring Creek
The most populous age groups in Spring Creek are 55 to 59 Years (761 | 9.7%) for men and 30 to 34 Years (657 | 9.2%) for women.
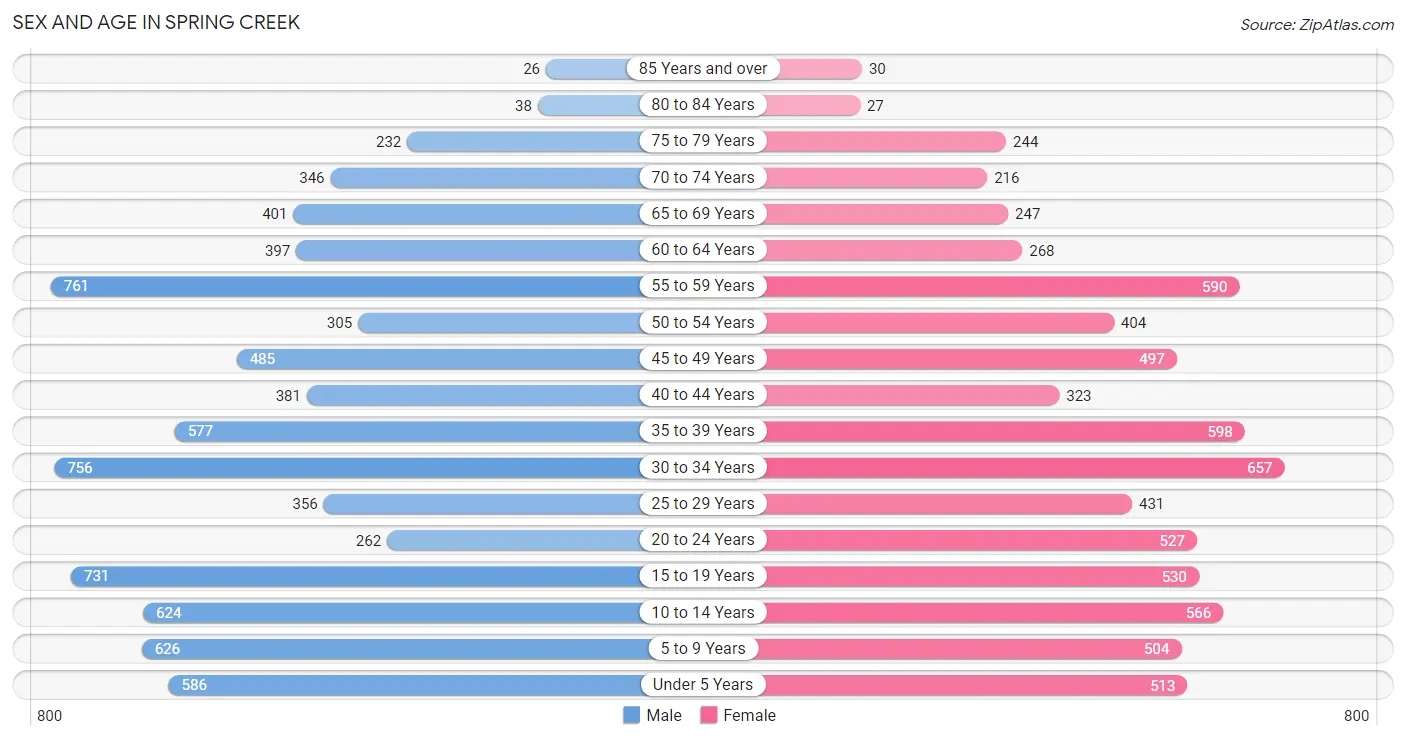
| Age Bracket | Male | Female |
| Under 5 Years | 586 (7.4%) | 513 (7.1%) |
| 5 to 9 Years | 626 (7.9%) | 504 (7.0%) |
| 10 to 14 Years | 624 (7.9%) | 566 (7.9%) |
| 15 to 19 Years | 731 (9.3%) | 530 (7.4%) |
| 20 to 24 Years | 262 (3.3%) | 527 (7.3%) |
| 25 to 29 Years | 356 (4.5%) | 431 (6.0%) |
| 30 to 34 Years | 756 (9.6%) | 657 (9.2%) |
| 35 to 39 Years | 577 (7.3%) | 598 (8.3%) |
| 40 to 44 Years | 381 (4.8%) | 323 (4.5%) |
| 45 to 49 Years | 485 (6.1%) | 497 (6.9%) |
| 50 to 54 Years | 305 (3.9%) | 404 (5.6%) |
| 55 to 59 Years | 761 (9.7%) | 590 (8.2%) |
| 60 to 64 Years | 397 (5.0%) | 268 (3.7%) |
| 65 to 69 Years | 401 (5.1%) | 247 (3.4%) |
| 70 to 74 Years | 346 (4.4%) | 216 (3.0%) |
| 75 to 79 Years | 232 (2.9%) | 244 (3.4%) |
| 80 to 84 Years | 38 (0.5%) | 27 (0.4%) |
| 85 Years and over | 26 (0.3%) | 30 (0.4%) |
| Total | 7,890 (100.0%) | 7,172 (100.0%) |
Families and Households in Spring Creek
Median Family Size in Spring Creek
The median family size in Spring Creek is 3.57 persons per family, with single female/mother families (372 | 10.2%) accounting for the largest median family size of 4.01 persons per family. On the other hand, single male/father families (242 | 6.6%) represent the smallest median family size with 3.45 persons per family.
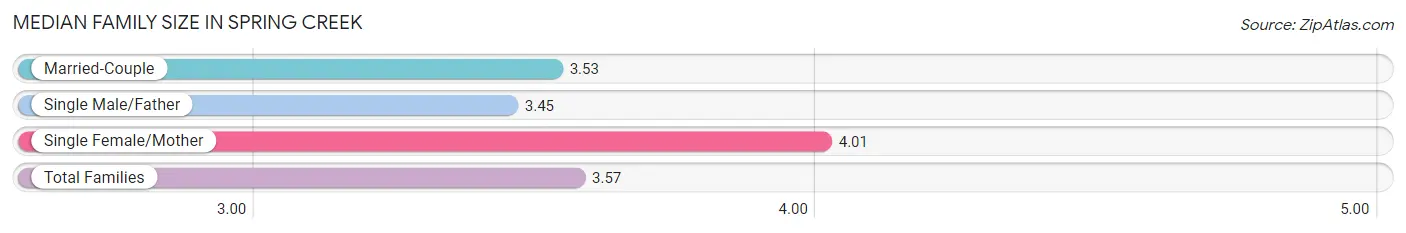
| Family Type | # Families | Family Size |
| Married-Couple | 3,036 (83.2%) | 3.53 |
| Single Male/Father | 242 (6.6%) | 3.45 |
| Single Female/Mother | 372 (10.2%) | 4.01 |
| Total Families | 3,650 (100.0%) | 3.57 |
Median Household Size in Spring Creek
The median household size in Spring Creek is 3.10 persons per household, with single female/mother households (372 | 7.7%) accounting for the largest median household size of 4.66 persons per household. non-family households (1,201 | 24.8%) represent the smallest median household size with 1.32 persons per household.
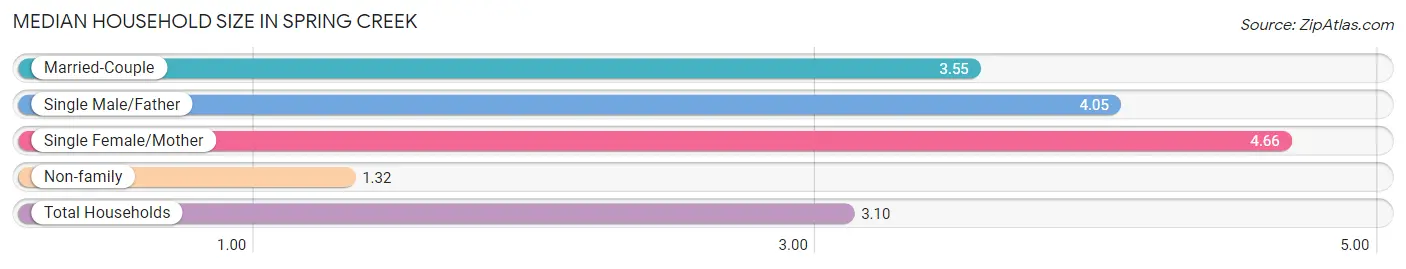
| Household Type | # Households | Household Size |
| Married-Couple | 3,036 (62.6%) | 3.55 |
| Single Male/Father | 242 (5.0%) | 4.05 |
| Single Female/Mother | 372 (7.7%) | 4.66 |
| Non-family | 1,201 (24.8%) | 1.32 |
| Total Households | 4,851 (100.0%) | 3.10 |
Household Size by Marriage Status in Spring Creek
Out of a total of 4,851 households in Spring Creek, 3,650 (75.2%) are family households, while 1,201 (24.8%) are nonfamily households. The most numerous type of family households are 2-person households, comprising 1,320, and the most common type of nonfamily households are 1-person households, comprising 948.
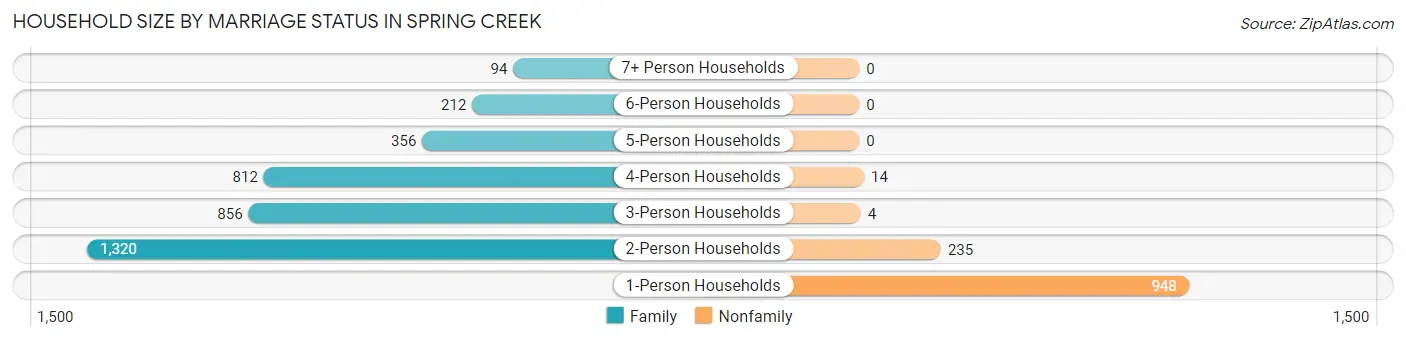
| Household Size | Family Households | Nonfamily Households |
| 1-Person Households | - | 948 (19.5%) |
| 2-Person Households | 1,320 (27.2%) | 235 (4.8%) |
| 3-Person Households | 856 (17.6%) | 4 (0.1%) |
| 4-Person Households | 812 (16.7%) | 14 (0.3%) |
| 5-Person Households | 356 (7.3%) | 0 (0.0%) |
| 6-Person Households | 212 (4.4%) | 0 (0.0%) |
| 7+ Person Households | 94 (1.9%) | 0 (0.0%) |
| Total | 3,650 (75.2%) | 1,201 (24.8%) |
Female Fertility in Spring Creek
Fertility by Age in Spring Creek
Average fertility rate in Spring Creek is 43.0 births per 1,000 women. Women in the age bracket of 20 to 34 years have the highest fertility rate with 83.0 births per 1,000 women. Women in the age bracket of 20 to 34 years acount for 85.4% of all women with births.
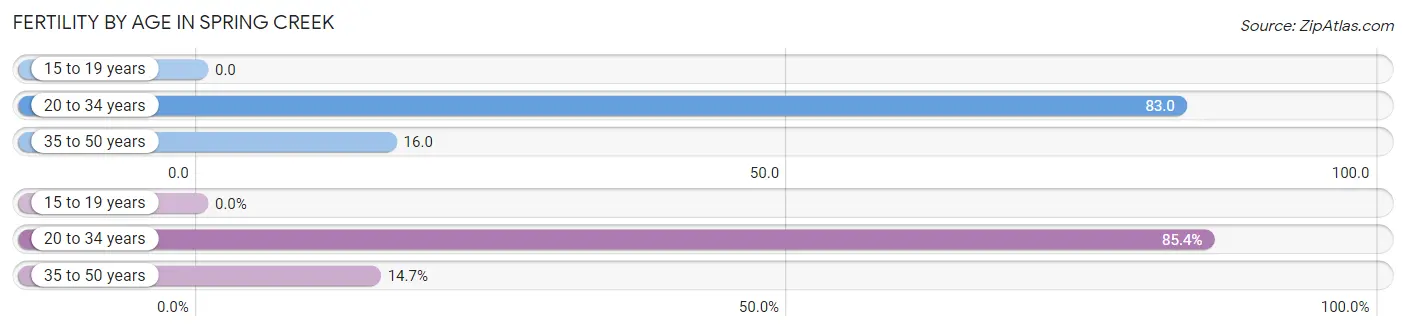
| Age Bracket | Women with Births | Births / 1,000 Women |
| 15 to 19 years | 0 (0.0%) | 0.0 |
| 20 to 34 years | 134 (85.4%) | 83.0 |
| 35 to 50 years | 23 (14.6%) | 16.0 |
| Total | 157 (100.0%) | 43.0 |
Fertility by Age by Marriage Status in Spring Creek
83.4% of women with births (157) in Spring Creek are married. The highest percentage of unmarried women with births falls into 20 to 34 years age bracket with 19.4% of them unmarried at the time of birth, while the lowest percentage of unmarried women with births belong to 35 to 50 years age bracket with 0.0% of them unmarried.
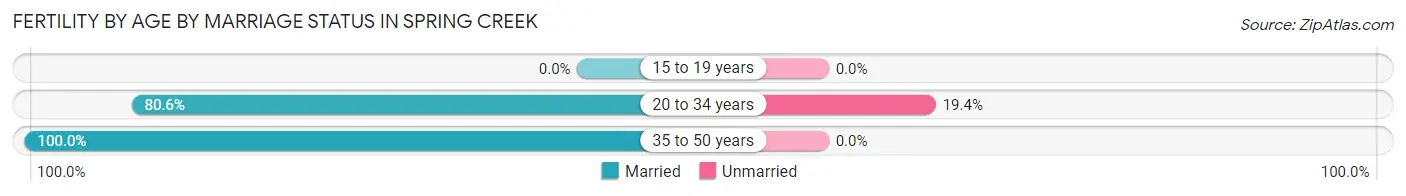
| Age Bracket | Married | Unmarried |
| 15 to 19 years | 0 (0.0%) | 0 (0.0%) |
| 20 to 34 years | 108 (80.6%) | 26 (19.4%) |
| 35 to 50 years | 23 (100.0%) | 0 (0.0%) |
| Total | 131 (83.4%) | 26 (16.6%) |
Fertility by Education in Spring Creek
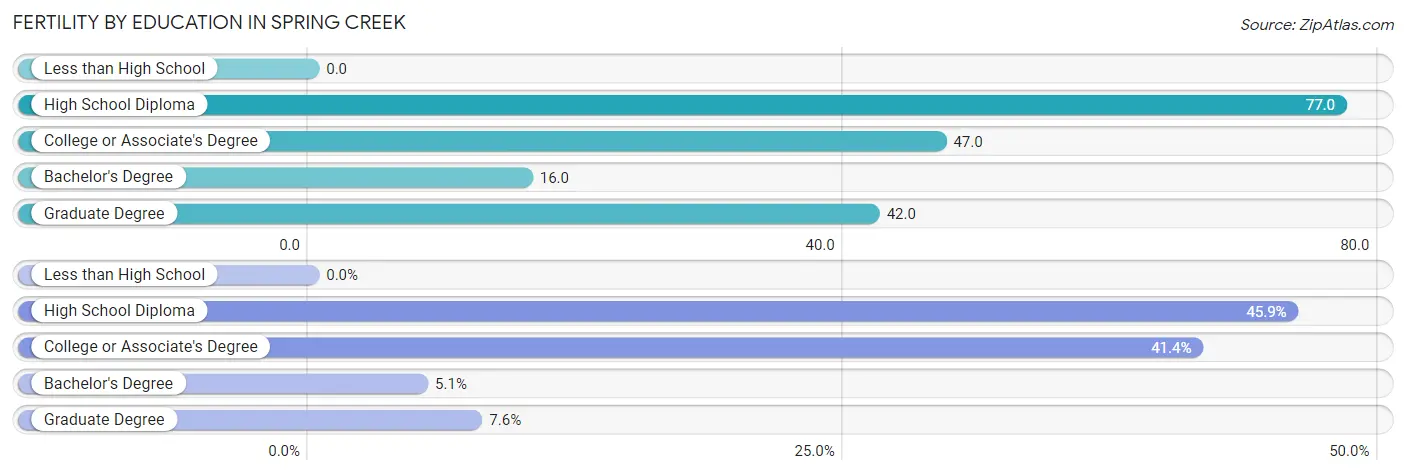
| Educational Attainment | Women with Births | Births / 1,000 Women |
| Less than High School | 0 (0.0%) | 0.0 |
| High School Diploma | 72 (45.9%) | 77.0 |
| College or Associate's Degree | 65 (41.4%) | 47.0 |
| Bachelor's Degree | 8 (5.1%) | 16.0 |
| Graduate Degree | 12 (7.6%) | 42.0 |
| Total | 157 (100.0%) | 43.0 |
Fertility by Education by Marriage Status in Spring Creek
16.6% of women with births in Spring Creek are unmarried. Women with the educational attainment of college or associate's degree are most likely to be married with 100.0% of them married at childbirth, while women with the educational attainment of high school diploma are least likely to be married with 36.1% of them unmarried at childbirth.
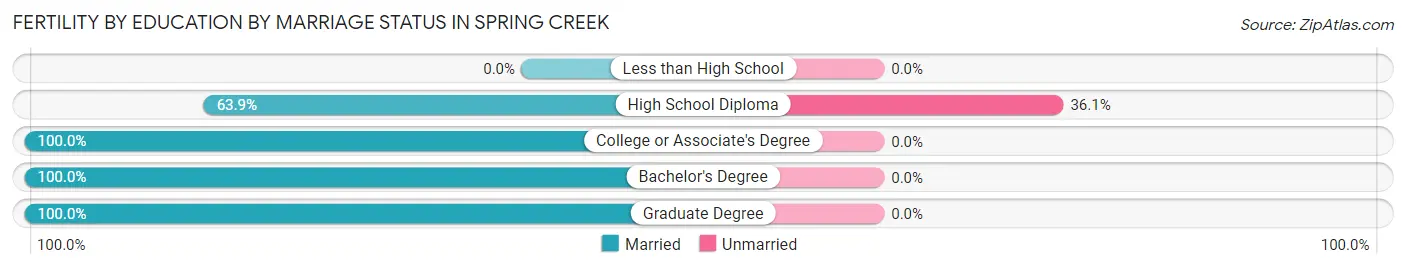
| Educational Attainment | Married | Unmarried |
| Less than High School | 0 (0.0%) | 0 (0.0%) |
| High School Diploma | 46 (63.9%) | 26 (36.1%) |
| College or Associate's Degree | 65 (100.0%) | 0 (0.0%) |
| Bachelor's Degree | 8 (100.0%) | 0 (0.0%) |
| Graduate Degree | 12 (100.0%) | 0 (0.0%) |
| Total | 131 (83.4%) | 26 (16.6%) |
Employment Characteristics in Spring Creek
Employment by Class of Employer in Spring Creek
Among the 7,129 employed individuals in Spring Creek, private company employees (4,984 | 69.9%), local government employees (504 | 7.1%), and not-for-profit organizations (433 | 6.1%) make up the most common classes of employment.
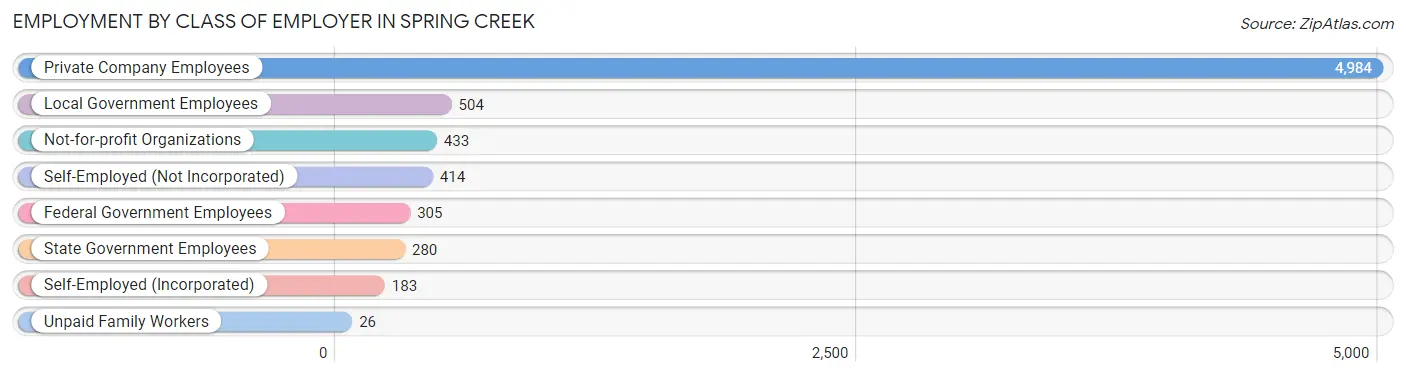
| Employer Class | # Employees | % Employees |
| Private Company Employees | 4,984 | 69.9% |
| Self-Employed (Incorporated) | 183 | 2.6% |
| Self-Employed (Not Incorporated) | 414 | 5.8% |
| Not-for-profit Organizations | 433 | 6.1% |
| Local Government Employees | 504 | 7.1% |
| State Government Employees | 280 | 3.9% |
| Federal Government Employees | 305 | 4.3% |
| Unpaid Family Workers | 26 | 0.4% |
| Total | 7,129 | 100.0% |
Employment Status by Age in Spring Creek
According to the labor force statistics for Spring Creek, out of the total population over 16 years of age (11,298), 66.1% or 7,468 individuals are in the labor force, with 3.7% or 276 of them unemployed. The age group with the highest labor force participation rate is 20 to 24 years, with 85.4% or 674 individuals in the labor force. Within the labor force, the 45 to 54 years age range has the highest percentage of unemployed individuals, with 5.6% or 79 of them being unemployed.
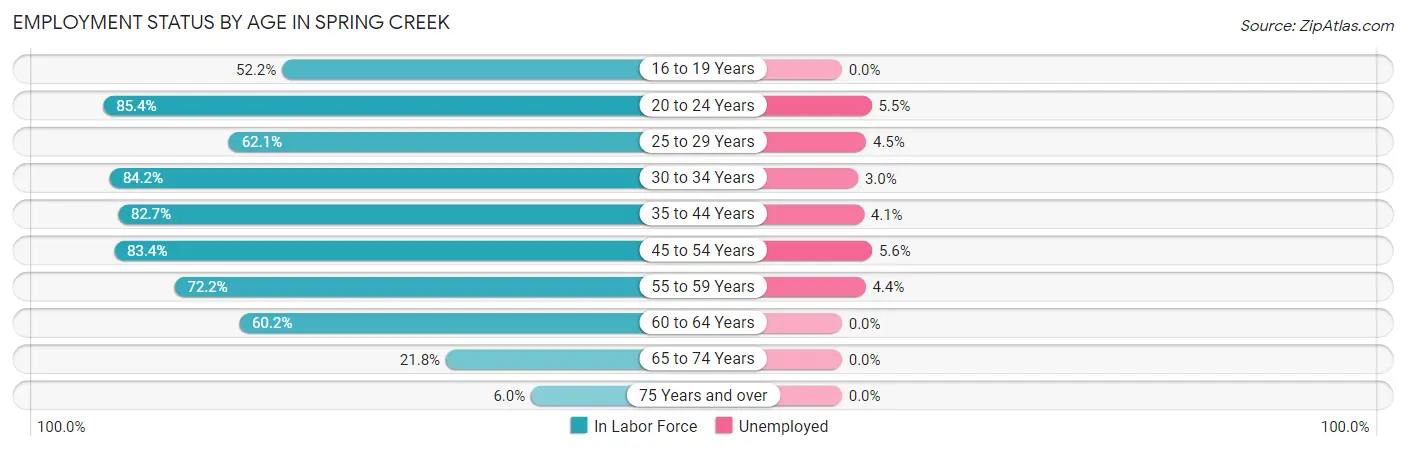
| Age Bracket | In Labor Force | Unemployed |
| 16 to 19 Years | 478 (52.2%) | 0 (0.0%) |
| 20 to 24 Years | 674 (85.4%) | 37 (5.5%) |
| 25 to 29 Years | 489 (62.1%) | 22 (4.5%) |
| 30 to 34 Years | 1,190 (84.2%) | 36 (3.0%) |
| 35 to 44 Years | 1,554 (82.7%) | 64 (4.1%) |
| 45 to 54 Years | 1,410 (83.4%) | 79 (5.6%) |
| 55 to 59 Years | 975 (72.2%) | 43 (4.4%) |
| 60 to 64 Years | 400 (60.2%) | 0 (0.0%) |
| 65 to 74 Years | 264 (21.8%) | 0 (0.0%) |
| 75 Years and over | 36 (6.0%) | 0 (0.0%) |
| Total | 7,468 (66.1%) | 276 (3.7%) |
Employment Status by Educational Attainment in Spring Creek
According to labor force statistics for Spring Creek, 77.3% of individuals (6,019) out of the total population between 25 and 64 years of age (7,786) are in the labor force, with 4.0% or 241 of them being unemployed. The group with the highest labor force participation rate are those with the educational attainment of bachelor's degree or higher, with 82.8% or 1,360 individuals in the labor force. Within the labor force, individuals with less than high school education have the highest percentage of unemployment, with 38.3% or 115 of them being unemployed.
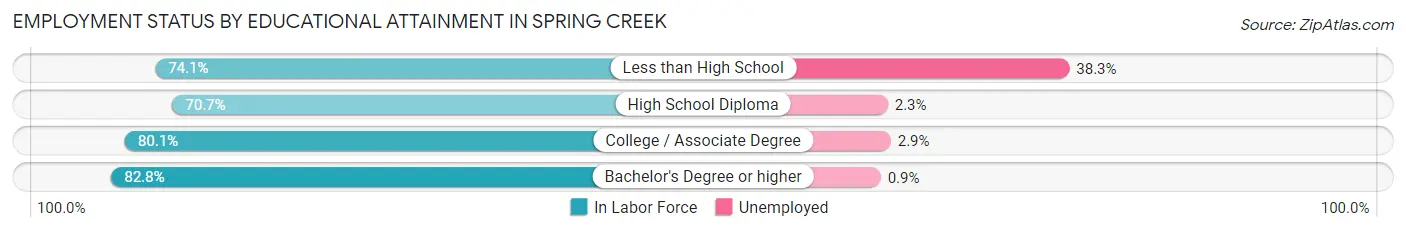
| Educational Attainment | In Labor Force | Unemployed |
| Less than High School | 300 (74.1%) | 155 (38.3%) |
| High School Diploma | 1,784 (70.7%) | 58 (2.3%) |
| College / Associate Degree | 2,575 (80.1%) | 93 (2.9%) |
| Bachelor's Degree or higher | 1,360 (82.8%) | 15 (0.9%) |
| Total | 6,019 (77.3%) | 311 (4.0%) |
Employment Occupations by Sex in Spring Creek
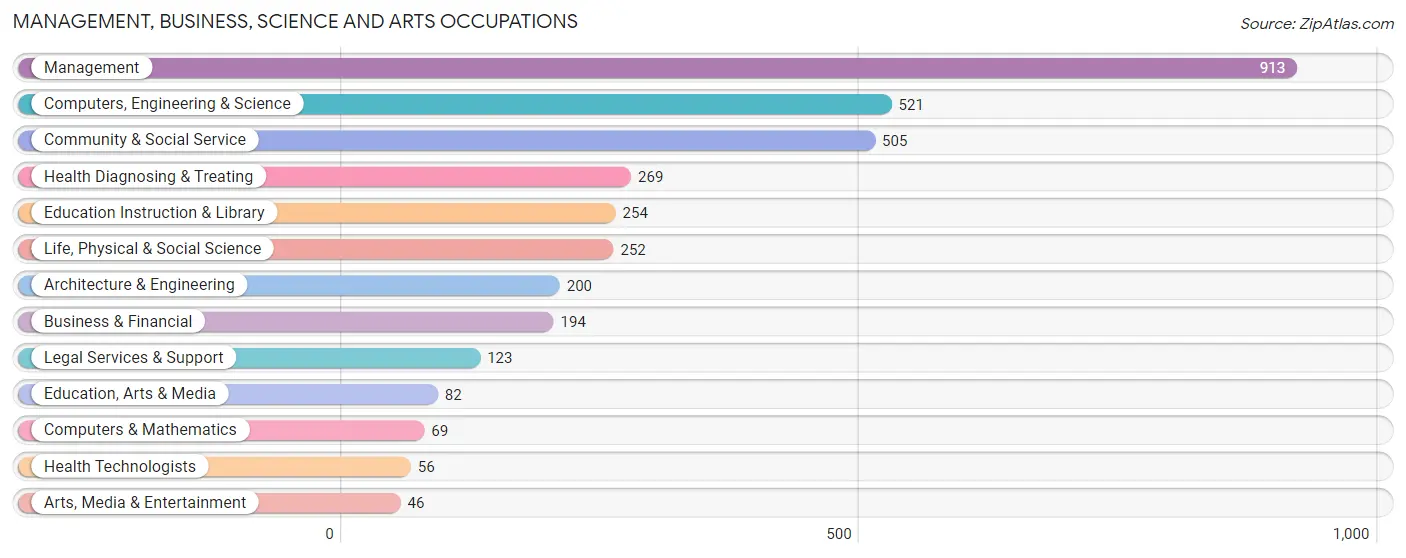
Management, Business, Science and Arts Occupations
The most common Management, Business, Science and Arts occupations in Spring Creek are Management (913 | 12.7%), Computers, Engineering & Science (521 | 7.2%), Community & Social Service (505 | 7.0%), Health Diagnosing & Treating (269 | 3.7%), and Education Instruction & Library (254 | 3.5%).
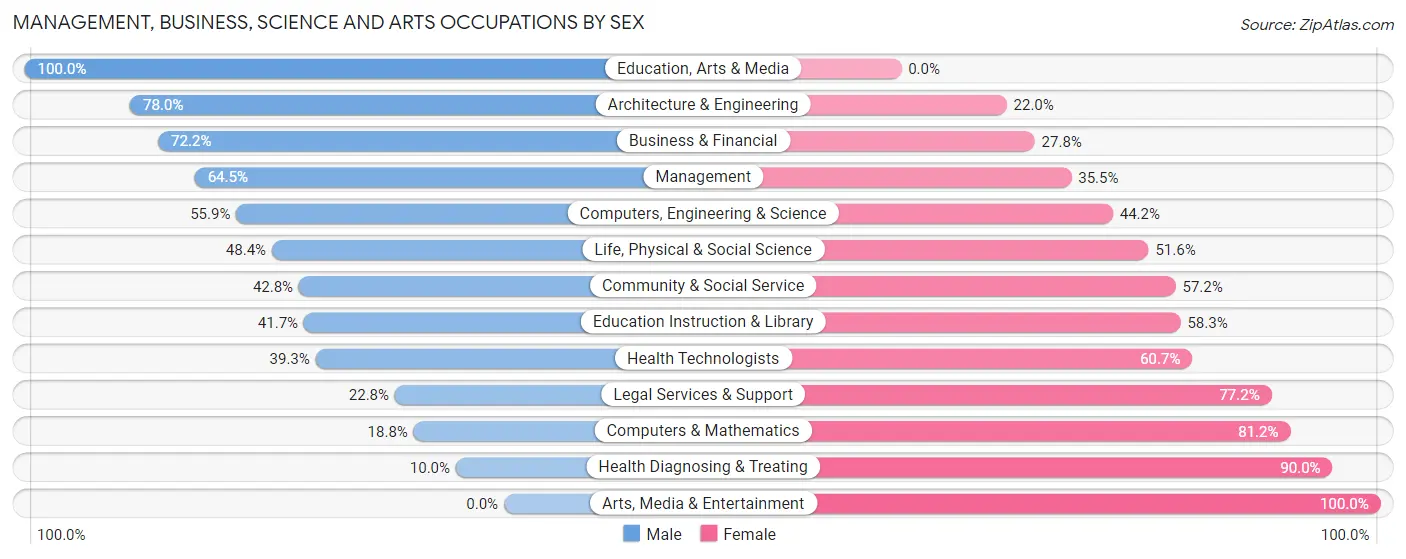
Management, Business, Science and Arts Occupations by Sex
Within the Management, Business, Science and Arts occupations in Spring Creek, the most male-oriented occupations are Education, Arts & Media (100.0%), Architecture & Engineering (78.0%), and Business & Financial (72.2%), while the most female-oriented occupations are Arts, Media & Entertainment (100.0%), Health Diagnosing & Treating (90.0%), and Computers & Mathematics (81.2%).
| Occupation | Male | Female |
| Management | 589 (64.5%) | 324 (35.5%) |
| Business & Financial | 140 (72.2%) | 54 (27.8%) |
| Computers, Engineering & Science | 291 (55.8%) | 230 (44.2%) |
| Computers & Mathematics | 13 (18.8%) | 56 (81.2%) |
| Architecture & Engineering | 156 (78.0%) | 44 (22.0%) |
| Life, Physical & Social Science | 122 (48.4%) | 130 (51.6%) |
| Community & Social Service | 216 (42.8%) | 289 (57.2%) |
| Education, Arts & Media | 82 (100.0%) | 0 (0.0%) |
| Legal Services & Support | 28 (22.8%) | 95 (77.2%) |
| Education Instruction & Library | 106 (41.7%) | 148 (58.3%) |
| Arts, Media & Entertainment | 0 (0.0%) | 46 (100.0%) |
| Health Diagnosing & Treating | 27 (10.0%) | 242 (90.0%) |
| Health Technologists | 22 (39.3%) | 34 (60.7%) |
| Total (Category) | 1,263 (52.6%) | 1,139 (47.4%) |
| Total (Overall) | 4,299 (59.8%) | 2,892 (40.2%) |
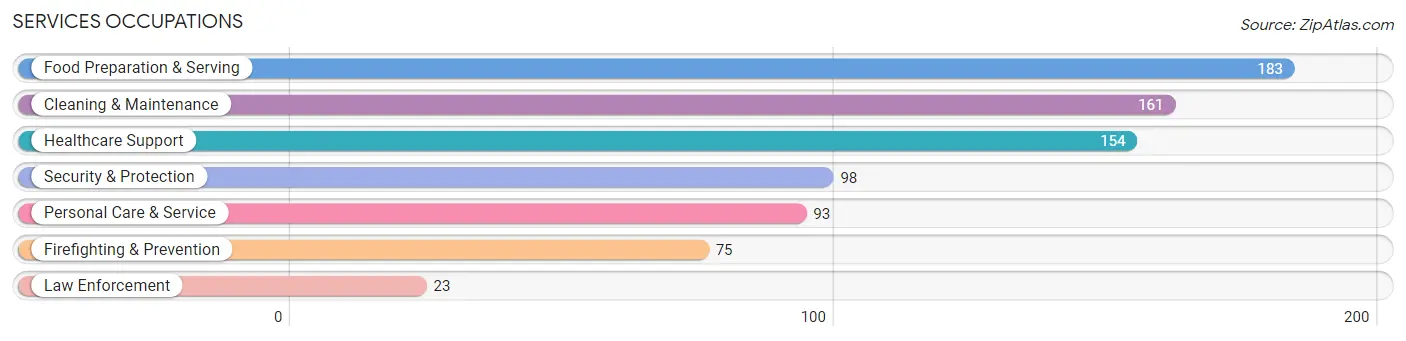
Services Occupations
The most common Services occupations in Spring Creek are Food Preparation & Serving (183 | 2.5%), Cleaning & Maintenance (161 | 2.2%), Healthcare Support (154 | 2.1%), Security & Protection (98 | 1.4%), and Personal Care & Service (93 | 1.3%).
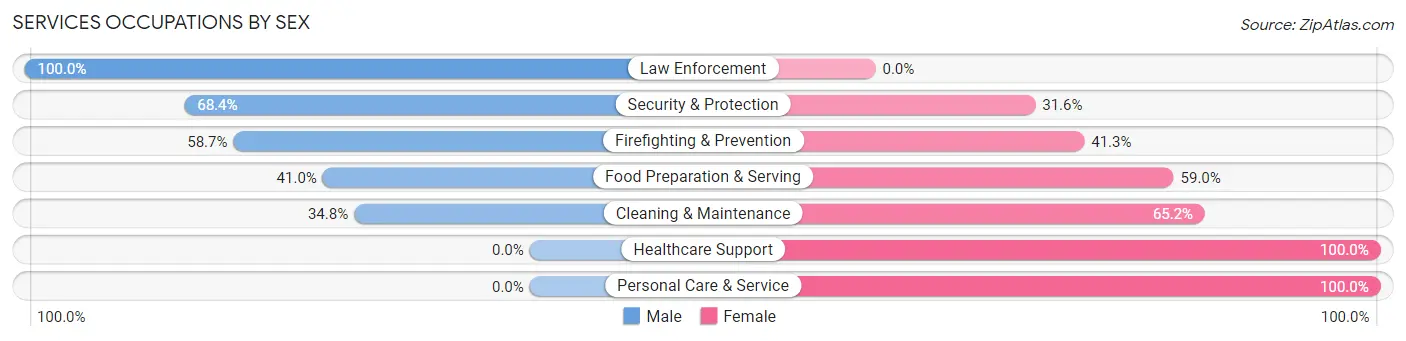
Services Occupations by Sex
Within the Services occupations in Spring Creek, the most male-oriented occupations are Law Enforcement (100.0%), Security & Protection (68.4%), and Firefighting & Prevention (58.7%), while the most female-oriented occupations are Healthcare Support (100.0%), Personal Care & Service (100.0%), and Cleaning & Maintenance (65.2%).
| Occupation | Male | Female |
| Healthcare Support | 0 (0.0%) | 154 (100.0%) |
| Security & Protection | 67 (68.4%) | 31 (31.6%) |
| Firefighting & Prevention | 44 (58.7%) | 31 (41.3%) |
| Law Enforcement | 23 (100.0%) | 0 (0.0%) |
| Food Preparation & Serving | 75 (41.0%) | 108 (59.0%) |
| Cleaning & Maintenance | 56 (34.8%) | 105 (65.2%) |
| Personal Care & Service | 0 (0.0%) | 93 (100.0%) |
| Total (Category) | 198 (28.7%) | 491 (71.3%) |
| Total (Overall) | 4,299 (59.8%) | 2,892 (40.2%) |
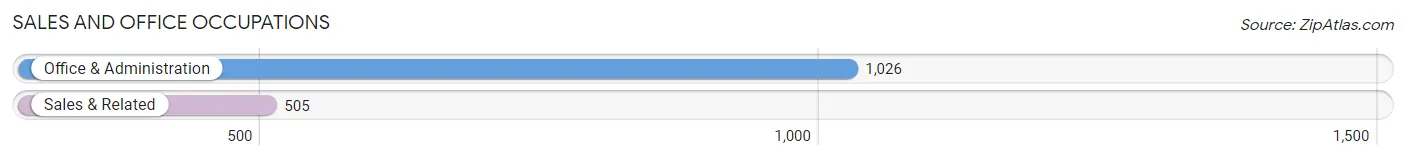
Sales and Office Occupations
The most common Sales and Office occupations in Spring Creek are Office & Administration (1,026 | 14.3%), and Sales & Related (505 | 7.0%).
Sales and Office Occupations by Sex
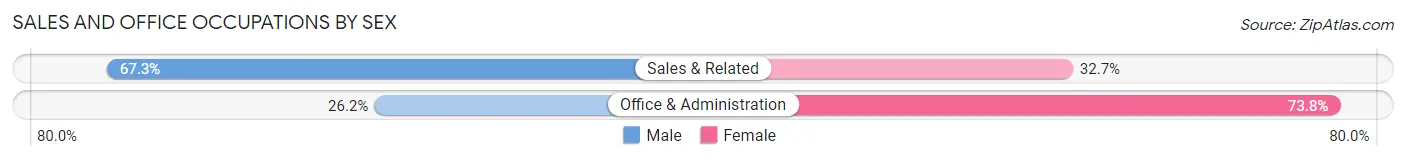
| Occupation | Male | Female |
| Sales & Related | 340 (67.3%) | 165 (32.7%) |
| Office & Administration | 269 (26.2%) | 757 (73.8%) |
| Total (Category) | 609 (39.8%) | 922 (60.2%) |
| Total (Overall) | 4,299 (59.8%) | 2,892 (40.2%) |
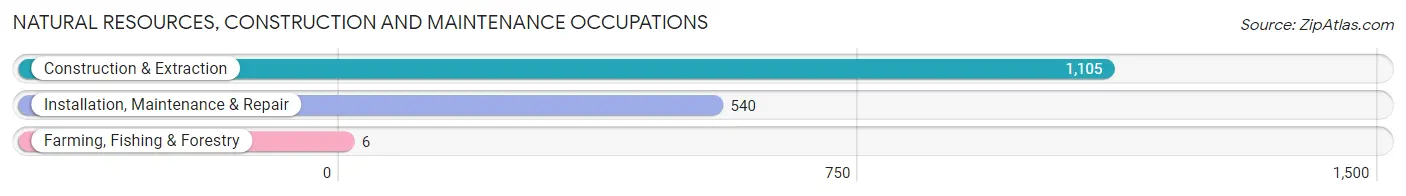
Natural Resources, Construction and Maintenance Occupations
The most common Natural Resources, Construction and Maintenance occupations in Spring Creek are Construction & Extraction (1,105 | 15.4%), Installation, Maintenance & Repair (540 | 7.5%), and Farming, Fishing & Forestry (6 | 0.1%).
Natural Resources, Construction and Maintenance Occupations by Sex
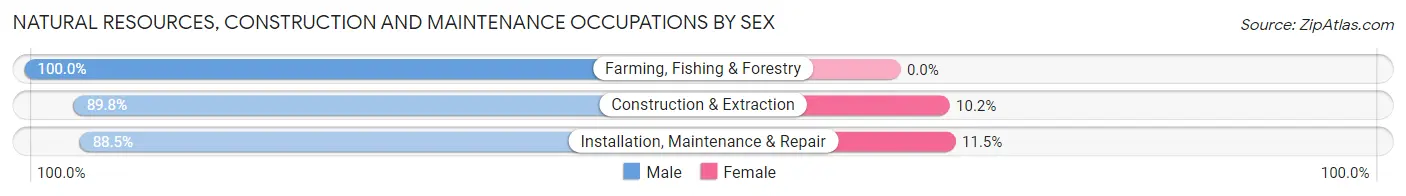
| Occupation | Male | Female |
| Farming, Fishing & Forestry | 6 (100.0%) | 0 (0.0%) |
| Construction & Extraction | 992 (89.8%) | 113 (10.2%) |
| Installation, Maintenance & Repair | 478 (88.5%) | 62 (11.5%) |
| Total (Category) | 1,476 (89.4%) | 175 (10.6%) |
| Total (Overall) | 4,299 (59.8%) | 2,892 (40.2%) |
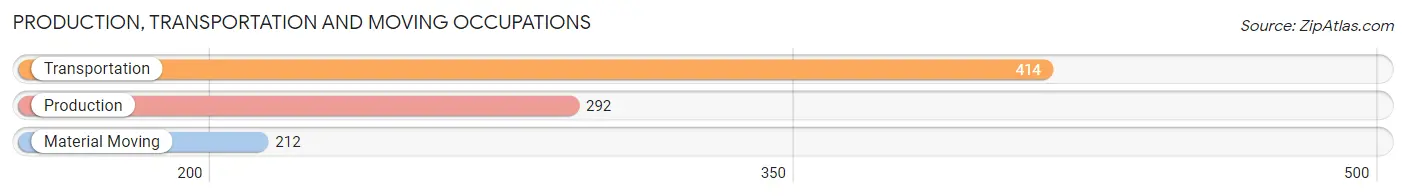
Production, Transportation and Moving Occupations
The most common Production, Transportation and Moving occupations in Spring Creek are Transportation (414 | 5.8%), Production (292 | 4.1%), and Material Moving (212 | 2.9%).
Production, Transportation and Moving Occupations by Sex
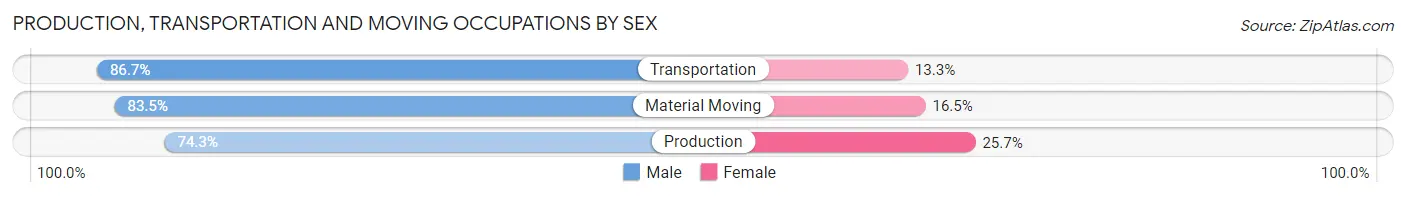
| Occupation | Male | Female |
| Production | 217 (74.3%) | 75 (25.7%) |
| Transportation | 359 (86.7%) | 55 (13.3%) |
| Material Moving | 177 (83.5%) | 35 (16.5%) |
| Total (Category) | 753 (82.0%) | 165 (18.0%) |
| Total (Overall) | 4,299 (59.8%) | 2,892 (40.2%) |
Employment Industries by Sex in Spring Creek
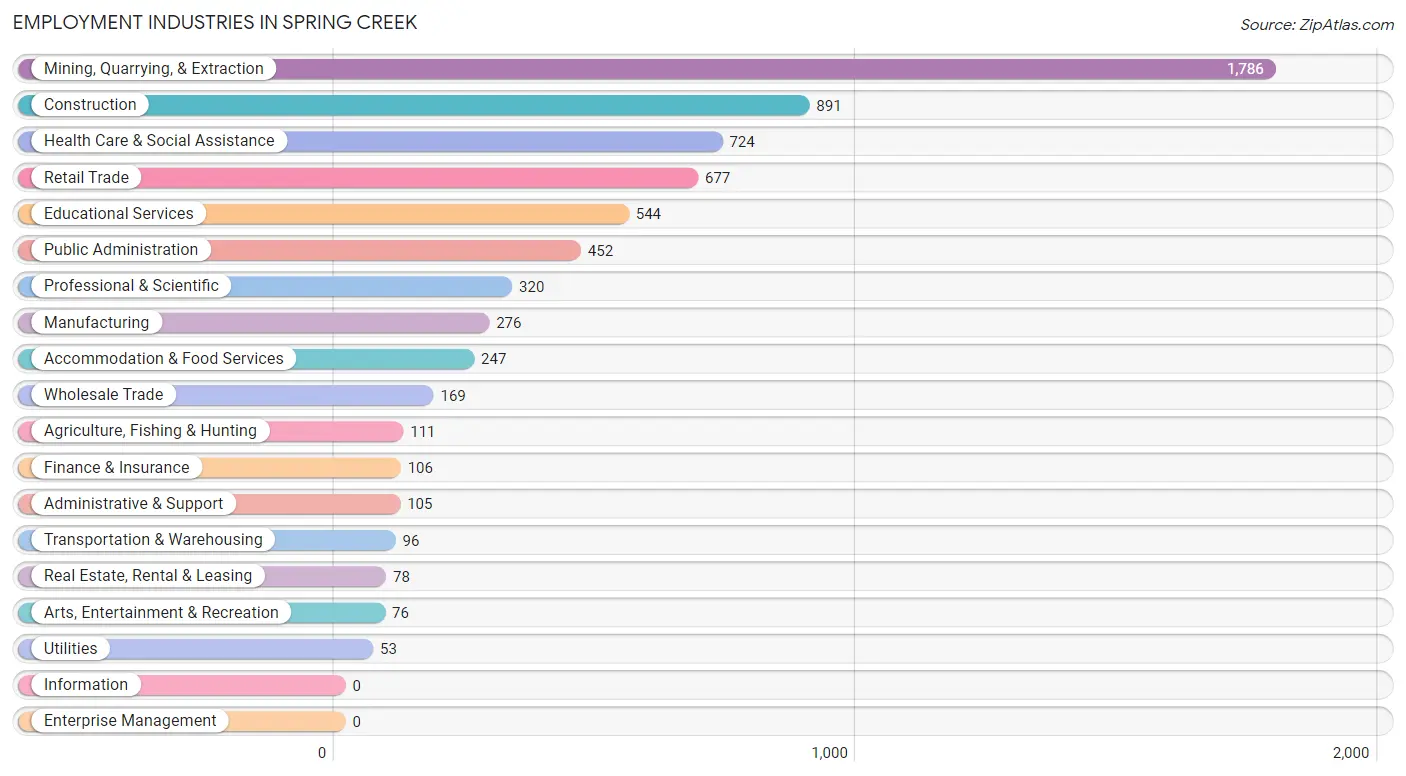
Employment Industries in Spring Creek
The major employment industries in Spring Creek include Mining, Quarrying, & Extraction (1,786 | 24.8%), Construction (891 | 12.4%), Health Care & Social Assistance (724 | 10.1%), Retail Trade (677 | 9.4%), and Educational Services (544 | 7.6%).
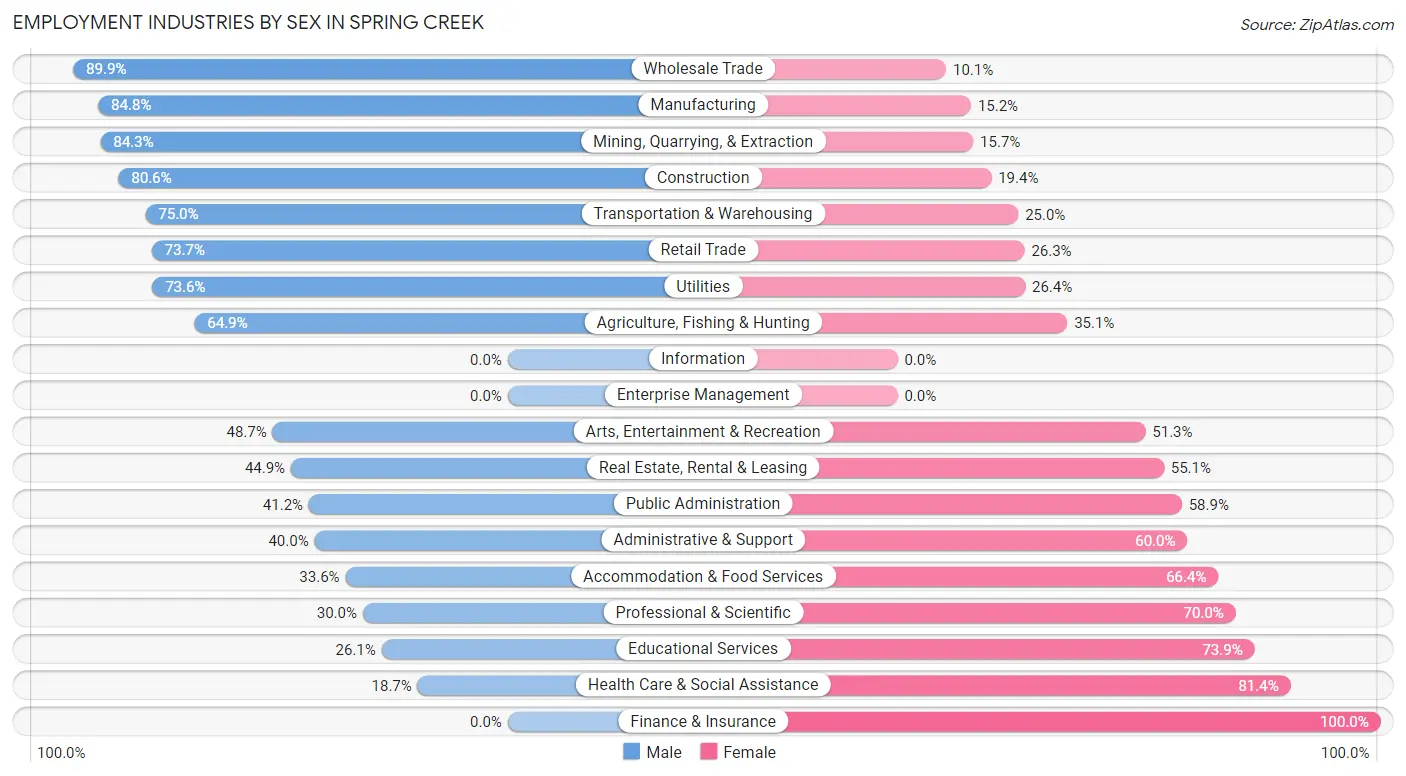
Employment Industries by Sex in Spring Creek
The Spring Creek industries that see more men than women are Wholesale Trade (89.9%), Manufacturing (84.8%), and Mining, Quarrying, & Extraction (84.3%), whereas the industries that tend to have a higher number of women are Finance & Insurance (100.0%), Health Care & Social Assistance (81.4%), and Educational Services (73.9%).
| Industry | Male | Female |
| Agriculture, Fishing & Hunting | 72 (64.9%) | 39 (35.1%) |
| Mining, Quarrying, & Extraction | 1,506 (84.3%) | 280 (15.7%) |
| Construction | 718 (80.6%) | 173 (19.4%) |
| Manufacturing | 234 (84.8%) | 42 (15.2%) |
| Wholesale Trade | 152 (89.9%) | 17 (10.1%) |
| Retail Trade | 499 (73.7%) | 178 (26.3%) |
| Transportation & Warehousing | 72 (75.0%) | 24 (25.0%) |
| Utilities | 39 (73.6%) | 14 (26.4%) |
| Information | 0 (0.0%) | 0 (0.0%) |
| Finance & Insurance | 0 (0.0%) | 106 (100.0%) |
| Real Estate, Rental & Leasing | 35 (44.9%) | 43 (55.1%) |
| Professional & Scientific | 96 (30.0%) | 224 (70.0%) |
| Enterprise Management | 0 (0.0%) | 0 (0.0%) |
| Administrative & Support | 42 (40.0%) | 63 (60.0%) |
| Educational Services | 142 (26.1%) | 402 (73.9%) |
| Health Care & Social Assistance | 135 (18.6%) | 589 (81.4%) |
| Arts, Entertainment & Recreation | 37 (48.7%) | 39 (51.3%) |
| Accommodation & Food Services | 83 (33.6%) | 164 (66.4%) |
| Public Administration | 186 (41.1%) | 266 (58.9%) |
| Total | 4,299 (59.8%) | 2,892 (40.2%) |
Education in Spring Creek
School Enrollment in Spring Creek
The most common levels of schooling among the 4,121 students in Spring Creek are high school (1,066 | 25.9%), middle school (1,011 | 24.5%), and elementary school (788 | 19.1%).
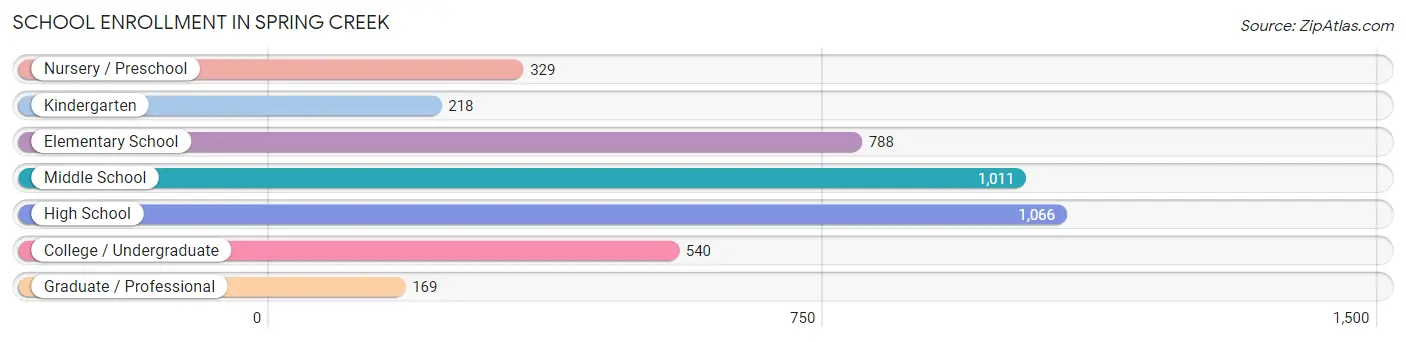
| School Level | # Students | % Students |
| Nursery / Preschool | 329 | 8.0% |
| Kindergarten | 218 | 5.3% |
| Elementary School | 788 | 19.1% |
| Middle School | 1,011 | 24.5% |
| High School | 1,066 | 25.9% |
| College / Undergraduate | 540 | 13.1% |
| Graduate / Professional | 169 | 4.1% |
| Total | 4,121 | 100.0% |
School Enrollment by Age by Funding Source in Spring Creek
Out of a total of 4,121 students who are enrolled in schools in Spring Creek, 515 (12.5%) attend a private institution, while the remaining 3,606 (87.5%) are enrolled in public schools. The age group of 20 to 24 year olds has the highest likelihood of being enrolled in private schools, with 121 (38.8% in the age bracket) enrolled. Conversely, the age group of 18 to 19 year olds has the lowest likelihood of being enrolled in a private school, with 114 (100.0% in the age bracket) attending a public institution.
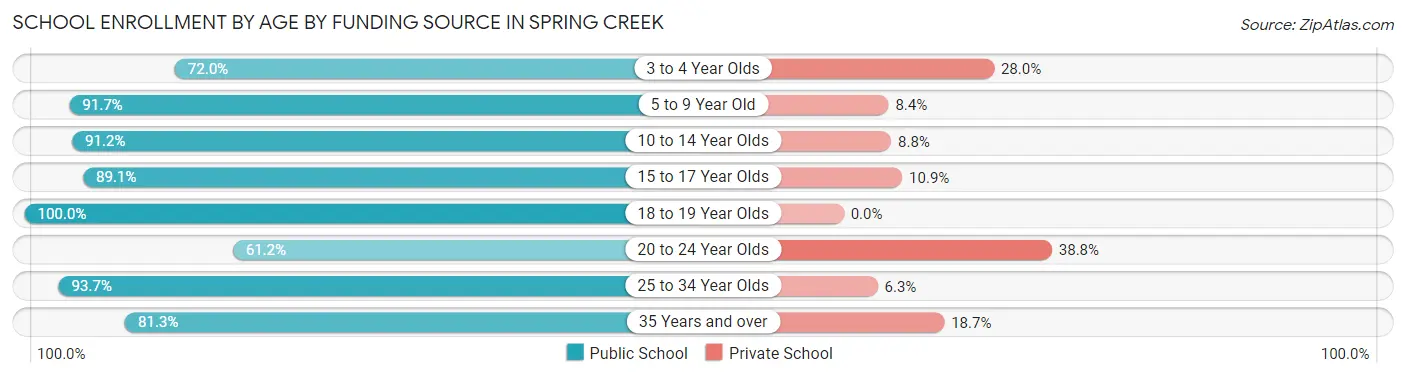
| Age Bracket | Public School | Private School |
| 3 to 4 Year Olds | 108 (72.0%) | 42 (28.0%) |
| 5 to 9 Year Old | 966 (91.6%) | 88 (8.4%) |
| 10 to 14 Year Olds | 1,062 (91.2%) | 103 (8.8%) |
| 15 to 17 Year Olds | 859 (89.1%) | 105 (10.9%) |
| 18 to 19 Year Olds | 114 (100.0%) | 0 (0.0%) |
| 20 to 24 Year Olds | 191 (61.2%) | 121 (38.8%) |
| 25 to 34 Year Olds | 89 (93.7%) | 6 (6.3%) |
| 35 Years and over | 217 (81.3%) | 50 (18.7%) |
| Total | 3,606 (87.5%) | 515 (12.5%) |
Educational Attainment by Field of Study in Spring Creek
Business (362 | 16.7%), bio, nature & agricultural (361 | 16.7%), education (275 | 12.7%), engineering (185 | 8.5%), and science & technology (183 | 8.4%) are the most common fields of study among 2,168 individuals in Spring Creek who have obtained a bachelor's degree or higher.
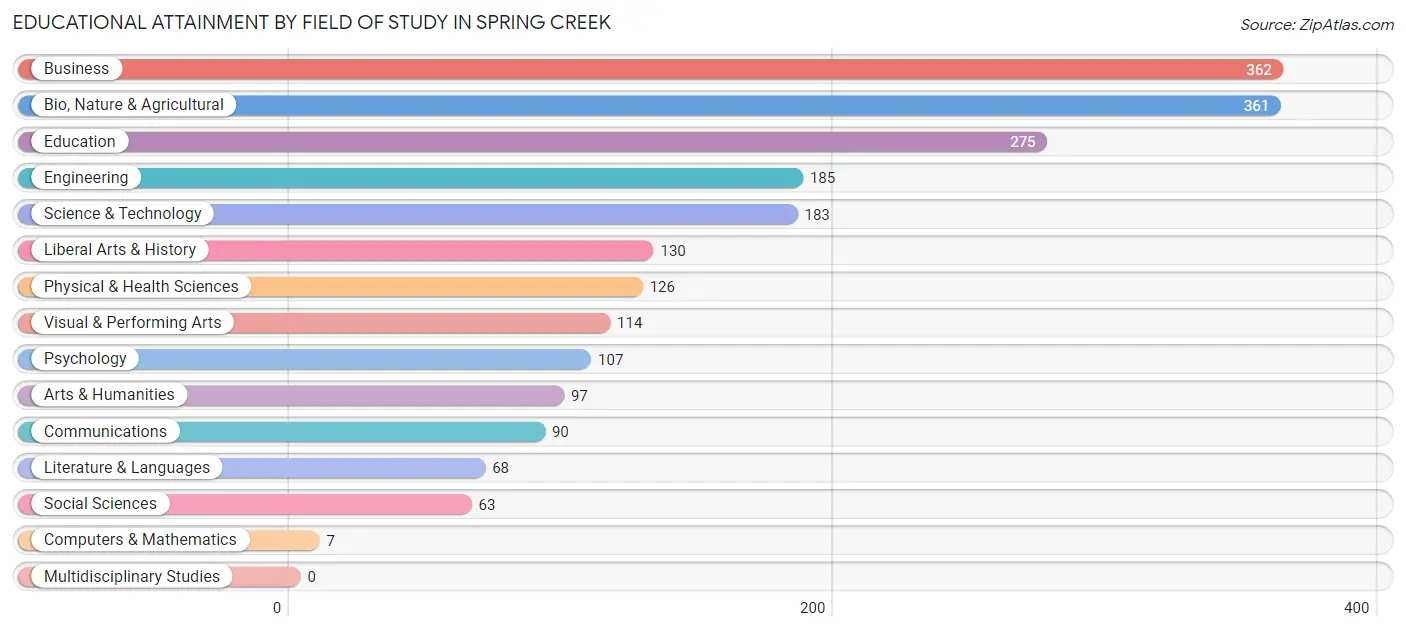
| Field of Study | # Graduates | % Graduates |
| Computers & Mathematics | 7 | 0.3% |
| Bio, Nature & Agricultural | 361 | 16.7% |
| Physical & Health Sciences | 126 | 5.8% |
| Psychology | 107 | 4.9% |
| Social Sciences | 63 | 2.9% |
| Engineering | 185 | 8.5% |
| Multidisciplinary Studies | 0 | 0.0% |
| Science & Technology | 183 | 8.4% |
| Business | 362 | 16.7% |
| Education | 275 | 12.7% |
| Literature & Languages | 68 | 3.1% |
| Liberal Arts & History | 130 | 6.0% |
| Visual & Performing Arts | 114 | 5.3% |
| Communications | 90 | 4.2% |
| Arts & Humanities | 97 | 4.5% |
| Total | 2,168 | 100.0% |
Transportation & Commute in Spring Creek
Vehicle Availability by Sex in Spring Creek
The most prevalent vehicle ownership categories in Spring Creek are males with 3 vehicles (1,309, accounting for 30.7%) and females with 3 vehicles (899, making up 45.7%).
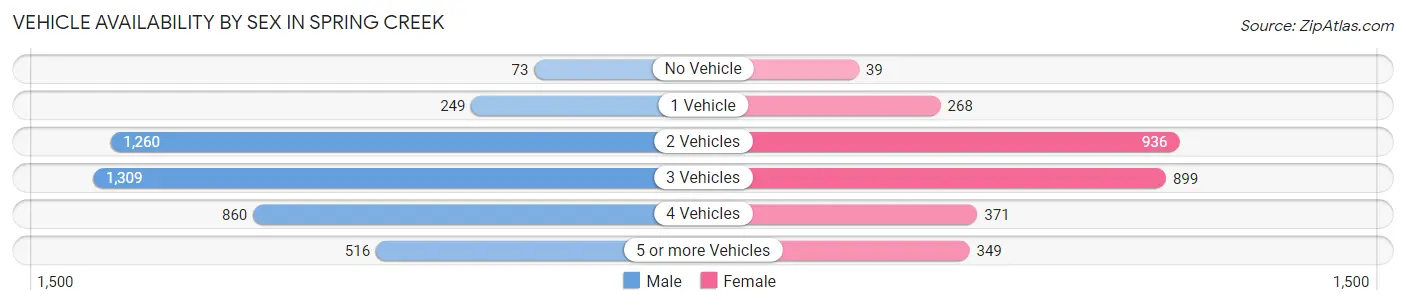
| Vehicles Available | Male | Female |
| No Vehicle | 73 (1.7%) | 39 (1.4%) |
| 1 Vehicle | 249 (5.8%) | 268 (9.4%) |
| 2 Vehicles | 1,260 (29.5%) | 936 (32.7%) |
| 3 Vehicles | 1,309 (30.7%) | 899 (31.4%) |
| 4 Vehicles | 860 (20.2%) | 371 (13.0%) |
| 5 or more Vehicles | 516 (12.1%) | 349 (12.2%) |
| Total | 4,267 (100.0%) | 2,862 (100.0%) |
Commute Time in Spring Creek
The most frequently occuring commute durations in Spring Creek are 90 or more minutes (1,211 commuters, 18.2%), 20 to 24 minutes (949 commuters, 14.3%), and 30 to 34 minutes (897 commuters, 13.5%).
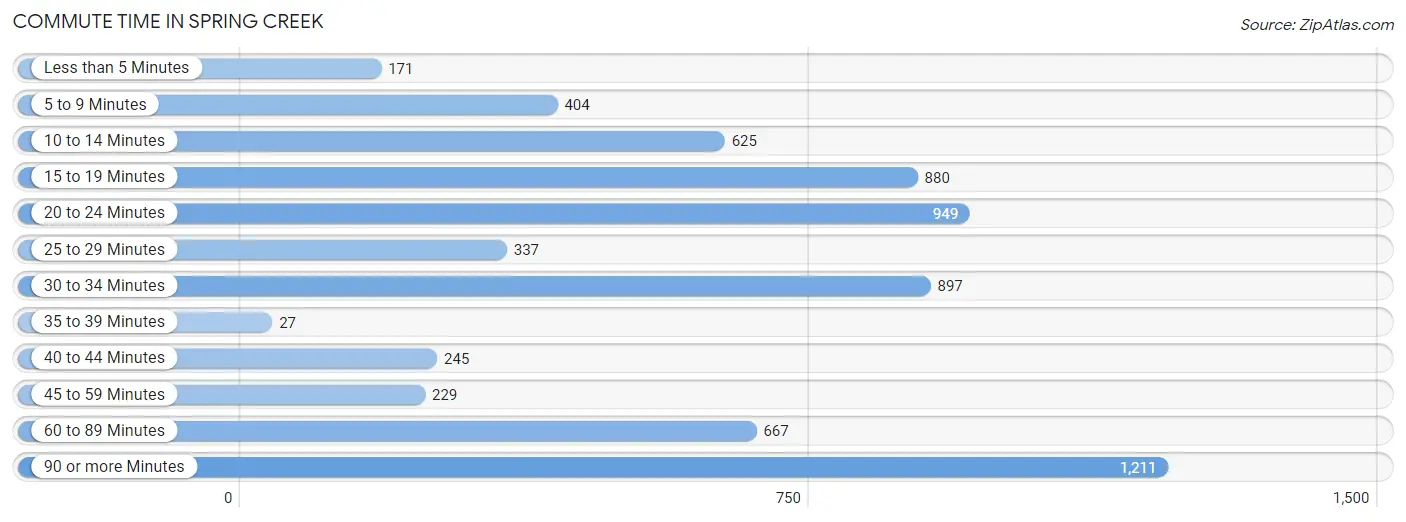
| Commute Time | # Commuters | % Commuters |
| Less than 5 Minutes | 171 | 2.6% |
| 5 to 9 Minutes | 404 | 6.1% |
| 10 to 14 Minutes | 625 | 9.4% |
| 15 to 19 Minutes | 880 | 13.3% |
| 20 to 24 Minutes | 949 | 14.3% |
| 25 to 29 Minutes | 337 | 5.1% |
| 30 to 34 Minutes | 897 | 13.5% |
| 35 to 39 Minutes | 27 | 0.4% |
| 40 to 44 Minutes | 245 | 3.7% |
| 45 to 59 Minutes | 229 | 3.5% |
| 60 to 89 Minutes | 667 | 10.0% |
| 90 or more Minutes | 1,211 | 18.2% |
Commute Time by Sex in Spring Creek
The most common commute times in Spring Creek are 90 or more minutes (995 commuters, 24.3%) for males and 20 to 24 minutes (516 commuters, 20.2%) for females.
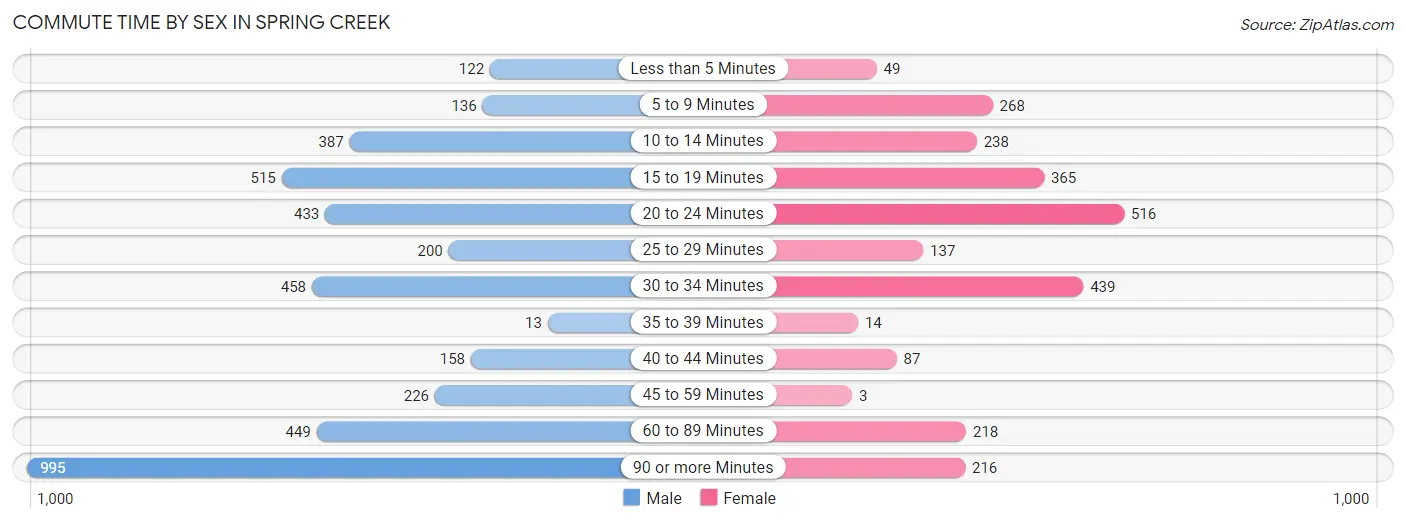
| Commute Time | Male | Female |
| Less than 5 Minutes | 122 (3.0%) | 49 (1.9%) |
| 5 to 9 Minutes | 136 (3.3%) | 268 (10.5%) |
| 10 to 14 Minutes | 387 (9.5%) | 238 (9.3%) |
| 15 to 19 Minutes | 515 (12.6%) | 365 (14.3%) |
| 20 to 24 Minutes | 433 (10.6%) | 516 (20.2%) |
| 25 to 29 Minutes | 200 (4.9%) | 137 (5.4%) |
| 30 to 34 Minutes | 458 (11.2%) | 439 (17.2%) |
| 35 to 39 Minutes | 13 (0.3%) | 14 (0.5%) |
| 40 to 44 Minutes | 158 (3.9%) | 87 (3.4%) |
| 45 to 59 Minutes | 226 (5.5%) | 3 (0.1%) |
| 60 to 89 Minutes | 449 (11.0%) | 218 (8.6%) |
| 90 or more Minutes | 995 (24.3%) | 216 (8.5%) |
Time of Departure to Work by Sex in Spring Creek
The most frequent times of departure to work in Spring Creek are 12:00 AM to 4:59 AM (1,316, 32.2%) for males and 12:00 AM to 4:59 AM (456, 17.9%) for females.
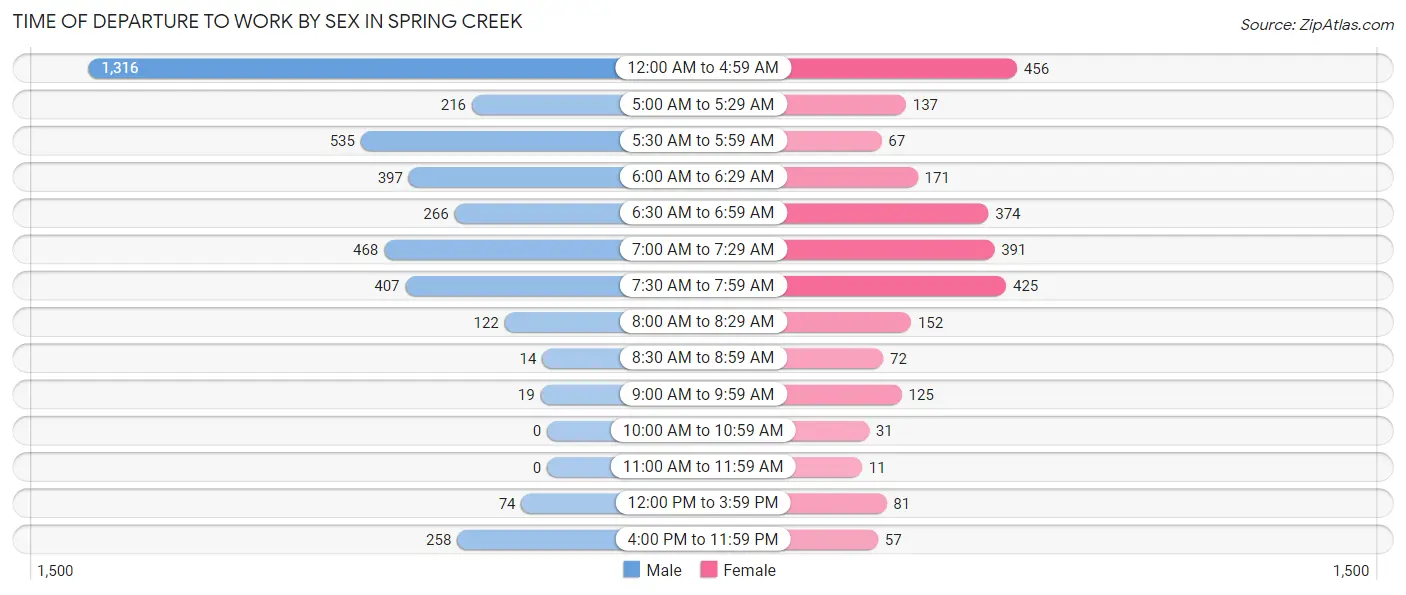
| Time of Departure | Male | Female |
| 12:00 AM to 4:59 AM | 1,316 (32.2%) | 456 (17.9%) |
| 5:00 AM to 5:29 AM | 216 (5.3%) | 137 (5.4%) |
| 5:30 AM to 5:59 AM | 535 (13.1%) | 67 (2.6%) |
| 6:00 AM to 6:29 AM | 397 (9.7%) | 171 (6.7%) |
| 6:30 AM to 6:59 AM | 266 (6.5%) | 374 (14.7%) |
| 7:00 AM to 7:29 AM | 468 (11.4%) | 391 (15.3%) |
| 7:30 AM to 7:59 AM | 407 (10.0%) | 425 (16.7%) |
| 8:00 AM to 8:29 AM | 122 (3.0%) | 152 (6.0%) |
| 8:30 AM to 8:59 AM | 14 (0.3%) | 72 (2.8%) |
| 9:00 AM to 9:59 AM | 19 (0.5%) | 125 (4.9%) |
| 10:00 AM to 10:59 AM | 0 (0.0%) | 31 (1.2%) |
| 11:00 AM to 11:59 AM | 0 (0.0%) | 11 (0.4%) |
| 12:00 PM to 3:59 PM | 74 (1.8%) | 81 (3.2%) |
| 4:00 PM to 11:59 PM | 258 (6.3%) | 57 (2.2%) |
| Total | 4,092 (100.0%) | 2,550 (100.0%) |
Housing Occupancy in Spring Creek
Occupancy by Ownership in Spring Creek
Of the total 4,851 dwellings in Spring Creek, owner-occupied units account for 4,342 (89.5%), while renter-occupied units make up 509 (10.5%).
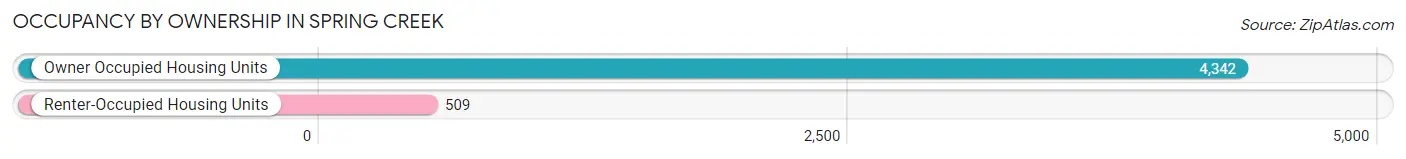
| Occupancy | # Housing Units | % Housing Units |
| Owner Occupied Housing Units | 4,342 | 89.5% |
| Renter-Occupied Housing Units | 509 | 10.5% |
| Total Occupied Housing Units | 4,851 | 100.0% |
Occupancy by Household Size in Spring Creek
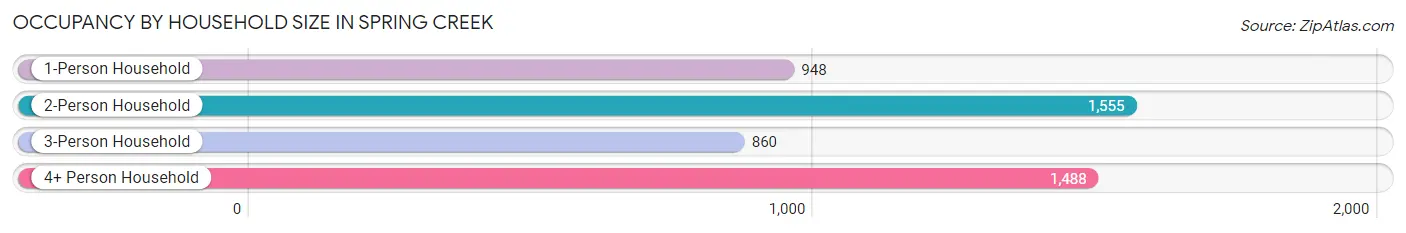
| Household Size | # Housing Units | % Housing Units |
| 1-Person Household | 948 | 19.5% |
| 2-Person Household | 1,555 | 32.1% |
| 3-Person Household | 860 | 17.7% |
| 4+ Person Household | 1,488 | 30.7% |
| Total Housing Units | 4,851 | 100.0% |
Occupancy by Ownership by Household Size in Spring Creek
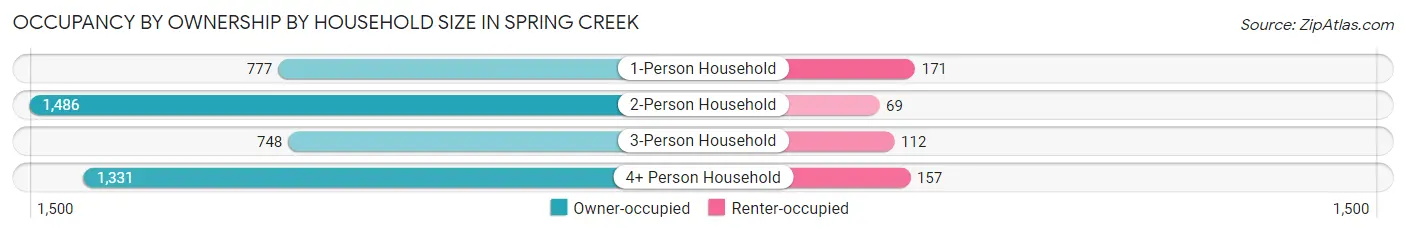
| Household Size | Owner-occupied | Renter-occupied |
| 1-Person Household | 777 (82.0%) | 171 (18.0%) |
| 2-Person Household | 1,486 (95.6%) | 69 (4.4%) |
| 3-Person Household | 748 (87.0%) | 112 (13.0%) |
| 4+ Person Household | 1,331 (89.4%) | 157 (10.5%) |
| Total Housing Units | 4,342 (89.5%) | 509 (10.5%) |
Occupancy by Educational Attainment in Spring Creek
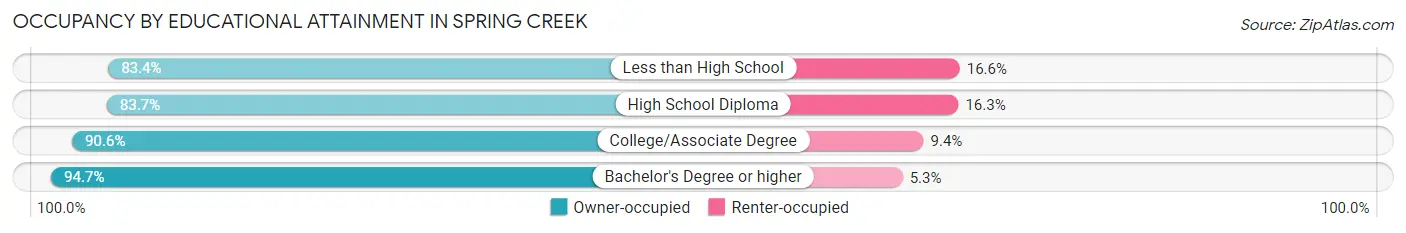
| Household Size | Owner-occupied | Renter-occupied |
| Less than High School | 161 (83.4%) | 32 (16.6%) |
| High School Diploma | 1,102 (83.7%) | 215 (16.3%) |
| College/Associate Degree | 1,890 (90.6%) | 196 (9.4%) |
| Bachelor's Degree or higher | 1,189 (94.7%) | 66 (5.3%) |
Occupancy by Age of Householder in Spring Creek
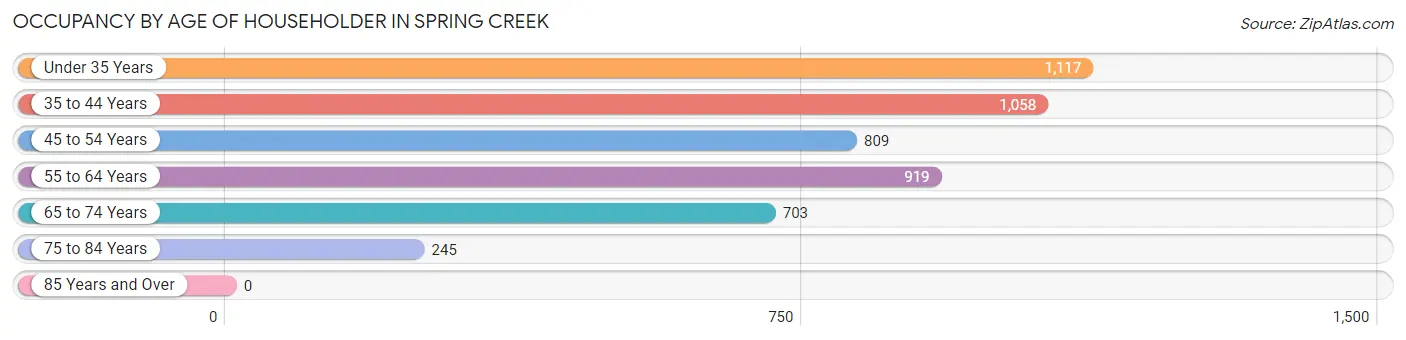
| Age Bracket | # Households | % Households |
| Under 35 Years | 1,117 | 23.0% |
| 35 to 44 Years | 1,058 | 21.8% |
| 45 to 54 Years | 809 | 16.7% |
| 55 to 64 Years | 919 | 18.9% |
| 65 to 74 Years | 703 | 14.5% |
| 75 to 84 Years | 245 | 5.1% |
| 85 Years and Over | 0 | 0.0% |
| Total | 4,851 | 100.0% |
Housing Finances in Spring Creek
Median Income by Occupancy in Spring Creek
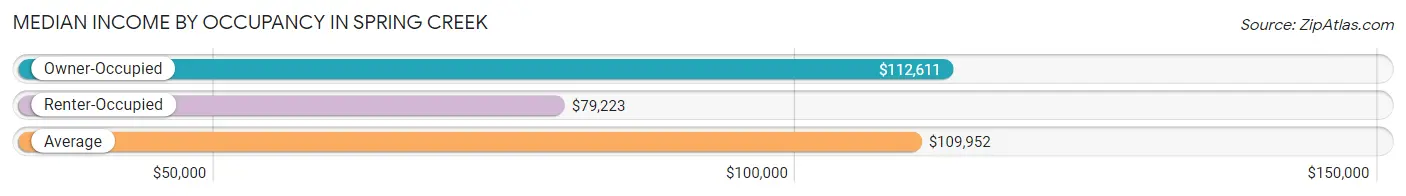
| Occupancy Type | # Households | Median Income |
| Owner-Occupied | 4,342 (89.5%) | $112,611 |
| Renter-Occupied | 509 (10.5%) | $79,223 |
| Average | 4,851 (100.0%) | $109,952 |
Occupancy by Householder Income Bracket in Spring Creek
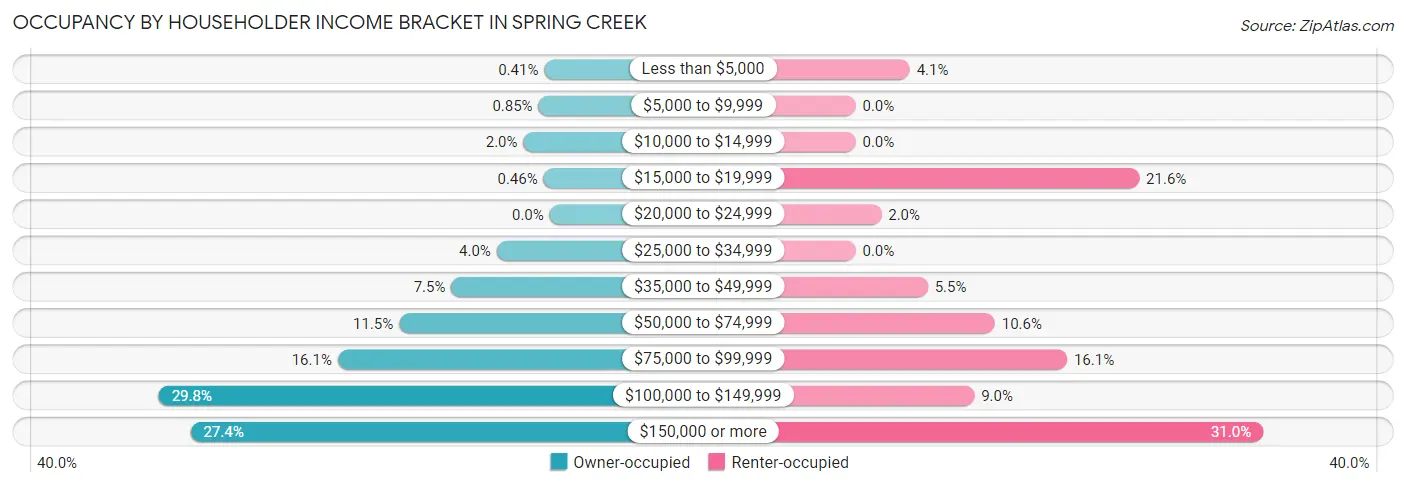
| Income Bracket | Owner-occupied | Renter-occupied |
| Less than $5,000 | 18 (0.4%) | 21 (4.1%) |
| $5,000 to $9,999 | 37 (0.9%) | 0 (0.0%) |
| $10,000 to $14,999 | 87 (2.0%) | 0 (0.0%) |
| $15,000 to $19,999 | 20 (0.5%) | 110 (21.6%) |
| $20,000 to $24,999 | 0 (0.0%) | 10 (2.0%) |
| $25,000 to $34,999 | 175 (4.0%) | 0 (0.0%) |
| $35,000 to $49,999 | 325 (7.5%) | 28 (5.5%) |
| $50,000 to $74,999 | 498 (11.5%) | 54 (10.6%) |
| $75,000 to $99,999 | 701 (16.1%) | 82 (16.1%) |
| $100,000 to $149,999 | 1,293 (29.8%) | 46 (9.0%) |
| $150,000 or more | 1,188 (27.4%) | 158 (31.0%) |
| Total | 4,342 (100.0%) | 509 (100.0%) |
Monthly Housing Cost Tiers in Spring Creek
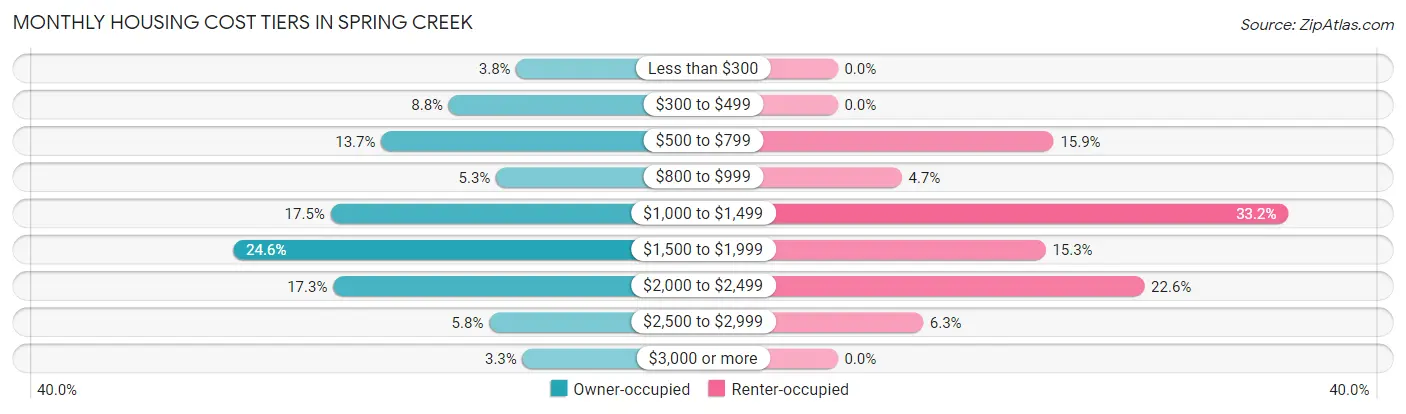
| Monthly Cost | Owner-occupied | Renter-occupied |
| Less than $300 | 164 (3.8%) | 0 (0.0%) |
| $300 to $499 | 380 (8.7%) | 0 (0.0%) |
| $500 to $799 | 596 (13.7%) | 81 (15.9%) |
| $800 to $999 | 229 (5.3%) | 24 (4.7%) |
| $1,000 to $1,499 | 758 (17.5%) | 169 (33.2%) |
| $1,500 to $1,999 | 1,070 (24.6%) | 78 (15.3%) |
| $2,000 to $2,499 | 750 (17.3%) | 115 (22.6%) |
| $2,500 to $2,999 | 251 (5.8%) | 32 (6.3%) |
| $3,000 or more | 144 (3.3%) | 0 (0.0%) |
| Total | 4,342 (100.0%) | 509 (100.0%) |
Physical Housing Characteristics in Spring Creek
Housing Structures in Spring Creek
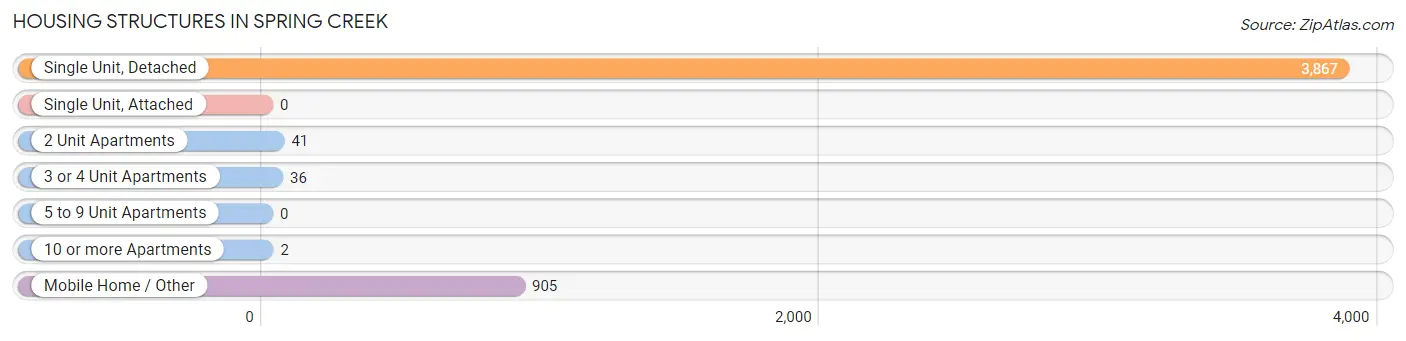
| Structure Type | # Housing Units | % Housing Units |
| Single Unit, Detached | 3,867 | 79.7% |
| Single Unit, Attached | 0 | 0.0% |
| 2 Unit Apartments | 41 | 0.9% |
| 3 or 4 Unit Apartments | 36 | 0.7% |
| 5 to 9 Unit Apartments | 0 | 0.0% |
| 10 or more Apartments | 2 | 0.0% |
| Mobile Home / Other | 905 | 18.7% |
| Total | 4,851 | 100.0% |
Housing Structures by Occupancy in Spring Creek
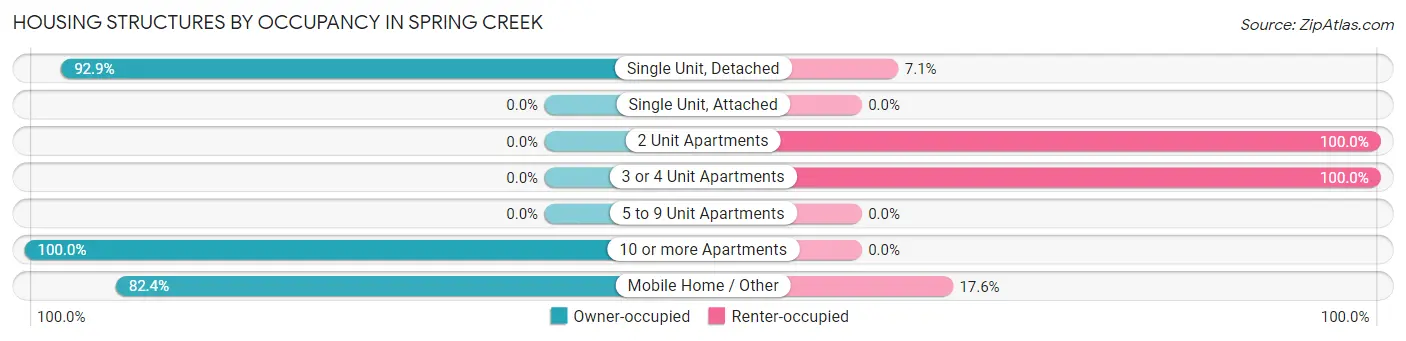
| Structure Type | Owner-occupied | Renter-occupied |
| Single Unit, Detached | 3,594 (92.9%) | 273 (7.1%) |
| Single Unit, Attached | 0 (0.0%) | 0 (0.0%) |
| 2 Unit Apartments | 0 (0.0%) | 41 (100.0%) |
| 3 or 4 Unit Apartments | 0 (0.0%) | 36 (100.0%) |
| 5 to 9 Unit Apartments | 0 (0.0%) | 0 (0.0%) |
| 10 or more Apartments | 2 (100.0%) | 0 (0.0%) |
| Mobile Home / Other | 746 (82.4%) | 159 (17.6%) |
| Total | 4,342 (89.5%) | 509 (10.5%) |
Housing Structures by Number of Rooms in Spring Creek
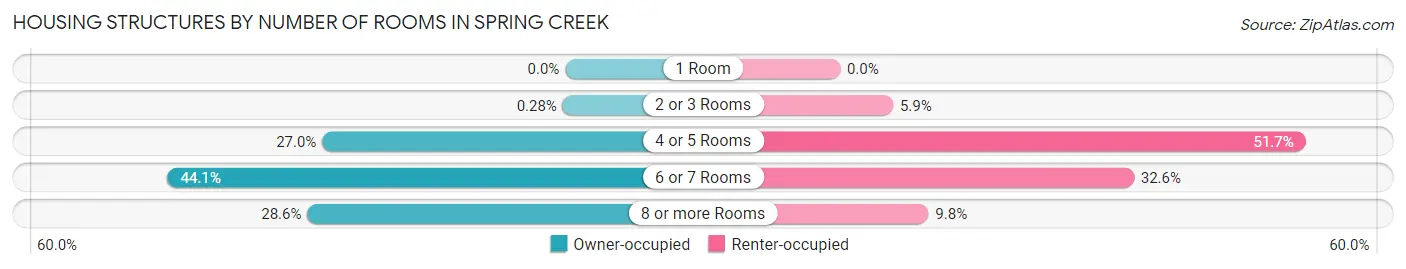
| Number of Rooms | Owner-occupied | Renter-occupied |
| 1 Room | 0 (0.0%) | 0 (0.0%) |
| 2 or 3 Rooms | 12 (0.3%) | 30 (5.9%) |
| 4 or 5 Rooms | 1,171 (27.0%) | 263 (51.7%) |
| 6 or 7 Rooms | 1,916 (44.1%) | 166 (32.6%) |
| 8 or more Rooms | 1,243 (28.6%) | 50 (9.8%) |
| Total | 4,342 (100.0%) | 509 (100.0%) |
Housing Structure by Heating Type in Spring Creek
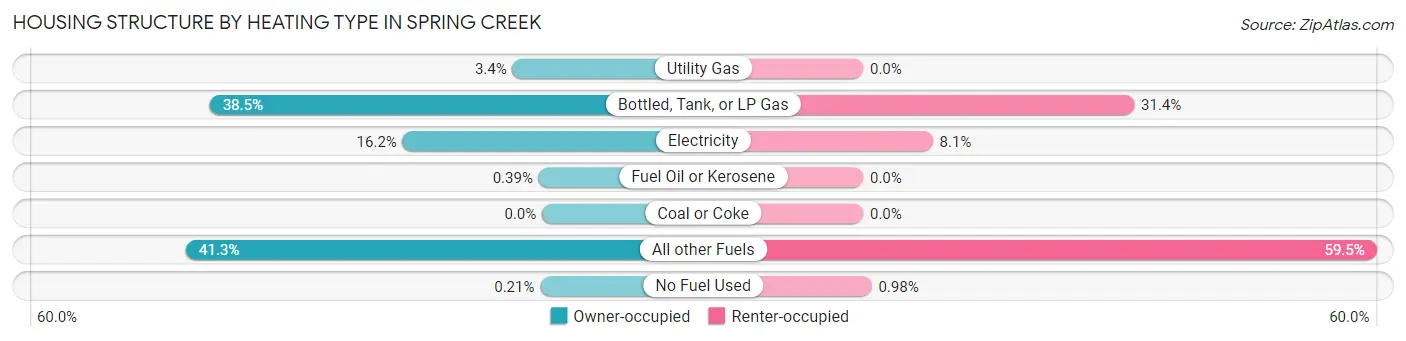
| Heating Type | Owner-occupied | Renter-occupied |
| Utility Gas | 149 (3.4%) | 0 (0.0%) |
| Bottled, Tank, or LP Gas | 1,673 (38.5%) | 160 (31.4%) |
| Electricity | 702 (16.2%) | 41 (8.1%) |
| Fuel Oil or Kerosene | 17 (0.4%) | 0 (0.0%) |
| Coal or Coke | 0 (0.0%) | 0 (0.0%) |
| All other Fuels | 1,792 (41.3%) | 303 (59.5%) |
| No Fuel Used | 9 (0.2%) | 5 (1.0%) |
| Total | 4,342 (100.0%) | 509 (100.0%) |
Household Vehicle Usage in Spring Creek
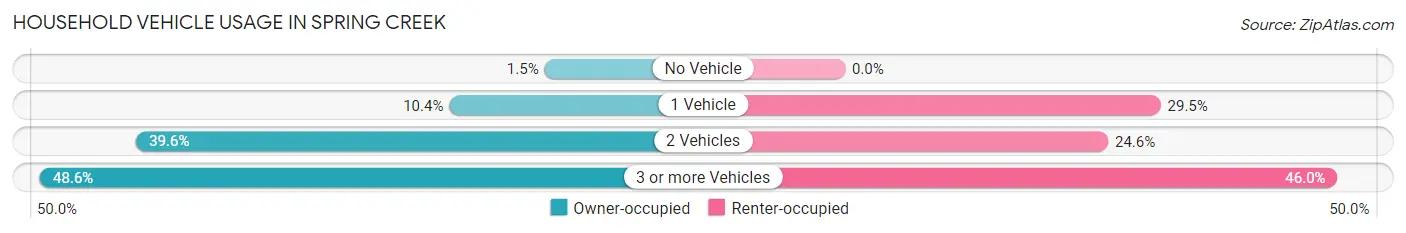
| Vehicles per Household | Owner-occupied | Renter-occupied |
| No Vehicle | 64 (1.5%) | 0 (0.0%) |
| 1 Vehicle | 450 (10.4%) | 150 (29.5%) |
| 2 Vehicles | 1,719 (39.6%) | 125 (24.6%) |
| 3 or more Vehicles | 2,109 (48.6%) | 234 (46.0%) |
| Total | 4,342 (100.0%) | 509 (100.0%) |
Real Estate & Mortgages in Spring Creek
Real Estate and Mortgage Overview in Spring Creek
| Characteristic | Without Mortgage | With Mortgage |
| Housing Units | 1,297 | 3,045 |
| Median Property Value | $295,200 | $301,000 |
| Median Household Income | $90,035 | $984 |
| Monthly Housing Costs | $573 | $144 |
| Real Estate Taxes | $1,539 | $78 |
Property Value by Mortgage Status in Spring Creek
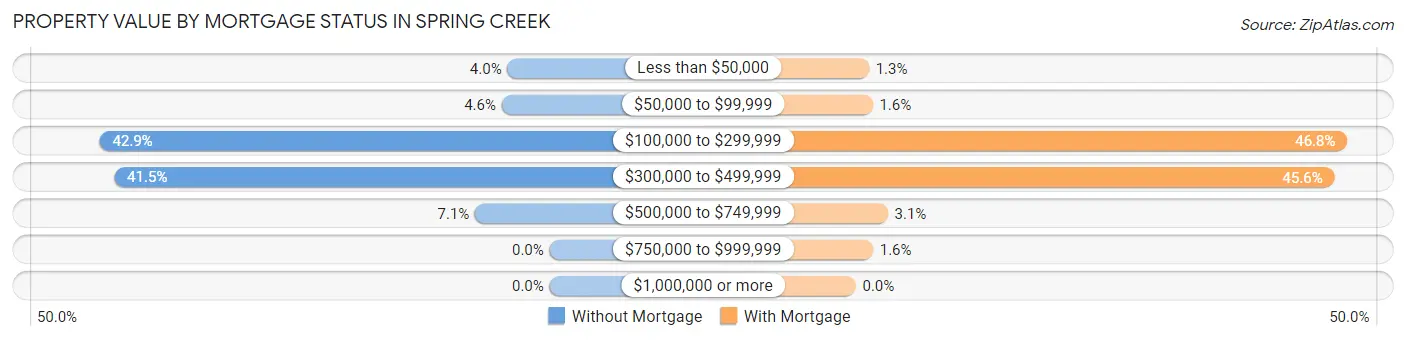
| Property Value | Without Mortgage | With Mortgage |
| Less than $50,000 | 52 (4.0%) | 38 (1.3%) |
| $50,000 to $99,999 | 59 (4.5%) | 49 (1.6%) |
| $100,000 to $299,999 | 556 (42.9%) | 1,426 (46.8%) |
| $300,000 to $499,999 | 538 (41.5%) | 1,389 (45.6%) |
| $500,000 to $749,999 | 92 (7.1%) | 93 (3.0%) |
| $750,000 to $999,999 | 0 (0.0%) | 50 (1.6%) |
| $1,000,000 or more | 0 (0.0%) | 0 (0.0%) |
| Total | 1,297 (100.0%) | 3,045 (100.0%) |
Household Income by Mortgage Status in Spring Creek
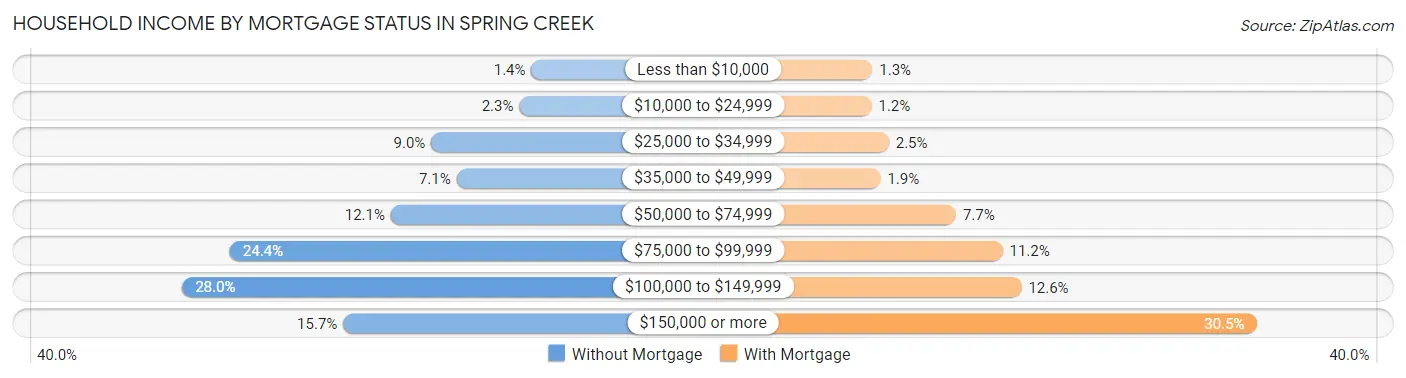
| Household Income | Without Mortgage | With Mortgage |
| Less than $10,000 | 18 (1.4%) | 39 (1.3%) |
| $10,000 to $24,999 | 30 (2.3%) | 37 (1.2%) |
| $25,000 to $34,999 | 117 (9.0%) | 77 (2.5%) |
| $35,000 to $49,999 | 92 (7.1%) | 58 (1.9%) |
| $50,000 to $74,999 | 157 (12.1%) | 233 (7.6%) |
| $75,000 to $99,999 | 316 (24.4%) | 341 (11.2%) |
| $100,000 to $149,999 | 363 (28.0%) | 385 (12.6%) |
| $150,000 or more | 204 (15.7%) | 930 (30.5%) |
| Total | 1,297 (100.0%) | 3,045 (100.0%) |
Property Value to Household Income Ratio in Spring Creek
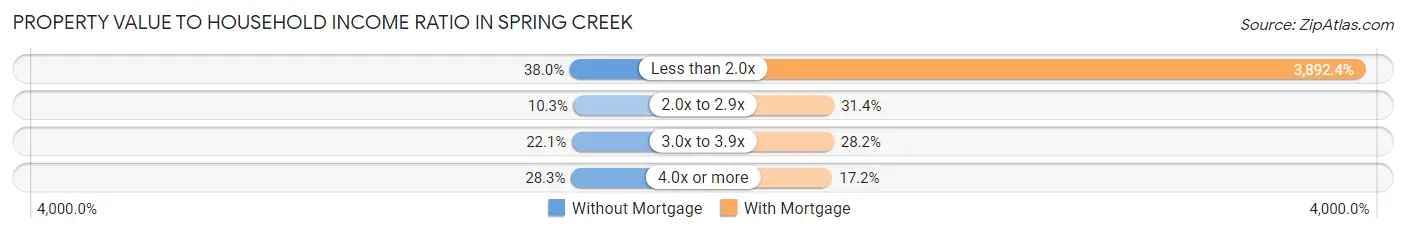
| Value-to-Income Ratio | Without Mortgage | With Mortgage |
| Less than 2.0x | 493 (38.0%) | 118,523 (3,892.4%) |
| 2.0x to 2.9x | 133 (10.2%) | 956 (31.4%) |
| 3.0x to 3.9x | 286 (22.1%) | 858 (28.2%) |
| 4.0x or more | 367 (28.3%) | 525 (17.2%) |
| Total | 1,297 (100.0%) | 3,045 (100.0%) |
Real Estate Taxes by Mortgage Status in Spring Creek
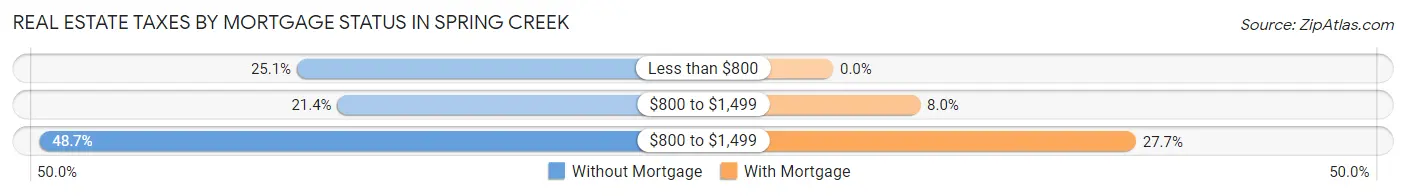
| Property Taxes | Without Mortgage | With Mortgage |
| Less than $800 | 326 (25.1%) | 0 (0.0%) |
| $800 to $1,499 | 278 (21.4%) | 242 (8.0%) |
| $800 to $1,499 | 631 (48.6%) | 842 (27.7%) |
| Total | 1,297 (100.0%) | 3,045 (100.0%) |
Health & Disability in Spring Creek
Health Insurance Coverage by Age in Spring Creek
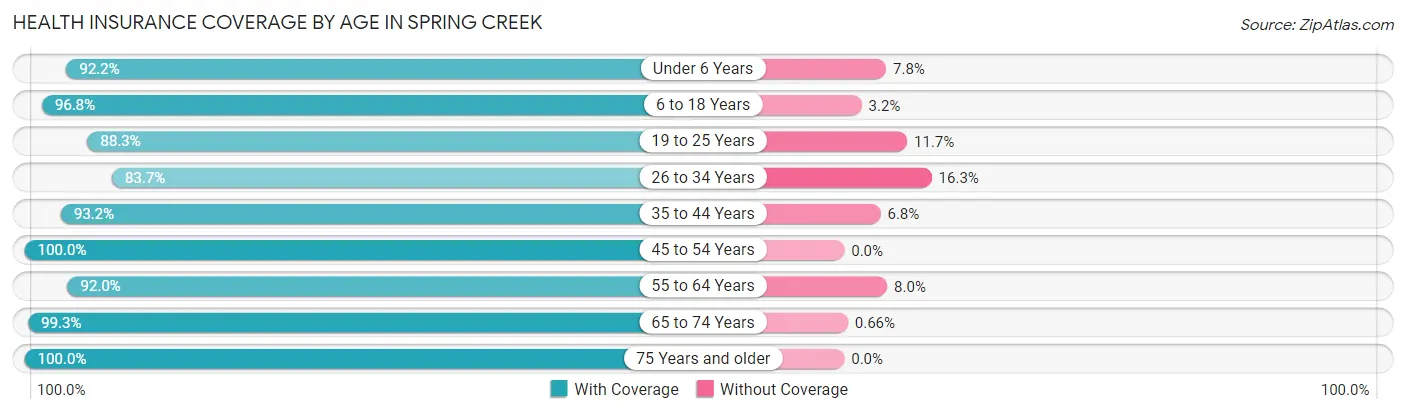
| Age Bracket | With Coverage | Without Coverage |
| Under 6 Years | 1,302 (92.2%) | 110 (7.8%) |
| 6 to 18 Years | 3,036 (96.8%) | 101 (3.2%) |
| 19 to 25 Years | 988 (88.3%) | 131 (11.7%) |
| 26 to 34 Years | 1,675 (83.7%) | 326 (16.3%) |
| 35 to 44 Years | 1,752 (93.2%) | 127 (6.8%) |
| 45 to 54 Years | 1,691 (100.0%) | 0 (0.0%) |
| 55 to 64 Years | 1,855 (92.0%) | 161 (8.0%) |
| 65 to 74 Years | 1,202 (99.3%) | 8 (0.7%) |
| 75 Years and older | 597 (100.0%) | 0 (0.0%) |
| Total | 14,098 (93.6%) | 964 (6.4%) |
Health Insurance Coverage by Citizenship Status in Spring Creek
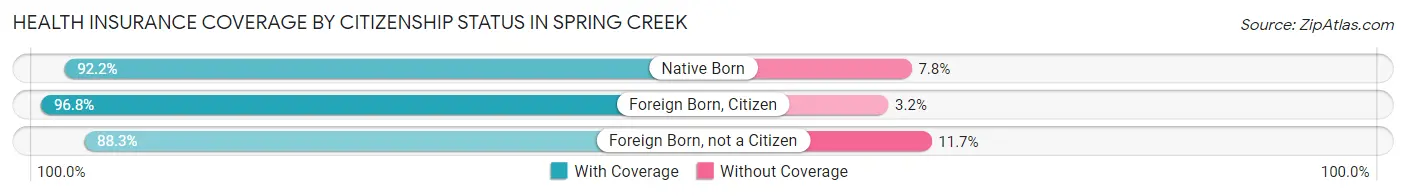
| Citizenship Status | With Coverage | Without Coverage |
| Native Born | 1,302 (92.2%) | 110 (7.8%) |
| Foreign Born, Citizen | 3,036 (96.8%) | 101 (3.2%) |
| Foreign Born, not a Citizen | 988 (88.3%) | 131 (11.7%) |
Health Insurance Coverage by Household Income in Spring Creek
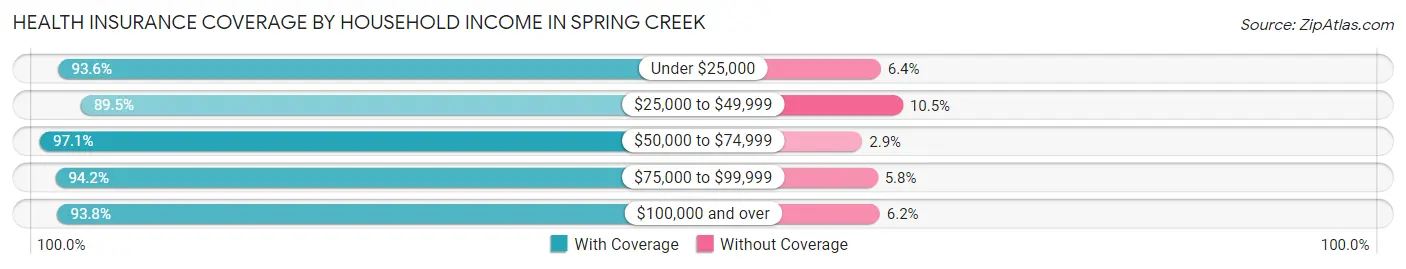
| Household Income | With Coverage | Without Coverage |
| Under $25,000 | 544 (93.6%) | 37 (6.4%) |
| $25,000 to $49,999 | 1,641 (89.5%) | 193 (10.5%) |
| $50,000 to $74,999 | 1,168 (97.1%) | 35 (2.9%) |
| $75,000 to $99,999 | 2,100 (94.2%) | 129 (5.8%) |
| $100,000 and over | 8,645 (93.8%) | 570 (6.2%) |
Public vs Private Health Insurance Coverage by Age in Spring Creek
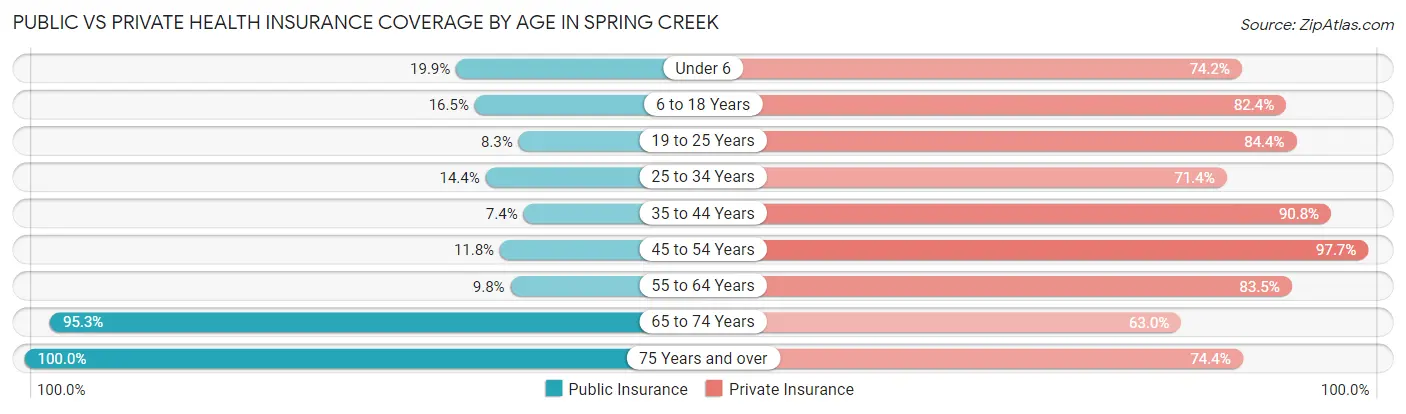
| Age Bracket | Public Insurance | Private Insurance |
| Under 6 | 281 (19.9%) | 1,048 (74.2%) |
| 6 to 18 Years | 516 (16.5%) | 2,586 (82.4%) |
| 19 to 25 Years | 93 (8.3%) | 944 (84.4%) |
| 25 to 34 Years | 289 (14.4%) | 1,429 (71.4%) |
| 35 to 44 Years | 139 (7.4%) | 1,706 (90.8%) |
| 45 to 54 Years | 199 (11.8%) | 1,652 (97.7%) |
| 55 to 64 Years | 198 (9.8%) | 1,683 (83.5%) |
| 65 to 74 Years | 1,153 (95.3%) | 762 (63.0%) |
| 75 Years and over | 597 (100.0%) | 444 (74.4%) |
| Total | 3,465 (23.0%) | 12,254 (81.4%) |
Disability Status by Sex by Age in Spring Creek
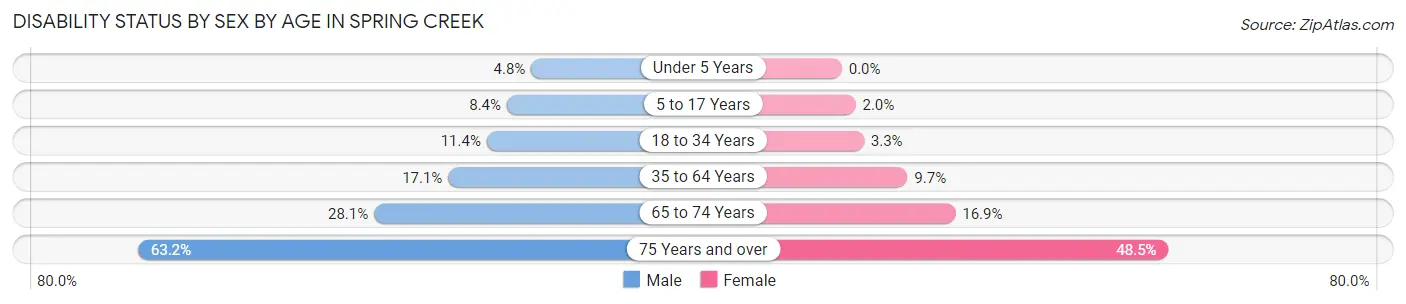
| Age Bracket | Male | Female |
| Under 5 Years | 28 (4.8%) | 0 (0.0%) |
| 5 to 17 Years | 154 (8.4%) | 30 (2.0%) |
| 18 to 34 Years | 173 (11.4%) | 57 (3.3%) |
| 35 to 64 Years | 497 (17.1%) | 261 (9.7%) |
| 65 to 74 Years | 210 (28.1%) | 78 (16.9%) |
| 75 Years and over | 187 (63.2%) | 146 (48.5%) |
Disability Class by Sex by Age in Spring Creek
Disability Class: Hearing Difficulty
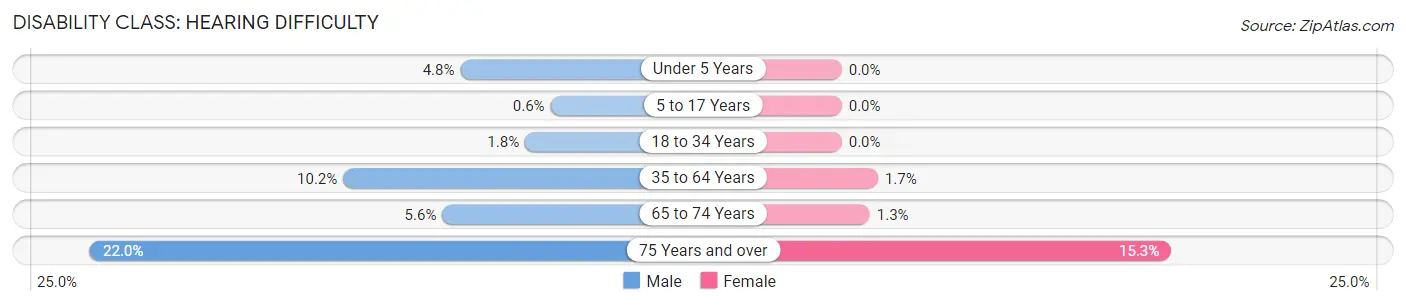
| Age Bracket | Male | Female |
| Under 5 Years | 28 (4.8%) | 0 (0.0%) |
| 5 to 17 Years | 11 (0.6%) | 0 (0.0%) |
| 18 to 34 Years | 27 (1.8%) | 0 (0.0%) |
| 35 to 64 Years | 297 (10.2%) | 45 (1.7%) |
| 65 to 74 Years | 42 (5.6%) | 6 (1.3%) |
| 75 Years and over | 65 (22.0%) | 46 (15.3%) |
Disability Class: Vision Difficulty
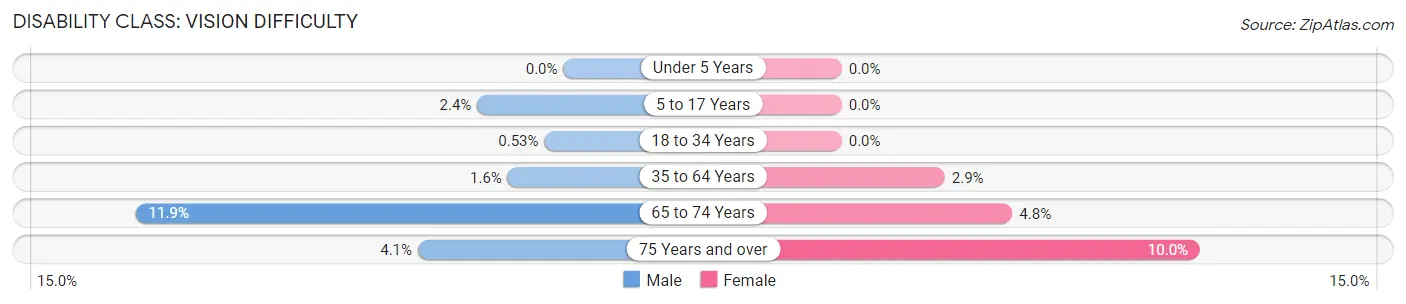
| Age Bracket | Male | Female |
| Under 5 Years | 0 (0.0%) | 0 (0.0%) |
| 5 to 17 Years | 44 (2.4%) | 0 (0.0%) |
| 18 to 34 Years | 8 (0.5%) | 0 (0.0%) |
| 35 to 64 Years | 45 (1.5%) | 77 (2.9%) |
| 65 to 74 Years | 89 (11.9%) | 22 (4.8%) |
| 75 Years and over | 12 (4.1%) | 30 (10.0%) |
Disability Class: Cognitive Difficulty
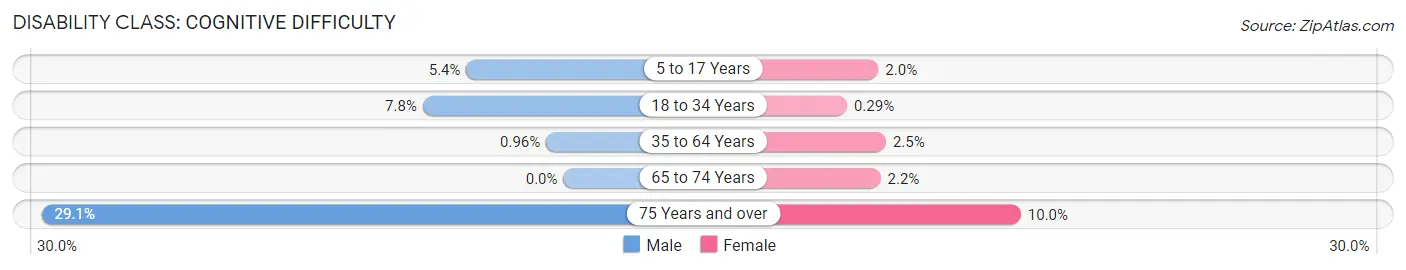
| Age Bracket | Male | Female |
| 5 to 17 Years | 99 (5.4%) | 30 (2.0%) |
| 18 to 34 Years | 119 (7.8%) | 5 (0.3%) |
| 35 to 64 Years | 28 (1.0%) | 66 (2.5%) |
| 65 to 74 Years | 0 (0.0%) | 10 (2.2%) |
| 75 Years and over | 86 (29.0%) | 30 (10.0%) |
Disability Class: Ambulatory Difficulty
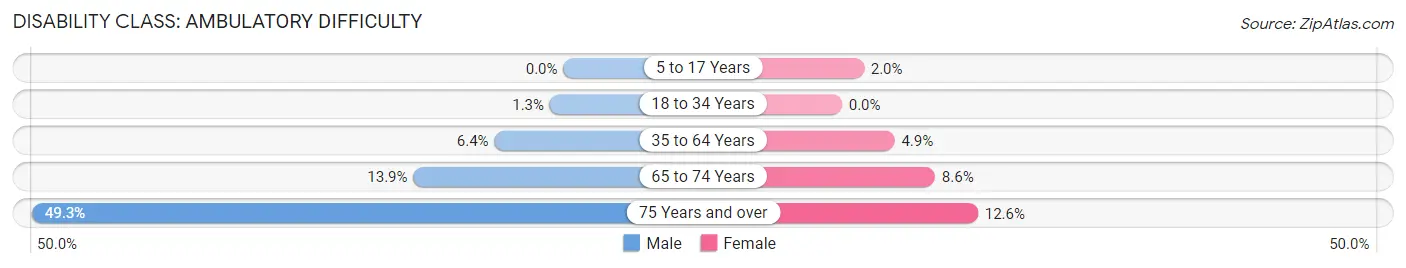
| Age Bracket | Male | Female |
| 5 to 17 Years | 0 (0.0%) | 30 (2.0%) |
| 18 to 34 Years | 19 (1.3%) | 0 (0.0%) |
| 35 to 64 Years | 186 (6.4%) | 131 (4.9%) |
| 65 to 74 Years | 104 (13.9%) | 40 (8.6%) |
| 75 Years and over | 146 (49.3%) | 38 (12.6%) |
Disability Class: Self-Care Difficulty
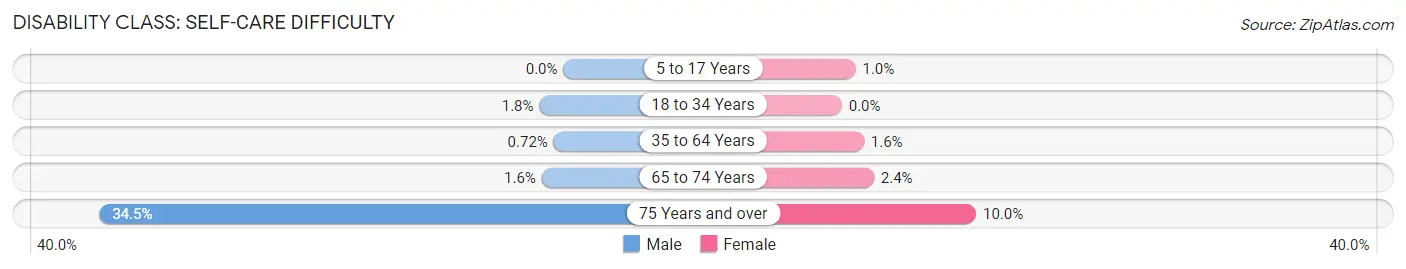
| Age Bracket | Male | Female |
| 5 to 17 Years | 0 (0.0%) | 15 (1.0%) |
| 18 to 34 Years | 27 (1.8%) | 0 (0.0%) |
| 35 to 64 Years | 21 (0.7%) | 44 (1.6%) |
| 65 to 74 Years | 12 (1.6%) | 11 (2.4%) |
| 75 Years and over | 102 (34.5%) | 30 (10.0%) |
Technology Access in Spring Creek
Computing Device Access in Spring Creek
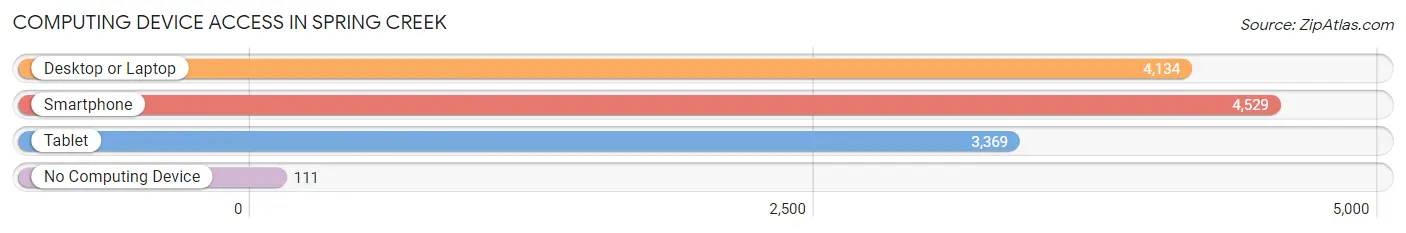
| Device Type | # Households | % Households |
| Desktop or Laptop | 4,134 | 85.2% |
| Smartphone | 4,529 | 93.4% |
| Tablet | 3,369 | 69.5% |
| No Computing Device | 111 | 2.3% |
| Total | 4,851 | 100.0% |
Internet Access in Spring Creek
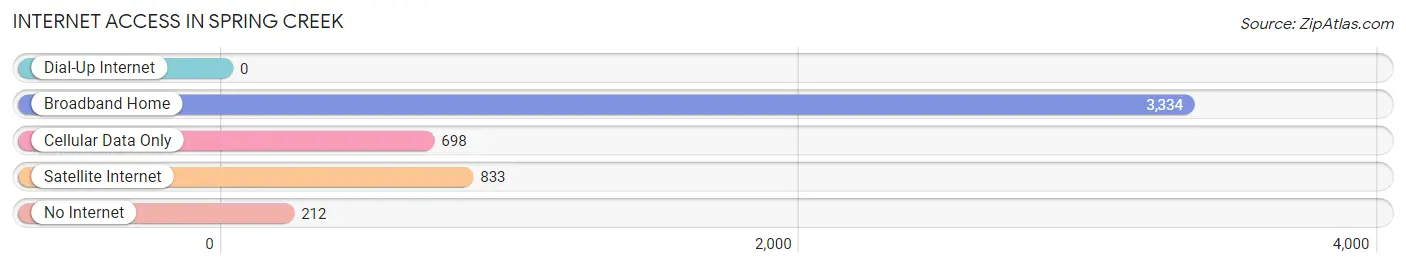
| Internet Type | # Households | % Households |
| Dial-Up Internet | 0 | 0.0% |
| Broadband Home | 3,334 | 68.7% |
| Cellular Data Only | 698 | 14.4% |
| Satellite Internet | 833 | 17.2% |
| No Internet | 212 | 4.4% |
| Total | 4,851 | 100.0% |
Spring Creek Summary
Introduction
Spring Creek is a small town located in Elko County, Nevada. It is situated in the northeastern part of the state, about 25 miles south of the Idaho border. The town was founded in 1868 and is the largest town in Elko County. It is home to a population of approximately 8,000 people.
History
The area that is now Spring Creek was originally inhabited by the Shoshone and Paiute Native American tribes. The first settlers in the area were miners who arrived in the late 1860s. The town was officially founded in 1868 and was named after the nearby creek.
In the early 1900s, the town began to grow and develop. The first school was built in 1910 and the first post office was established in 1911. The town was incorporated in 1912 and the first mayor was elected in 1913.
The town continued to grow and develop throughout the 20th century. In the 1950s, the town was home to a large military base, which provided jobs and economic stability to the area. The base was closed in the 1990s, but the town has continued to grow and develop.
Geography
Spring Creek is located in the northeastern part of Nevada, about 25 miles south of the Idaho border. The town is situated in the Humboldt River Valley, which is surrounded by the Ruby Mountains to the east and the East Humboldt Range to the west. The town is located at an elevation of 5,000 feet above sea level.
The climate in Spring Creek is semi-arid, with hot summers and cold winters. The average annual temperature is around 50 degrees Fahrenheit. The average annual precipitation is around 8 inches.
Economy
The economy of Spring Creek is largely based on agriculture and mining. The town is home to several large farms and ranches, which produce a variety of crops and livestock. The town is also home to several large mining operations, which produce gold, silver, and other minerals.
The town is also home to several small businesses, including restaurants, retail stores, and other services. The town is also home to a large casino, which provides jobs and entertainment to the area.
Demographics
As of the 2010 census, the population of Spring Creek was 8,000. The racial makeup of the town was 90.3% White, 0.7% African American, 0.7% Native American, 0.7% Asian, 0.3% Pacific Islander, and 6.7% from other races. The median household income was $41,000 and the median family income was $48,000.
Conclusion
Spring Creek is a small town located in Elko County, Nevada. It is situated in the northeastern part of the state, about 25 miles south of the Idaho border. The town was founded in 1868 and is the largest town in Elko County. It is home to a population of approximately 8,000 people. The economy of Spring Creek is largely based on agriculture and mining. The town is also home to several small businesses, including restaurants, retail stores, and other services. The town is also home to a large casino, which provides jobs and entertainment to the area. As of the 2010 census, the population of Spring Creek was 8,000. The racial makeup of the town was 90.3% White, 0.7% African American, 0.7% Native American, 0.7% Asian, 0.3% Pacific Islander, and 6.7% from other races. The median household income was $41,000 and the median family income was $48,000.
Common Questions
What is Per Capita Income in Spring Creek?
Per Capita income in Spring Creek is $42,837.
What is the Median Family Income in Spring Creek?
Median Family Income in Spring Creek is $118,899.
What is the Median Household income in Spring Creek?
Median Household Income in Spring Creek is $109,952.
What is Income or Wage Gap in Spring Creek?
Income or Wage Gap in Spring Creek is 54.8%.
Women in Spring Creek earn 45.2 cents for every dollar earned by a man.
What is Family Income Deficit in Spring Creek?
Family Income Deficit in Spring Creek is $6,777.
Families that are below poverty line in Spring Creek earn $6,777 less on average than the poverty threshold level.
What is Inequality or Gini Index in Spring Creek?
Inequality or Gini Index in Spring Creek is 0.36.
What is the Total Population of Spring Creek?
Total Population of Spring Creek is 15,062.
What is the Total Male Population of Spring Creek?
Total Male Population of Spring Creek is 7,890.
What is the Total Female Population of Spring Creek?
Total Female Population of Spring Creek is 7,172.
What is the Ratio of Males per 100 Females in Spring Creek?
There are 110.01 Males per 100 Females in Spring Creek.
What is the Ratio of Females per 100 Males in Spring Creek?
There are 90.90 Females per 100 Males in Spring Creek.
What is the Median Population Age in Spring Creek?
Median Population Age in Spring Creek is 34.4 Years.
What is the Average Family Size in Spring Creek
Average Family Size in Spring Creek is 3.6 People.
What is the Average Household Size in Spring Creek
Average Household Size in Spring Creek is 3.1 People.
How Large is the Labor Force in Spring Creek?
There are 7,468 People in the Labor Forcein in Spring Creek.
What is the Percentage of People in the Labor Force in Spring Creek?
66.1% of People are in the Labor Force in Spring Creek.
What is the Unemployment Rate in Spring Creek?
Unemployment Rate in Spring Creek is 3.7%.