Panaca, NV Map & Demographics
Panaca Map
Panaca Overview
$30,902
PER CAPITA INCOME
$92,500
AVG FAMILY INCOME
$68,073
AVG HOUSEHOLD INCOME
55.1%
WAGE / INCOME GAP [ % ]
44.9¢/ $1
WAGE / INCOME GAP [ $ ]
0.41
INEQUALITY / GINI INDEX
1,039
TOTAL POPULATION
446
MALE POPULATION
593
FEMALE POPULATION
75.21
MALES / 100 FEMALES
132.96
FEMALES / 100 MALES
34.3
MEDIAN AGE
3.5
AVG FAMILY SIZE
3.0
AVG HOUSEHOLD SIZE
343
LABOR FORCE [ PEOPLE ]
48.2%
PERCENT IN LABOR FORCE
Panaca Zip Codes
Panaca Area Codes
Income in Panaca
Income Overview in Panaca
Per Capita Income in Panaca is $30,902, while median incomes of families and households are $92,500 and $68,073 respectively.
| Characteristic | Number | Measure |
| Per Capita Income | 1,039 | $30,902 |
| Median Family Income | 258 | $92,500 |
| Mean Family Income | 258 | $105,345 |
| Median Household Income | 349 | $68,073 |
| Mean Household Income | 349 | $88,262 |
| Income Deficit | 258 | $0 |
| Wage / Income Gap (%) | 1,039 | 55.12% |
| Wage / Income Gap ($) | 1,039 | 44.88¢ per $1 |
| Gini / Inequality Index | 1,039 | 0.41 |
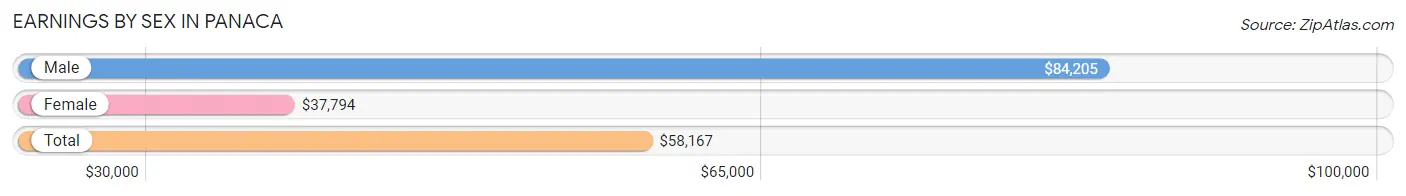
Earnings by Sex in Panaca
Average Earnings in Panaca are $58,167, $84,205 for men and $37,794 for women, a difference of 55.1%.
| Sex | Number | Average Earnings |
| Male | 228 (59.4%) | $84,205 |
| Female | 156 (40.6%) | $37,794 |
| Total | 384 (100.0%) | $58,167 |
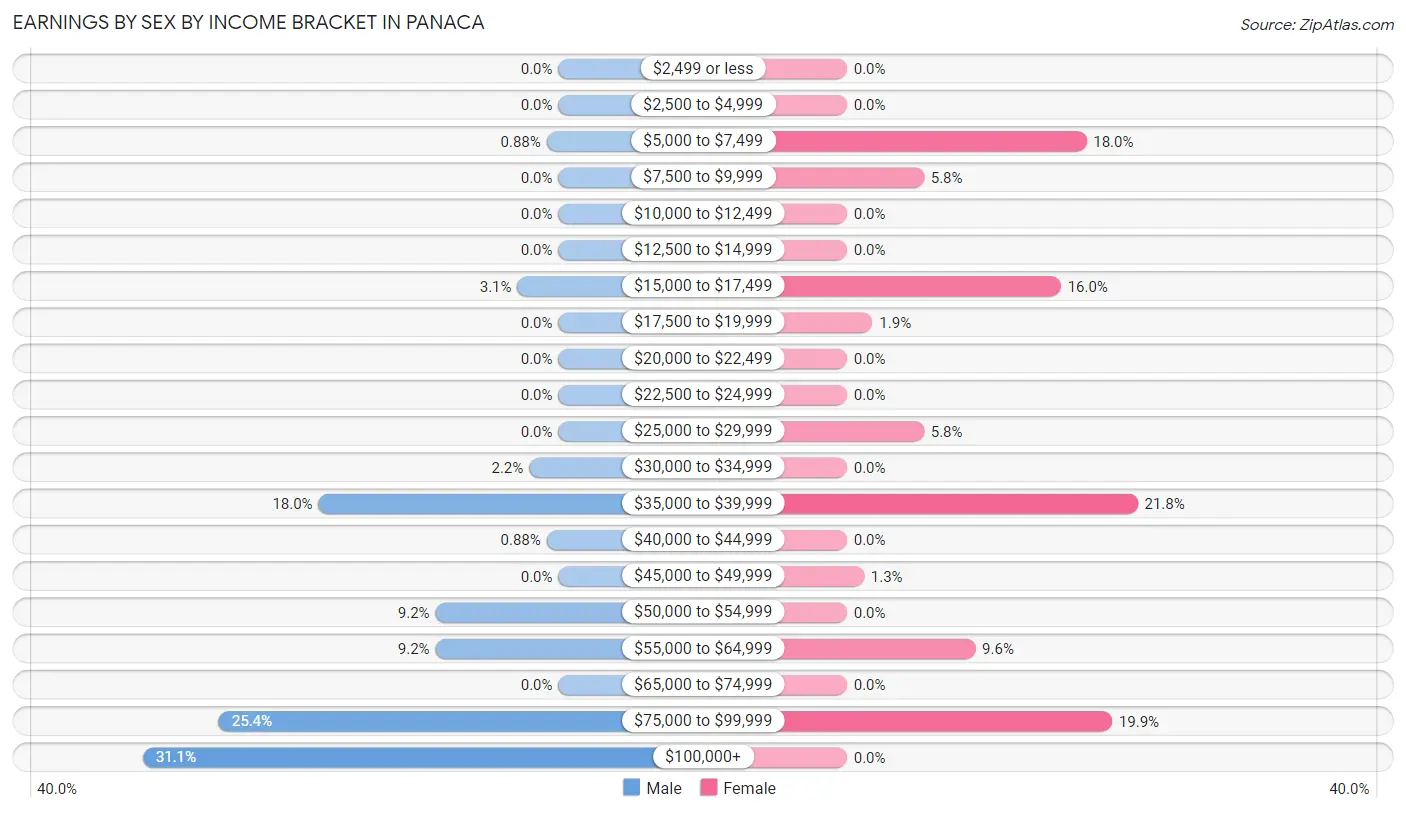
Earnings by Sex by Income Bracket in Panaca
The most common earnings brackets in Panaca are $100,000+ for men (71 | 31.1%) and $35,000 to $39,999 for women (34 | 21.8%).
| Income | Male | Female |
| $2,499 or less | 0 (0.0%) | 0 (0.0%) |
| $2,500 to $4,999 | 0 (0.0%) | 0 (0.0%) |
| $5,000 to $7,499 | 2 (0.9%) | 28 (17.9%) |
| $7,500 to $9,999 | 0 (0.0%) | 9 (5.8%) |
| $10,000 to $12,499 | 0 (0.0%) | 0 (0.0%) |
| $12,500 to $14,999 | 0 (0.0%) | 0 (0.0%) |
| $15,000 to $17,499 | 7 (3.1%) | 25 (16.0%) |
| $17,500 to $19,999 | 0 (0.0%) | 3 (1.9%) |
| $20,000 to $22,499 | 0 (0.0%) | 0 (0.0%) |
| $22,500 to $24,999 | 0 (0.0%) | 0 (0.0%) |
| $25,000 to $29,999 | 0 (0.0%) | 9 (5.8%) |
| $30,000 to $34,999 | 5 (2.2%) | 0 (0.0%) |
| $35,000 to $39,999 | 41 (18.0%) | 34 (21.8%) |
| $40,000 to $44,999 | 2 (0.9%) | 0 (0.0%) |
| $45,000 to $49,999 | 0 (0.0%) | 2 (1.3%) |
| $50,000 to $54,999 | 21 (9.2%) | 0 (0.0%) |
| $55,000 to $64,999 | 21 (9.2%) | 15 (9.6%) |
| $65,000 to $74,999 | 0 (0.0%) | 0 (0.0%) |
| $75,000 to $99,999 | 58 (25.4%) | 31 (19.9%) |
| $100,000+ | 71 (31.1%) | 0 (0.0%) |
| Total | 228 (100.0%) | 156 (100.0%) |
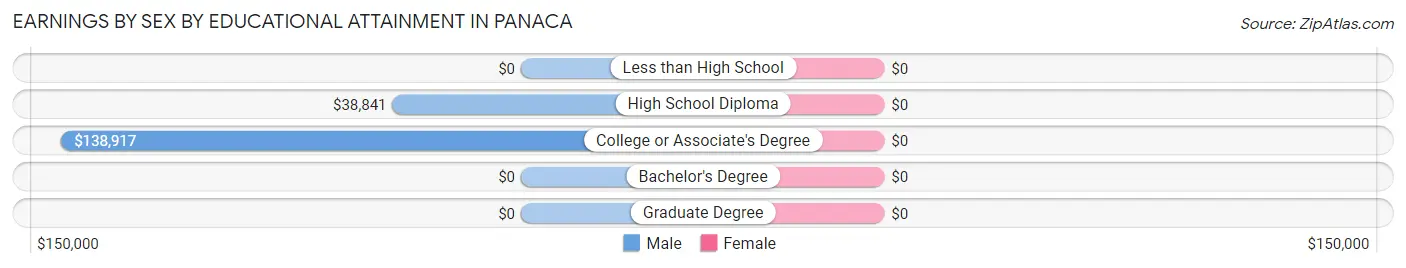
Earnings by Sex by Educational Attainment in Panaca
| Educational Attainment | Male Income | Female Income |
| Less than High School | - | - |
| High School Diploma | $38,841 | $0 |
| College or Associate's Degree | $138,917 | $0 |
| Bachelor's Degree | - | - |
| Graduate Degree | - | - |
| Total | $84,205 | $39,154 |
Family Income in Panaca
Family Income Brackets in Panaca
According to the Panaca family income data, there are 52 families falling into the $50,000 to $74,999 income range, which is the most common income bracket and makes up 20.2% of all families.
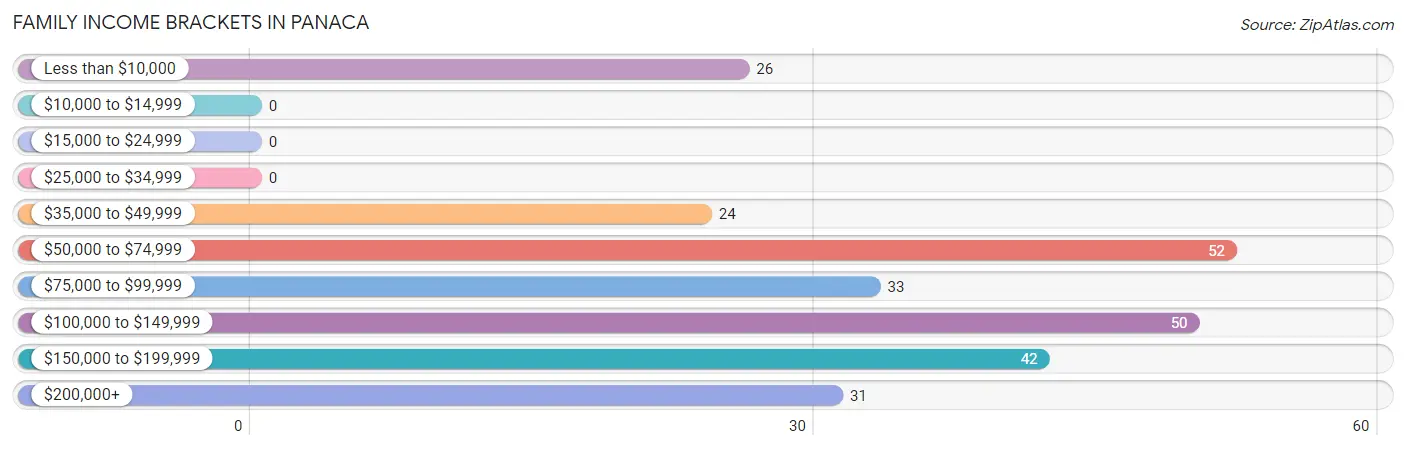
| Income Bracket | # Families | % Families |
| Less than $10,000 | 26 | 10.1% |
| $10,000 to $14,999 | 0 | 0.0% |
| $15,000 to $24,999 | 0 | 0.0% |
| $25,000 to $34,999 | 0 | 0.0% |
| $35,000 to $49,999 | 24 | 9.3% |
| $50,000 to $74,999 | 52 | 20.2% |
| $75,000 to $99,999 | 33 | 12.8% |
| $100,000 to $149,999 | 50 | 19.4% |
| $150,000 to $199,999 | 42 | 16.3% |
| $200,000+ | 31 | 12.0% |
Family Income by Famaliy Size in Panaca
4-person families (69 | 26.7%) account for the highest median family income in Panaca with $110,750 per family, while 2-person families (113 | 43.8%) have the highest median income of $34,088 per family member.
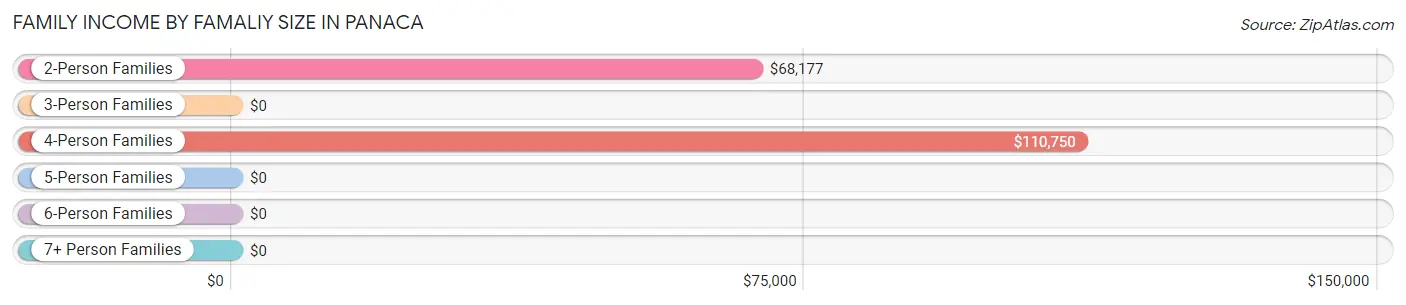
| Income Bracket | # Families | Median Income |
| 2-Person Families | 113 (43.8%) | $68,177 |
| 3-Person Families | 24 (9.3%) | $0 |
| 4-Person Families | 69 (26.7%) | $110,750 |
| 5-Person Families | 3 (1.2%) | $0 |
| 6-Person Families | 0 (0.0%) | $0 |
| 7+ Person Families | 49 (19.0%) | $0 |
| Total | 258 (100.0%) | $92,500 |
Family Income by Number of Earners in Panaca
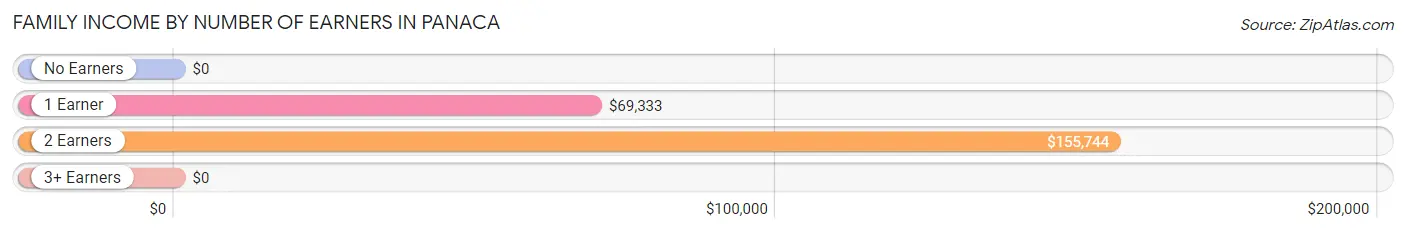
| Number of Earners | # Families | Median Income |
| No Earners | 60 (23.3%) | $0 |
| 1 Earner | 82 (31.8%) | $69,333 |
| 2 Earners | 87 (33.7%) | $155,744 |
| 3+ Earners | 29 (11.2%) | $0 |
| Total | 258 (100.0%) | $92,500 |
Household Income in Panaca
Household Income Brackets in Panaca
With 71 households falling in the category, the $50,000 to $74,999 income range is the most frequent in Panaca, accounting for 20.3% of all households.
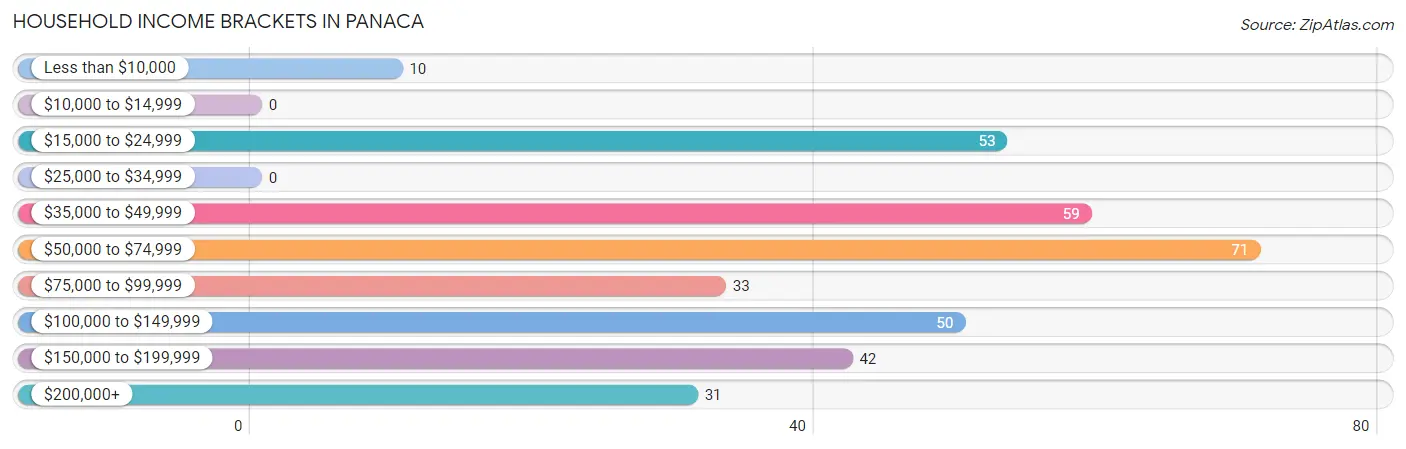
| Income Bracket | # Households | % Households |
| Less than $10,000 | 10 | 2.9% |
| $10,000 to $14,999 | 0 | 0.0% |
| $15,000 to $24,999 | 53 | 15.2% |
| $25,000 to $34,999 | 0 | 0.0% |
| $35,000 to $49,999 | 59 | 16.9% |
| $50,000 to $74,999 | 71 | 20.3% |
| $75,000 to $99,999 | 33 | 9.5% |
| $100,000 to $149,999 | 50 | 14.3% |
| $150,000 to $199,999 | 42 | 12.0% |
| $200,000+ | 31 | 8.9% |
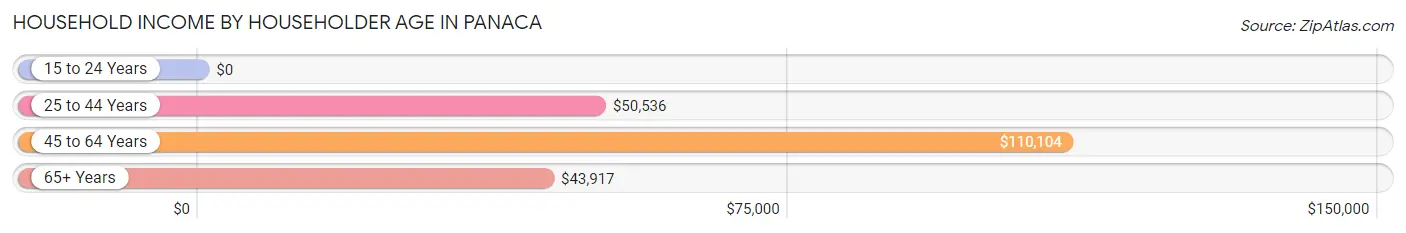
Household Income by Householder Age in Panaca
The median household income in Panaca is $68,073, with the highest median household income of $110,104 found in the 45 to 64 years age bracket for the primary householder. A total of 169 households (48.4%) fall into this category.
| Income Bracket | # Households | Median Income |
| 15 to 24 Years | 0 (0.0%) | $0 |
| 25 to 44 Years | 79 (22.6%) | $50,536 |
| 45 to 64 Years | 169 (48.4%) | $110,104 |
| 65+ Years | 101 (28.9%) | $43,917 |
| Total | 349 (100.0%) | $68,073 |
Poverty in Panaca
Income Below Poverty by Sex and Age in Panaca
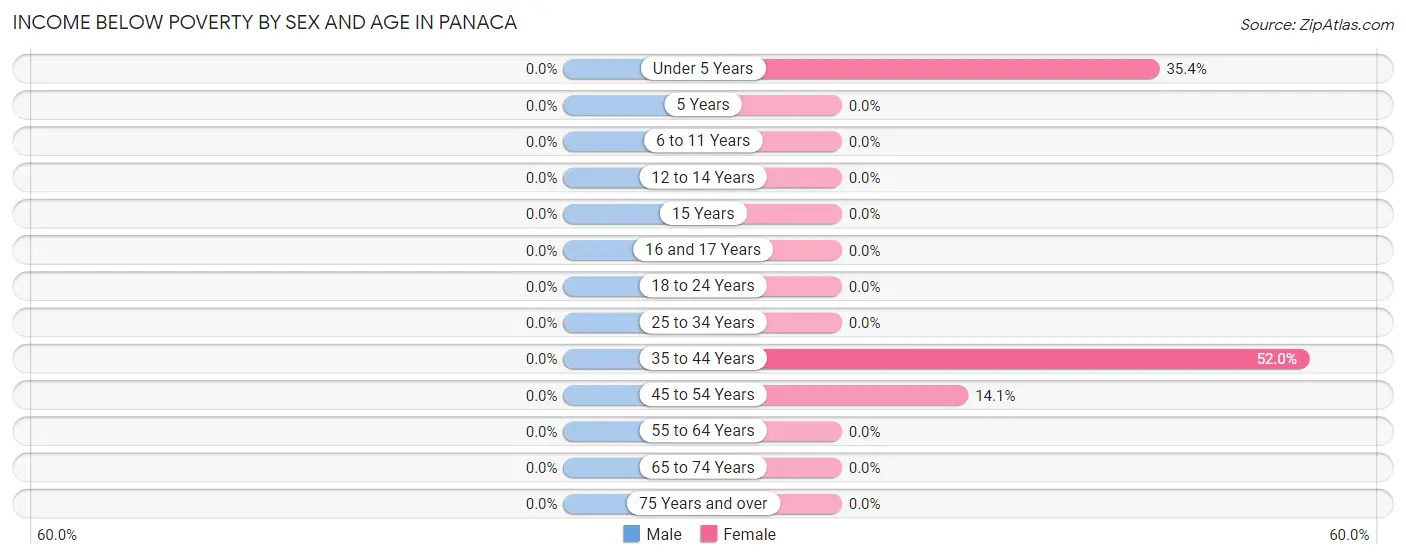
| Age Bracket | Male | Female |
| Under 5 Years | 0 (0.0%) | 23 (35.4%) |
| 5 Years | 0 (0.0%) | 0 (0.0%) |
| 6 to 11 Years | 0 (0.0%) | 0 (0.0%) |
| 12 to 14 Years | 0 (0.0%) | 0 (0.0%) |
| 15 Years | 0 (0.0%) | 0 (0.0%) |
| 16 and 17 Years | 0 (0.0%) | 0 (0.0%) |
| 18 to 24 Years | 0 (0.0%) | 0 (0.0%) |
| 25 to 34 Years | 0 (0.0%) | 0 (0.0%) |
| 35 to 44 Years | 0 (0.0%) | 26 (52.0%) |
| 45 to 54 Years | 0 (0.0%) | 10 (14.1%) |
| 55 to 64 Years | 0 (0.0%) | 0 (0.0%) |
| 65 to 74 Years | 0 (0.0%) | 0 (0.0%) |
| 75 Years and over | 0 (0.0%) | 0 (0.0%) |
| Total | 0 (0.0%) | 59 (10.0%) |
Income Above Poverty by Sex and Age in Panaca
According to the poverty statistics in Panaca, males aged under 5 years and females aged 6 to 11 years are the age groups that are most secure financially, with 100.0% of males and 100.0% of females in these age groups living above the poverty line.
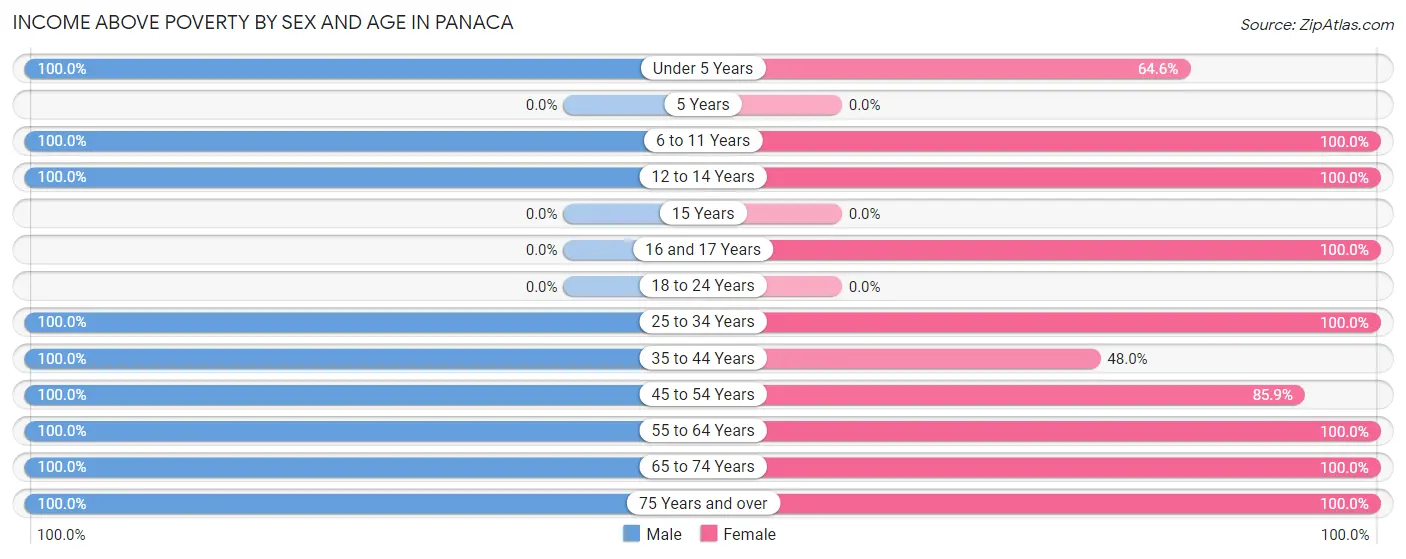
| Age Bracket | Male | Female |
| Under 5 Years | 59 (100.0%) | 42 (64.6%) |
| 5 Years | 0 (0.0%) | 0 (0.0%) |
| 6 to 11 Years | 83 (100.0%) | 69 (100.0%) |
| 12 to 14 Years | 17 (100.0%) | 34 (100.0%) |
| 15 Years | 0 (0.0%) | 0 (0.0%) |
| 16 and 17 Years | 0 (0.0%) | 49 (100.0%) |
| 18 to 24 Years | 0 (0.0%) | 0 (0.0%) |
| 25 to 34 Years | 52 (100.0%) | 112 (100.0%) |
| 35 to 44 Years | 47 (100.0%) | 24 (48.0%) |
| 45 to 54 Years | 87 (100.0%) | 61 (85.9%) |
| 55 to 64 Years | 39 (100.0%) | 48 (100.0%) |
| 65 to 74 Years | 34 (100.0%) | 47 (100.0%) |
| 75 Years and over | 28 (100.0%) | 48 (100.0%) |
| Total | 446 (100.0%) | 534 (90.0%) |
Income Below Poverty Among Married-Couple Families in Panaca
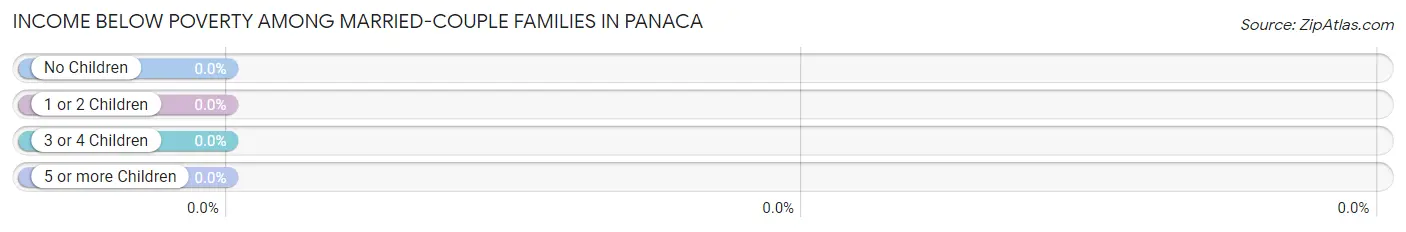
| Children | Above Poverty | Below Poverty |
| No Children | 97 (100.0%) | 0 (0.0%) |
| 1 or 2 Children | 83 (100.0%) | 0 (0.0%) |
| 3 or 4 Children | 3 (100.0%) | 0 (0.0%) |
| 5 or more Children | 49 (100.0%) | 0 (0.0%) |
| Total | 232 (100.0%) | 0 (0.0%) |
Income Below Poverty Among Single-Parent Households in Panaca
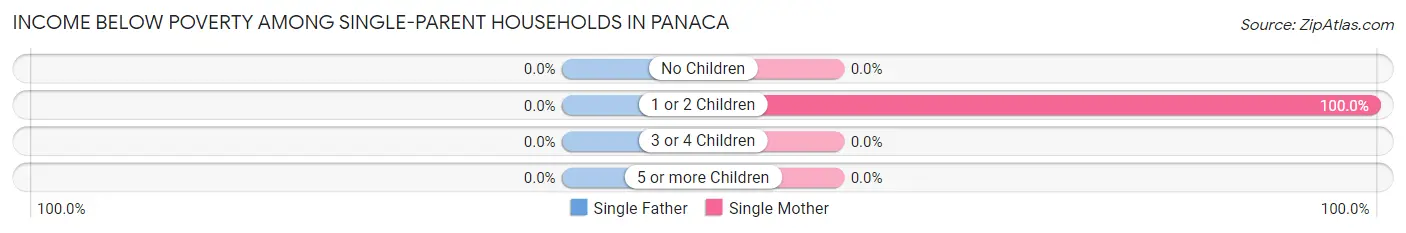
| Children | Single Father | Single Mother |
| No Children | 0 (0.0%) | 0 (0.0%) |
| 1 or 2 Children | 0 (0.0%) | 26 (100.0%) |
| 3 or 4 Children | 0 (0.0%) | 0 (0.0%) |
| 5 or more Children | 0 (0.0%) | 0 (0.0%) |
| Total | 0 (0.0%) | 26 (100.0%) |
Income Below Poverty Among Married-Couple vs Single-Parent Households in Panaca
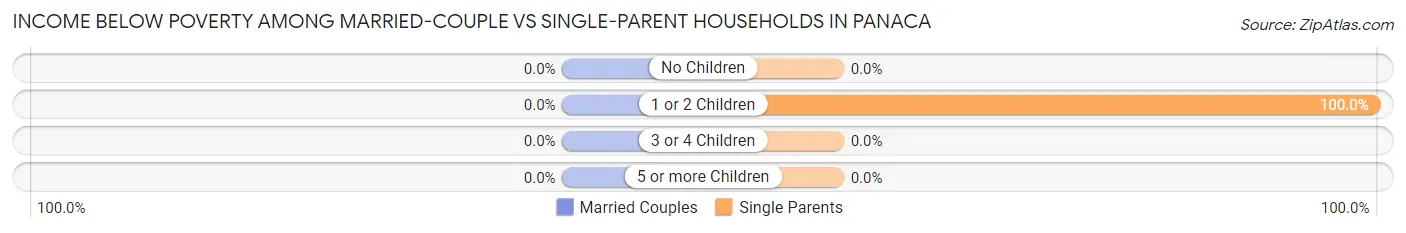
| Children | Married-Couple Families | Single-Parent Households |
| No Children | 0 (0.0%) | 0 (0.0%) |
| 1 or 2 Children | 0 (0.0%) | 26 (100.0%) |
| 3 or 4 Children | 0 (0.0%) | 0 (0.0%) |
| 5 or more Children | 0 (0.0%) | 0 (0.0%) |
| Total | 0 (0.0%) | 26 (100.0%) |
Race in Panaca
The most populous races in Panaca are White / Caucasian (956 | 92.0%), Native / Alaskan (50 | 4.8%), and Two or more Races (33 | 3.2%).
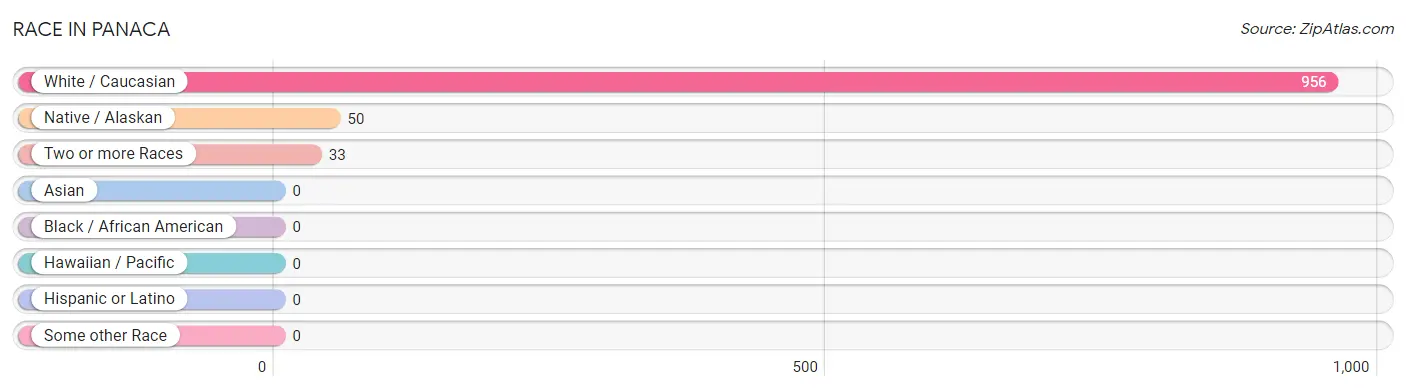
| Race | # Population | % Population |
| Asian | 0 | 0.0% |
| Black / African American | 0 | 0.0% |
| Hawaiian / Pacific | 0 | 0.0% |
| Hispanic or Latino | 0 | 0.0% |
| Native / Alaskan | 50 | 4.8% |
| White / Caucasian | 956 | 92.0% |
| Two or more Races | 33 | 3.2% |
| Some other Race | 0 | 0.0% |
| Total | 1,039 | 100.0% |
Ancestry in Panaca
The most populous ancestries reported in Panaca are Irish (244 | 23.5%), English (193 | 18.6%), German (104 | 10.0%), Italian (93 | 8.9%), and Danish (76 | 7.3%), together accounting for 68.3% of all Panaca residents.
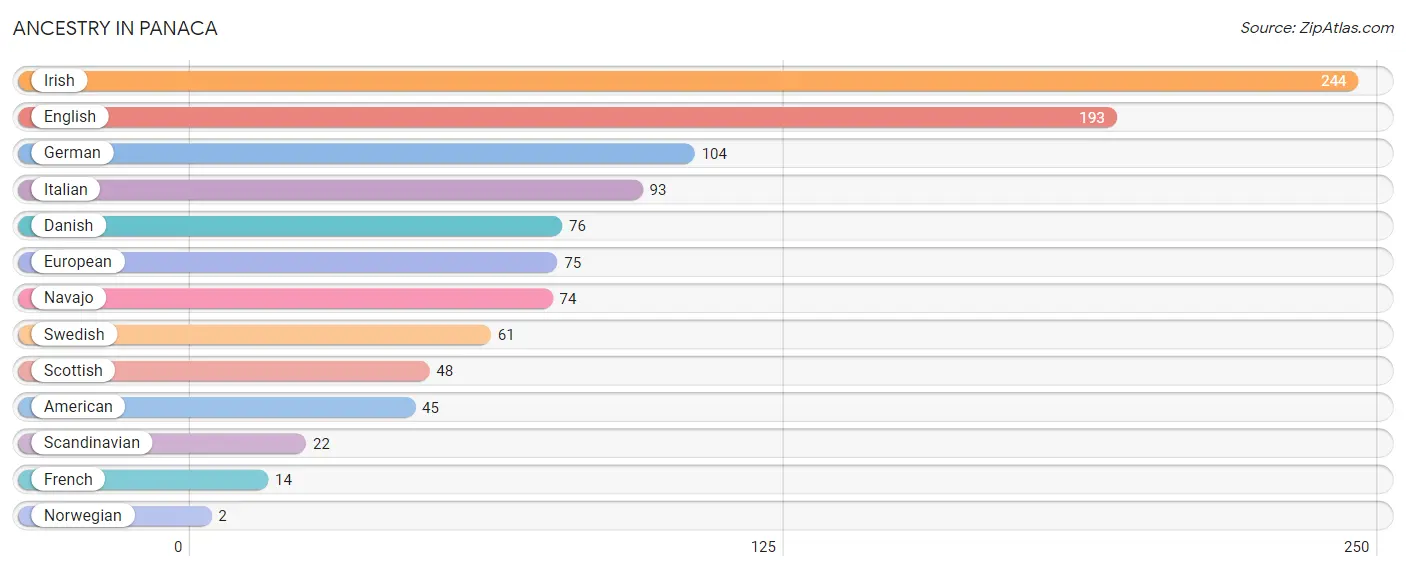
| Ancestry | # Population | % Population |
| American | 45 | 4.3% |
| Danish | 76 | 7.3% |
| English | 193 | 18.6% |
| European | 75 | 7.2% |
| French | 14 | 1.3% |
| German | 104 | 10.0% |
| Irish | 244 | 23.5% |
| Italian | 93 | 8.9% |
| Navajo | 74 | 7.1% |
| Norwegian | 2 | 0.2% |
| Scandinavian | 22 | 2.1% |
| Scottish | 48 | 4.6% |
| Swedish | 61 | 5.9% | View All 13 Rows |
Immigrants in Panaca

| Immigration Origin | # Population | % Population | View All 0 Rows |
Sex and Age in Panaca
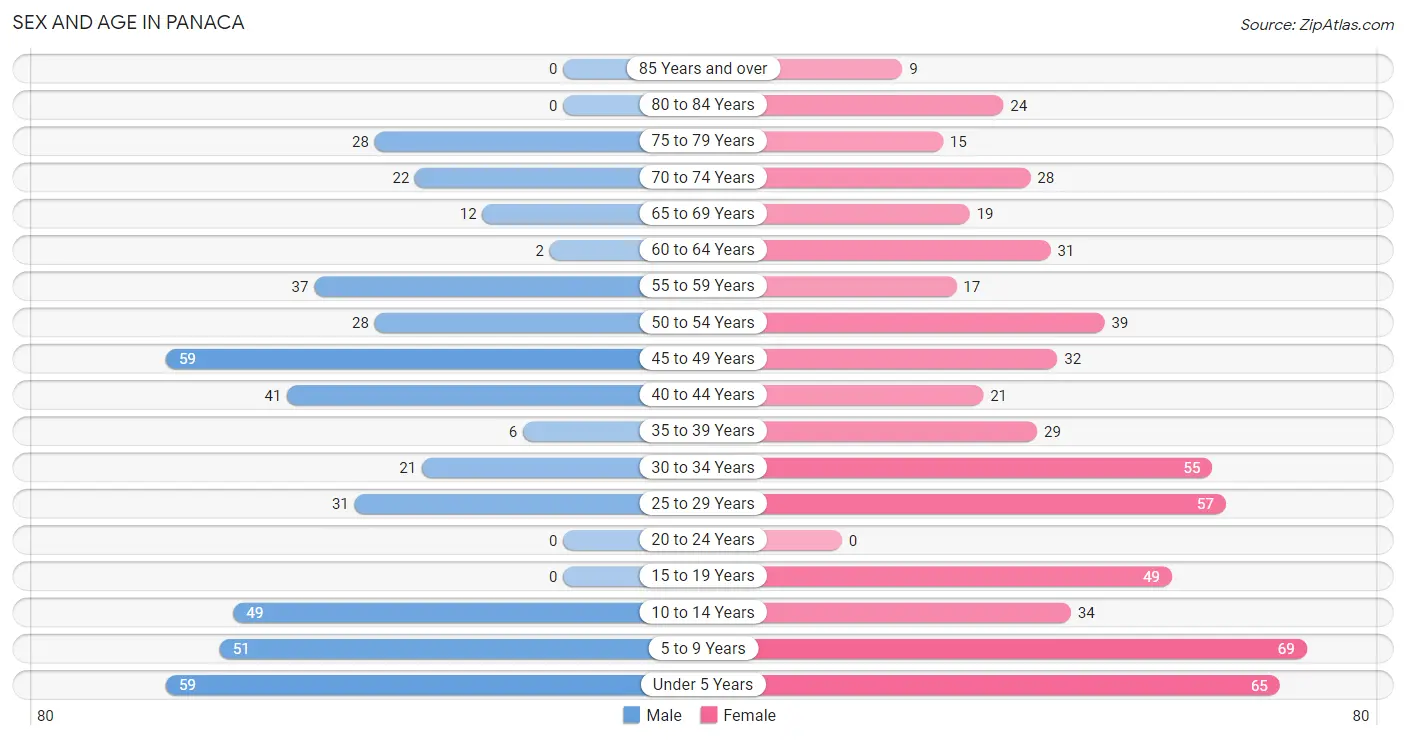
Sex and Age in Panaca
The most populous age groups in Panaca are Under 5 Years (59 | 13.2%) for men and 5 to 9 Years (69 | 11.6%) for women.
| Age Bracket | Male | Female |
| Under 5 Years | 59 (13.2%) | 65 (11.0%) |
| 5 to 9 Years | 51 (11.4%) | 69 (11.6%) |
| 10 to 14 Years | 49 (11.0%) | 34 (5.7%) |
| 15 to 19 Years | 0 (0.0%) | 49 (8.3%) |
| 20 to 24 Years | 0 (0.0%) | 0 (0.0%) |
| 25 to 29 Years | 31 (7.0%) | 57 (9.6%) |
| 30 to 34 Years | 21 (4.7%) | 55 (9.3%) |
| 35 to 39 Years | 6 (1.3%) | 29 (4.9%) |
| 40 to 44 Years | 41 (9.2%) | 21 (3.5%) |
| 45 to 49 Years | 59 (13.2%) | 32 (5.4%) |
| 50 to 54 Years | 28 (6.3%) | 39 (6.6%) |
| 55 to 59 Years | 37 (8.3%) | 17 (2.9%) |
| 60 to 64 Years | 2 (0.4%) | 31 (5.2%) |
| 65 to 69 Years | 12 (2.7%) | 19 (3.2%) |
| 70 to 74 Years | 22 (4.9%) | 28 (4.7%) |
| 75 to 79 Years | 28 (6.3%) | 15 (2.5%) |
| 80 to 84 Years | 0 (0.0%) | 24 (4.1%) |
| 85 Years and over | 0 (0.0%) | 9 (1.5%) |
| Total | 446 (100.0%) | 593 (100.0%) |
Families and Households in Panaca
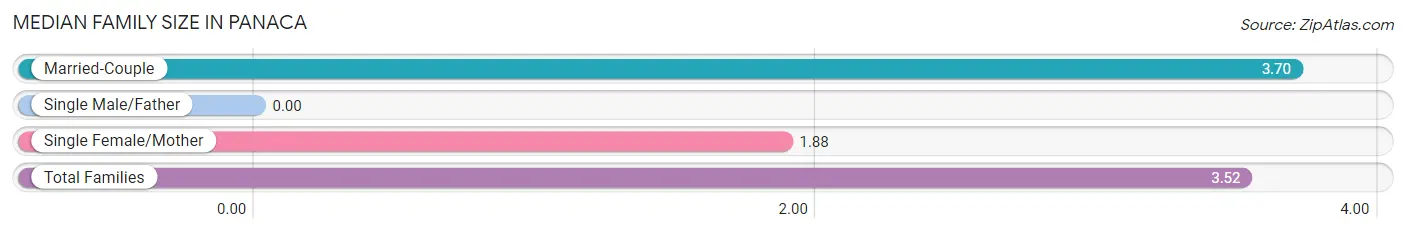
Median Family Size in Panaca
| Family Type | # Families | Family Size |
| Married-Couple | 232 (89.9%) | 3.70 |
| Single Male/Father | 0 (0.0%) | - |
| Single Female/Mother | 26 (10.1%) | 1.88 |
| Total Families | 258 (100.0%) | 3.52 |
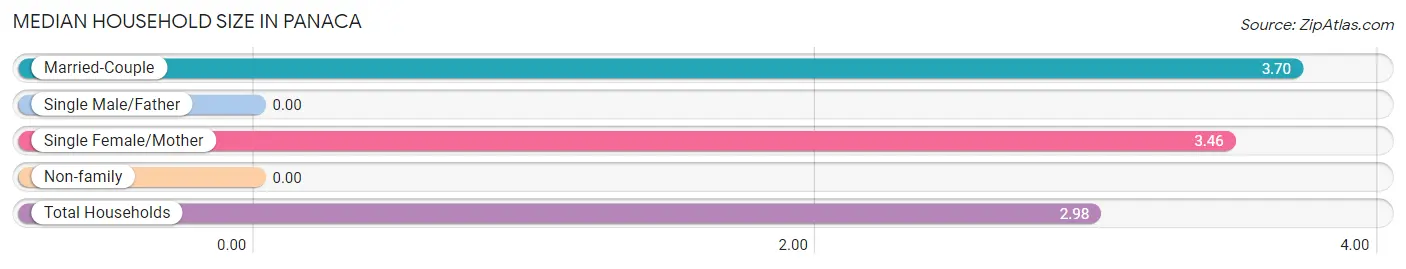
Median Household Size in Panaca
| Household Type | # Households | Household Size |
| Married-Couple | 232 (66.5%) | 3.70 |
| Single Male/Father | 0 (0.0%) | - |
| Single Female/Mother | 26 (7.4%) | 3.46 |
| Non-family | 91 (26.1%) | - |
| Total Households | 349 (100.0%) | 2.98 |
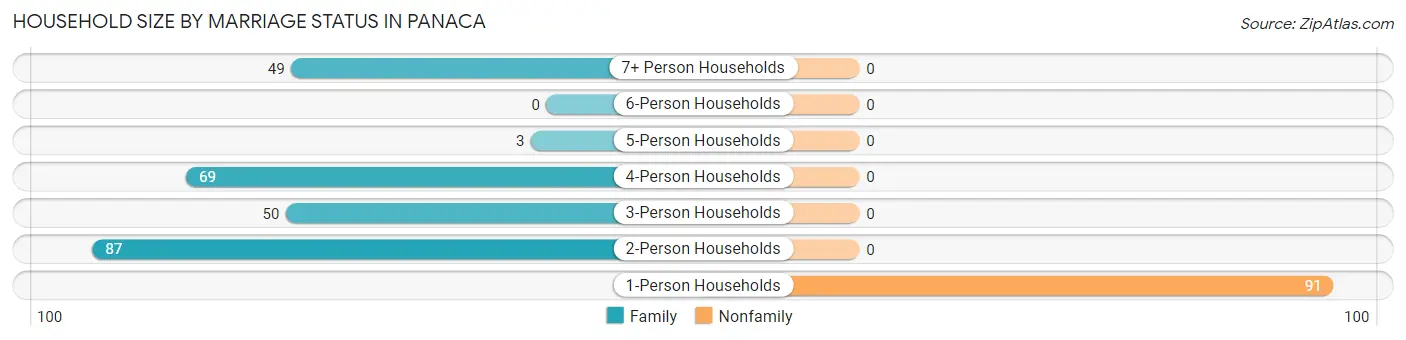
Household Size by Marriage Status in Panaca
Out of a total of 349 households in Panaca, 258 (73.9%) are family households, while 91 (26.1%) are nonfamily households. The most numerous type of family households are 2-person households, comprising 87, and the most common type of nonfamily households are 1-person households, comprising 91.
| Household Size | Family Households | Nonfamily Households |
| 1-Person Households | - | 91 (26.1%) |
| 2-Person Households | 87 (24.9%) | 0 (0.0%) |
| 3-Person Households | 50 (14.3%) | 0 (0.0%) |
| 4-Person Households | 69 (19.8%) | 0 (0.0%) |
| 5-Person Households | 3 (0.9%) | 0 (0.0%) |
| 6-Person Households | 0 (0.0%) | 0 (0.0%) |
| 7+ Person Households | 49 (14.0%) | 0 (0.0%) |
| Total | 258 (73.9%) | 91 (26.1%) |
Female Fertility in Panaca
Fertility by Age in Panaca
| Age Bracket | Women with Births | Births / 1,000 Women |
| 15 to 19 years | 0 (0.0%) | 0.0 |
| 20 to 34 years | 0 (0.0%) | 0.0 |
| 35 to 50 years | 0 (0.0%) | 0.0 |
| Total | 0 (0.0%) | 0.0 |
Fertility by Age by Marriage Status in Panaca
| Age Bracket | Married | Unmarried |
| 15 to 19 years | 0 (0.0%) | 0 (0.0%) |
| 20 to 34 years | 0 (0.0%) | 0 (0.0%) |
| 35 to 50 years | 0 (0.0%) | 0 (0.0%) |
| Total | 0 (0.0%) | 0 (0.0%) |
Fertility by Education in Panaca
| Educational Attainment | Women with Births | Births / 1,000 Women |
| Less than High School | 0 (0.0%) | 0.0 |
| High School Diploma | 0 (0.0%) | 0.0 |
| College or Associate's Degree | 0 (0.0%) | 0.0 |
| Bachelor's Degree | 0 (0.0%) | 0.0 |
| Graduate Degree | 0 (0.0%) | 0.0 |
| Total | 0 (0.0%) | 0.0 |
Fertility by Education by Marriage Status in Panaca
| Educational Attainment | Married | Unmarried |
| Less than High School | 0 (0.0%) | 0 (0.0%) |
| High School Diploma | 0 (0.0%) | 0 (0.0%) |
| College or Associate's Degree | 0 (0.0%) | 0 (0.0%) |
| Bachelor's Degree | 0 (0.0%) | 0 (0.0%) |
| Graduate Degree | 0 (0.0%) | 0 (0.0%) |
| Total | 0 (0.0%) | 0 (0.0%) |
Employment Characteristics in Panaca
Employment by Class of Employer in Panaca
Among the 343 employed individuals in Panaca, private company employees (203 | 59.2%), local government employees (80 | 23.3%), and state government employees (40 | 11.7%) make up the most common classes of employment.
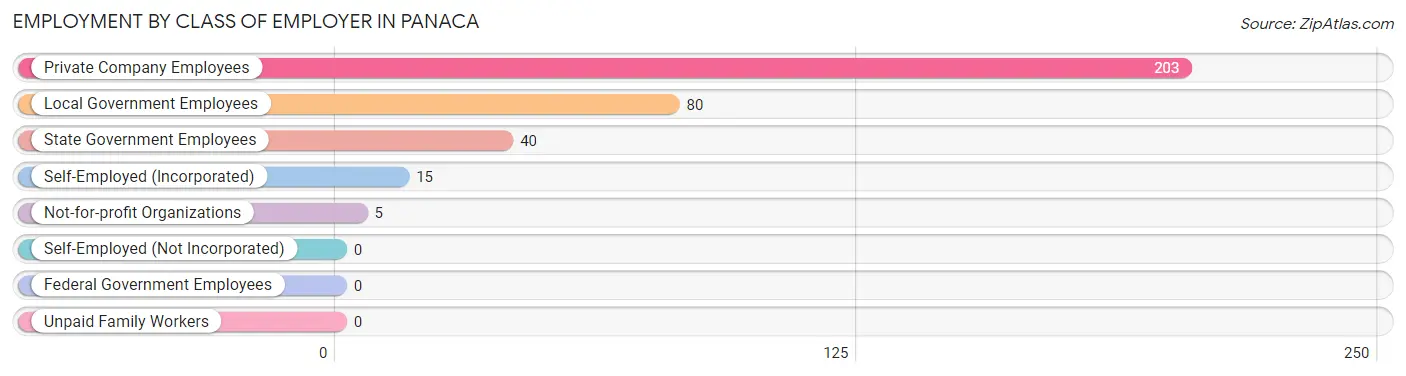
| Employer Class | # Employees | % Employees |
| Private Company Employees | 203 | 59.2% |
| Self-Employed (Incorporated) | 15 | 4.4% |
| Self-Employed (Not Incorporated) | 0 | 0.0% |
| Not-for-profit Organizations | 5 | 1.5% |
| Local Government Employees | 80 | 23.3% |
| State Government Employees | 40 | 11.7% |
| Federal Government Employees | 0 | 0.0% |
| Unpaid Family Workers | 0 | 0.0% |
| Total | 343 | 100.0% |
Employment Status by Age in Panaca
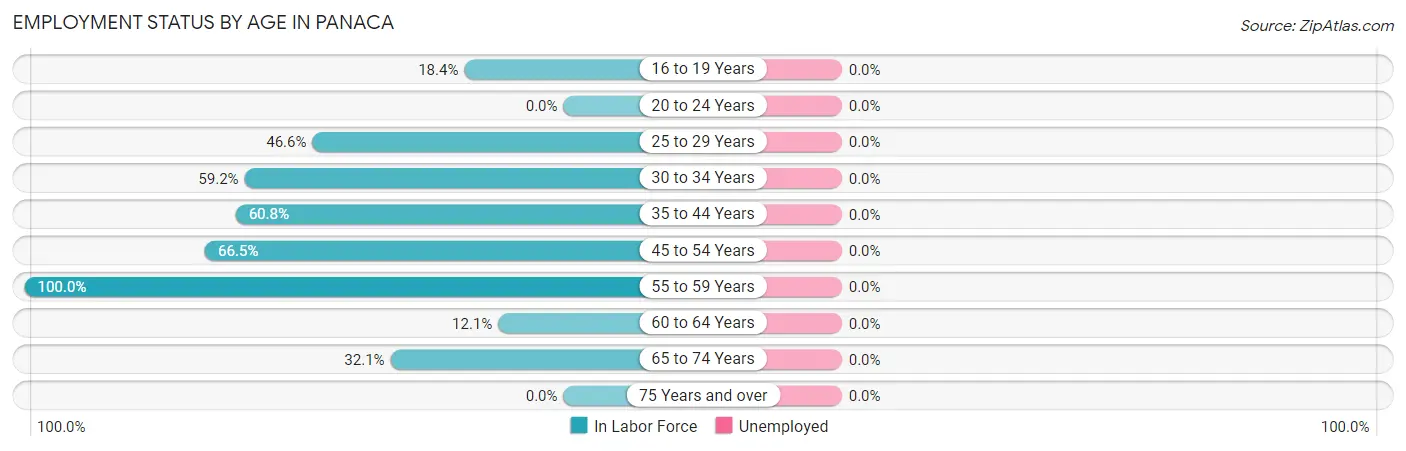
| Age Bracket | In Labor Force | Unemployed |
| 16 to 19 Years | 9 (18.4%) | 0 (0.0%) |
| 20 to 24 Years | 0 (0.0%) | 0 (0.0%) |
| 25 to 29 Years | 41 (46.6%) | 0 (0.0%) |
| 30 to 34 Years | 45 (59.2%) | 0 (0.0%) |
| 35 to 44 Years | 59 (60.8%) | 0 (0.0%) |
| 45 to 54 Years | 105 (66.5%) | 0 (0.0%) |
| 55 to 59 Years | 54 (100.0%) | 0 (0.0%) |
| 60 to 64 Years | 4 (12.1%) | 0 (0.0%) |
| 65 to 74 Years | 26 (32.1%) | 0 (0.0%) |
| 75 Years and over | 0 (0.0%) | 0 (0.0%) |
| Total | 343 (48.2%) | 0 (0.0%) |
Employment Status by Educational Attainment in Panaca
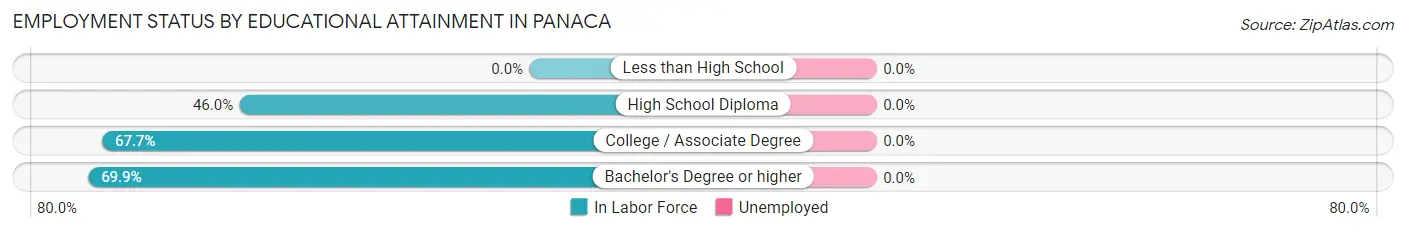
| Educational Attainment | In Labor Force | Unemployed |
| Less than High School | 0 (0.0%) | 0 (0.0%) |
| High School Diploma | 80 (46.0%) | 0 (0.0%) |
| College / Associate Degree | 128 (67.7%) | 0 (0.0%) |
| Bachelor's Degree or higher | 100 (69.9%) | 0 (0.0%) |
| Total | 308 (60.9%) | 0 (0.0%) |
Employment Occupations by Sex in Panaca
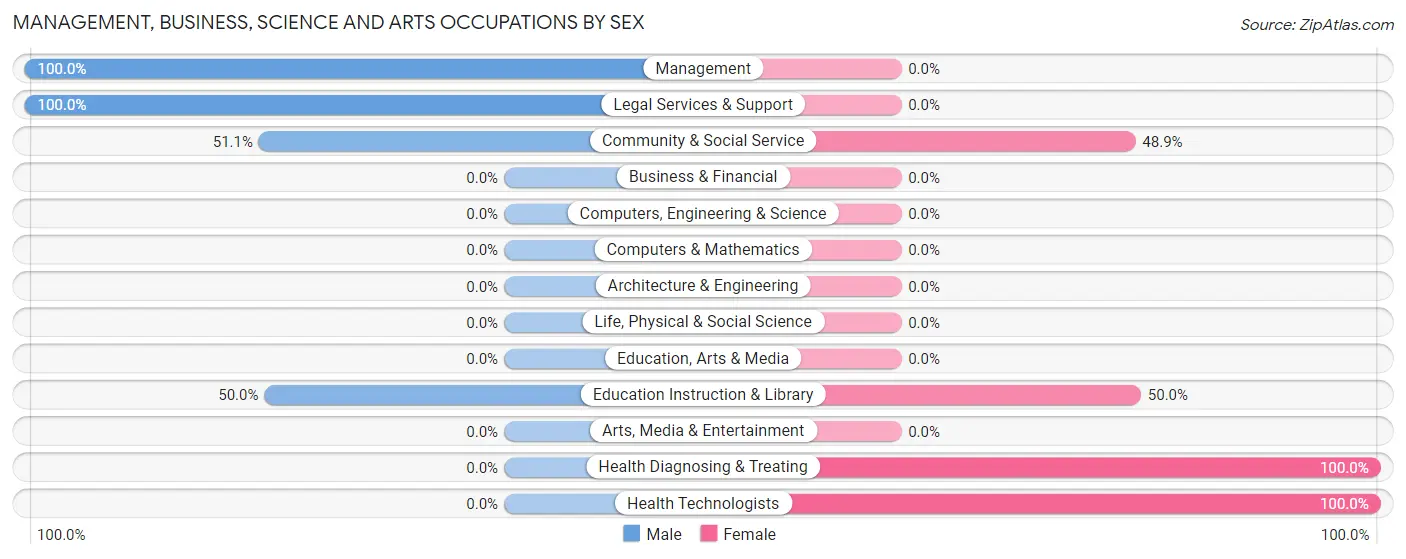
Management, Business, Science and Arts Occupations
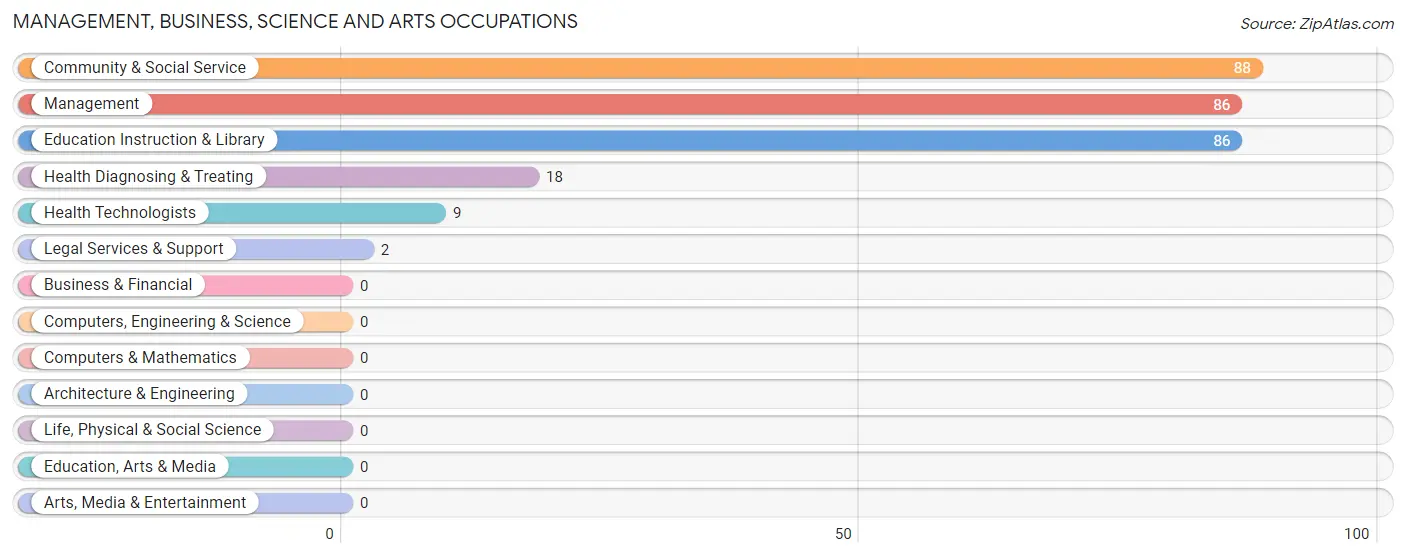
The most common Management, Business, Science and Arts occupations in Panaca are Community & Social Service (88 | 25.7%), Management (86 | 25.1%), Education Instruction & Library (86 | 25.1%), Health Diagnosing & Treating (18 | 5.2%), and Health Technologists (9 | 2.6%).
Management, Business, Science and Arts Occupations by Sex
Within the Management, Business, Science and Arts occupations in Panaca, the most male-oriented occupations are Management (100.0%), Legal Services & Support (100.0%), and Community & Social Service (51.1%), while the most female-oriented occupations are Health Diagnosing & Treating (100.0%), Health Technologists (100.0%), and Education Instruction & Library (50.0%).
| Occupation | Male | Female |
| Management | 86 (100.0%) | 0 (0.0%) |
| Business & Financial | 0 (0.0%) | 0 (0.0%) |
| Computers, Engineering & Science | 0 (0.0%) | 0 (0.0%) |
| Computers & Mathematics | 0 (0.0%) | 0 (0.0%) |
| Architecture & Engineering | 0 (0.0%) | 0 (0.0%) |
| Life, Physical & Social Science | 0 (0.0%) | 0 (0.0%) |
| Community & Social Service | 45 (51.1%) | 43 (48.9%) |
| Education, Arts & Media | 0 (0.0%) | 0 (0.0%) |
| Legal Services & Support | 2 (100.0%) | 0 (0.0%) |
| Education Instruction & Library | 43 (50.0%) | 43 (50.0%) |
| Arts, Media & Entertainment | 0 (0.0%) | 0 (0.0%) |
| Health Diagnosing & Treating | 0 (0.0%) | 18 (100.0%) |
| Health Technologists | 0 (0.0%) | 9 (100.0%) |
| Total (Category) | 131 (68.2%) | 61 (31.8%) |
| Total (Overall) | 228 (66.5%) | 115 (33.5%) |
Services Occupations
The most common Services occupations in Panaca are , and Food Preparation & Serving (9 | 2.6%).
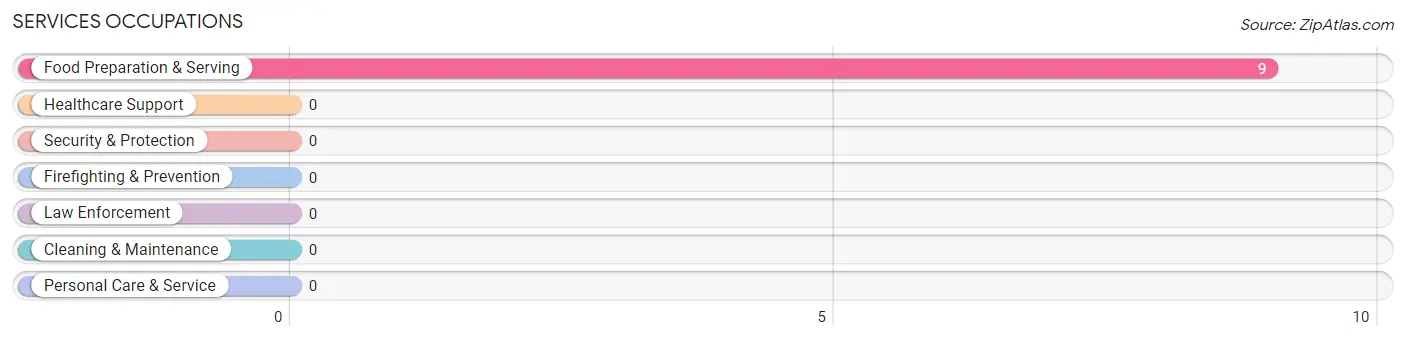
Services Occupations by Sex
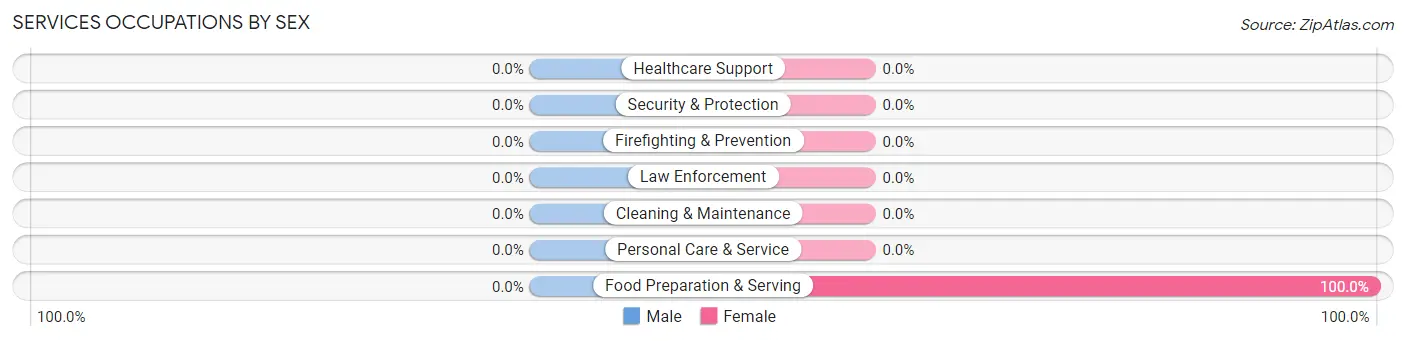
| Occupation | Male | Female |
| Healthcare Support | 0 (0.0%) | 0 (0.0%) |
| Security & Protection | 0 (0.0%) | 0 (0.0%) |
| Firefighting & Prevention | 0 (0.0%) | 0 (0.0%) |
| Law Enforcement | 0 (0.0%) | 0 (0.0%) |
| Food Preparation & Serving | 0 (0.0%) | 9 (100.0%) |
| Cleaning & Maintenance | 0 (0.0%) | 0 (0.0%) |
| Personal Care & Service | 0 (0.0%) | 0 (0.0%) |
| Total (Category) | 0 (0.0%) | 9 (100.0%) |
| Total (Overall) | 228 (66.5%) | 115 (33.5%) |
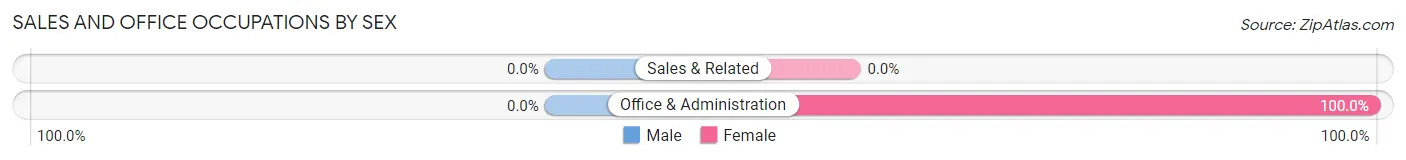
Sales and Office Occupations
The most common Sales and Office occupations in Panaca are , and Office & Administration (21 | 6.1%).

Sales and Office Occupations by Sex
| Occupation | Male | Female |
| Sales & Related | 0 (0.0%) | 0 (0.0%) |
| Office & Administration | 0 (0.0%) | 21 (100.0%) |
| Total (Category) | 0 (0.0%) | 21 (100.0%) |
| Total (Overall) | 228 (66.5%) | 115 (33.5%) |
Natural Resources, Construction and Maintenance Occupations
The most common Natural Resources, Construction and Maintenance occupations in Panaca are Construction & Extraction (46 | 13.4%), Installation, Maintenance & Repair (12 | 3.5%), and Farming, Fishing & Forestry (6 | 1.8%).
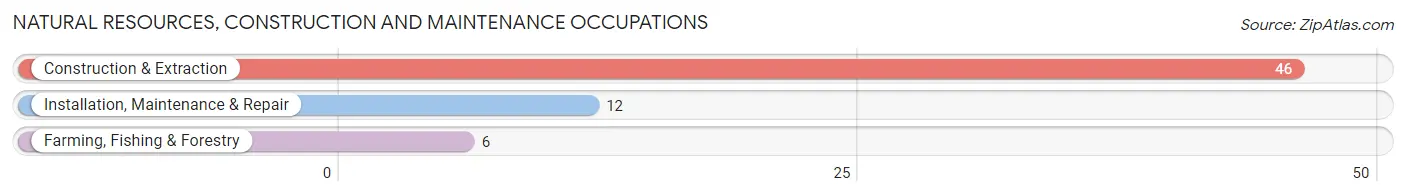
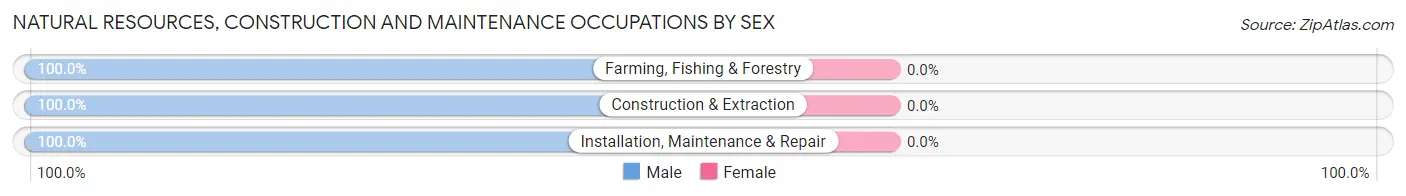
Natural Resources, Construction and Maintenance Occupations by Sex
| Occupation | Male | Female |
| Farming, Fishing & Forestry | 6 (100.0%) | 0 (0.0%) |
| Construction & Extraction | 46 (100.0%) | 0 (0.0%) |
| Installation, Maintenance & Repair | 12 (100.0%) | 0 (0.0%) |
| Total (Category) | 64 (100.0%) | 0 (0.0%) |
| Total (Overall) | 228 (66.5%) | 115 (33.5%) |
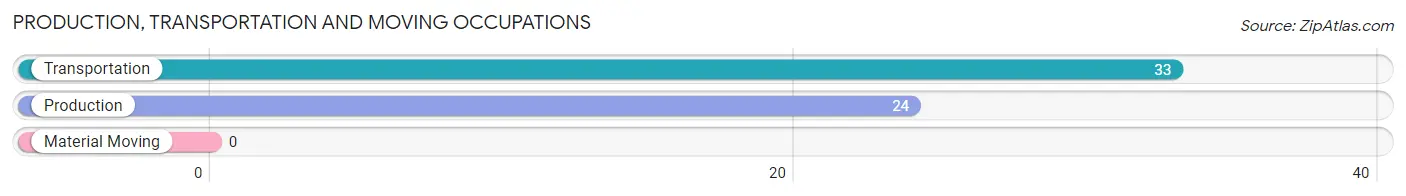
Production, Transportation and Moving Occupations
The most common Production, Transportation and Moving occupations in Panaca are Transportation (33 | 9.6%), and Production (24 | 7.0%).
Production, Transportation and Moving Occupations by Sex
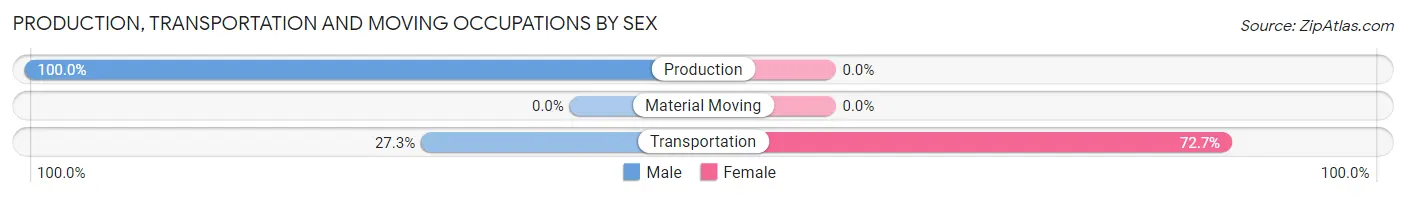
| Occupation | Male | Female |
| Production | 24 (100.0%) | 0 (0.0%) |
| Transportation | 9 (27.3%) | 24 (72.7%) |
| Material Moving | 0 (0.0%) | 0 (0.0%) |
| Total (Category) | 33 (57.9%) | 24 (42.1%) |
| Total (Overall) | 228 (66.5%) | 115 (33.5%) |
Employment Industries by Sex in Panaca
Employment Industries in Panaca
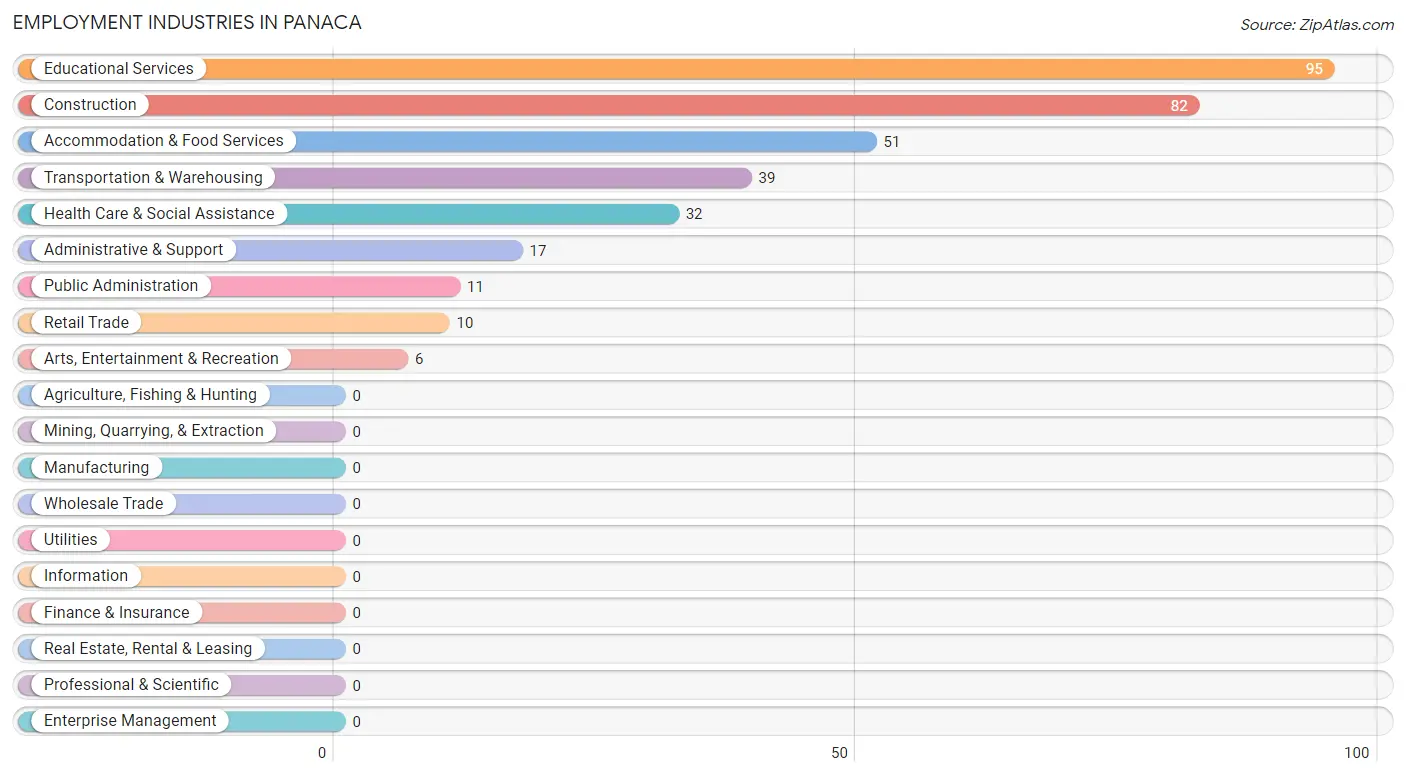
The major employment industries in Panaca include Educational Services (95 | 27.7%), Construction (82 | 23.9%), Accommodation & Food Services (51 | 14.9%), Transportation & Warehousing (39 | 11.4%), and Health Care & Social Assistance (32 | 9.3%).
Employment Industries by Sex in Panaca
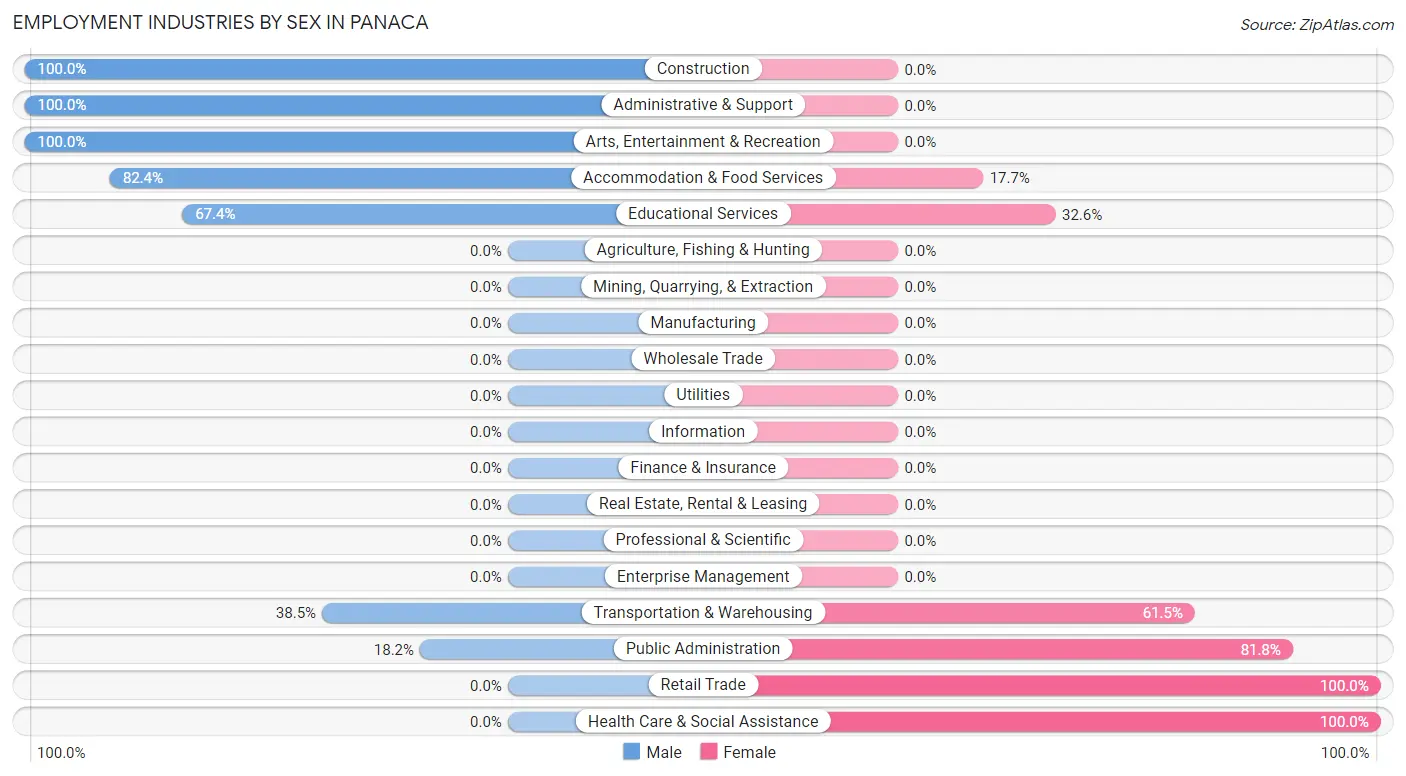
The Panaca industries that see more men than women are Construction (100.0%), Administrative & Support (100.0%), and Arts, Entertainment & Recreation (100.0%), whereas the industries that tend to have a higher number of women are Retail Trade (100.0%), Health Care & Social Assistance (100.0%), and Public Administration (81.8%).
| Industry | Male | Female |
| Agriculture, Fishing & Hunting | 0 (0.0%) | 0 (0.0%) |
| Mining, Quarrying, & Extraction | 0 (0.0%) | 0 (0.0%) |
| Construction | 82 (100.0%) | 0 (0.0%) |
| Manufacturing | 0 (0.0%) | 0 (0.0%) |
| Wholesale Trade | 0 (0.0%) | 0 (0.0%) |
| Retail Trade | 0 (0.0%) | 10 (100.0%) |
| Transportation & Warehousing | 15 (38.5%) | 24 (61.5%) |
| Utilities | 0 (0.0%) | 0 (0.0%) |
| Information | 0 (0.0%) | 0 (0.0%) |
| Finance & Insurance | 0 (0.0%) | 0 (0.0%) |
| Real Estate, Rental & Leasing | 0 (0.0%) | 0 (0.0%) |
| Professional & Scientific | 0 (0.0%) | 0 (0.0%) |
| Enterprise Management | 0 (0.0%) | 0 (0.0%) |
| Administrative & Support | 17 (100.0%) | 0 (0.0%) |
| Educational Services | 64 (67.4%) | 31 (32.6%) |
| Health Care & Social Assistance | 0 (0.0%) | 32 (100.0%) |
| Arts, Entertainment & Recreation | 6 (100.0%) | 0 (0.0%) |
| Accommodation & Food Services | 42 (82.4%) | 9 (17.6%) |
| Public Administration | 2 (18.2%) | 9 (81.8%) |
| Total | 228 (66.5%) | 115 (33.5%) |
Education in Panaca
School Enrollment in Panaca
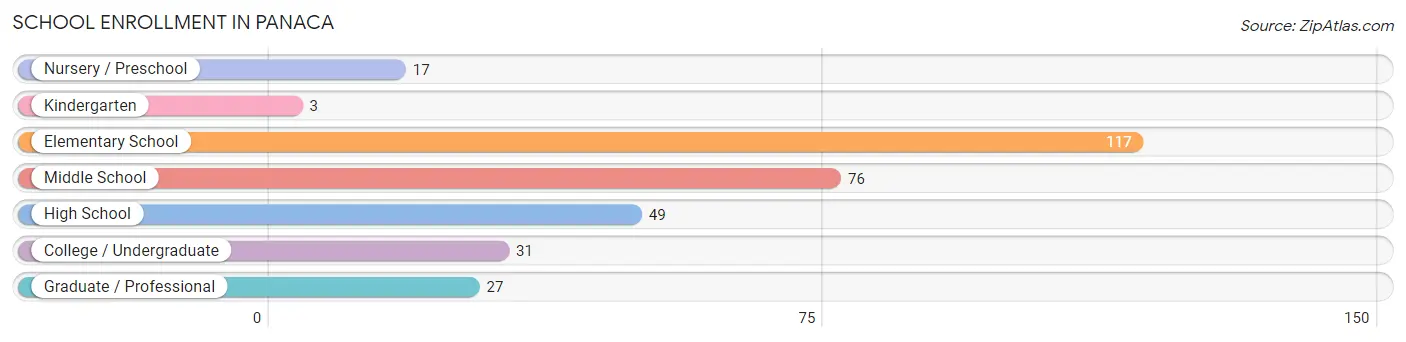
The most common levels of schooling among the 320 students in Panaca are elementary school (117 | 36.6%), middle school (76 | 23.7%), and high school (49 | 15.3%).
| School Level | # Students | % Students |
| Nursery / Preschool | 17 | 5.3% |
| Kindergarten | 3 | 0.9% |
| Elementary School | 117 | 36.6% |
| Middle School | 76 | 23.7% |
| High School | 49 | 15.3% |
| College / Undergraduate | 31 | 9.7% |
| Graduate / Professional | 27 | 8.4% |
| Total | 320 | 100.0% |
School Enrollment by Age by Funding Source in Panaca
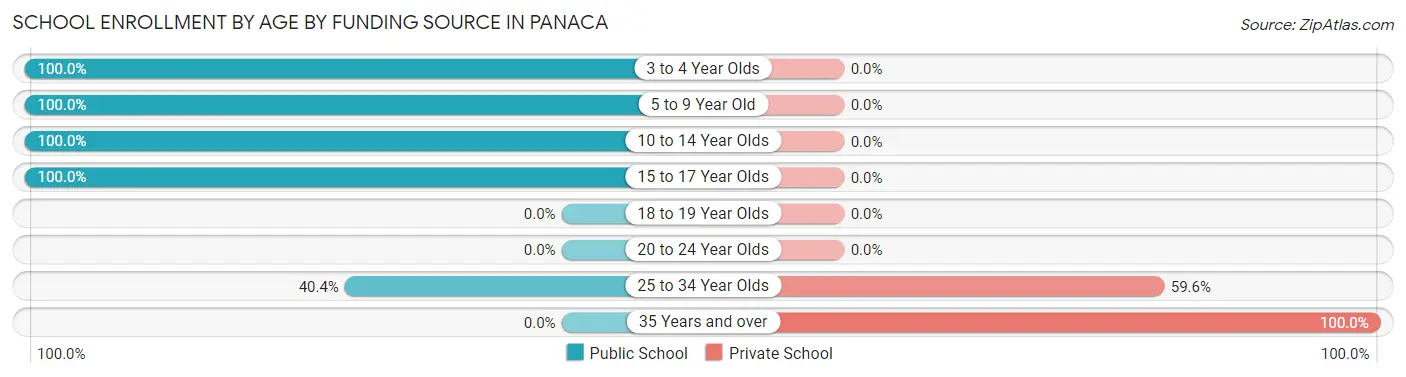
Out of a total of 320 students who are enrolled in schools in Panaca, 37 (11.6%) attend a private institution, while the remaining 283 (88.4%) are enrolled in public schools. The age group of 35 years and over has the highest likelihood of being enrolled in private schools, with 6 (100.0% in the age bracket) enrolled. Conversely, the age group of 3 to 4 year olds has the lowest likelihood of being enrolled in a private school, with 17 (100.0% in the age bracket) attending a public institution.
| Age Bracket | Public School | Private School |
| 3 to 4 Year Olds | 17 (100.0%) | 0 (0.0%) |
| 5 to 9 Year Old | 120 (100.0%) | 0 (0.0%) |
| 10 to 14 Year Olds | 76 (100.0%) | 0 (0.0%) |
| 15 to 17 Year Olds | 49 (100.0%) | 0 (0.0%) |
| 18 to 19 Year Olds | 0 (0.0%) | 0 (0.0%) |
| 20 to 24 Year Olds | 0 (0.0%) | 0 (0.0%) |
| 25 to 34 Year Olds | 21 (40.4%) | 31 (59.6%) |
| 35 Years and over | 0 (0.0%) | 6 (100.0%) |
| Total | 283 (88.4%) | 37 (11.6%) |
Educational Attainment by Field of Study in Panaca
Education (88 | 52.1%), arts & humanities (53 | 31.4%), business (16 | 9.5%), bio, nature & agricultural (6 | 3.5%), and science & technology (6 | 3.5%) are the most common fields of study among 169 individuals in Panaca who have obtained a bachelor's degree or higher.
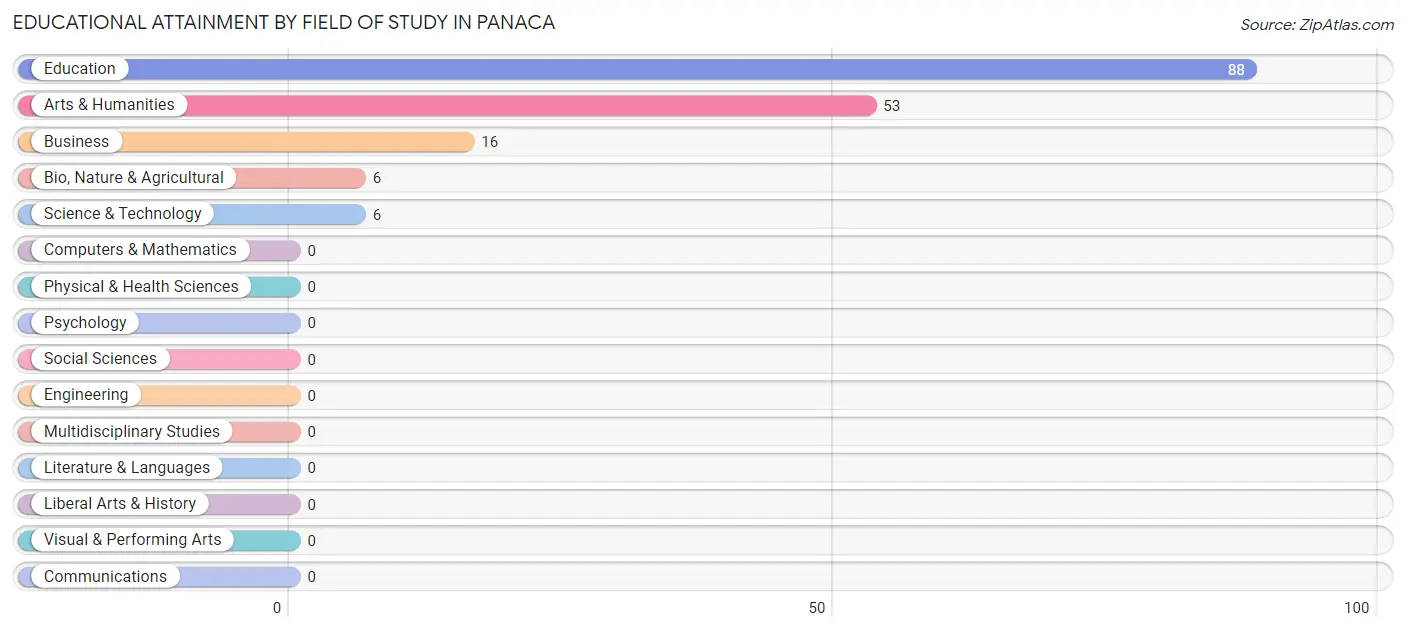
| Field of Study | # Graduates | % Graduates |
| Computers & Mathematics | 0 | 0.0% |
| Bio, Nature & Agricultural | 6 | 3.5% |
| Physical & Health Sciences | 0 | 0.0% |
| Psychology | 0 | 0.0% |
| Social Sciences | 0 | 0.0% |
| Engineering | 0 | 0.0% |
| Multidisciplinary Studies | 0 | 0.0% |
| Science & Technology | 6 | 3.5% |
| Business | 16 | 9.5% |
| Education | 88 | 52.1% |
| Literature & Languages | 0 | 0.0% |
| Liberal Arts & History | 0 | 0.0% |
| Visual & Performing Arts | 0 | 0.0% |
| Communications | 0 | 0.0% |
| Arts & Humanities | 53 | 31.4% |
| Total | 169 | 100.0% |
Transportation & Commute in Panaca
Vehicle Availability by Sex in Panaca
The most prevalent vehicle ownership categories in Panaca are males with 2 vehicles (99, accounting for 43.4%) and females with 2 vehicles (11, making up 86.1%).
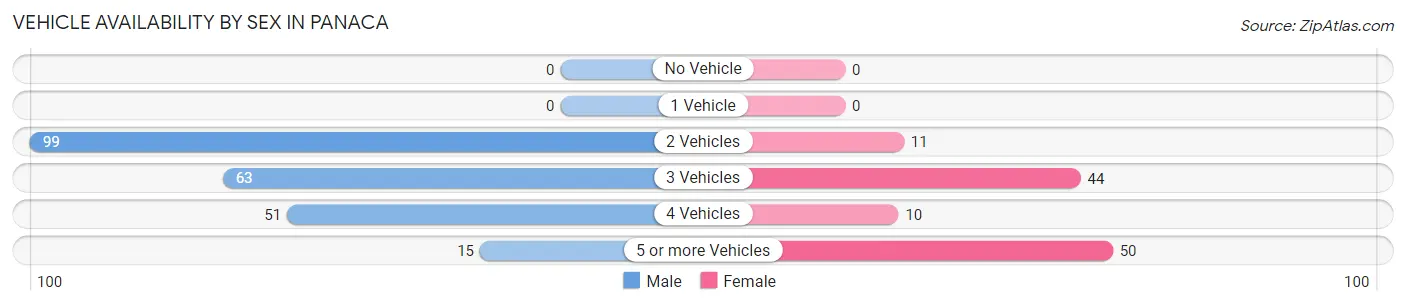
| Vehicles Available | Male | Female |
| No Vehicle | 0 (0.0%) | 0 (0.0%) |
| 1 Vehicle | 0 (0.0%) | 0 (0.0%) |
| 2 Vehicles | 99 (43.4%) | 11 (9.6%) |
| 3 Vehicles | 63 (27.6%) | 44 (38.3%) |
| 4 Vehicles | 51 (22.4%) | 10 (8.7%) |
| 5 or more Vehicles | 15 (6.6%) | 50 (43.5%) |
| Total | 228 (100.0%) | 115 (100.0%) |
Commute Time in Panaca
The most frequently occuring commute durations in Panaca are less than 5 minutes (187 commuters, 56.5%), 90 or more minutes (57 commuters, 17.2%), and 15 to 19 minutes (43 commuters, 13.0%).
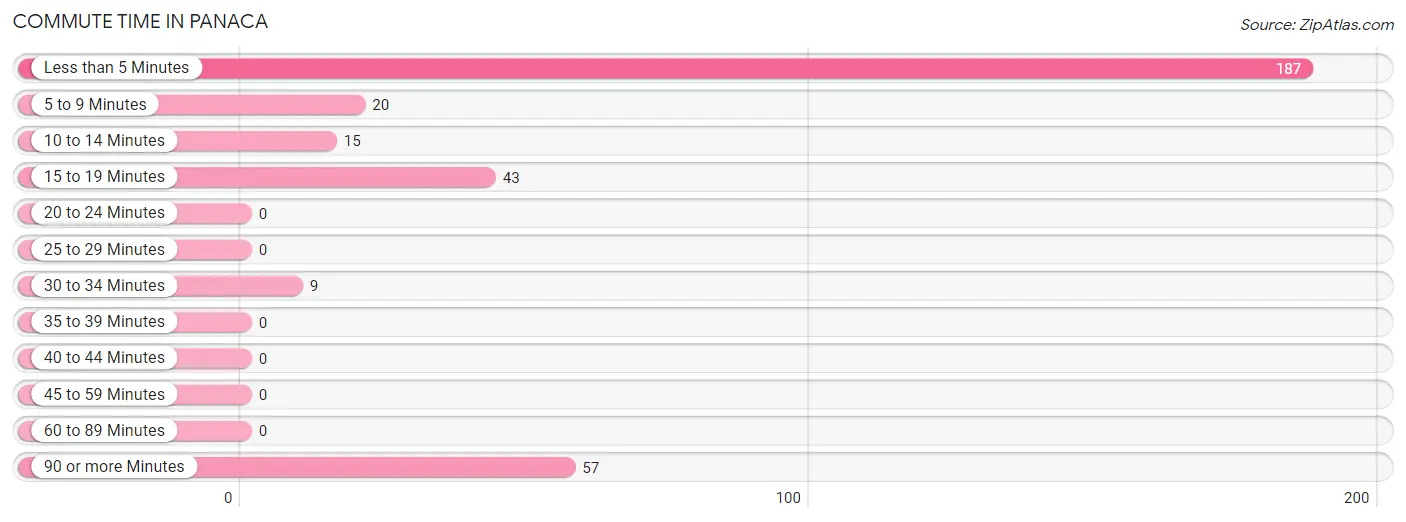
| Commute Time | # Commuters | % Commuters |
| Less than 5 Minutes | 187 | 56.5% |
| 5 to 9 Minutes | 20 | 6.0% |
| 10 to 14 Minutes | 15 | 4.5% |
| 15 to 19 Minutes | 43 | 13.0% |
| 20 to 24 Minutes | 0 | 0.0% |
| 25 to 29 Minutes | 0 | 0.0% |
| 30 to 34 Minutes | 9 | 2.7% |
| 35 to 39 Minutes | 0 | 0.0% |
| 40 to 44 Minutes | 0 | 0.0% |
| 45 to 59 Minutes | 0 | 0.0% |
| 60 to 89 Minutes | 0 | 0.0% |
| 90 or more Minutes | 57 | 17.2% |
Commute Time by Sex in Panaca
The most common commute times in Panaca are less than 5 minutes (98 commuters, 45.4%) for males and less than 5 minutes (89 commuters, 77.4%) for females.
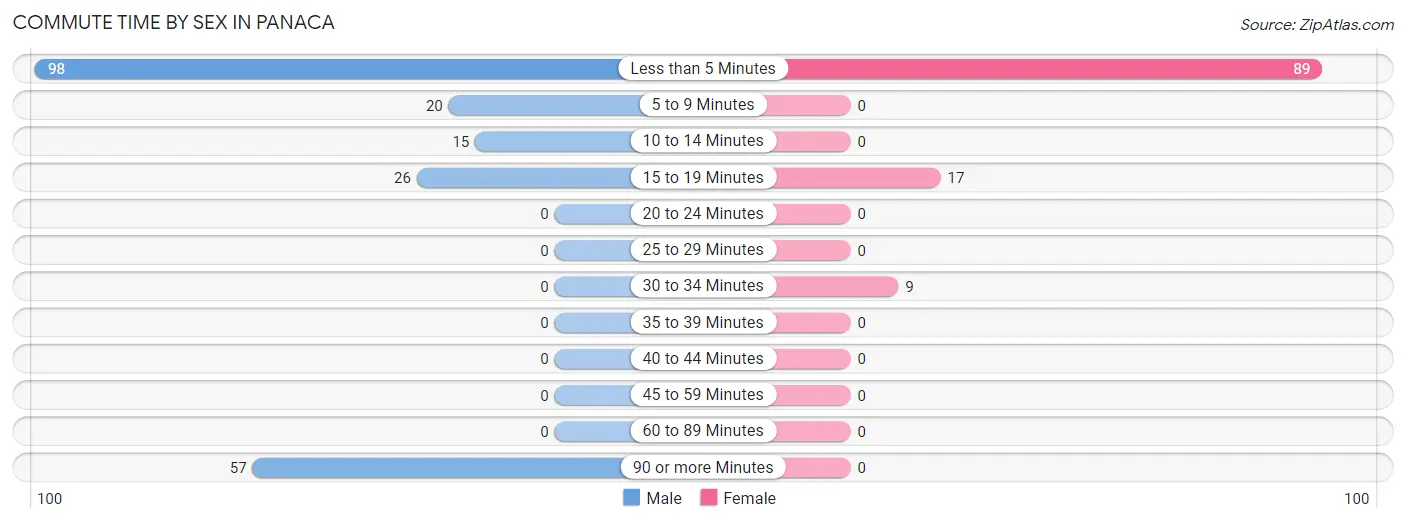
| Commute Time | Male | Female |
| Less than 5 Minutes | 98 (45.4%) | 89 (77.4%) |
| 5 to 9 Minutes | 20 (9.3%) | 0 (0.0%) |
| 10 to 14 Minutes | 15 (6.9%) | 0 (0.0%) |
| 15 to 19 Minutes | 26 (12.0%) | 17 (14.8%) |
| 20 to 24 Minutes | 0 (0.0%) | 0 (0.0%) |
| 25 to 29 Minutes | 0 (0.0%) | 0 (0.0%) |
| 30 to 34 Minutes | 0 (0.0%) | 9 (7.8%) |
| 35 to 39 Minutes | 0 (0.0%) | 0 (0.0%) |
| 40 to 44 Minutes | 0 (0.0%) | 0 (0.0%) |
| 45 to 59 Minutes | 0 (0.0%) | 0 (0.0%) |
| 60 to 89 Minutes | 0 (0.0%) | 0 (0.0%) |
| 90 or more Minutes | 57 (26.4%) | 0 (0.0%) |
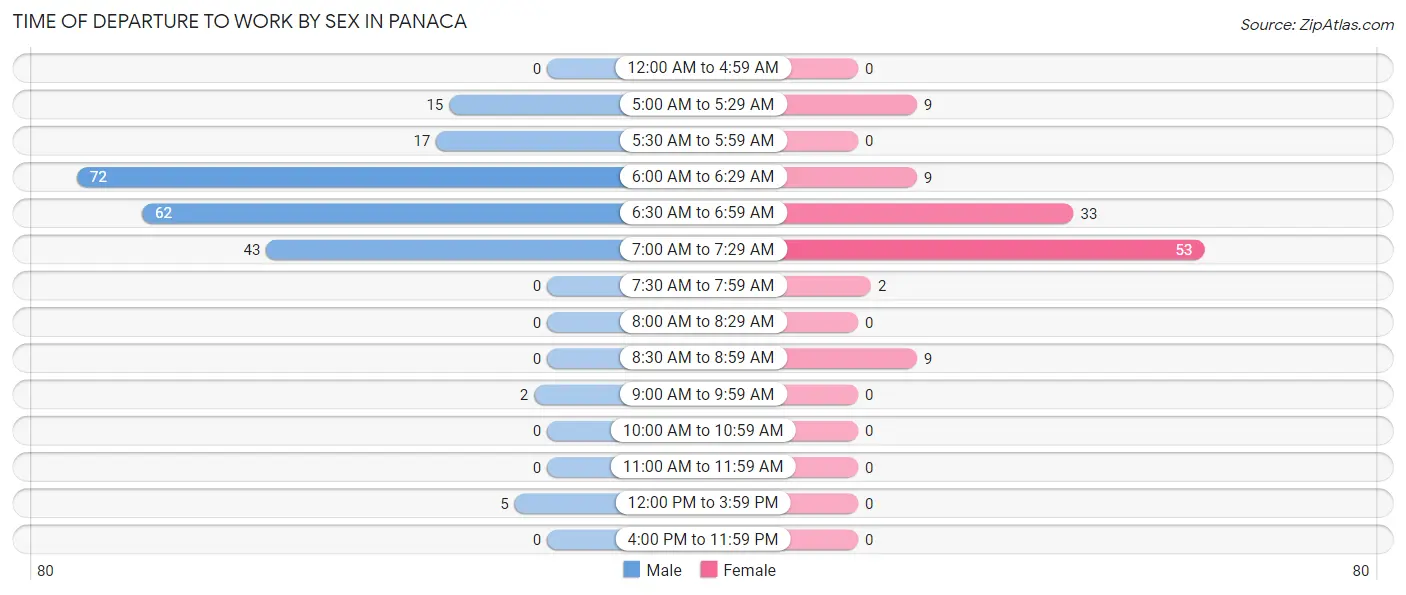
Time of Departure to Work by Sex in Panaca
The most frequent times of departure to work in Panaca are 6:00 AM to 6:29 AM (72, 33.3%) for males and 7:00 AM to 7:29 AM (53, 46.1%) for females.
| Time of Departure | Male | Female |
| 12:00 AM to 4:59 AM | 0 (0.0%) | 0 (0.0%) |
| 5:00 AM to 5:29 AM | 15 (6.9%) | 9 (7.8%) |
| 5:30 AM to 5:59 AM | 17 (7.9%) | 0 (0.0%) |
| 6:00 AM to 6:29 AM | 72 (33.3%) | 9 (7.8%) |
| 6:30 AM to 6:59 AM | 62 (28.7%) | 33 (28.7%) |
| 7:00 AM to 7:29 AM | 43 (19.9%) | 53 (46.1%) |
| 7:30 AM to 7:59 AM | 0 (0.0%) | 2 (1.7%) |
| 8:00 AM to 8:29 AM | 0 (0.0%) | 0 (0.0%) |
| 8:30 AM to 8:59 AM | 0 (0.0%) | 9 (7.8%) |
| 9:00 AM to 9:59 AM | 2 (0.9%) | 0 (0.0%) |
| 10:00 AM to 10:59 AM | 0 (0.0%) | 0 (0.0%) |
| 11:00 AM to 11:59 AM | 0 (0.0%) | 0 (0.0%) |
| 12:00 PM to 3:59 PM | 5 (2.3%) | 0 (0.0%) |
| 4:00 PM to 11:59 PM | 0 (0.0%) | 0 (0.0%) |
| Total | 216 (100.0%) | 115 (100.0%) |
Housing Occupancy in Panaca
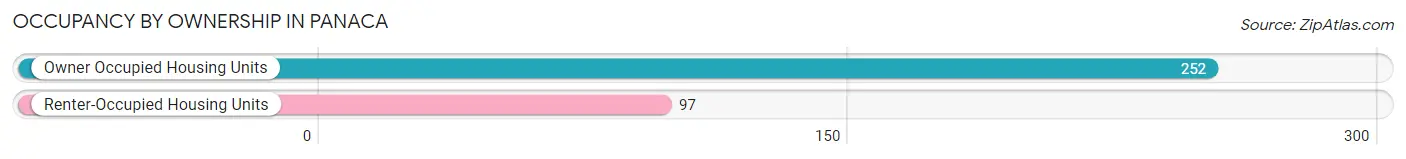
Occupancy by Ownership in Panaca
Of the total 349 dwellings in Panaca, owner-occupied units account for 252 (72.2%), while renter-occupied units make up 97 (27.8%).
| Occupancy | # Housing Units | % Housing Units |
| Owner Occupied Housing Units | 252 | 72.2% |
| Renter-Occupied Housing Units | 97 | 27.8% |
| Total Occupied Housing Units | 349 | 100.0% |
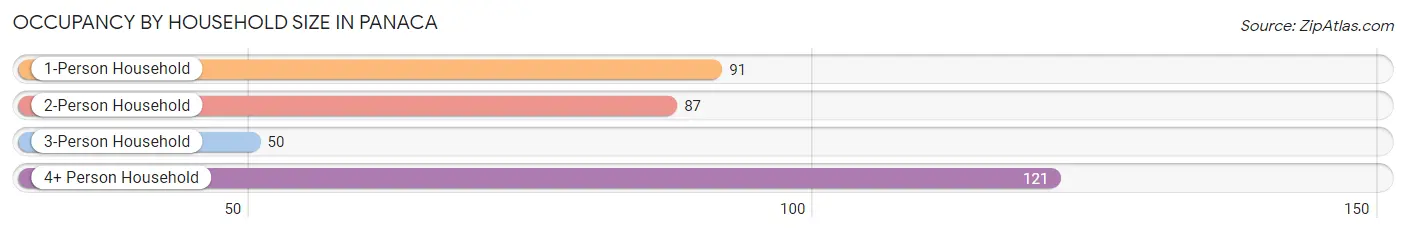
Occupancy by Household Size in Panaca
| Household Size | # Housing Units | % Housing Units |
| 1-Person Household | 91 | 26.1% |
| 2-Person Household | 87 | 24.9% |
| 3-Person Household | 50 | 14.3% |
| 4+ Person Household | 121 | 34.7% |
| Total Housing Units | 349 | 100.0% |
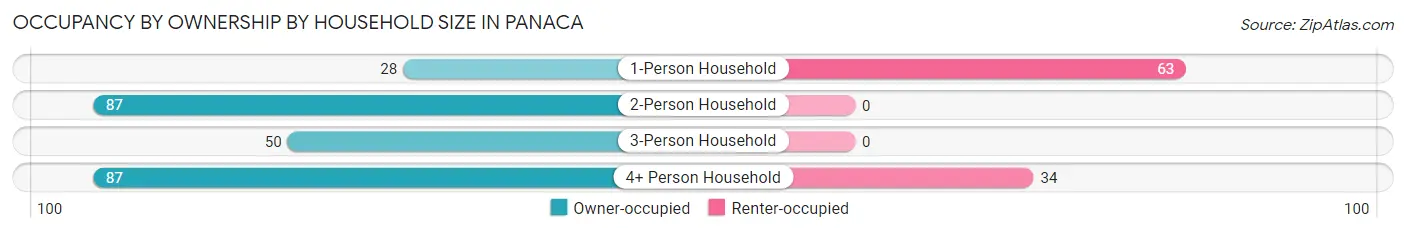
Occupancy by Ownership by Household Size in Panaca
| Household Size | Owner-occupied | Renter-occupied |
| 1-Person Household | 28 (30.8%) | 63 (69.2%) |
| 2-Person Household | 87 (100.0%) | 0 (0.0%) |
| 3-Person Household | 50 (100.0%) | 0 (0.0%) |
| 4+ Person Household | 87 (71.9%) | 34 (28.1%) |
| Total Housing Units | 252 (72.2%) | 97 (27.8%) |
Occupancy by Educational Attainment in Panaca
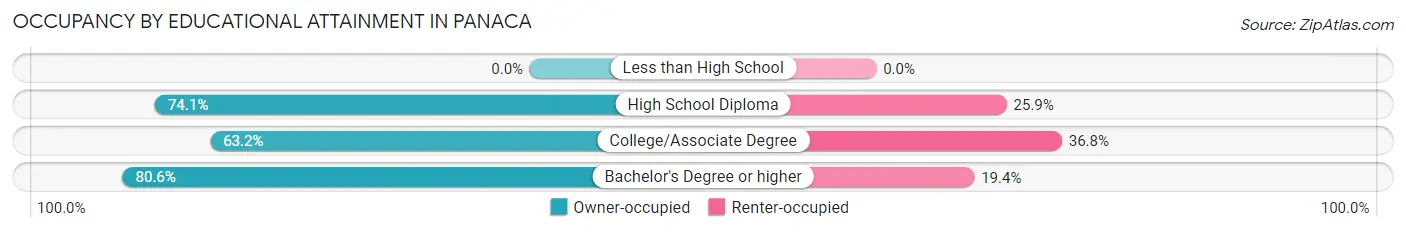
| Household Size | Owner-occupied | Renter-occupied |
| Less than High School | 0 (0.0%) | 0 (0.0%) |
| High School Diploma | 86 (74.1%) | 30 (25.9%) |
| College/Associate Degree | 79 (63.2%) | 46 (36.8%) |
| Bachelor's Degree or higher | 87 (80.6%) | 21 (19.4%) |
Occupancy by Age of Householder in Panaca
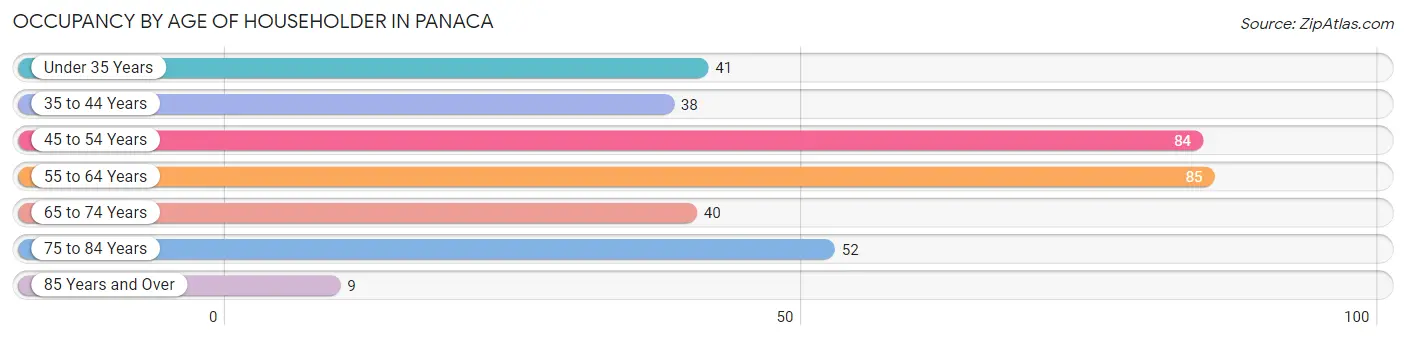
| Age Bracket | # Households | % Households |
| Under 35 Years | 41 | 11.7% |
| 35 to 44 Years | 38 | 10.9% |
| 45 to 54 Years | 84 | 24.1% |
| 55 to 64 Years | 85 | 24.4% |
| 65 to 74 Years | 40 | 11.5% |
| 75 to 84 Years | 52 | 14.9% |
| 85 Years and Over | 9 | 2.6% |
| Total | 349 | 100.0% |
Housing Finances in Panaca
Median Income by Occupancy in Panaca
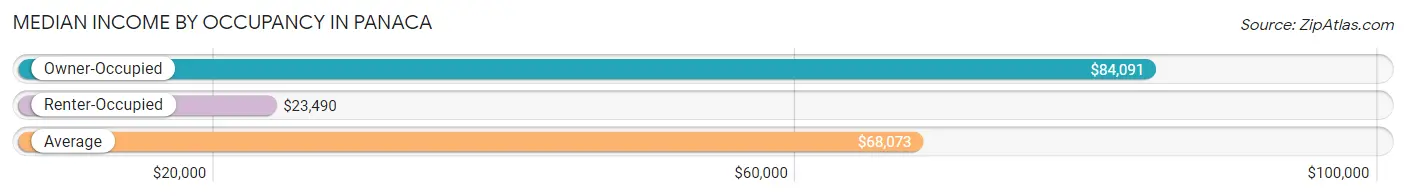
| Occupancy Type | # Households | Median Income |
| Owner-Occupied | 252 (72.2%) | $84,091 |
| Renter-Occupied | 97 (27.8%) | $23,490 |
| Average | 349 (100.0%) | $68,073 |
Occupancy by Householder Income Bracket in Panaca
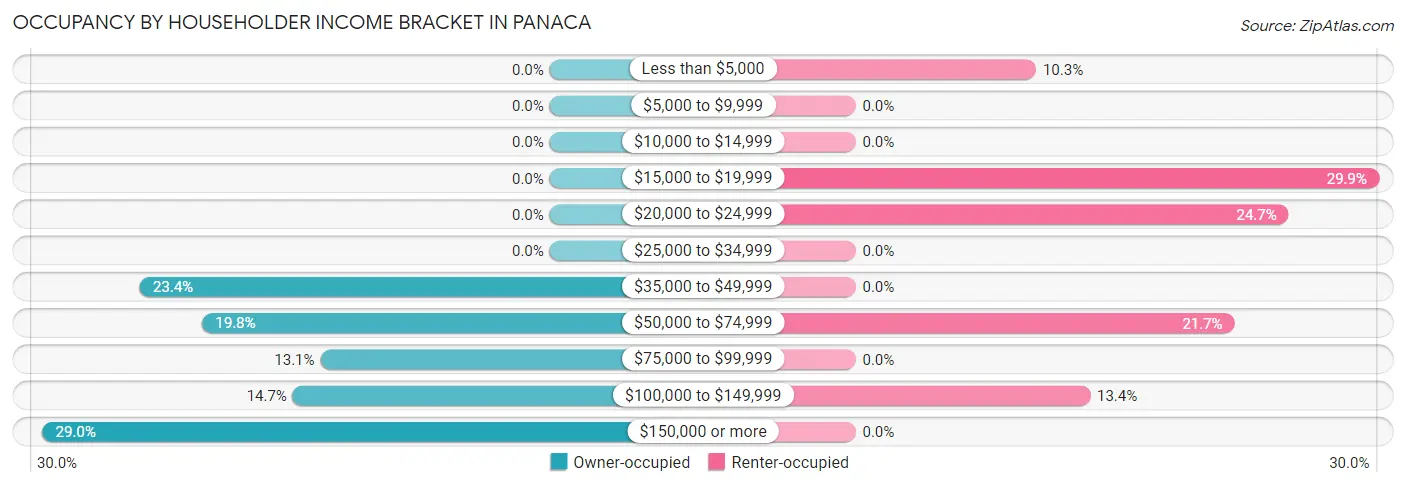
| Income Bracket | Owner-occupied | Renter-occupied |
| Less than $5,000 | 0 (0.0%) | 10 (10.3%) |
| $5,000 to $9,999 | 0 (0.0%) | 0 (0.0%) |
| $10,000 to $14,999 | 0 (0.0%) | 0 (0.0%) |
| $15,000 to $19,999 | 0 (0.0%) | 29 (29.9%) |
| $20,000 to $24,999 | 0 (0.0%) | 24 (24.7%) |
| $25,000 to $34,999 | 0 (0.0%) | 0 (0.0%) |
| $35,000 to $49,999 | 59 (23.4%) | 0 (0.0%) |
| $50,000 to $74,999 | 50 (19.8%) | 21 (21.6%) |
| $75,000 to $99,999 | 33 (13.1%) | 0 (0.0%) |
| $100,000 to $149,999 | 37 (14.7%) | 13 (13.4%) |
| $150,000 or more | 73 (29.0%) | 0 (0.0%) |
| Total | 252 (100.0%) | 97 (100.0%) |
Monthly Housing Cost Tiers in Panaca
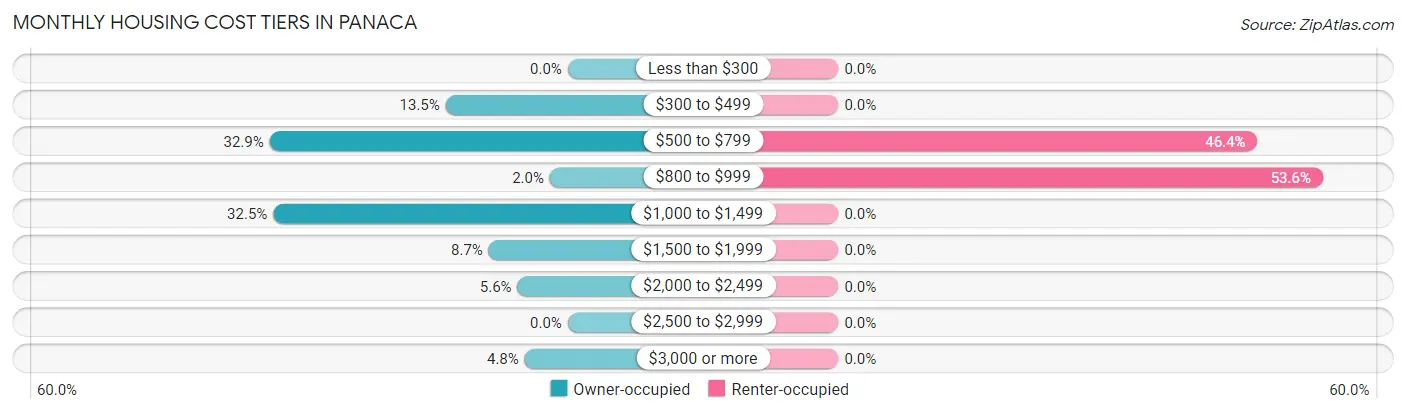
| Monthly Cost | Owner-occupied | Renter-occupied |
| Less than $300 | 0 (0.0%) | 0 (0.0%) |
| $300 to $499 | 34 (13.5%) | 0 (0.0%) |
| $500 to $799 | 83 (32.9%) | 45 (46.4%) |
| $800 to $999 | 5 (2.0%) | 52 (53.6%) |
| $1,000 to $1,499 | 82 (32.5%) | 0 (0.0%) |
| $1,500 to $1,999 | 22 (8.7%) | 0 (0.0%) |
| $2,000 to $2,499 | 14 (5.6%) | 0 (0.0%) |
| $2,500 to $2,999 | 0 (0.0%) | 0 (0.0%) |
| $3,000 or more | 12 (4.8%) | 0 (0.0%) |
| Total | 252 (100.0%) | 97 (100.0%) |
Physical Housing Characteristics in Panaca
Housing Structures in Panaca
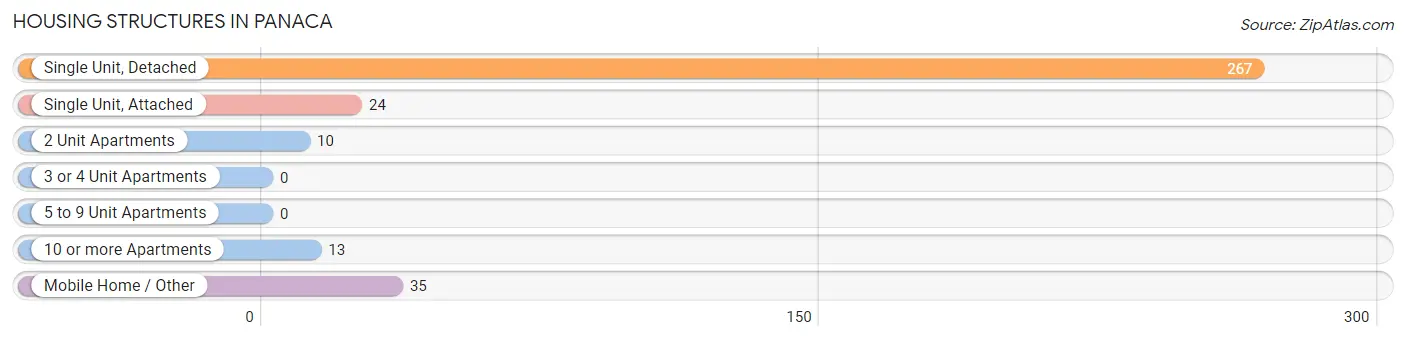
| Structure Type | # Housing Units | % Housing Units |
| Single Unit, Detached | 267 | 76.5% |
| Single Unit, Attached | 24 | 6.9% |
| 2 Unit Apartments | 10 | 2.9% |
| 3 or 4 Unit Apartments | 0 | 0.0% |
| 5 to 9 Unit Apartments | 0 | 0.0% |
| 10 or more Apartments | 13 | 3.7% |
| Mobile Home / Other | 35 | 10.0% |
| Total | 349 | 100.0% |
Housing Structures by Occupancy in Panaca
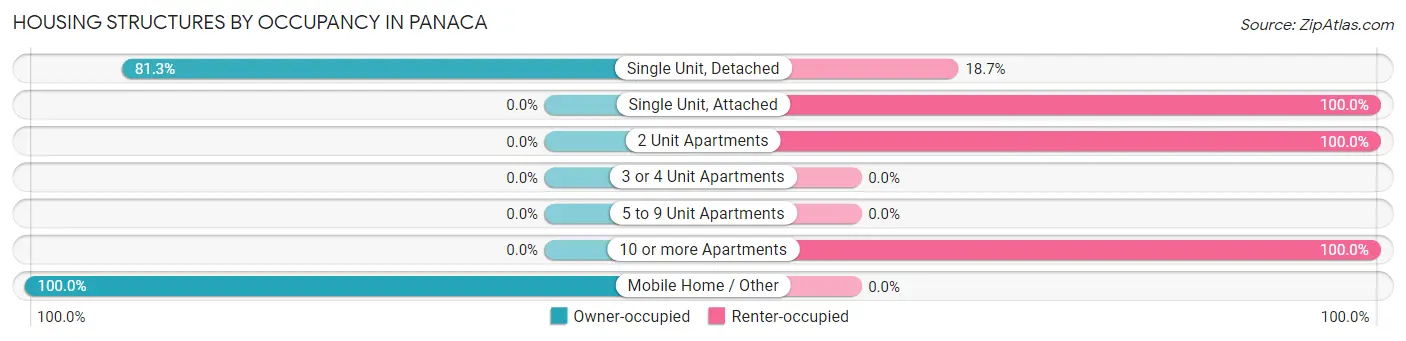
| Structure Type | Owner-occupied | Renter-occupied |
| Single Unit, Detached | 217 (81.3%) | 50 (18.7%) |
| Single Unit, Attached | 0 (0.0%) | 24 (100.0%) |
| 2 Unit Apartments | 0 (0.0%) | 10 (100.0%) |
| 3 or 4 Unit Apartments | 0 (0.0%) | 0 (0.0%) |
| 5 to 9 Unit Apartments | 0 (0.0%) | 0 (0.0%) |
| 10 or more Apartments | 0 (0.0%) | 13 (100.0%) |
| Mobile Home / Other | 35 (100.0%) | 0 (0.0%) |
| Total | 252 (72.2%) | 97 (27.8%) |
Housing Structures by Number of Rooms in Panaca
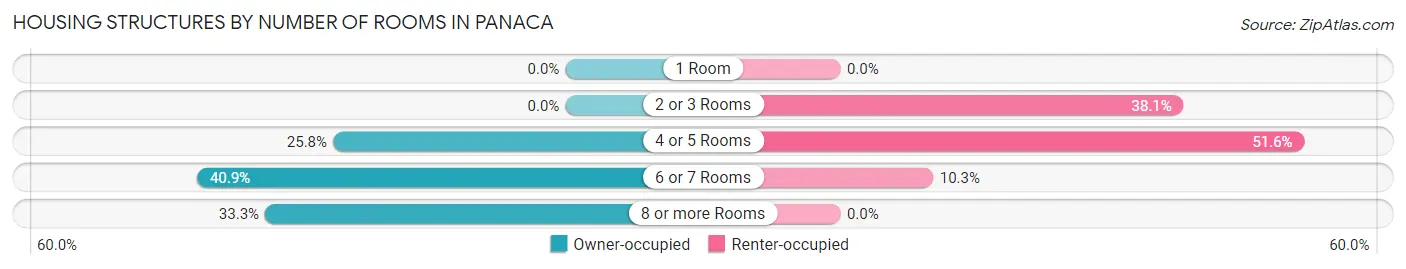
| Number of Rooms | Owner-occupied | Renter-occupied |
| 1 Room | 0 (0.0%) | 0 (0.0%) |
| 2 or 3 Rooms | 0 (0.0%) | 37 (38.1%) |
| 4 or 5 Rooms | 65 (25.8%) | 50 (51.5%) |
| 6 or 7 Rooms | 103 (40.9%) | 10 (10.3%) |
| 8 or more Rooms | 84 (33.3%) | 0 (0.0%) |
| Total | 252 (100.0%) | 97 (100.0%) |
Housing Structure by Heating Type in Panaca
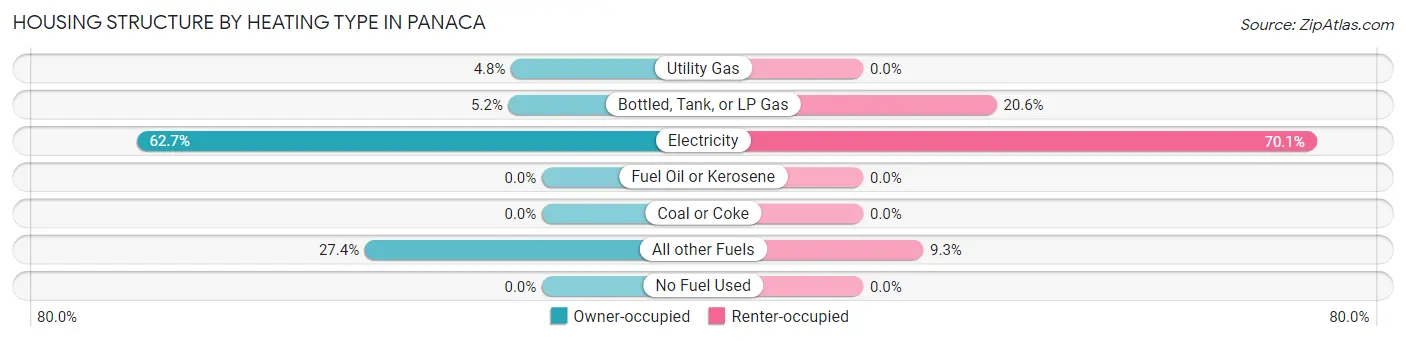
| Heating Type | Owner-occupied | Renter-occupied |
| Utility Gas | 12 (4.8%) | 0 (0.0%) |
| Bottled, Tank, or LP Gas | 13 (5.2%) | 20 (20.6%) |
| Electricity | 158 (62.7%) | 68 (70.1%) |
| Fuel Oil or Kerosene | 0 (0.0%) | 0 (0.0%) |
| Coal or Coke | 0 (0.0%) | 0 (0.0%) |
| All other Fuels | 69 (27.4%) | 9 (9.3%) |
| No Fuel Used | 0 (0.0%) | 0 (0.0%) |
| Total | 252 (100.0%) | 97 (100.0%) |
Household Vehicle Usage in Panaca
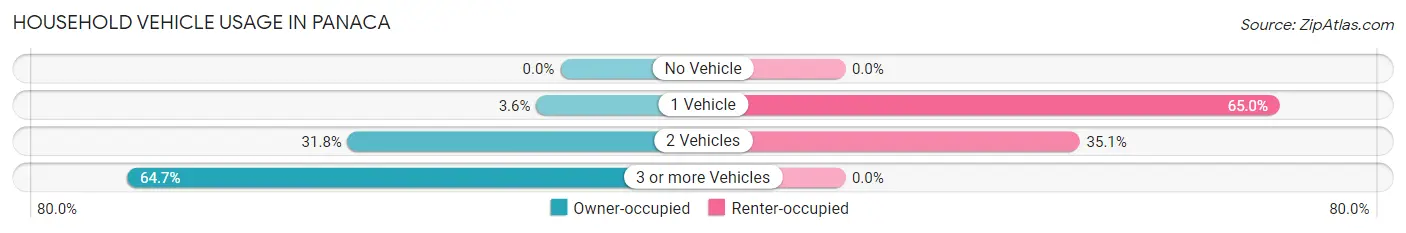
| Vehicles per Household | Owner-occupied | Renter-occupied |
| No Vehicle | 0 (0.0%) | 0 (0.0%) |
| 1 Vehicle | 9 (3.6%) | 63 (64.9%) |
| 2 Vehicles | 80 (31.8%) | 34 (35.0%) |
| 3 or more Vehicles | 163 (64.7%) | 0 (0.0%) |
| Total | 252 (100.0%) | 97 (100.0%) |
Real Estate & Mortgages in Panaca
Real Estate and Mortgage Overview in Panaca
| Characteristic | Without Mortgage | With Mortgage |
| Housing Units | 117 | 135 |
| Median Property Value | $222,500 | $301,200 |
| Median Household Income | - | - |
| Monthly Housing Costs | $563 | $12 |
| Real Estate Taxes | $1,387 | $0 |
Property Value by Mortgage Status in Panaca
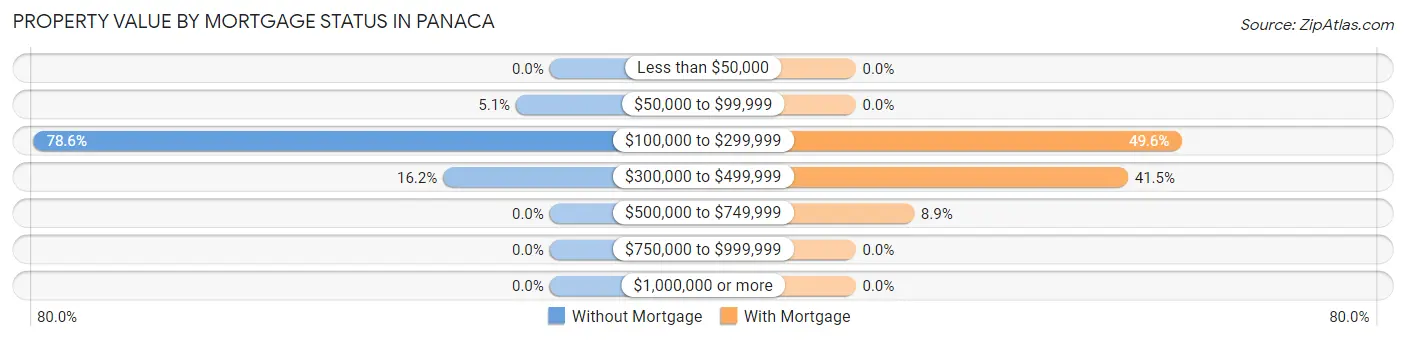
| Property Value | Without Mortgage | With Mortgage |
| Less than $50,000 | 0 (0.0%) | 0 (0.0%) |
| $50,000 to $99,999 | 6 (5.1%) | 0 (0.0%) |
| $100,000 to $299,999 | 92 (78.6%) | 67 (49.6%) |
| $300,000 to $499,999 | 19 (16.2%) | 56 (41.5%) |
| $500,000 to $749,999 | 0 (0.0%) | 12 (8.9%) |
| $750,000 to $999,999 | 0 (0.0%) | 0 (0.0%) |
| $1,000,000 or more | 0 (0.0%) | 0 (0.0%) |
| Total | 117 (100.0%) | 135 (100.0%) |
Household Income by Mortgage Status in Panaca
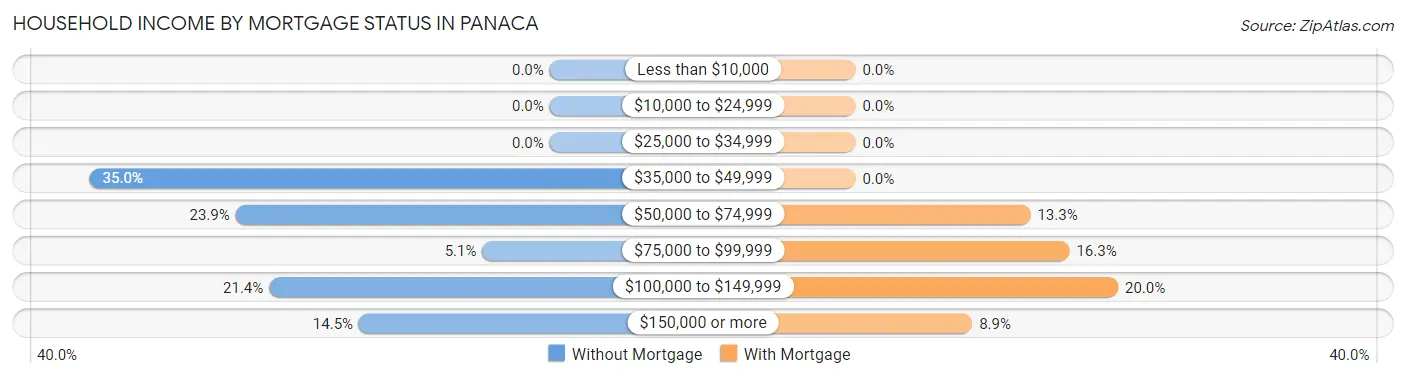
| Household Income | Without Mortgage | With Mortgage |
| Less than $10,000 | 0 (0.0%) | 0 (0.0%) |
| $10,000 to $24,999 | 0 (0.0%) | 0 (0.0%) |
| $25,000 to $34,999 | 0 (0.0%) | 0 (0.0%) |
| $35,000 to $49,999 | 41 (35.0%) | 0 (0.0%) |
| $50,000 to $74,999 | 28 (23.9%) | 18 (13.3%) |
| $75,000 to $99,999 | 6 (5.1%) | 22 (16.3%) |
| $100,000 to $149,999 | 25 (21.4%) | 27 (20.0%) |
| $150,000 or more | 17 (14.5%) | 12 (8.9%) |
| Total | 117 (100.0%) | 135 (100.0%) |
Property Value to Household Income Ratio in Panaca
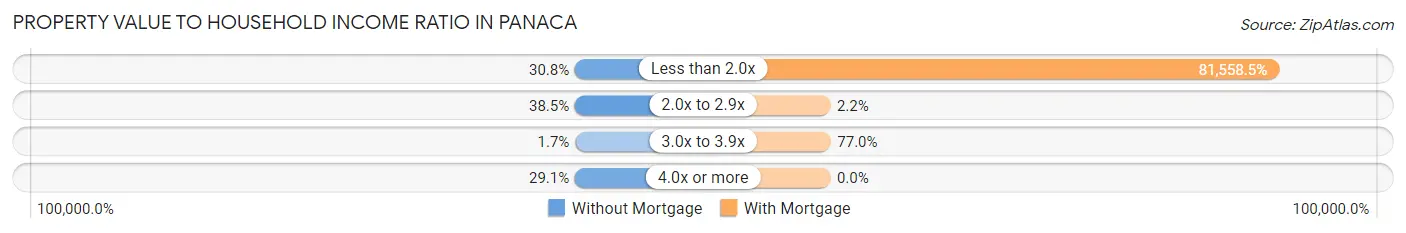
| Value-to-Income Ratio | Without Mortgage | With Mortgage |
| Less than 2.0x | 36 (30.8%) | 110,104 (81,558.5%) |
| 2.0x to 2.9x | 45 (38.5%) | 3 (2.2%) |
| 3.0x to 3.9x | 2 (1.7%) | 104 (77.0%) |
| 4.0x or more | 34 (29.1%) | 0 (0.0%) |
| Total | 117 (100.0%) | 135 (100.0%) |
Real Estate Taxes by Mortgage Status in Panaca
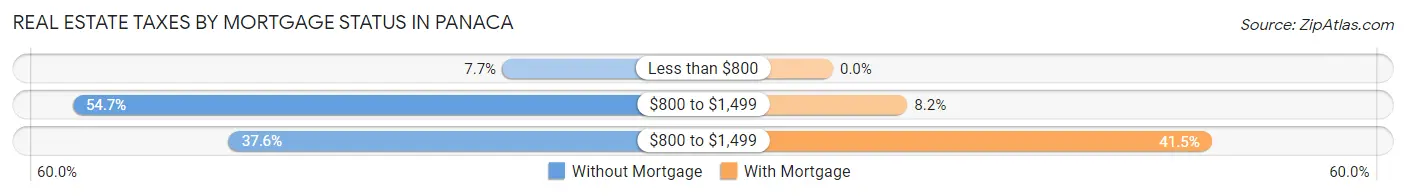
| Property Taxes | Without Mortgage | With Mortgage |
| Less than $800 | 9 (7.7%) | 0 (0.0%) |
| $800 to $1,499 | 64 (54.7%) | 11 (8.2%) |
| $800 to $1,499 | 44 (37.6%) | 56 (41.5%) |
| Total | 117 (100.0%) | 135 (100.0%) |
Health & Disability in Panaca
Health Insurance Coverage by Age in Panaca
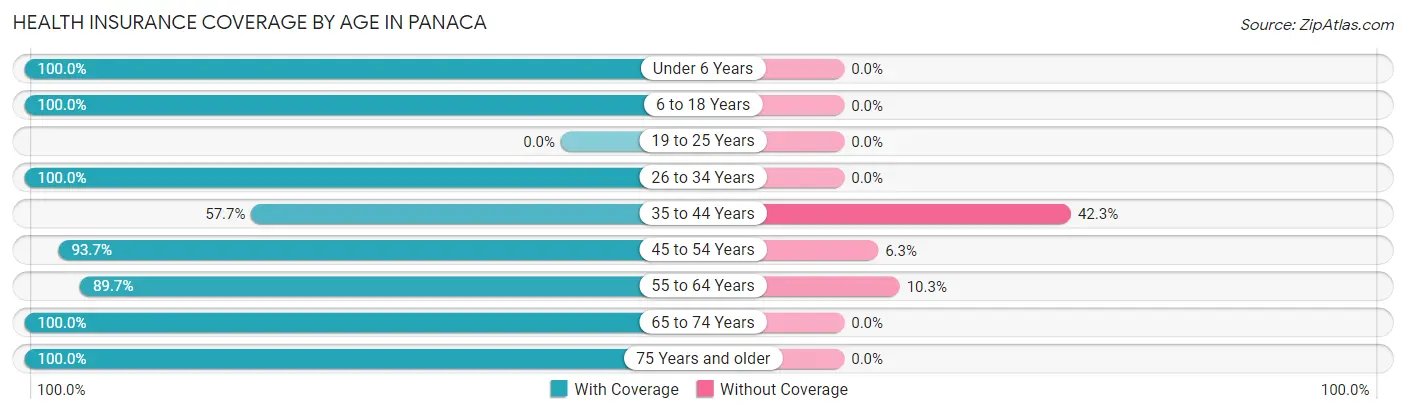
| Age Bracket | With Coverage | Without Coverage |
| Under 6 Years | 124 (100.0%) | 0 (0.0%) |
| 6 to 18 Years | 252 (100.0%) | 0 (0.0%) |
| 19 to 25 Years | 0 (0.0%) | 0 (0.0%) |
| 26 to 34 Years | 164 (100.0%) | 0 (0.0%) |
| 35 to 44 Years | 56 (57.7%) | 41 (42.3%) |
| 45 to 54 Years | 148 (93.7%) | 10 (6.3%) |
| 55 to 64 Years | 78 (89.7%) | 9 (10.3%) |
| 65 to 74 Years | 81 (100.0%) | 0 (0.0%) |
| 75 Years and older | 76 (100.0%) | 0 (0.0%) |
| Total | 979 (94.2%) | 60 (5.8%) |
Health Insurance Coverage by Citizenship Status in Panaca
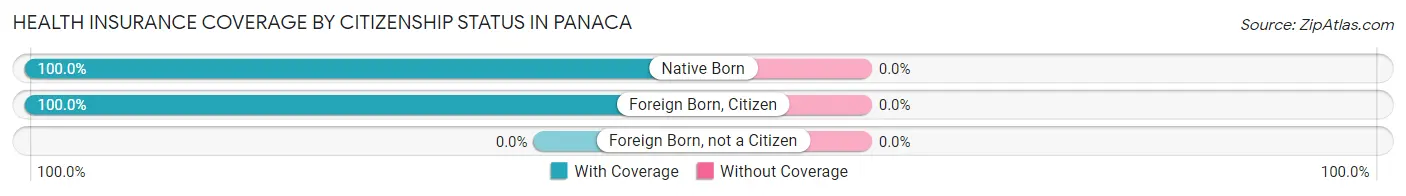
| Citizenship Status | With Coverage | Without Coverage |
| Native Born | 124 (100.0%) | 0 (0.0%) |
| Foreign Born, Citizen | 252 (100.0%) | 0 (0.0%) |
| Foreign Born, not a Citizen | 0 (0.0%) | 0 (0.0%) |
Health Insurance Coverage by Household Income in Panaca
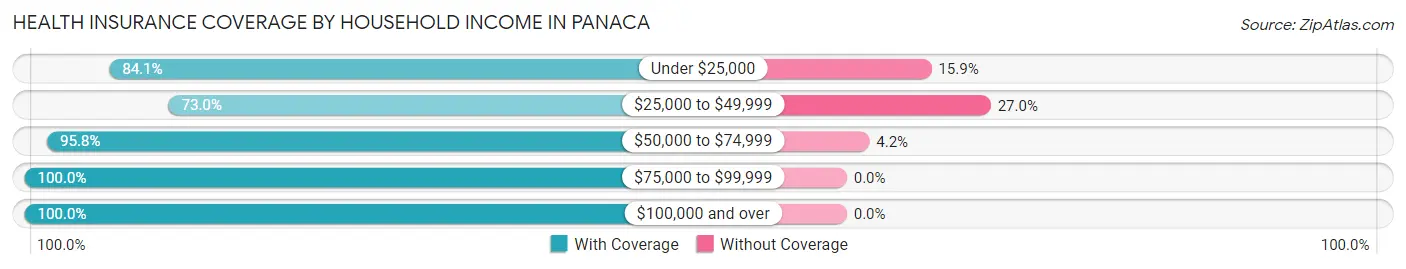
| Household Income | With Coverage | Without Coverage |
| Under $25,000 | 53 (84.1%) | 10 (15.9%) |
| $25,000 to $49,999 | 111 (73.0%) | 41 (27.0%) |
| $50,000 to $74,999 | 204 (95.8%) | 9 (4.2%) |
| $75,000 to $99,999 | 79 (100.0%) | 0 (0.0%) |
| $100,000 and over | 532 (100.0%) | 0 (0.0%) |
Public vs Private Health Insurance Coverage by Age in Panaca
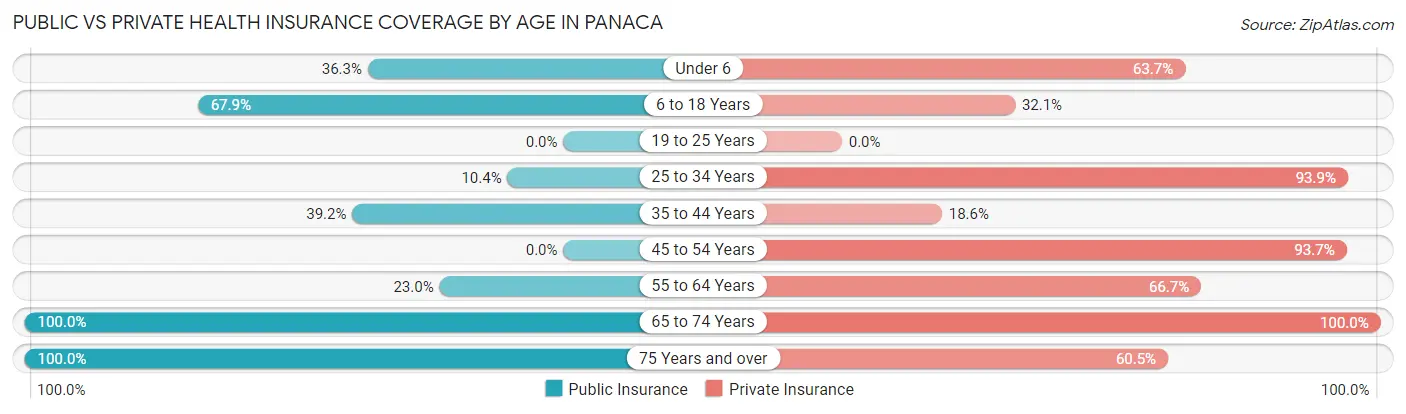
| Age Bracket | Public Insurance | Private Insurance |
| Under 6 | 45 (36.3%) | 79 (63.7%) |
| 6 to 18 Years | 171 (67.9%) | 81 (32.1%) |
| 19 to 25 Years | 0 (0.0%) | 0 (0.0%) |
| 25 to 34 Years | 17 (10.4%) | 154 (93.9%) |
| 35 to 44 Years | 38 (39.2%) | 18 (18.6%) |
| 45 to 54 Years | 0 (0.0%) | 148 (93.7%) |
| 55 to 64 Years | 20 (23.0%) | 58 (66.7%) |
| 65 to 74 Years | 81 (100.0%) | 81 (100.0%) |
| 75 Years and over | 76 (100.0%) | 46 (60.5%) |
| Total | 448 (43.1%) | 665 (64.0%) |
Disability Status by Sex by Age in Panaca
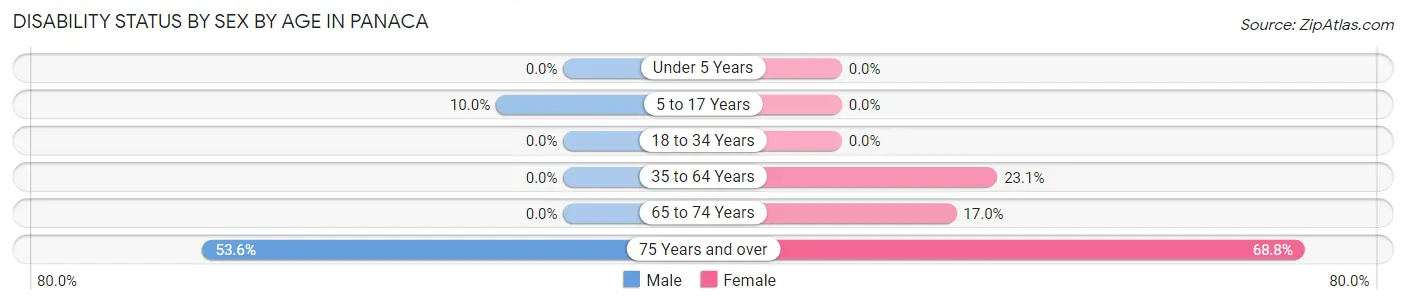
| Age Bracket | Male | Female |
| Under 5 Years | 0 (0.0%) | 0 (0.0%) |
| 5 to 17 Years | 10 (10.0%) | 0 (0.0%) |
| 18 to 34 Years | 0 (0.0%) | 0 (0.0%) |
| 35 to 64 Years | 0 (0.0%) | 39 (23.1%) |
| 65 to 74 Years | 0 (0.0%) | 8 (17.0%) |
| 75 Years and over | 15 (53.6%) | 33 (68.8%) |
Disability Class by Sex by Age in Panaca
Disability Class: Hearing Difficulty
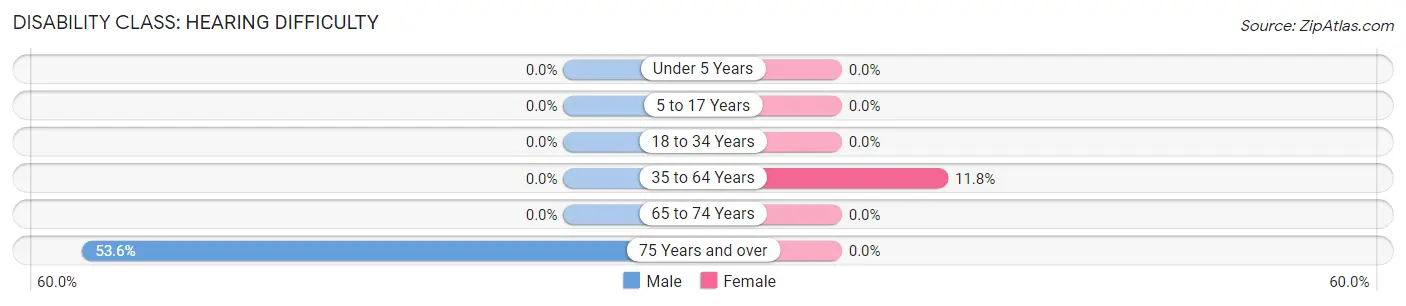
| Age Bracket | Male | Female |
| Under 5 Years | 0 (0.0%) | 0 (0.0%) |
| 5 to 17 Years | 0 (0.0%) | 0 (0.0%) |
| 18 to 34 Years | 0 (0.0%) | 0 (0.0%) |
| 35 to 64 Years | 0 (0.0%) | 20 (11.8%) |
| 65 to 74 Years | 0 (0.0%) | 0 (0.0%) |
| 75 Years and over | 15 (53.6%) | 0 (0.0%) |
Disability Class: Vision Difficulty
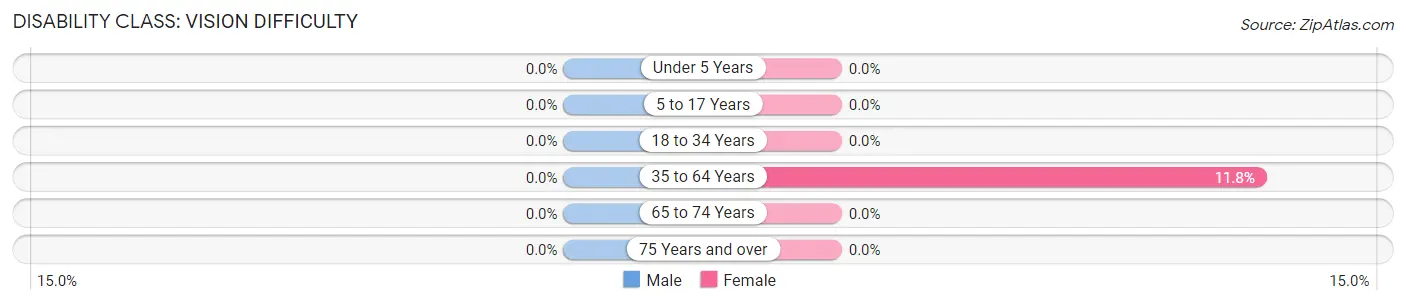
| Age Bracket | Male | Female |
| Under 5 Years | 0 (0.0%) | 0 (0.0%) |
| 5 to 17 Years | 0 (0.0%) | 0 (0.0%) |
| 18 to 34 Years | 0 (0.0%) | 0 (0.0%) |
| 35 to 64 Years | 0 (0.0%) | 20 (11.8%) |
| 65 to 74 Years | 0 (0.0%) | 0 (0.0%) |
| 75 Years and over | 0 (0.0%) | 0 (0.0%) |
Disability Class: Cognitive Difficulty
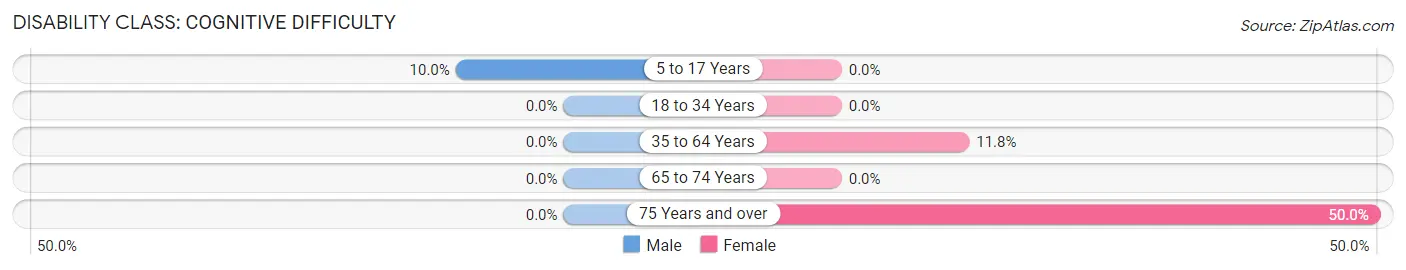
| Age Bracket | Male | Female |
| 5 to 17 Years | 10 (10.0%) | 0 (0.0%) |
| 18 to 34 Years | 0 (0.0%) | 0 (0.0%) |
| 35 to 64 Years | 0 (0.0%) | 20 (11.8%) |
| 65 to 74 Years | 0 (0.0%) | 0 (0.0%) |
| 75 Years and over | 0 (0.0%) | 24 (50.0%) |
Disability Class: Ambulatory Difficulty
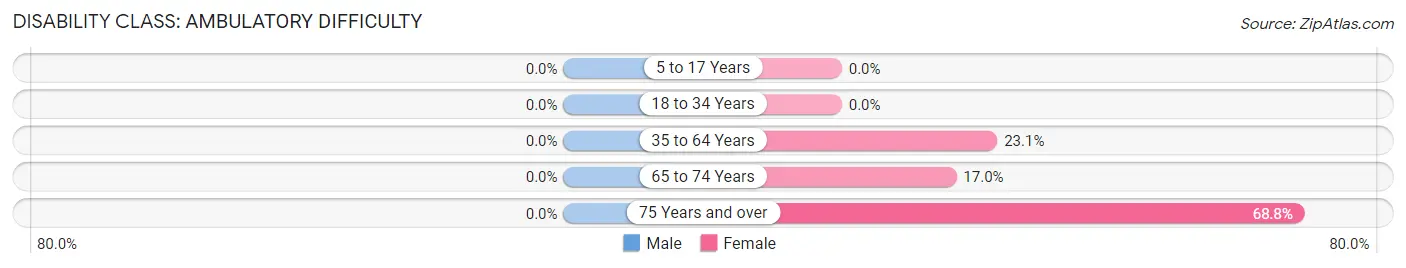
| Age Bracket | Male | Female |
| 5 to 17 Years | 0 (0.0%) | 0 (0.0%) |
| 18 to 34 Years | 0 (0.0%) | 0 (0.0%) |
| 35 to 64 Years | 0 (0.0%) | 39 (23.1%) |
| 65 to 74 Years | 0 (0.0%) | 8 (17.0%) |
| 75 Years and over | 0 (0.0%) | 33 (68.8%) |
Disability Class: Self-Care Difficulty
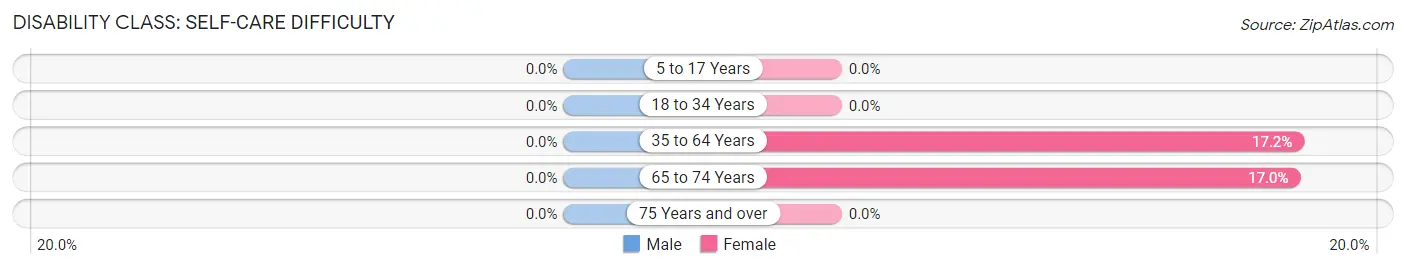
| Age Bracket | Male | Female |
| 5 to 17 Years | 0 (0.0%) | 0 (0.0%) |
| 18 to 34 Years | 0 (0.0%) | 0 (0.0%) |
| 35 to 64 Years | 0 (0.0%) | 29 (17.2%) |
| 65 to 74 Years | 0 (0.0%) | 8 (17.0%) |
| 75 Years and over | 0 (0.0%) | 0 (0.0%) |
Technology Access in Panaca
Computing Device Access in Panaca
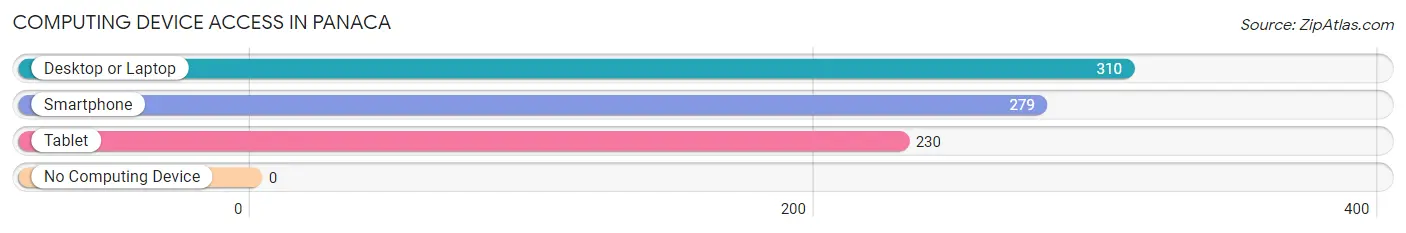
| Device Type | # Households | % Households |
| Desktop or Laptop | 310 | 88.8% |
| Smartphone | 279 | 79.9% |
| Tablet | 230 | 65.9% |
| No Computing Device | 0 | 0.0% |
| Total | 349 | 100.0% |
Internet Access in Panaca
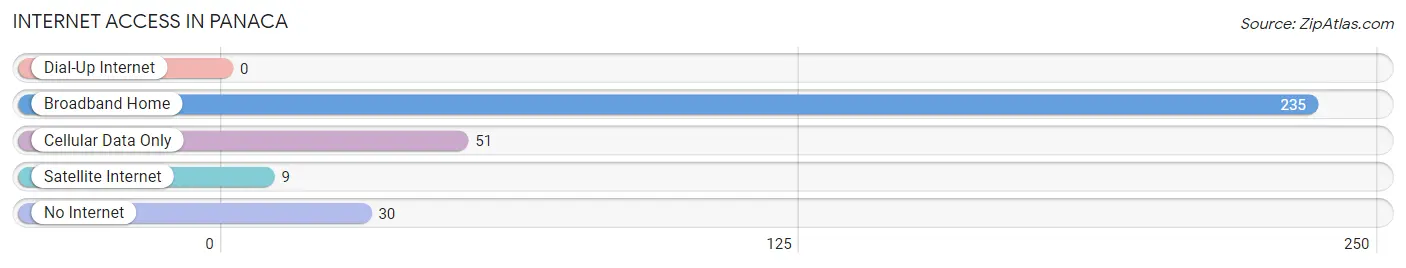
| Internet Type | # Households | % Households |
| Dial-Up Internet | 0 | 0.0% |
| Broadband Home | 235 | 67.3% |
| Cellular Data Only | 51 | 14.6% |
| Satellite Internet | 9 | 2.6% |
| No Internet | 30 | 8.6% |
| Total | 349 | 100.0% |
Panaca Summary
Panaca is a small town located in Lincoln County, Nevada, United States. It is situated in the southeastern part of the state, about 60 miles northeast of Las Vegas. The town was founded in 1864 and is the oldest settlement in Lincoln County. The population was 1,130 at the 2010 census.
Geography
Panaca is located at 37°45'17" North, 114°25'17" West (37.754722, -114.421389). It is situated in the southeastern part of Nevada, about 60 miles northeast of Las Vegas. The town is located in the Meadow Valley Wash, a large valley that runs through the area. The elevation of the town is 4,890 feet (1,490 m).
The climate in Panaca is semi-arid, with hot summers and cold winters. The average annual temperature is 57°F (14°C). The average annual precipitation is 8.5 inches (216 mm).
Economy
The economy of Panaca is largely based on agriculture and mining. The town is home to several large farms, which produce hay, alfalfa, and other crops. The town is also home to several mining operations, including copper, gold, and silver.
The town is also home to several small businesses, including restaurants, stores, and other services.
Demographics
As of the 2010 census, there were 1,130 people, 441 households, and 305 families residing in the town. The population density was 545.3 people per square mile (210.9/km2). There were 517 housing units at an average density of 246.3 per square mile (95.1/km2). The racial makeup of the town was 91.2% White, 0.2% African American, 0.7% Native American, 0.2% Asian, 0.1% Pacific Islander, 5.3% from other races, and 2.3% from two or more races. Hispanic or Latino of any race were 11.2% of the population.
There were 441 households, out of which 28.2% had children under the age of 18 living with them, 54.2% were married couples living together, 8.6% had a female householder with no husband present, and 32.2% were non-families. 28.2% of all households were made up of individuals, and 13.2% had someone living alone who was 65 years of age or older. The average household size was 2.55 and the average family size was 3.14.
In the town, the population was spread out, with 25.7% under the age of 18, 6.7% from 18 to 24, 22.2% from 25 to 44, 28.2% from 45 to 64, and 17.2% who were 65 years of age or older. The median age was 41 years. For every 100 females, there were 97.2 males. For every 100 females age 18 and over, there were 94.2 males.
The median income for a household in the town was $37,500, and the median income for a family was $45,000. Males had a median income of $35,000 versus $21,250 for females. The per capita income for the town was $17,845. About 8.2% of families and 10.2% of the population were below the poverty line, including 11.2% of those under age 18 and 8.2% of those age 65 or over.
Common Questions
What is Per Capita Income in Panaca?
Per Capita income in Panaca is $30,902.
What is the Median Family Income in Panaca?
Median Family Income in Panaca is $92,500.
What is the Median Household income in Panaca?
Median Household Income in Panaca is $68,073.
What is Income or Wage Gap in Panaca?
Income or Wage Gap in Panaca is 55.1%.
Women in Panaca earn 44.9 cents for every dollar earned by a man.
What is Inequality or Gini Index in Panaca?
Inequality or Gini Index in Panaca is 0.41.
What is the Total Population of Panaca?
Total Population of Panaca is 1,039.
What is the Total Male Population of Panaca?
Total Male Population of Panaca is 446.
What is the Total Female Population of Panaca?
Total Female Population of Panaca is 593.
What is the Ratio of Males per 100 Females in Panaca?
There are 75.21 Males per 100 Females in Panaca.
What is the Ratio of Females per 100 Males in Panaca?
There are 132.96 Females per 100 Males in Panaca.
What is the Median Population Age in Panaca?
Median Population Age in Panaca is 34.3 Years.
What is the Average Family Size in Panaca
Average Family Size in Panaca is 3.5 People.
What is the Average Household Size in Panaca
Average Household Size in Panaca is 3.0 People.
How Large is the Labor Force in Panaca?
There are 343 People in the Labor Forcein in Panaca.
What is the Percentage of People in the Labor Force in Panaca?
48.2% of People are in the Labor Force in Panaca.