Cal Nev Ari, NV Map & Demographics
Cal Nev Ari Map
Cal Nev Ari Overview
$21,953
PER CAPITA INCOME
$38,929
AVG HOUSEHOLD INCOME
0.33
INEQUALITY / GINI INDEX
254
TOTAL POPULATION
132
MALE POPULATION
122
FEMALE POPULATION
108.20
MALES / 100 FEMALES
92.42
FEMALES / 100 MALES
69.4
MEDIAN AGE
2.4
AVG FAMILY SIZE
1.7
AVG HOUSEHOLD SIZE
25
LABOR FORCE [ PEOPLE ]
10.3%
PERCENT IN LABOR FORCE
44.0%
UNEMPLOYMENT RATE
Cal Nev Ari Zip Codes
Cal Nev Ari Area Codes
Income in Cal Nev Ari
Income Overview in Cal Nev Ari
| Characteristic | Number | Measure |
| Per Capita Income | 254 | $21,953 |
| Median Family Income | 55 | $0 |
| Mean Family Income | 55 | $30,493 |
| Median Household Income | 148 | $38,929 |
| Mean Household Income | 148 | $36,628 |
| Income Deficit | 55 | $0 |
| Wage / Income Gap (%) | 254 | 0.00% |
| Wage / Income Gap ($) | 254 | 100.00¢ per $1 |
| Gini / Inequality Index | 254 | 0.33 |
Earnings by Sex in Cal Nev Ari
| Sex | Number | Average Earnings |
| Male | 8 (57.1%) | $0 |
| Female | 6 (42.9%) | $0 |
| Total | 14 (100.0%) | $0 |
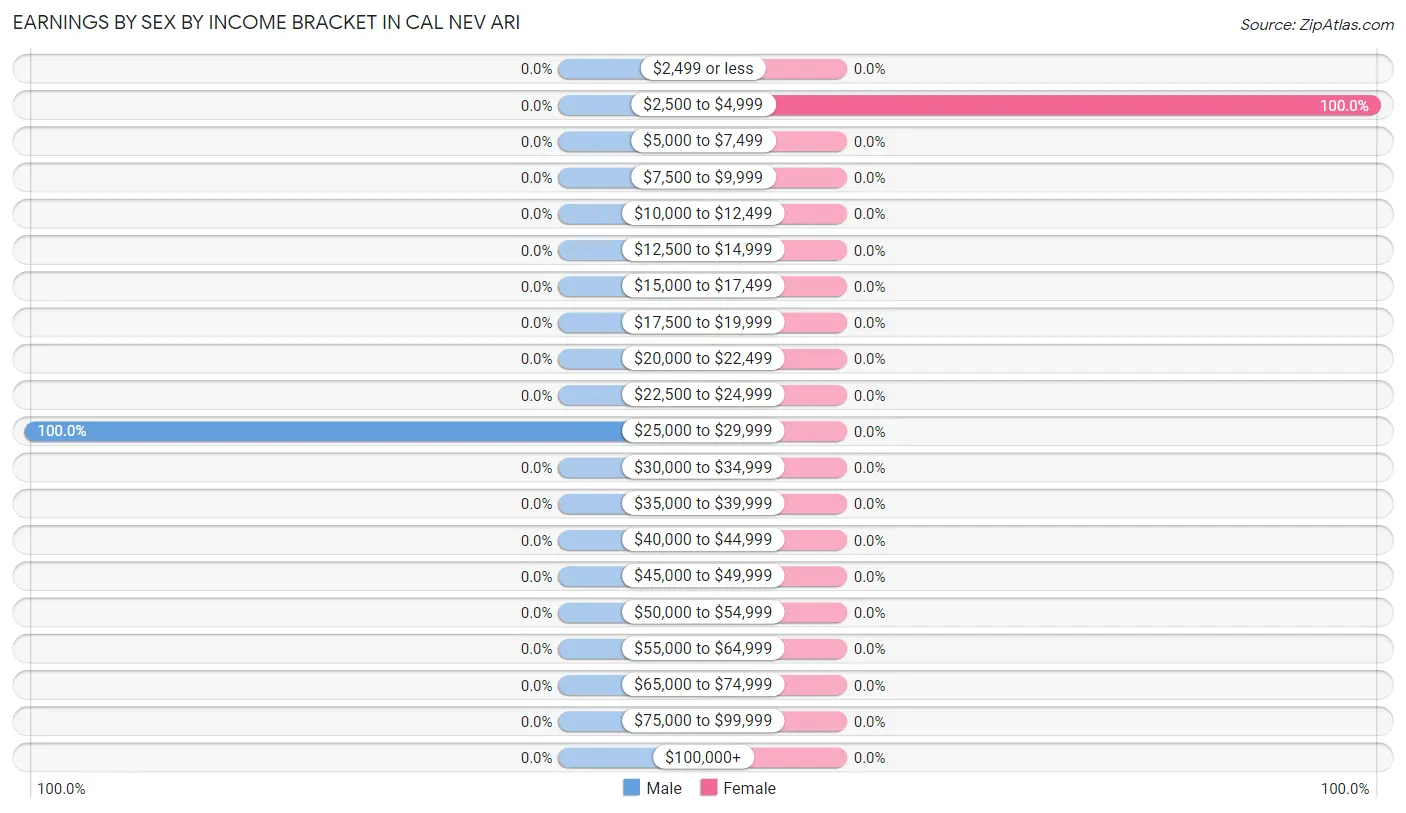
Earnings by Sex by Income Bracket in Cal Nev Ari
The most common earnings brackets in Cal Nev Ari are $25,000 to $29,999 for men (8 | 100.0%) and $2,500 to $4,999 for women (6 | 100.0%).
| Income | Male | Female |
| $2,499 or less | 0 (0.0%) | 0 (0.0%) |
| $2,500 to $4,999 | 0 (0.0%) | 6 (100.0%) |
| $5,000 to $7,499 | 0 (0.0%) | 0 (0.0%) |
| $7,500 to $9,999 | 0 (0.0%) | 0 (0.0%) |
| $10,000 to $12,499 | 0 (0.0%) | 0 (0.0%) |
| $12,500 to $14,999 | 0 (0.0%) | 0 (0.0%) |
| $15,000 to $17,499 | 0 (0.0%) | 0 (0.0%) |
| $17,500 to $19,999 | 0 (0.0%) | 0 (0.0%) |
| $20,000 to $22,499 | 0 (0.0%) | 0 (0.0%) |
| $22,500 to $24,999 | 0 (0.0%) | 0 (0.0%) |
| $25,000 to $29,999 | 8 (100.0%) | 0 (0.0%) |
| $30,000 to $34,999 | 0 (0.0%) | 0 (0.0%) |
| $35,000 to $39,999 | 0 (0.0%) | 0 (0.0%) |
| $40,000 to $44,999 | 0 (0.0%) | 0 (0.0%) |
| $45,000 to $49,999 | 0 (0.0%) | 0 (0.0%) |
| $50,000 to $54,999 | 0 (0.0%) | 0 (0.0%) |
| $55,000 to $64,999 | 0 (0.0%) | 0 (0.0%) |
| $65,000 to $74,999 | 0 (0.0%) | 0 (0.0%) |
| $75,000 to $99,999 | 0 (0.0%) | 0 (0.0%) |
| $100,000+ | 0 (0.0%) | 0 (0.0%) |
| Total | 8 (100.0%) | 6 (100.0%) |
Earnings by Sex by Educational Attainment in Cal Nev Ari
| Educational Attainment | Male Income | Female Income |
| Less than High School | - | - |
| High School Diploma | - | - |
| College or Associate's Degree | - | - |
| Bachelor's Degree | - | - |
| Graduate Degree | - | - |
| Total | - | - |
Family Income in Cal Nev Ari
Family Income Brackets in Cal Nev Ari
According to the Cal Nev Ari family income data, there are 17 families falling into the $50,000 to $74,999 income range, which is the most common income bracket and makes up 30.9% of all families.
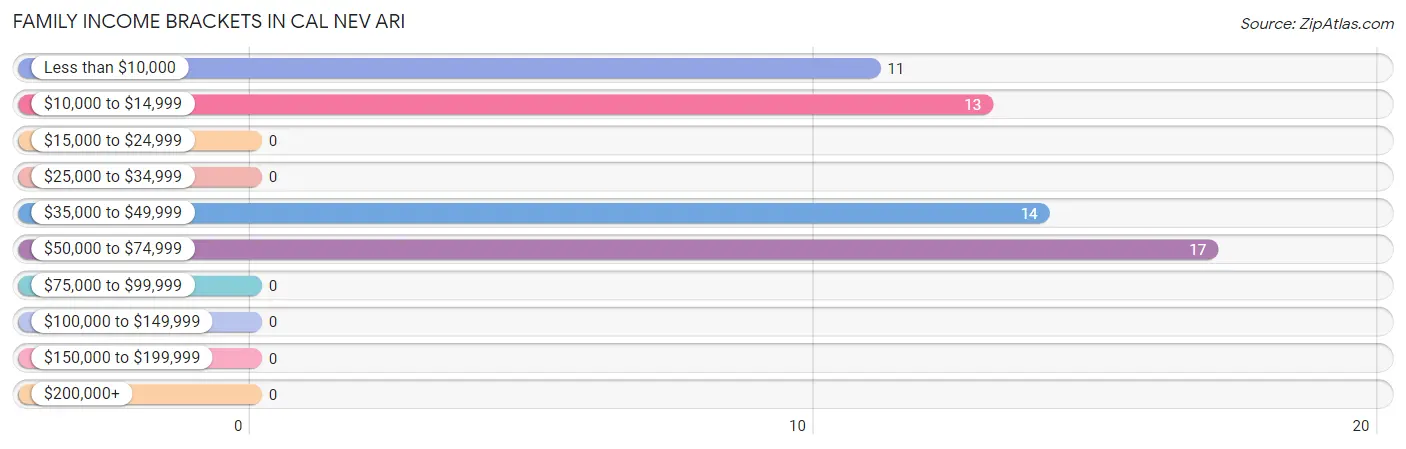
| Income Bracket | # Families | % Families |
| Less than $10,000 | 11 | 20.0% |
| $10,000 to $14,999 | 13 | 23.6% |
| $15,000 to $24,999 | 0 | 0.0% |
| $25,000 to $34,999 | 0 | 0.0% |
| $35,000 to $49,999 | 14 | 25.5% |
| $50,000 to $74,999 | 17 | 30.9% |
| $75,000 to $99,999 | 0 | 0.0% |
| $100,000 to $149,999 | 0 | 0.0% |
| $150,000 to $199,999 | 0 | 0.0% |
| $200,000+ | 0 | 0.0% |
Family Income by Famaliy Size in Cal Nev Ari
2-person families (31 | 56.4%) account for the highest median family income in Cal Nev Ari with $53,125 per family, while 2-person families (31 | 56.4%) have the highest median income of $26,562 per family member.
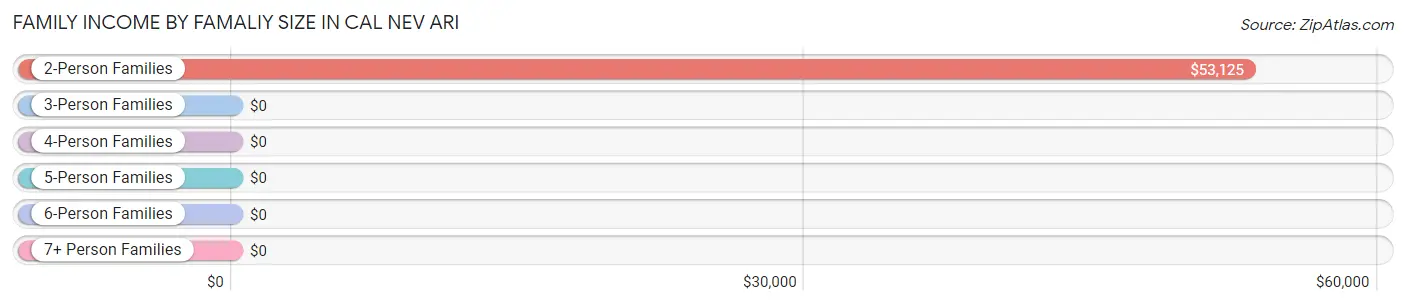
| Income Bracket | # Families | Median Income |
| 2-Person Families | 31 (56.4%) | $53,125 |
| 3-Person Families | 24 (43.6%) | $0 |
| 4-Person Families | 0 (0.0%) | $0 |
| 5-Person Families | 0 (0.0%) | $0 |
| 6-Person Families | 0 (0.0%) | $0 |
| 7+ Person Families | 0 (0.0%) | $0 |
| Total | 55 (100.0%) | $0 |
Family Income by Number of Earners in Cal Nev Ari
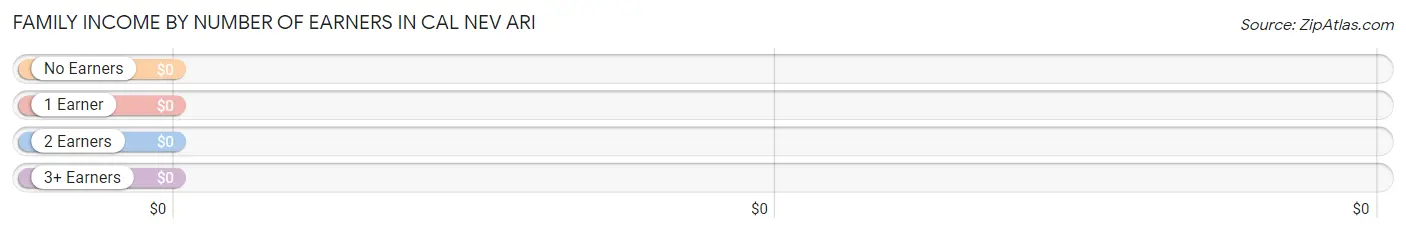
| Number of Earners | # Families | Median Income |
| No Earners | 42 (76.4%) | $0 |
| 1 Earner | 13 (23.6%) | $0 |
| 2 Earners | 0 (0.0%) | $0 |
| 3+ Earners | 0 (0.0%) | $0 |
| Total | 55 (100.0%) | $0 |
Household Income in Cal Nev Ari
Household Income Brackets in Cal Nev Ari
With 47 households falling in the category, the $50,000 to $74,999 income range is the most frequent in Cal Nev Ari, accounting for 31.8% of all households.
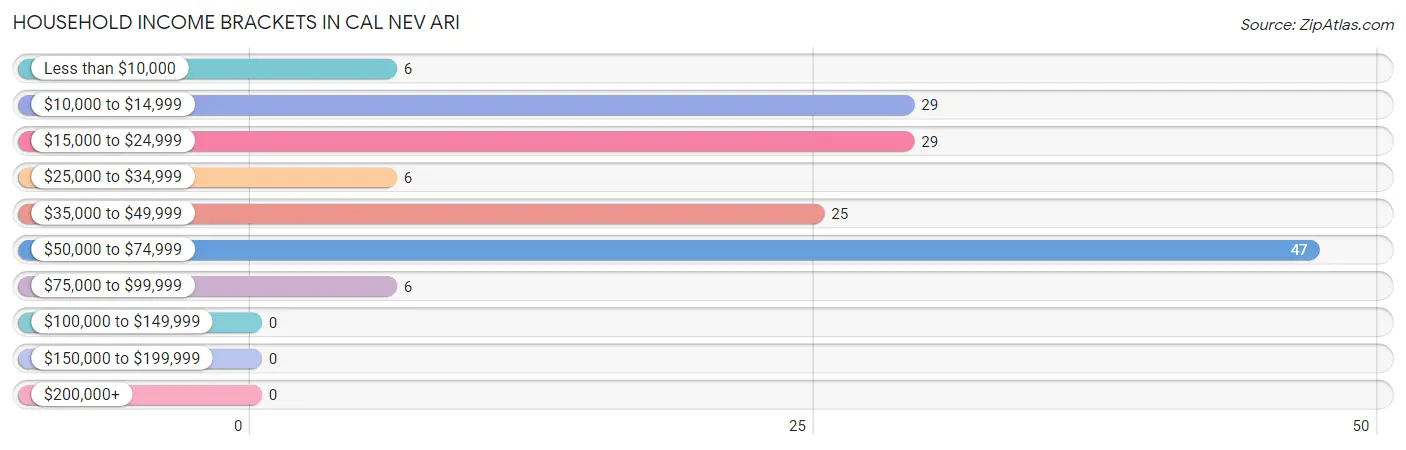
| Income Bracket | # Households | % Households |
| Less than $10,000 | 6 | 4.1% |
| $10,000 to $14,999 | 29 | 19.6% |
| $15,000 to $24,999 | 29 | 19.6% |
| $25,000 to $34,999 | 6 | 4.1% |
| $35,000 to $49,999 | 25 | 16.9% |
| $50,000 to $74,999 | 47 | 31.8% |
| $75,000 to $99,999 | 6 | 4.1% |
| $100,000 to $149,999 | 0 | 0.0% |
| $150,000 to $199,999 | 0 | 0.0% |
| $200,000+ | 0 | 0.0% |
Household Income by Householder Age in Cal Nev Ari
The median household income in Cal Nev Ari is $38,929, with the highest median household income of $43,977 found in the 65+ years age bracket for the primary householder. A total of 105 households (71.0%) fall into this category.
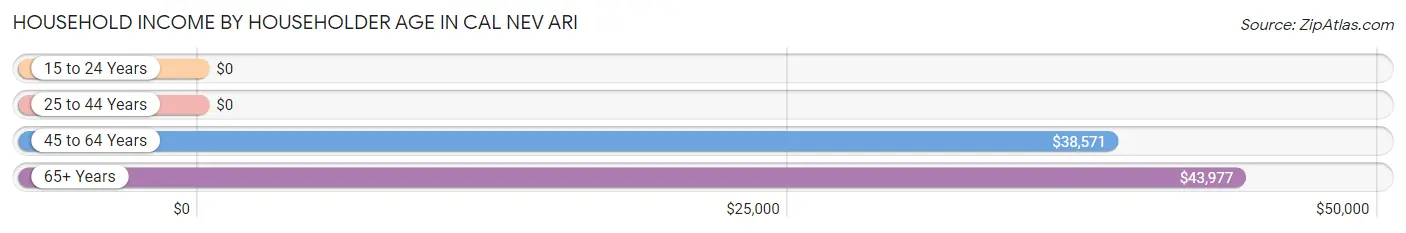
| Income Bracket | # Households | Median Income |
| 15 to 24 Years | 0 (0.0%) | $0 |
| 25 to 44 Years | 11 (7.4%) | $0 |
| 45 to 64 Years | 32 (21.6%) | $38,571 |
| 65+ Years | 105 (71.0%) | $43,977 |
| Total | 148 (100.0%) | $38,929 |
Poverty in Cal Nev Ari
Income Below Poverty by Sex and Age in Cal Nev Ari
With 50.0% poverty level for males and 27.1% for females among the residents of Cal Nev Ari, 5 year old males and under 5 year old females are the most vulnerable to poverty, with 7 males (100.0%) and 4 females (100.0%) in their respective age groups living below the poverty level.
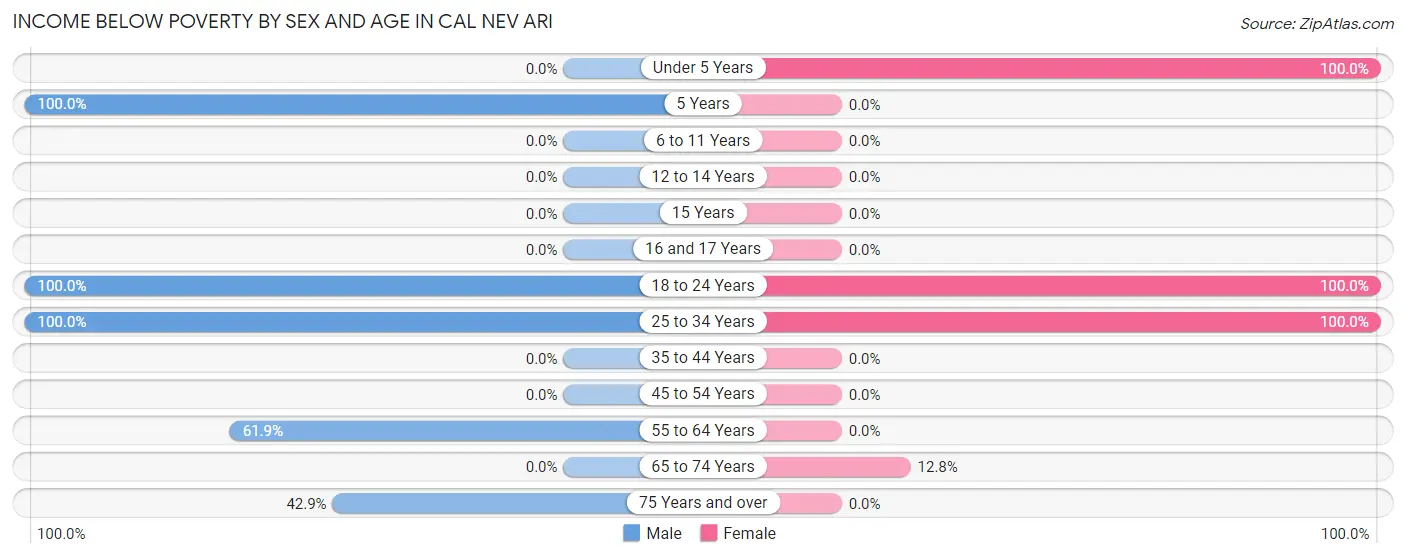
| Age Bracket | Male | Female |
| Under 5 Years | 0 (0.0%) | 4 (100.0%) |
| 5 Years | 7 (100.0%) | 0 (0.0%) |
| 6 to 11 Years | 0 (0.0%) | 0 (0.0%) |
| 12 to 14 Years | 0 (0.0%) | 0 (0.0%) |
| 15 Years | 0 (0.0%) | 0 (0.0%) |
| 16 and 17 Years | 0 (0.0%) | 0 (0.0%) |
| 18 to 24 Years | 14 (100.0%) | 14 (100.0%) |
| 25 to 34 Years | 11 (100.0%) | 9 (100.0%) |
| 35 to 44 Years | 0 (0.0%) | 0 (0.0%) |
| 45 to 54 Years | 0 (0.0%) | 0 (0.0%) |
| 55 to 64 Years | 13 (61.9%) | 0 (0.0%) |
| 65 to 74 Years | 0 (0.0%) | 6 (12.8%) |
| 75 Years and over | 21 (42.9%) | 0 (0.0%) |
| Total | 66 (50.0%) | 33 (27.1%) |
Income Above Poverty by Sex and Age in Cal Nev Ari
According to the poverty statistics in Cal Nev Ari, males aged 65 to 74 years and females aged 55 to 64 years are the age groups that are most secure financially, with 100.0% of males and 100.0% of females in these age groups living above the poverty line.
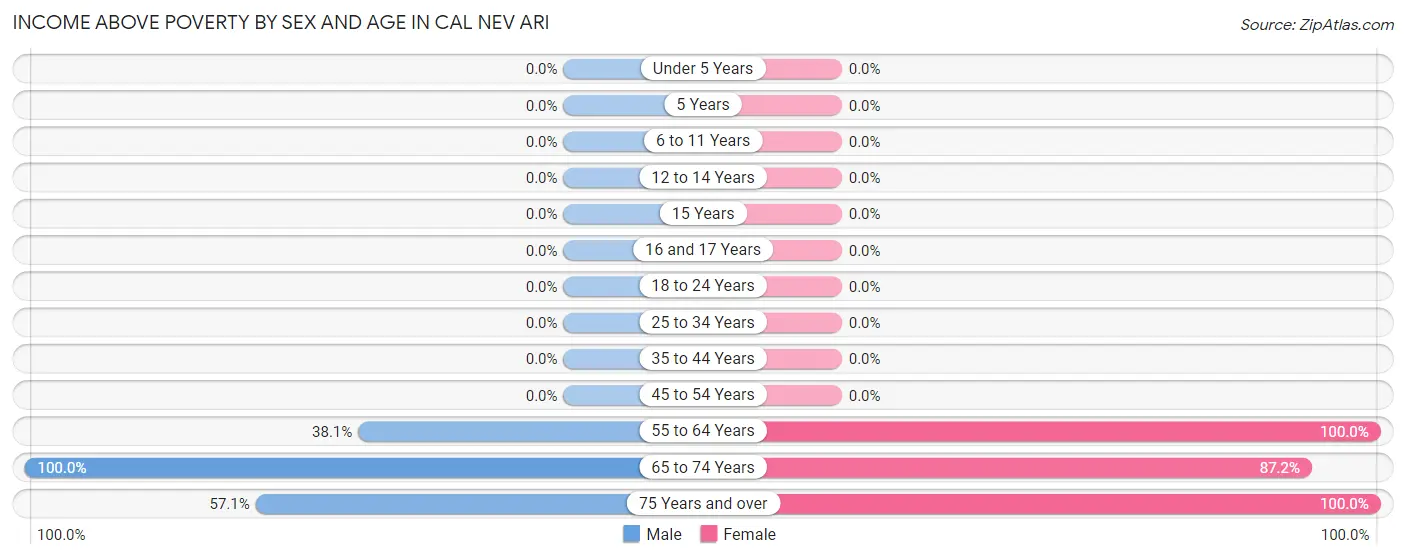
| Age Bracket | Male | Female |
| Under 5 Years | 0 (0.0%) | 0 (0.0%) |
| 5 Years | 0 (0.0%) | 0 (0.0%) |
| 6 to 11 Years | 0 (0.0%) | 0 (0.0%) |
| 12 to 14 Years | 0 (0.0%) | 0 (0.0%) |
| 15 Years | 0 (0.0%) | 0 (0.0%) |
| 16 and 17 Years | 0 (0.0%) | 0 (0.0%) |
| 18 to 24 Years | 0 (0.0%) | 0 (0.0%) |
| 25 to 34 Years | 0 (0.0%) | 0 (0.0%) |
| 35 to 44 Years | 0 (0.0%) | 0 (0.0%) |
| 45 to 54 Years | 0 (0.0%) | 0 (0.0%) |
| 55 to 64 Years | 8 (38.1%) | 19 (100.0%) |
| 65 to 74 Years | 30 (100.0%) | 41 (87.2%) |
| 75 Years and over | 28 (57.1%) | 29 (100.0%) |
| Total | 66 (50.0%) | 89 (73.0%) |
Income Below Poverty Among Married-Couple Families in Cal Nev Ari
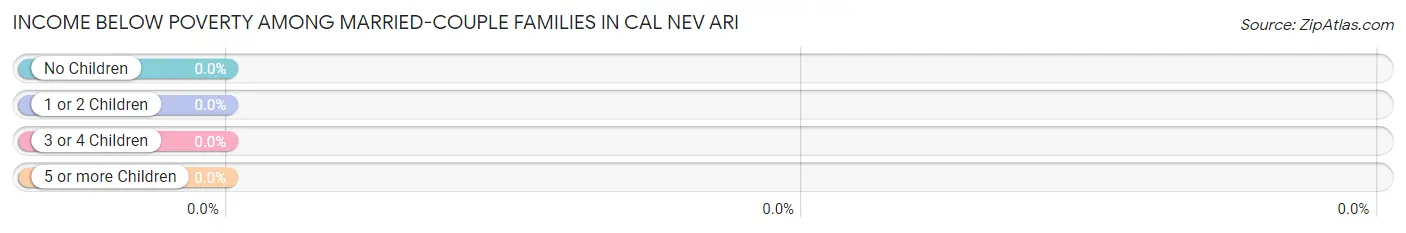
| Children | Above Poverty | Below Poverty |
| No Children | 20 (100.0%) | 0 (0.0%) |
| 1 or 2 Children | 0 (0.0%) | 0 (0.0%) |
| 3 or 4 Children | 0 (0.0%) | 0 (0.0%) |
| 5 or more Children | 0 (0.0%) | 0 (0.0%) |
| Total | 20 (100.0%) | 0 (0.0%) |
Income Below Poverty Among Single-Parent Households in Cal Nev Ari
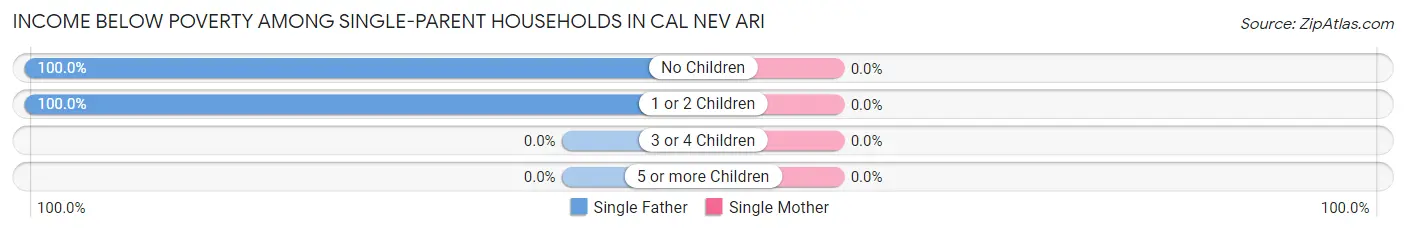
| Children | Single Father | Single Mother |
| No Children | 13 (100.0%) | 0 (0.0%) |
| 1 or 2 Children | 11 (100.0%) | 0 (0.0%) |
| 3 or 4 Children | 0 (0.0%) | 0 (0.0%) |
| 5 or more Children | 0 (0.0%) | 0 (0.0%) |
| Total | 24 (100.0%) | 0 (0.0%) |
Income Below Poverty Among Married-Couple vs Single-Parent Households in Cal Nev Ari
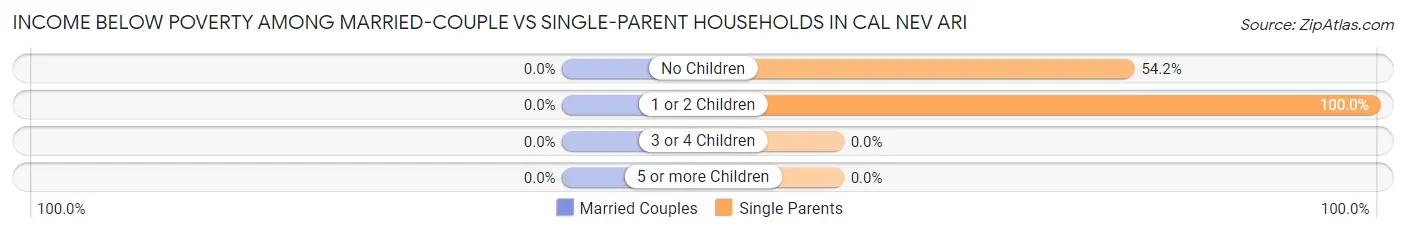
| Children | Married-Couple Families | Single-Parent Households |
| No Children | 0 (0.0%) | 13 (54.2%) |
| 1 or 2 Children | 0 (0.0%) | 11 (100.0%) |
| 3 or 4 Children | 0 (0.0%) | 0 (0.0%) |
| 5 or more Children | 0 (0.0%) | 0 (0.0%) |
| Total | 0 (0.0%) | 24 (68.6%) |
Race in Cal Nev Ari
The most populous races in Cal Nev Ari are White / Caucasian (207 | 81.5%), and Two or more Races (47 | 18.5%).
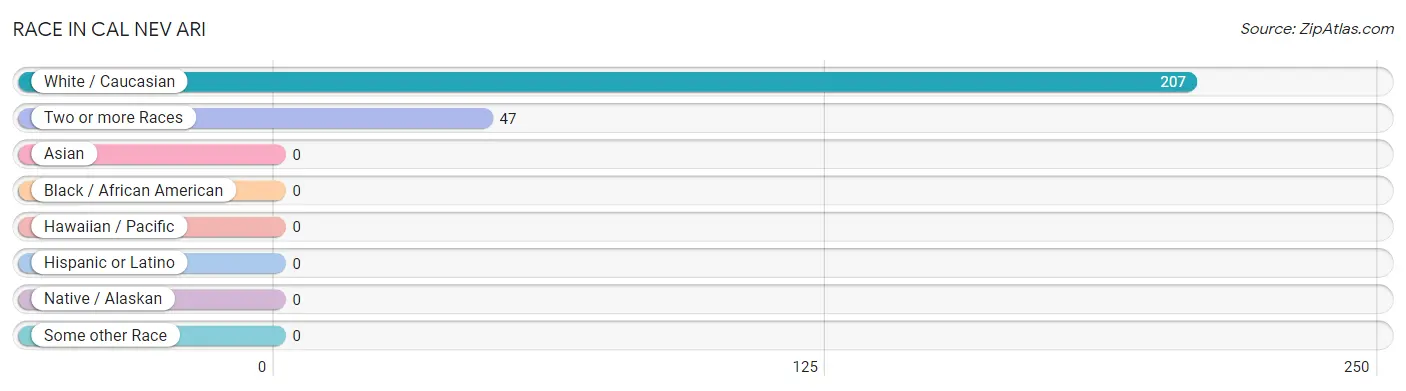
| Race | # Population | % Population |
| Asian | 0 | 0.0% |
| Black / African American | 0 | 0.0% |
| Hawaiian / Pacific | 0 | 0.0% |
| Hispanic or Latino | 0 | 0.0% |
| Native / Alaskan | 0 | 0.0% |
| White / Caucasian | 207 | 81.5% |
| Two or more Races | 47 | 18.5% |
| Some other Race | 0 | 0.0% |
| Total | 254 | 100.0% |
Ancestry in Cal Nev Ari
The most populous ancestries reported in Cal Nev Ari are German (53 | 20.9%), English (41 | 16.1%), French (17 | 6.7%), Danish (13 | 5.1%), and Swedish (13 | 5.1%), together accounting for 53.9% of all Cal Nev Ari residents.
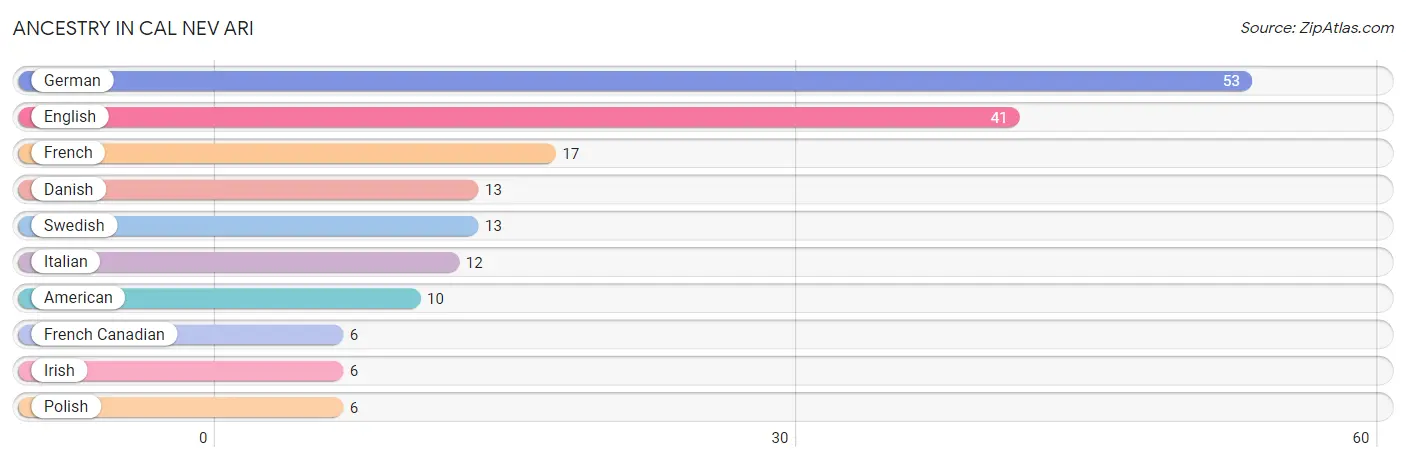
| Ancestry | # Population | % Population |
| American | 10 | 3.9% |
| Danish | 13 | 5.1% |
| English | 41 | 16.1% |
| French | 17 | 6.7% |
| French Canadian | 6 | 2.4% |
| German | 53 | 20.9% |
| Irish | 6 | 2.4% |
| Italian | 12 | 4.7% |
| Polish | 6 | 2.4% |
| Swedish | 13 | 5.1% | View All 10 Rows |
Immigrants in Cal Nev Ari

| Immigration Origin | # Population | % Population | View All 0 Rows |
Sex and Age in Cal Nev Ari
Sex and Age in Cal Nev Ari
The most populous age groups in Cal Nev Ari are 75 to 79 Years (29 | 22.0%) for men and 70 to 74 Years (28 | 23.0%) for women.
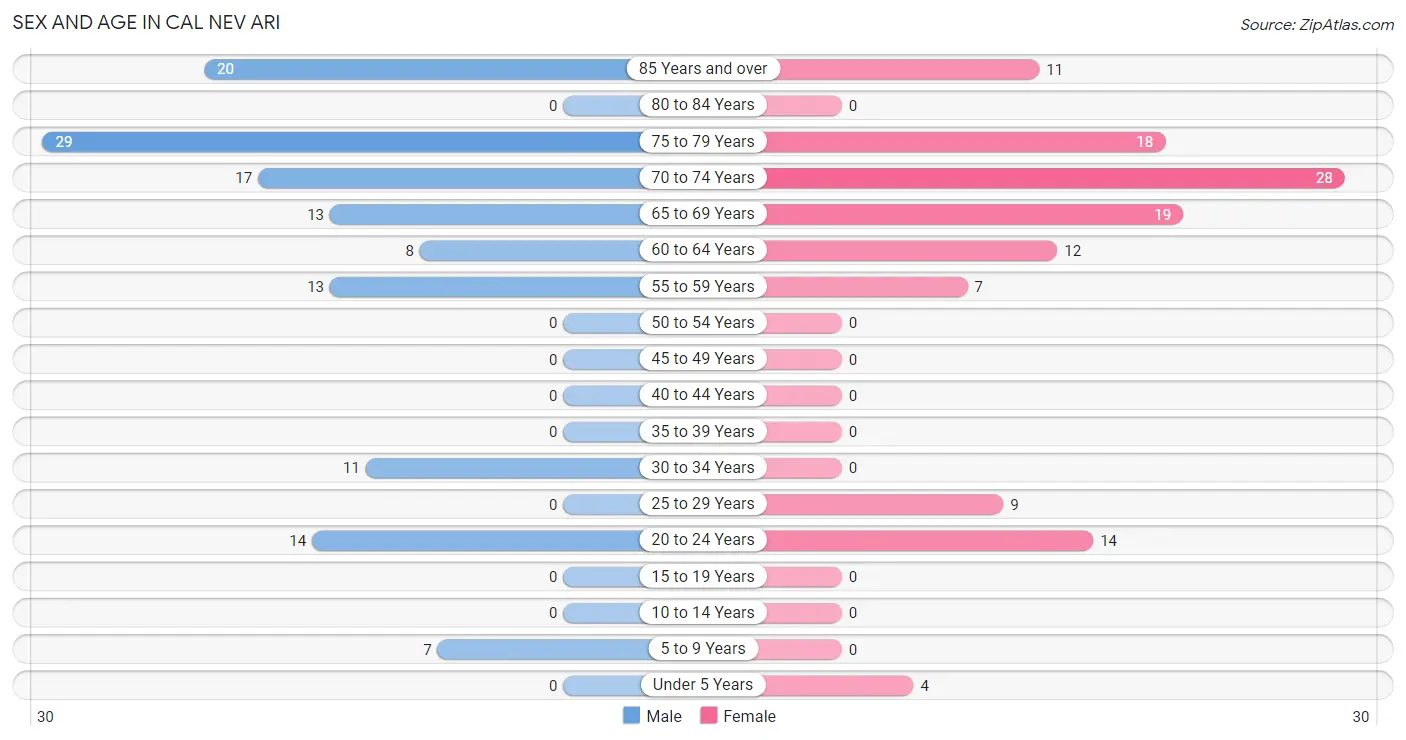
| Age Bracket | Male | Female |
| Under 5 Years | 0 (0.0%) | 4 (3.3%) |
| 5 to 9 Years | 7 (5.3%) | 0 (0.0%) |
| 10 to 14 Years | 0 (0.0%) | 0 (0.0%) |
| 15 to 19 Years | 0 (0.0%) | 0 (0.0%) |
| 20 to 24 Years | 14 (10.6%) | 14 (11.5%) |
| 25 to 29 Years | 0 (0.0%) | 9 (7.4%) |
| 30 to 34 Years | 11 (8.3%) | 0 (0.0%) |
| 35 to 39 Years | 0 (0.0%) | 0 (0.0%) |
| 40 to 44 Years | 0 (0.0%) | 0 (0.0%) |
| 45 to 49 Years | 0 (0.0%) | 0 (0.0%) |
| 50 to 54 Years | 0 (0.0%) | 0 (0.0%) |
| 55 to 59 Years | 13 (9.9%) | 7 (5.7%) |
| 60 to 64 Years | 8 (6.1%) | 12 (9.8%) |
| 65 to 69 Years | 13 (9.9%) | 19 (15.6%) |
| 70 to 74 Years | 17 (12.9%) | 28 (23.0%) |
| 75 to 79 Years | 29 (22.0%) | 18 (14.7%) |
| 80 to 84 Years | 0 (0.0%) | 0 (0.0%) |
| 85 Years and over | 20 (15.1%) | 11 (9.0%) |
| Total | 132 (100.0%) | 122 (100.0%) |
Families and Households in Cal Nev Ari
Median Family Size in Cal Nev Ari
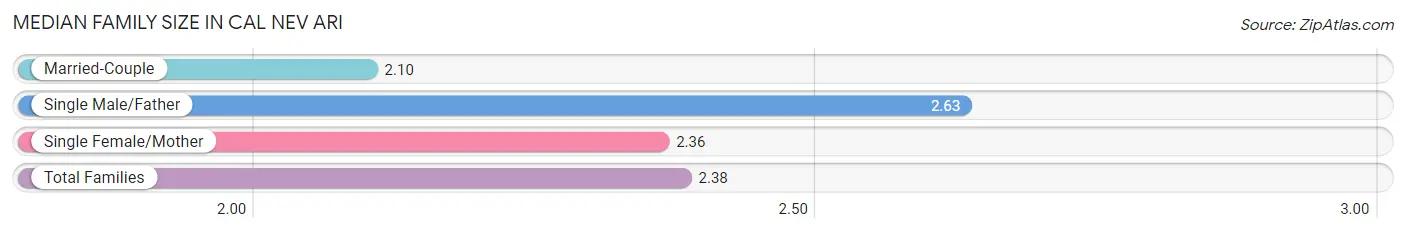
The median family size in Cal Nev Ari is 2.38 persons per family, with single male/father families (24 | 43.6%) accounting for the largest median family size of 2.63 persons per family. On the other hand, married-couple families (20 | 36.4%) represent the smallest median family size with 2.10 persons per family.
| Family Type | # Families | Family Size |
| Married-Couple | 20 (36.4%) | 2.10 |
| Single Male/Father | 24 (43.6%) | 2.63 |
| Single Female/Mother | 11 (20.0%) | 2.36 |
| Total Families | 55 (100.0%) | 2.38 |
Median Household Size in Cal Nev Ari
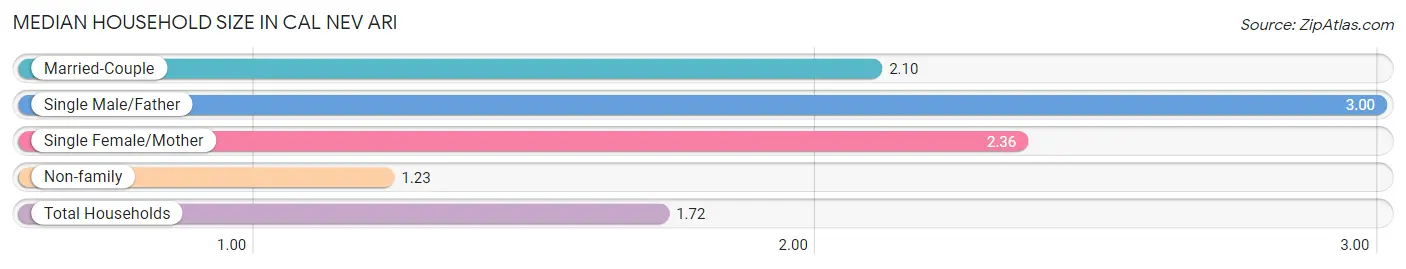
The median household size in Cal Nev Ari is 1.72 persons per household, with single male/father households (24 | 16.2%) accounting for the largest median household size of 3 persons per household. non-family households (93 | 62.8%) represent the smallest median household size with 1.23 persons per household.
| Household Type | # Households | Household Size |
| Married-Couple | 20 (13.5%) | 2.10 |
| Single Male/Father | 24 (16.2%) | 3.00 |
| Single Female/Mother | 11 (7.4%) | 2.36 |
| Non-family | 93 (62.8%) | 1.23 |
| Total Households | 148 (100.0%) | 1.72 |
Household Size by Marriage Status in Cal Nev Ari
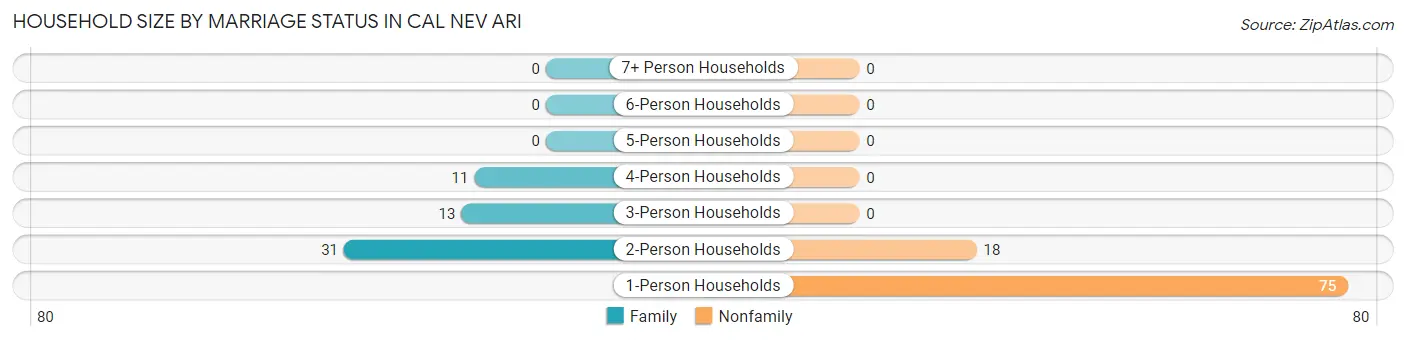
Out of a total of 148 households in Cal Nev Ari, 55 (37.2%) are family households, while 93 (62.8%) are nonfamily households. The most numerous type of family households are 2-person households, comprising 31, and the most common type of nonfamily households are 1-person households, comprising 75.
| Household Size | Family Households | Nonfamily Households |
| 1-Person Households | - | 75 (50.7%) |
| 2-Person Households | 31 (20.9%) | 18 (12.2%) |
| 3-Person Households | 13 (8.8%) | 0 (0.0%) |
| 4-Person Households | 11 (7.4%) | 0 (0.0%) |
| 5-Person Households | 0 (0.0%) | 0 (0.0%) |
| 6-Person Households | 0 (0.0%) | 0 (0.0%) |
| 7+ Person Households | 0 (0.0%) | 0 (0.0%) |
| Total | 55 (37.2%) | 93 (62.8%) |
Female Fertility in Cal Nev Ari
Fertility by Age in Cal Nev Ari
| Age Bracket | Women with Births | Births / 1,000 Women |
| 15 to 19 years | 0 (0.0%) | 0.0 |
| 20 to 34 years | 0 (0.0%) | 0.0 |
| 35 to 50 years | 0 (0.0%) | 0.0 |
| Total | 0 (0.0%) | 0.0 |
Fertility by Age by Marriage Status in Cal Nev Ari
| Age Bracket | Married | Unmarried |
| 15 to 19 years | 0 (0.0%) | 0 (0.0%) |
| 20 to 34 years | 0 (0.0%) | 0 (0.0%) |
| 35 to 50 years | 0 (0.0%) | 0 (0.0%) |
| Total | 0 (0.0%) | 0 (0.0%) |
Fertility by Education in Cal Nev Ari
| Educational Attainment | Women with Births | Births / 1,000 Women |
| Less than High School | 0 (0.0%) | 0.0 |
| High School Diploma | 0 (0.0%) | 0.0 |
| College or Associate's Degree | 0 (0.0%) | 0.0 |
| Bachelor's Degree | 0 (0.0%) | 0.0 |
| Graduate Degree | 0 (0.0%) | 0.0 |
| Total | 0 (0.0%) | 0.0 |
Fertility by Education by Marriage Status in Cal Nev Ari
| Educational Attainment | Married | Unmarried |
| Less than High School | 0 (0.0%) | 0 (0.0%) |
| High School Diploma | 0 (0.0%) | 0 (0.0%) |
| College or Associate's Degree | 0 (0.0%) | 0 (0.0%) |
| Bachelor's Degree | 0 (0.0%) | 0 (0.0%) |
| Graduate Degree | 0 (0.0%) | 0 (0.0%) |
| Total | 0 (0.0%) | 0 (0.0%) |
Employment Characteristics in Cal Nev Ari
Employment by Class of Employer in Cal Nev Ari
Among the 14 employed individuals in Cal Nev Ari, , and private company employees (14 | 100.0%) make up the most common classes of employment.
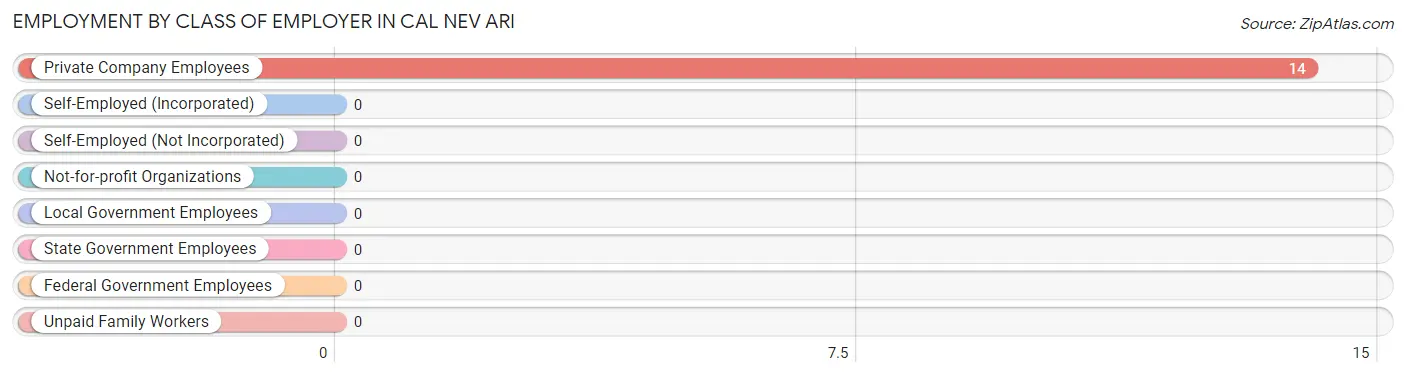
| Employer Class | # Employees | % Employees |
| Private Company Employees | 14 | 100.0% |
| Self-Employed (Incorporated) | 0 | 0.0% |
| Self-Employed (Not Incorporated) | 0 | 0.0% |
| Not-for-profit Organizations | 0 | 0.0% |
| Local Government Employees | 0 | 0.0% |
| State Government Employees | 0 | 0.0% |
| Federal Government Employees | 0 | 0.0% |
| Unpaid Family Workers | 0 | 0.0% |
| Total | 14 | 100.0% |
Employment Status by Age in Cal Nev Ari
According to the labor force statistics for Cal Nev Ari, out of the total population over 16 years of age (243), 10.3% or 25 individuals are in the labor force, with 44.0% or 11 of them unemployed. The age group with the highest labor force participation rate is 30 to 34 years, with 100.0% or 11 individuals in the labor force. Within the labor force, the 30 to 34 years age range has the highest percentage of unemployed individuals, with 100.0% or 11 of them being unemployed.
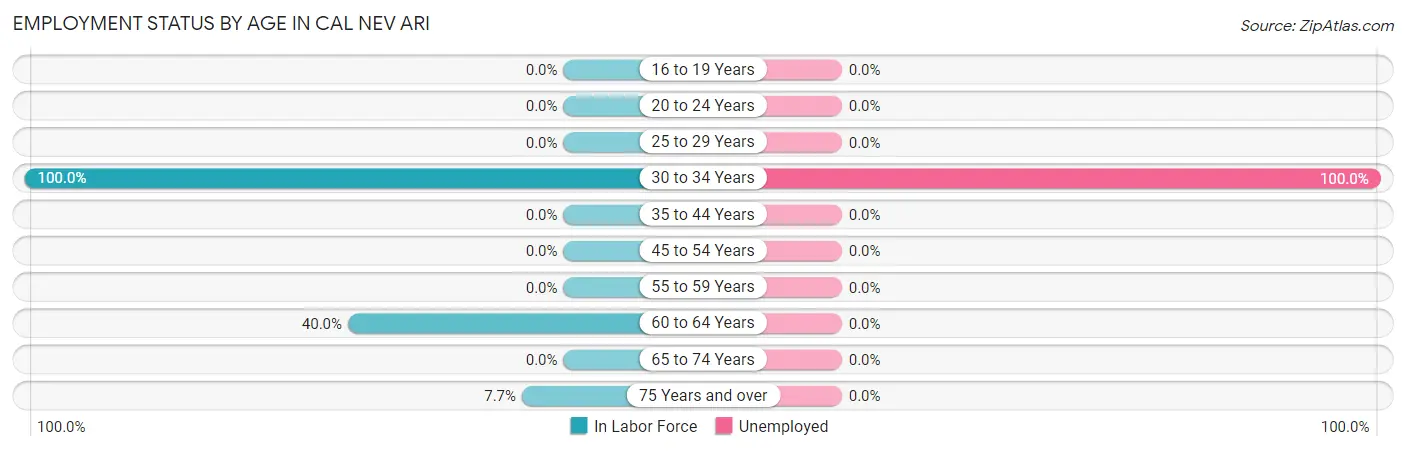
| Age Bracket | In Labor Force | Unemployed |
| 16 to 19 Years | 0 (0.0%) | 0 (0.0%) |
| 20 to 24 Years | 0 (0.0%) | 0 (0.0%) |
| 25 to 29 Years | 0 (0.0%) | 0 (0.0%) |
| 30 to 34 Years | 11 (100.0%) | 11 (100.0%) |
| 35 to 44 Years | 0 (0.0%) | 0 (0.0%) |
| 45 to 54 Years | 0 (0.0%) | 0 (0.0%) |
| 55 to 59 Years | 0 (0.0%) | 0 (0.0%) |
| 60 to 64 Years | 8 (40.0%) | 0 (0.0%) |
| 65 to 74 Years | 0 (0.0%) | 0 (0.0%) |
| 75 Years and over | 6 (7.7%) | 0 (0.0%) |
| Total | 25 (10.3%) | 11 (44.0%) |
Employment Status by Educational Attainment in Cal Nev Ari
According to labor force statistics for Cal Nev Ari, 31.7% of individuals (19) out of the total population between 25 and 64 years of age (60) are in the labor force, with 57.9% or 11 of them being unemployed. The group with the highest labor force participation rate are those with the educational attainment of high school diploma, with 39.6% or 19 individuals in the labor force. Within the labor force, individuals with high school diploma education have the highest percentage of unemployment, with 57.9% or 11 of them being unemployed.
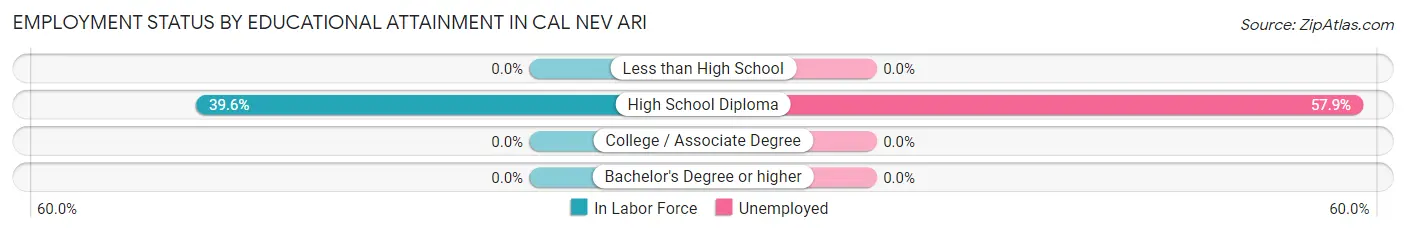
| Educational Attainment | In Labor Force | Unemployed |
| Less than High School | 0 (0.0%) | 0 (0.0%) |
| High School Diploma | 19 (39.6%) | 28 (57.9%) |
| College / Associate Degree | 0 (0.0%) | 0 (0.0%) |
| Bachelor's Degree or higher | 0 (0.0%) | 0 (0.0%) |
| Total | 19 (31.7%) | 35 (57.9%) |
Employment Occupations by Sex in Cal Nev Ari
Management, Business, Science and Arts Occupations
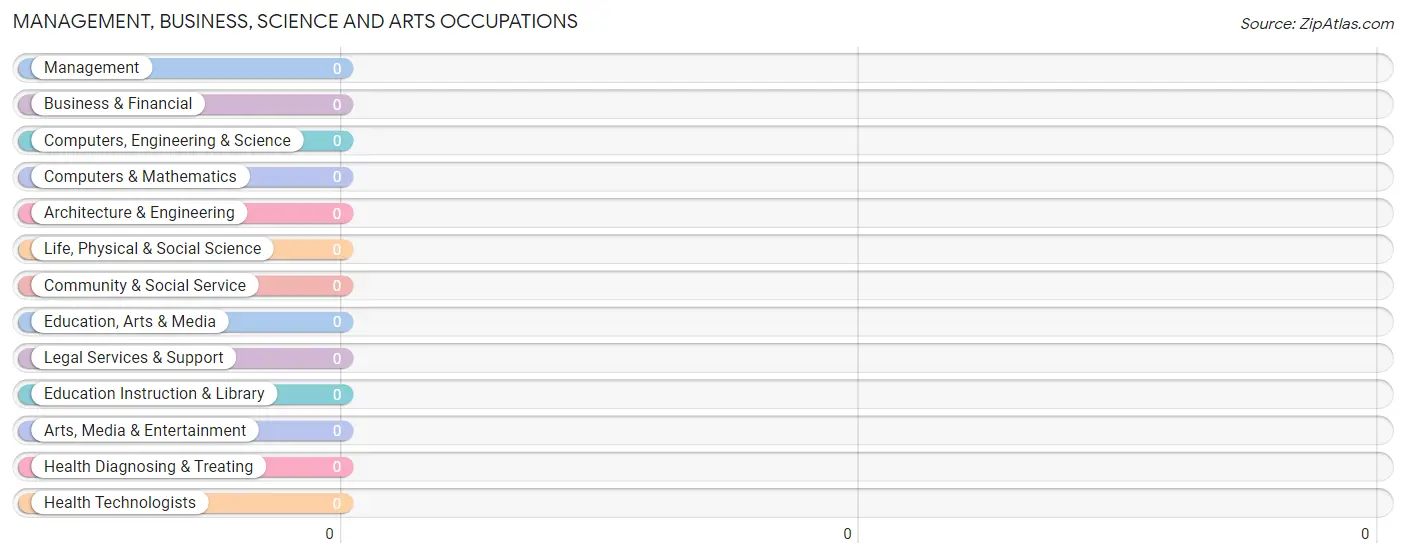
Management, Business, Science and Arts Occupations by Sex
| Occupation | Male | Female |
| Management | 0 (0.0%) | 0 (0.0%) |
| Business & Financial | 0 (0.0%) | 0 (0.0%) |
| Computers, Engineering & Science | 0 (0.0%) | 0 (0.0%) |
| Computers & Mathematics | 0 (0.0%) | 0 (0.0%) |
| Architecture & Engineering | 0 (0.0%) | 0 (0.0%) |
| Life, Physical & Social Science | 0 (0.0%) | 0 (0.0%) |
| Community & Social Service | 0 (0.0%) | 0 (0.0%) |
| Education, Arts & Media | 0 (0.0%) | 0 (0.0%) |
| Legal Services & Support | 0 (0.0%) | 0 (0.0%) |
| Education Instruction & Library | 0 (0.0%) | 0 (0.0%) |
| Arts, Media & Entertainment | 0 (0.0%) | 0 (0.0%) |
| Health Diagnosing & Treating | 0 (0.0%) | 0 (0.0%) |
| Health Technologists | 0 (0.0%) | 0 (0.0%) |
| Total (Category) | 0 (0.0%) | 0 (0.0%) |
| Total (Overall) | 8 (57.1%) | 6 (42.9%) |
Services Occupations
Services Occupations by Sex
| Occupation | Male | Female |
| Healthcare Support | 0 (0.0%) | 0 (0.0%) |
| Security & Protection | 0 (0.0%) | 0 (0.0%) |
| Firefighting & Prevention | 0 (0.0%) | 0 (0.0%) |
| Law Enforcement | 0 (0.0%) | 0 (0.0%) |
| Food Preparation & Serving | 0 (0.0%) | 0 (0.0%) |
| Cleaning & Maintenance | 0 (0.0%) | 0 (0.0%) |
| Personal Care & Service | 0 (0.0%) | 0 (0.0%) |
| Total (Category) | 0 (0.0%) | 0 (0.0%) |
| Total (Overall) | 8 (57.1%) | 6 (42.9%) |
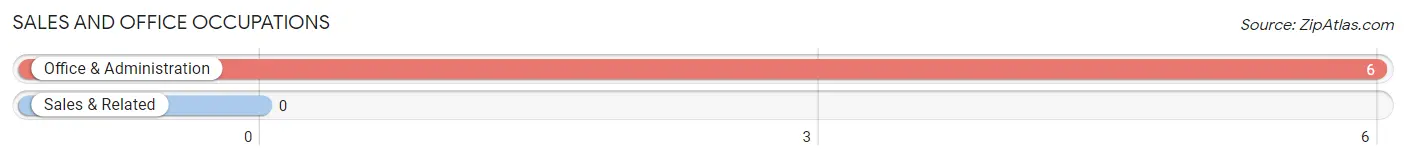
Sales and Office Occupations
The most common Sales and Office occupations in Cal Nev Ari are , and Office & Administration (6 | 42.9%).
Sales and Office Occupations by Sex
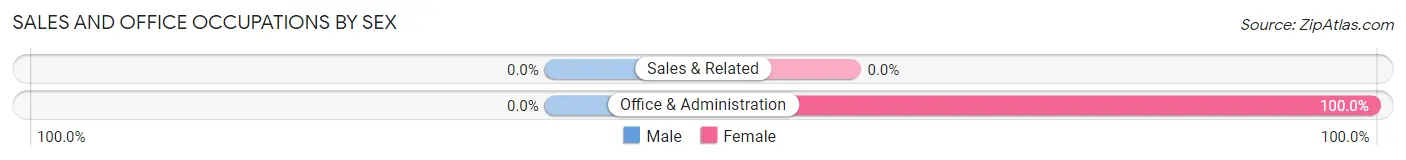
| Occupation | Male | Female |
| Sales & Related | 0 (0.0%) | 0 (0.0%) |
| Office & Administration | 0 (0.0%) | 6 (100.0%) |
| Total (Category) | 0 (0.0%) | 6 (100.0%) |
| Total (Overall) | 8 (57.1%) | 6 (42.9%) |
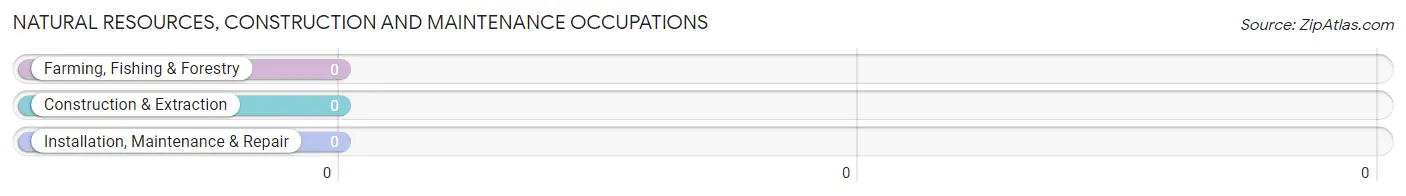
Natural Resources, Construction and Maintenance Occupations
Natural Resources, Construction and Maintenance Occupations by Sex
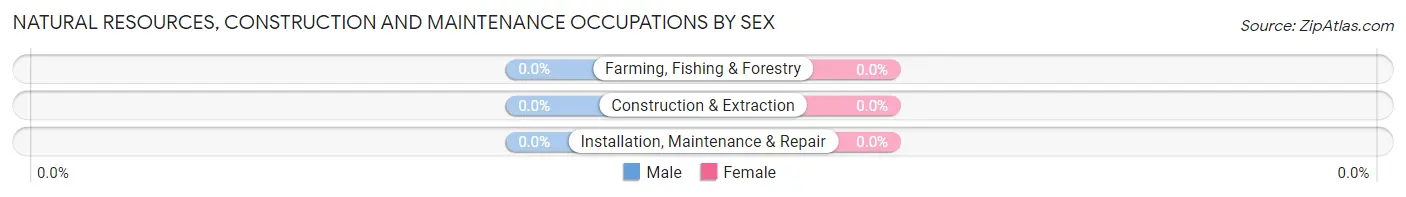
| Occupation | Male | Female |
| Farming, Fishing & Forestry | 0 (0.0%) | 0 (0.0%) |
| Construction & Extraction | 0 (0.0%) | 0 (0.0%) |
| Installation, Maintenance & Repair | 0 (0.0%) | 0 (0.0%) |
| Total (Category) | 0 (0.0%) | 0 (0.0%) |
| Total (Overall) | 8 (57.1%) | 6 (42.9%) |
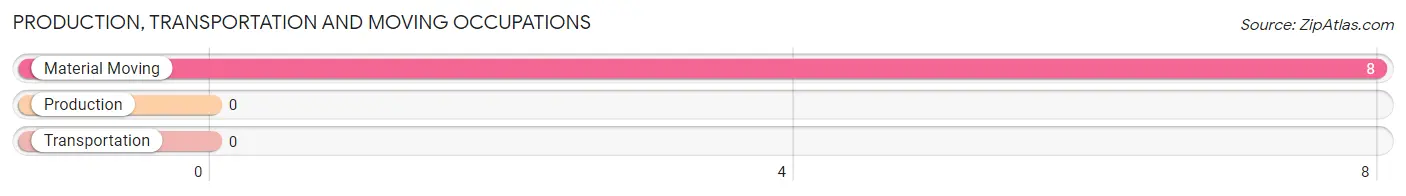
Production, Transportation and Moving Occupations
The most common Production, Transportation and Moving occupations in Cal Nev Ari are , and Material Moving (8 | 57.1%).
Production, Transportation and Moving Occupations by Sex
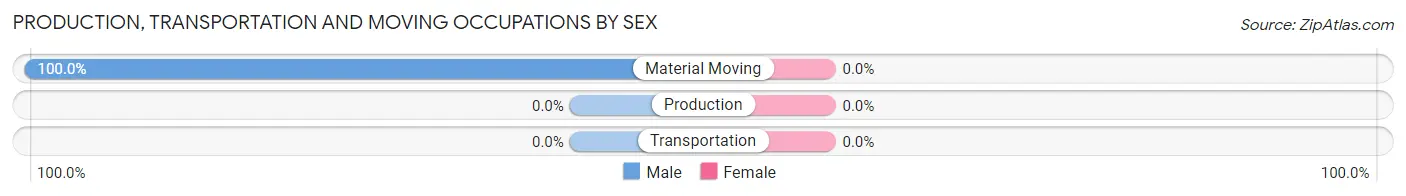
| Occupation | Male | Female |
| Production | 0 (0.0%) | 0 (0.0%) |
| Transportation | 0 (0.0%) | 0 (0.0%) |
| Material Moving | 8 (100.0%) | 0 (0.0%) |
| Total (Category) | 8 (100.0%) | 0 (0.0%) |
| Total (Overall) | 8 (57.1%) | 6 (42.9%) |
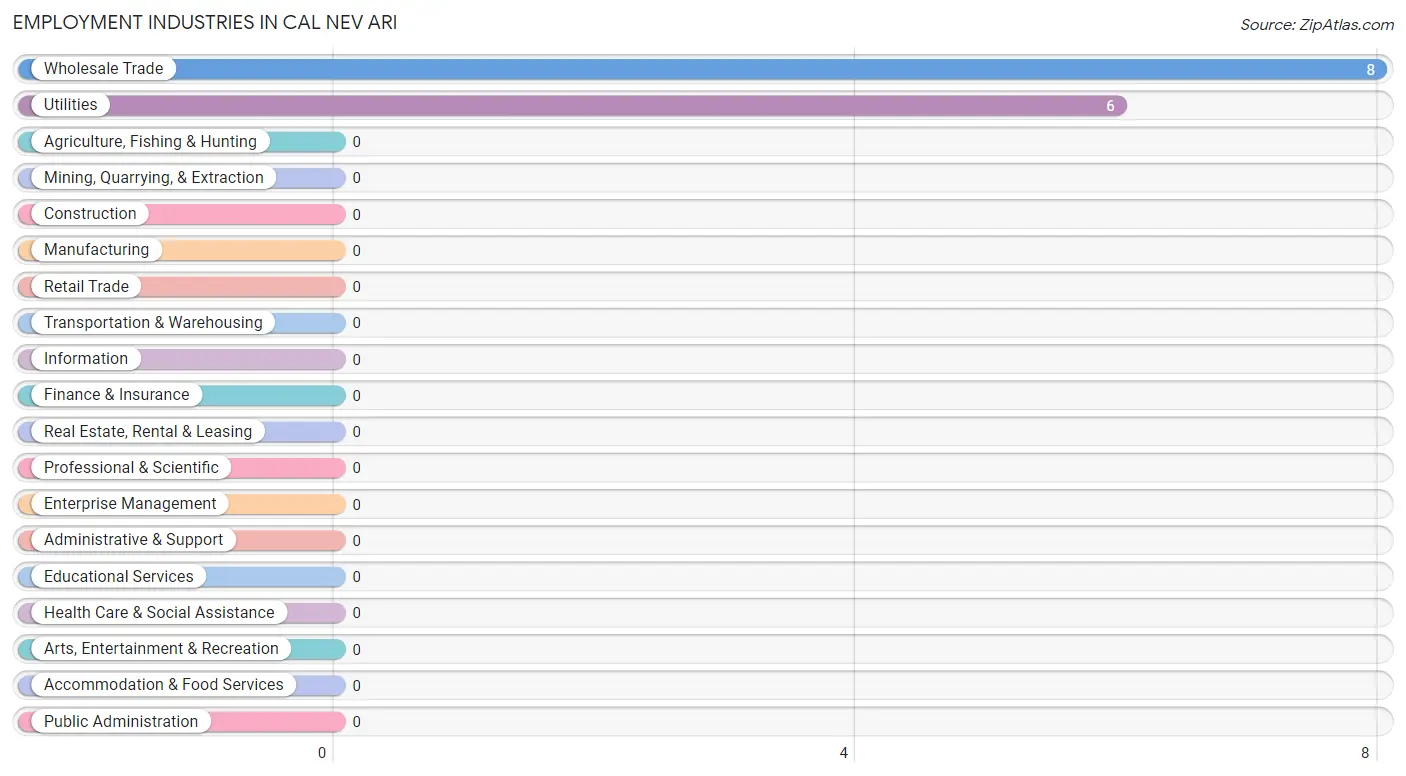
Employment Industries by Sex in Cal Nev Ari
Employment Industries in Cal Nev Ari
The major employment industries in Cal Nev Ari include Wholesale Trade (8 | 57.1%), and Utilities (6 | 42.9%).
Employment Industries by Sex in Cal Nev Ari
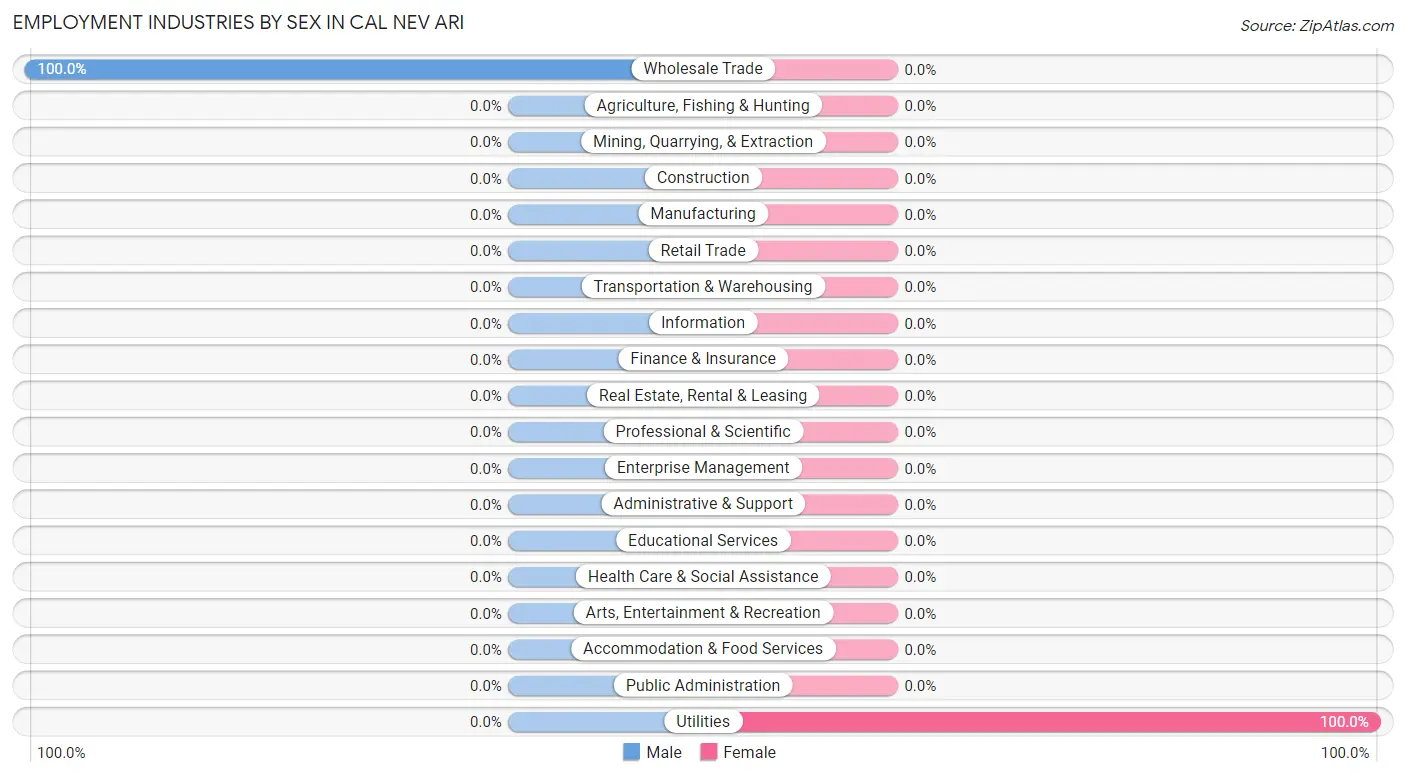
| Industry | Male | Female |
| Agriculture, Fishing & Hunting | 0 (0.0%) | 0 (0.0%) |
| Mining, Quarrying, & Extraction | 0 (0.0%) | 0 (0.0%) |
| Construction | 0 (0.0%) | 0 (0.0%) |
| Manufacturing | 0 (0.0%) | 0 (0.0%) |
| Wholesale Trade | 8 (100.0%) | 0 (0.0%) |
| Retail Trade | 0 (0.0%) | 0 (0.0%) |
| Transportation & Warehousing | 0 (0.0%) | 0 (0.0%) |
| Utilities | 0 (0.0%) | 6 (100.0%) |
| Information | 0 (0.0%) | 0 (0.0%) |
| Finance & Insurance | 0 (0.0%) | 0 (0.0%) |
| Real Estate, Rental & Leasing | 0 (0.0%) | 0 (0.0%) |
| Professional & Scientific | 0 (0.0%) | 0 (0.0%) |
| Enterprise Management | 0 (0.0%) | 0 (0.0%) |
| Administrative & Support | 0 (0.0%) | 0 (0.0%) |
| Educational Services | 0 (0.0%) | 0 (0.0%) |
| Health Care & Social Assistance | 0 (0.0%) | 0 (0.0%) |
| Arts, Entertainment & Recreation | 0 (0.0%) | 0 (0.0%) |
| Accommodation & Food Services | 0 (0.0%) | 0 (0.0%) |
| Public Administration | 0 (0.0%) | 0 (0.0%) |
| Total | 8 (57.1%) | 6 (42.9%) |
Education in Cal Nev Ari
School Enrollment in Cal Nev Ari
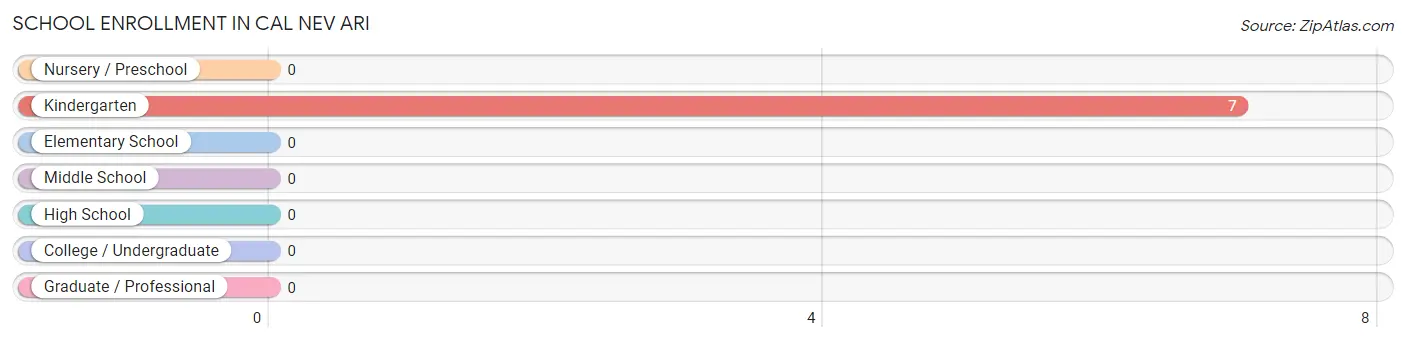
| School Level | # Students | % Students |
| Nursery / Preschool | 0 | 0.0% |
| Kindergarten | 7 | 100.0% |
| Elementary School | 0 | 0.0% |
| Middle School | 0 | 0.0% |
| High School | 0 | 0.0% |
| College / Undergraduate | 0 | 0.0% |
| Graduate / Professional | 0 | 0.0% |
| Total | 7 | 100.0% |
School Enrollment by Age by Funding Source in Cal Nev Ari
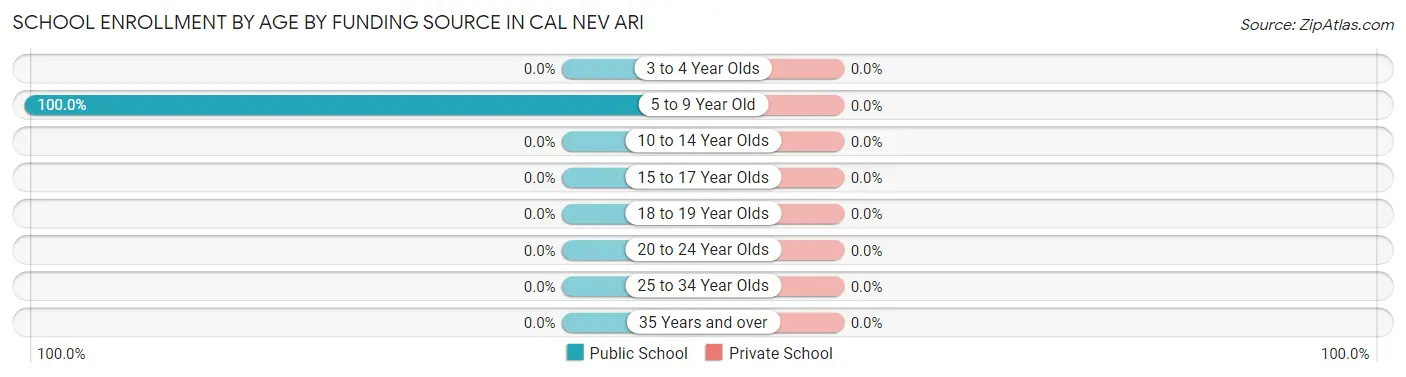
| Age Bracket | Public School | Private School |
| 3 to 4 Year Olds | 0 (0.0%) | 0 (0.0%) |
| 5 to 9 Year Old | 7 (100.0%) | 0 (0.0%) |
| 10 to 14 Year Olds | 0 (0.0%) | 0 (0.0%) |
| 15 to 17 Year Olds | 0 (0.0%) | 0 (0.0%) |
| 18 to 19 Year Olds | 0 (0.0%) | 0 (0.0%) |
| 20 to 24 Year Olds | 0 (0.0%) | 0 (0.0%) |
| 25 to 34 Year Olds | 0 (0.0%) | 0 (0.0%) |
| 35 Years and over | 0 (0.0%) | 0 (0.0%) |
| Total | 7 (100.0%) | 0 (0.0%) |
Educational Attainment by Field of Study in Cal Nev Ari
Business (21 | 77.8%), and engineering (6 | 22.2%) are the most common fields of study among 27 individuals in Cal Nev Ari who have obtained a bachelor's degree or higher.
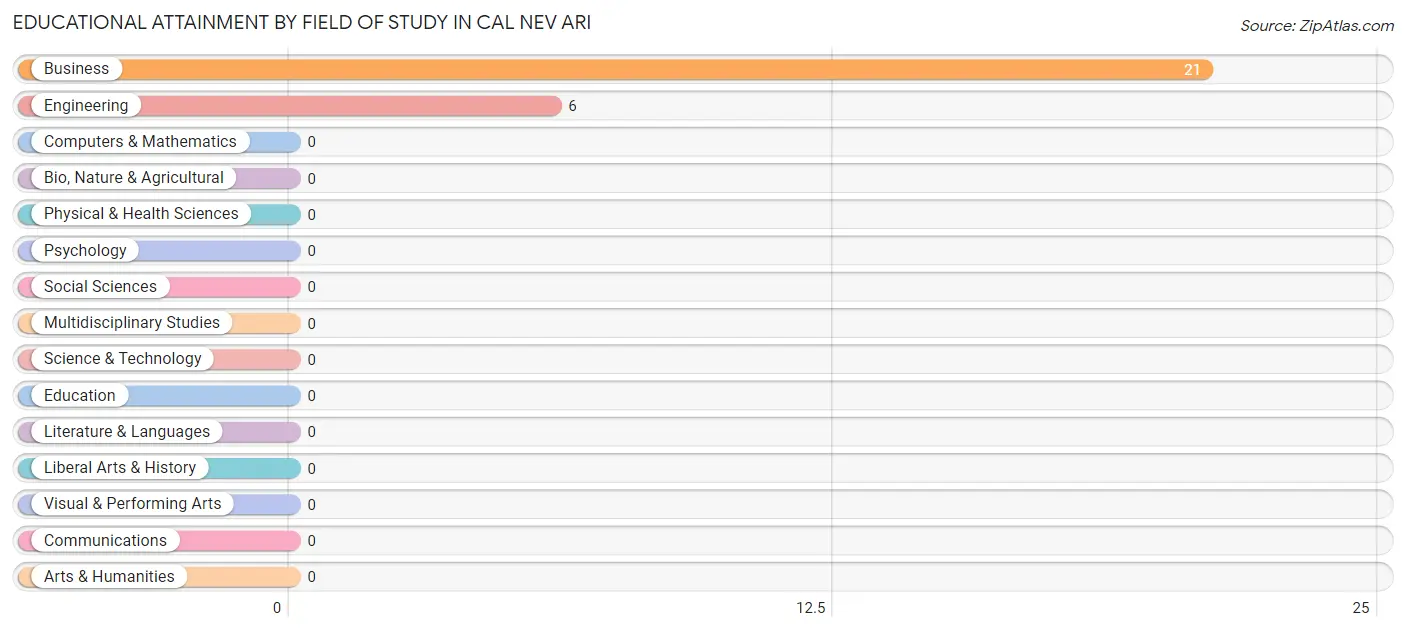
| Field of Study | # Graduates | % Graduates |
| Computers & Mathematics | 0 | 0.0% |
| Bio, Nature & Agricultural | 0 | 0.0% |
| Physical & Health Sciences | 0 | 0.0% |
| Psychology | 0 | 0.0% |
| Social Sciences | 0 | 0.0% |
| Engineering | 6 | 22.2% |
| Multidisciplinary Studies | 0 | 0.0% |
| Science & Technology | 0 | 0.0% |
| Business | 21 | 77.8% |
| Education | 0 | 0.0% |
| Literature & Languages | 0 | 0.0% |
| Liberal Arts & History | 0 | 0.0% |
| Visual & Performing Arts | 0 | 0.0% |
| Communications | 0 | 0.0% |
| Arts & Humanities | 0 | 0.0% |
| Total | 27 | 100.0% |
Transportation & Commute in Cal Nev Ari
Vehicle Availability by Sex in Cal Nev Ari
The most prevalent vehicle ownership categories in Cal Nev Ari are males with 2 vehicles (8, accounting for 100.0%) and females with 2 vehicles (6, making up 133.3%).
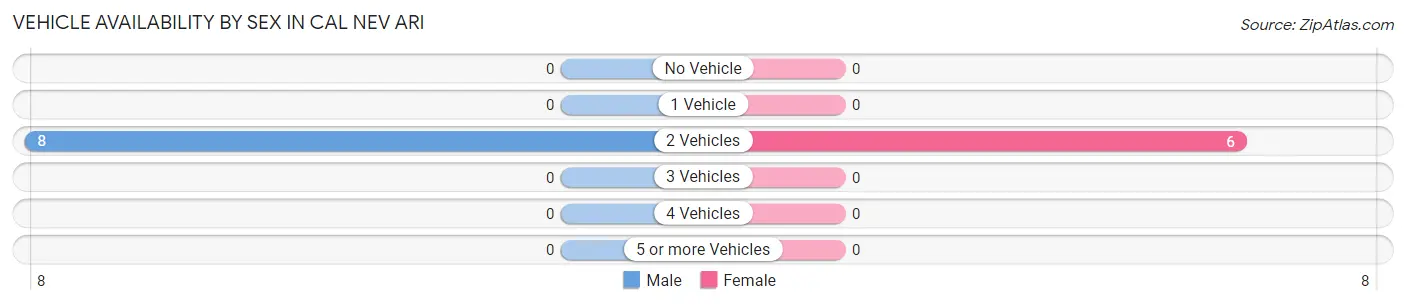
| Vehicles Available | Male | Female |
| No Vehicle | 0 (0.0%) | 0 (0.0%) |
| 1 Vehicle | 0 (0.0%) | 0 (0.0%) |
| 2 Vehicles | 8 (100.0%) | 6 (100.0%) |
| 3 Vehicles | 0 (0.0%) | 0 (0.0%) |
| 4 Vehicles | 0 (0.0%) | 0 (0.0%) |
| 5 or more Vehicles | 0 (0.0%) | 0 (0.0%) |
| Total | 8 (100.0%) | 6 (100.0%) |
Commute Time in Cal Nev Ari
The most frequently occuring commute durations in Cal Nev Ari are 60 to 89 minutes (8 commuters, 100.0%), less than 5 minutes (0 commuters, 0.0%), and 5 to 9 minutes (0 commuters, 0.0%).
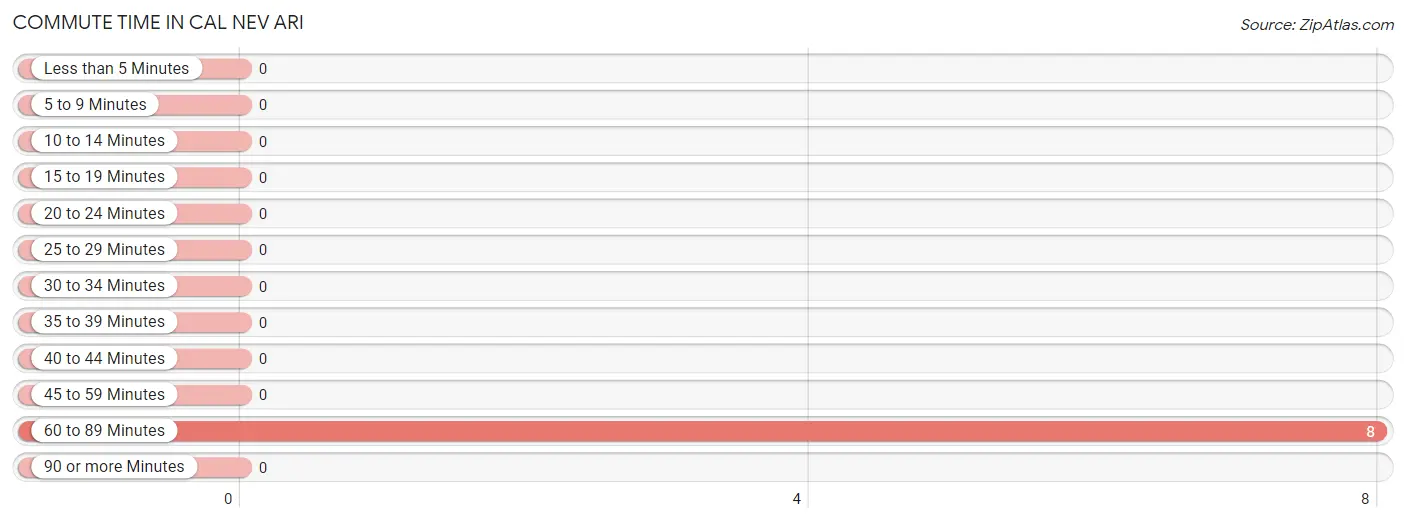
| Commute Time | # Commuters | % Commuters |
| Less than 5 Minutes | 0 | 0.0% |
| 5 to 9 Minutes | 0 | 0.0% |
| 10 to 14 Minutes | 0 | 0.0% |
| 15 to 19 Minutes | 0 | 0.0% |
| 20 to 24 Minutes | 0 | 0.0% |
| 25 to 29 Minutes | 0 | 0.0% |
| 30 to 34 Minutes | 0 | 0.0% |
| 35 to 39 Minutes | 0 | 0.0% |
| 40 to 44 Minutes | 0 | 0.0% |
| 45 to 59 Minutes | 0 | 0.0% |
| 60 to 89 Minutes | 8 | 100.0% |
| 90 or more Minutes | 0 | 0.0% |
Commute Time by Sex in Cal Nev Ari
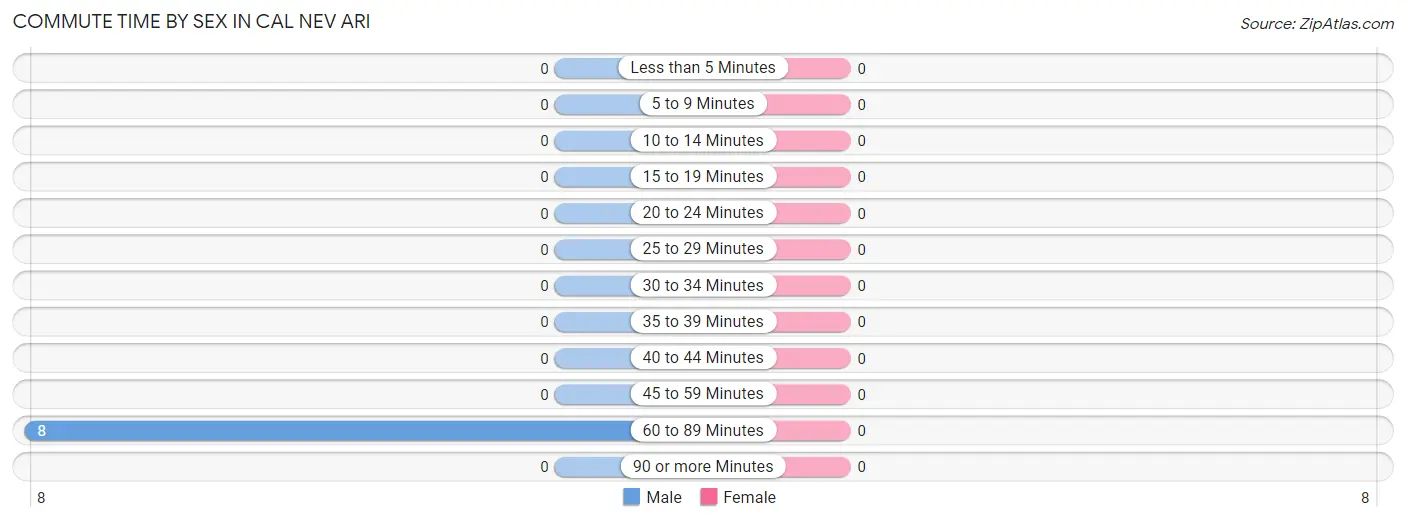
| Commute Time | Male | Female |
| Less than 5 Minutes | 0 (0.0%) | 0 (0.0%) |
| 5 to 9 Minutes | 0 (0.0%) | 0 (0.0%) |
| 10 to 14 Minutes | 0 (0.0%) | 0 (0.0%) |
| 15 to 19 Minutes | 0 (0.0%) | 0 (0.0%) |
| 20 to 24 Minutes | 0 (0.0%) | 0 (0.0%) |
| 25 to 29 Minutes | 0 (0.0%) | 0 (0.0%) |
| 30 to 34 Minutes | 0 (0.0%) | 0 (0.0%) |
| 35 to 39 Minutes | 0 (0.0%) | 0 (0.0%) |
| 40 to 44 Minutes | 0 (0.0%) | 0 (0.0%) |
| 45 to 59 Minutes | 0 (0.0%) | 0 (0.0%) |
| 60 to 89 Minutes | 8 (100.0%) | 0 (0.0%) |
| 90 or more Minutes | 0 (0.0%) | 0 (0.0%) |
Time of Departure to Work by Sex in Cal Nev Ari
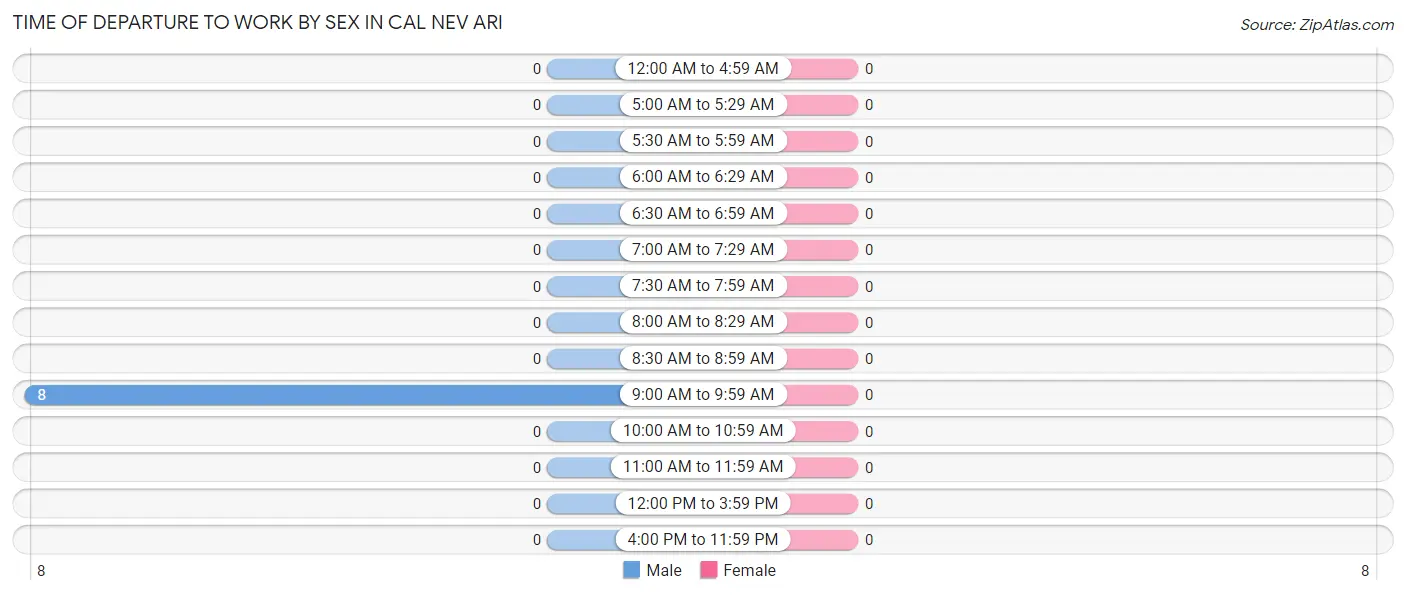
| Time of Departure | Male | Female |
| 12:00 AM to 4:59 AM | 0 (0.0%) | 0 (0.0%) |
| 5:00 AM to 5:29 AM | 0 (0.0%) | 0 (0.0%) |
| 5:30 AM to 5:59 AM | 0 (0.0%) | 0 (0.0%) |
| 6:00 AM to 6:29 AM | 0 (0.0%) | 0 (0.0%) |
| 6:30 AM to 6:59 AM | 0 (0.0%) | 0 (0.0%) |
| 7:00 AM to 7:29 AM | 0 (0.0%) | 0 (0.0%) |
| 7:30 AM to 7:59 AM | 0 (0.0%) | 0 (0.0%) |
| 8:00 AM to 8:29 AM | 0 (0.0%) | 0 (0.0%) |
| 8:30 AM to 8:59 AM | 0 (0.0%) | 0 (0.0%) |
| 9:00 AM to 9:59 AM | 8 (100.0%) | 0 (0.0%) |
| 10:00 AM to 10:59 AM | 0 (0.0%) | 0 (0.0%) |
| 11:00 AM to 11:59 AM | 0 (0.0%) | 0 (0.0%) |
| 12:00 PM to 3:59 PM | 0 (0.0%) | 0 (0.0%) |
| 4:00 PM to 11:59 PM | 0 (0.0%) | 0 (0.0%) |
| Total | 8 (100.0%) | 0 (0.0%) |
Housing Occupancy in Cal Nev Ari
Occupancy by Ownership in Cal Nev Ari
Of the total 148 dwellings in Cal Nev Ari, owner-occupied units account for 88 (59.5%), while renter-occupied units make up 60 (40.5%).
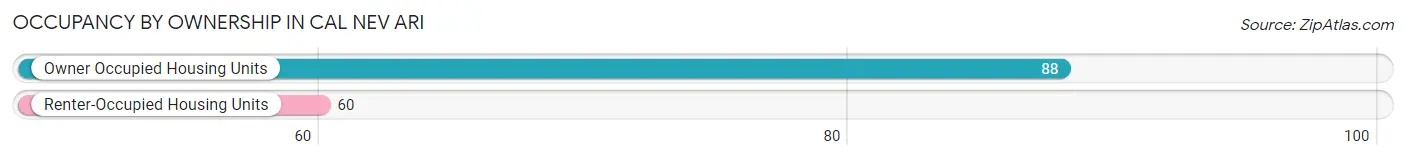
| Occupancy | # Housing Units | % Housing Units |
| Owner Occupied Housing Units | 88 | 59.5% |
| Renter-Occupied Housing Units | 60 | 40.5% |
| Total Occupied Housing Units | 148 | 100.0% |
Occupancy by Household Size in Cal Nev Ari
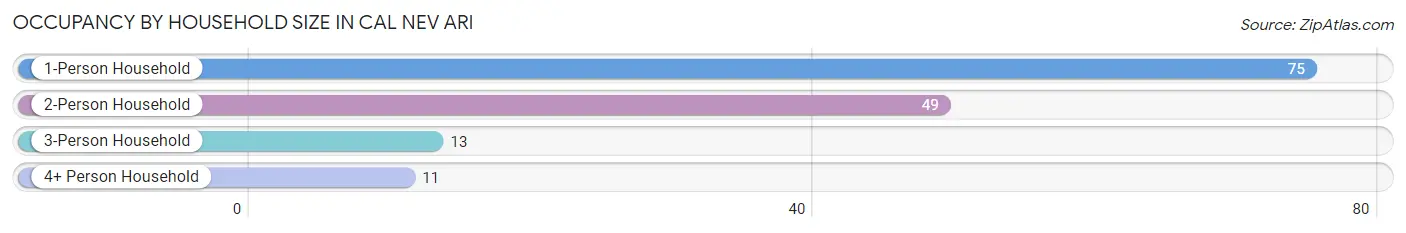
| Household Size | # Housing Units | % Housing Units |
| 1-Person Household | 75 | 50.7% |
| 2-Person Household | 49 | 33.1% |
| 3-Person Household | 13 | 8.8% |
| 4+ Person Household | 11 | 7.4% |
| Total Housing Units | 148 | 100.0% |
Occupancy by Ownership by Household Size in Cal Nev Ari
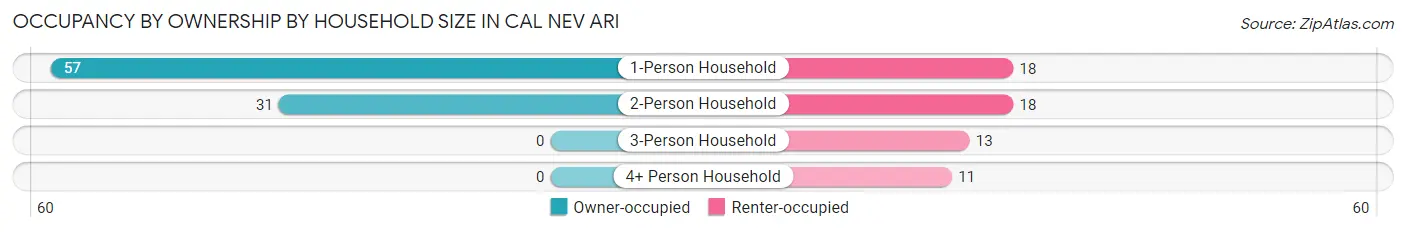
| Household Size | Owner-occupied | Renter-occupied |
| 1-Person Household | 57 (76.0%) | 18 (24.0%) |
| 2-Person Household | 31 (63.3%) | 18 (36.7%) |
| 3-Person Household | 0 (0.0%) | 13 (100.0%) |
| 4+ Person Household | 0 (0.0%) | 11 (100.0%) |
| Total Housing Units | 88 (59.5%) | 60 (40.5%) |
Occupancy by Educational Attainment in Cal Nev Ari
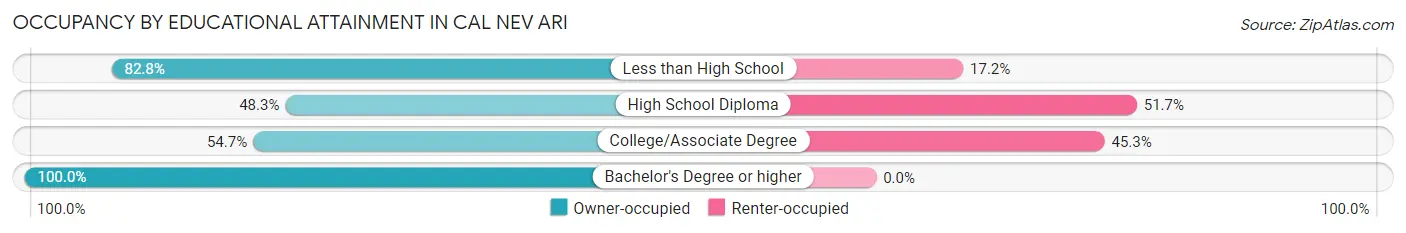
| Household Size | Owner-occupied | Renter-occupied |
| Less than High School | 24 (82.8%) | 5 (17.2%) |
| High School Diploma | 29 (48.3%) | 31 (51.7%) |
| College/Associate Degree | 29 (54.7%) | 24 (45.3%) |
| Bachelor's Degree or higher | 6 (100.0%) | 0 (0.0%) |
Occupancy by Age of Householder in Cal Nev Ari
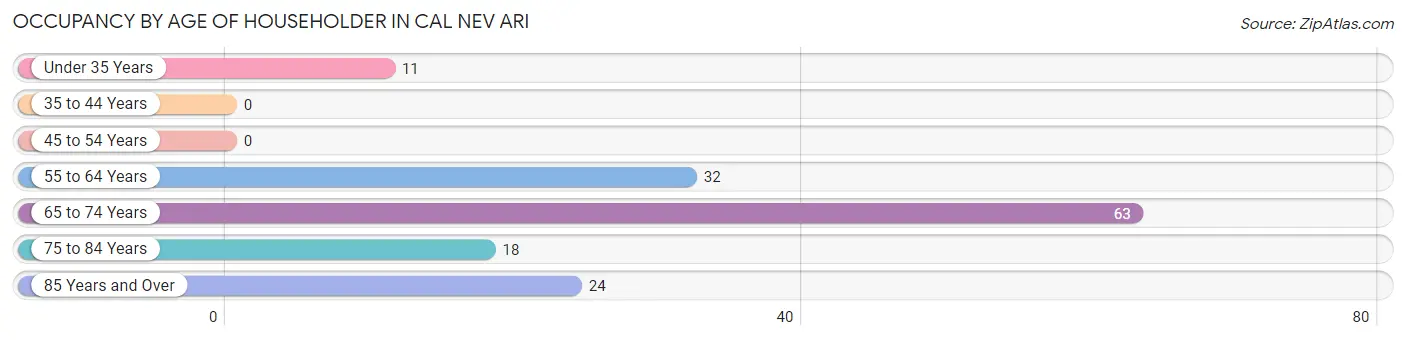
| Age Bracket | # Households | % Households |
| Under 35 Years | 11 | 7.4% |
| 35 to 44 Years | 0 | 0.0% |
| 45 to 54 Years | 0 | 0.0% |
| 55 to 64 Years | 32 | 21.6% |
| 65 to 74 Years | 63 | 42.6% |
| 75 to 84 Years | 18 | 12.2% |
| 85 Years and Over | 24 | 16.2% |
| Total | 148 | 100.0% |
Housing Finances in Cal Nev Ari
Median Income by Occupancy in Cal Nev Ari
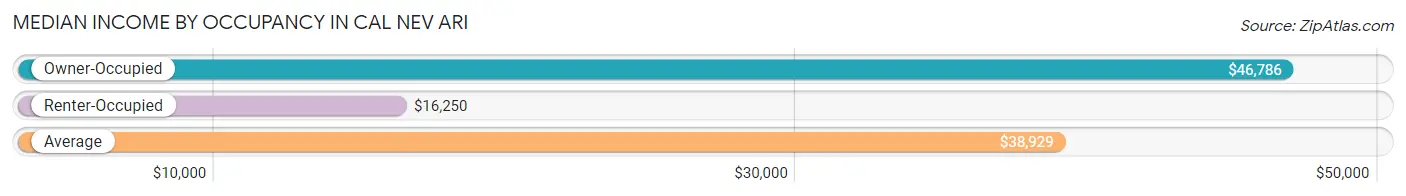
| Occupancy Type | # Households | Median Income |
| Owner-Occupied | 88 (59.5%) | $46,786 |
| Renter-Occupied | 60 (40.5%) | $16,250 |
| Average | 148 (100.0%) | $38,929 |
Occupancy by Householder Income Bracket in Cal Nev Ari
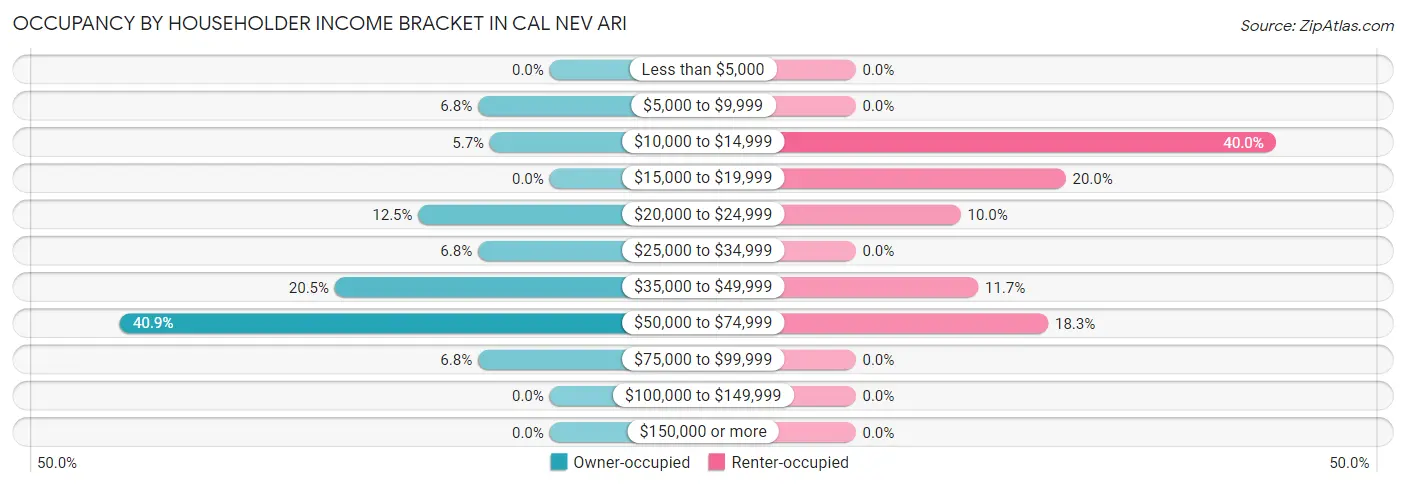
| Income Bracket | Owner-occupied | Renter-occupied |
| Less than $5,000 | 0 (0.0%) | 0 (0.0%) |
| $5,000 to $9,999 | 6 (6.8%) | 0 (0.0%) |
| $10,000 to $14,999 | 5 (5.7%) | 24 (40.0%) |
| $15,000 to $19,999 | 0 (0.0%) | 12 (20.0%) |
| $20,000 to $24,999 | 11 (12.5%) | 6 (10.0%) |
| $25,000 to $34,999 | 6 (6.8%) | 0 (0.0%) |
| $35,000 to $49,999 | 18 (20.4%) | 7 (11.7%) |
| $50,000 to $74,999 | 36 (40.9%) | 11 (18.3%) |
| $75,000 to $99,999 | 6 (6.8%) | 0 (0.0%) |
| $100,000 to $149,999 | 0 (0.0%) | 0 (0.0%) |
| $150,000 or more | 0 (0.0%) | 0 (0.0%) |
| Total | 88 (100.0%) | 60 (100.0%) |
Monthly Housing Cost Tiers in Cal Nev Ari
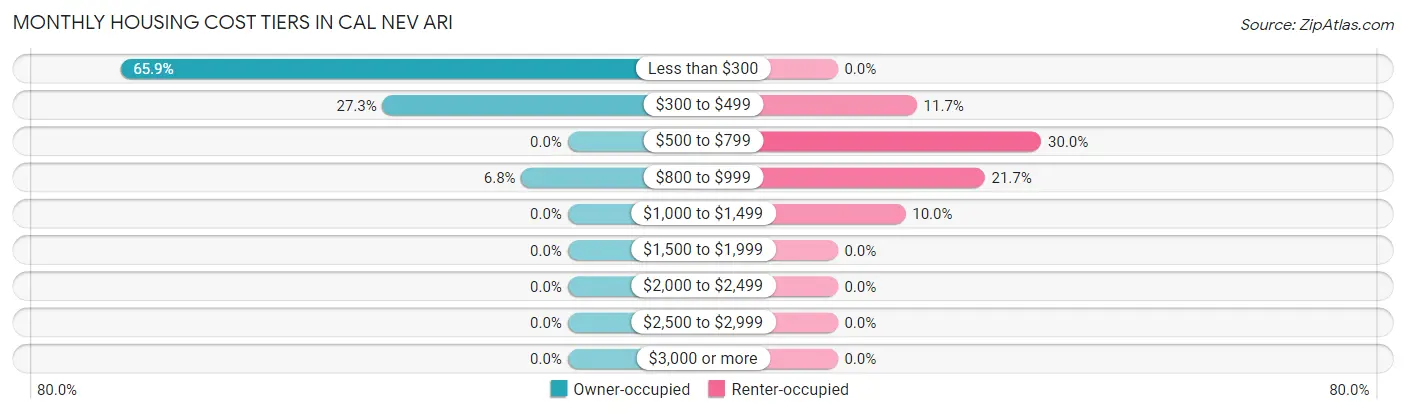
| Monthly Cost | Owner-occupied | Renter-occupied |
| Less than $300 | 58 (65.9%) | 0 (0.0%) |
| $300 to $499 | 24 (27.3%) | 7 (11.7%) |
| $500 to $799 | 0 (0.0%) | 18 (30.0%) |
| $800 to $999 | 6 (6.8%) | 13 (21.7%) |
| $1,000 to $1,499 | 0 (0.0%) | 6 (10.0%) |
| $1,500 to $1,999 | 0 (0.0%) | 0 (0.0%) |
| $2,000 to $2,499 | 0 (0.0%) | 0 (0.0%) |
| $2,500 to $2,999 | 0 (0.0%) | 0 (0.0%) |
| $3,000 or more | 0 (0.0%) | 0 (0.0%) |
| Total | 88 (100.0%) | 60 (100.0%) |
Physical Housing Characteristics in Cal Nev Ari
Housing Structures in Cal Nev Ari
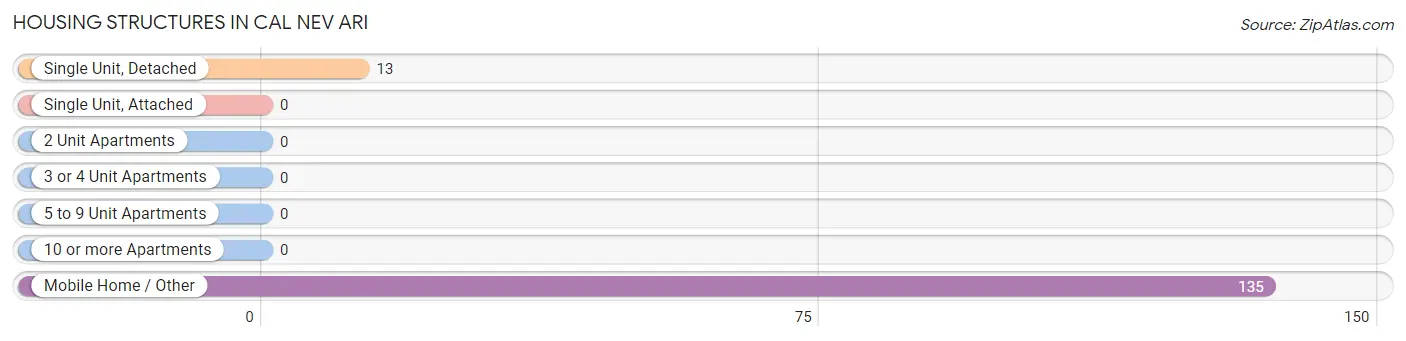
| Structure Type | # Housing Units | % Housing Units |
| Single Unit, Detached | 13 | 8.8% |
| Single Unit, Attached | 0 | 0.0% |
| 2 Unit Apartments | 0 | 0.0% |
| 3 or 4 Unit Apartments | 0 | 0.0% |
| 5 to 9 Unit Apartments | 0 | 0.0% |
| 10 or more Apartments | 0 | 0.0% |
| Mobile Home / Other | 135 | 91.2% |
| Total | 148 | 100.0% |
Housing Structures by Occupancy in Cal Nev Ari
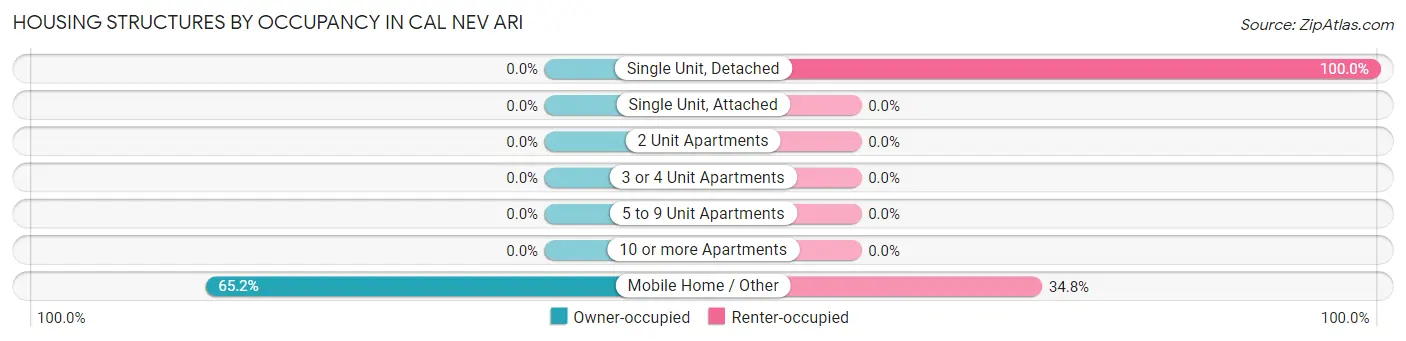
| Structure Type | Owner-occupied | Renter-occupied |
| Single Unit, Detached | 0 (0.0%) | 13 (100.0%) |
| Single Unit, Attached | 0 (0.0%) | 0 (0.0%) |
| 2 Unit Apartments | 0 (0.0%) | 0 (0.0%) |
| 3 or 4 Unit Apartments | 0 (0.0%) | 0 (0.0%) |
| 5 to 9 Unit Apartments | 0 (0.0%) | 0 (0.0%) |
| 10 or more Apartments | 0 (0.0%) | 0 (0.0%) |
| Mobile Home / Other | 88 (65.2%) | 47 (34.8%) |
| Total | 88 (59.5%) | 60 (40.5%) |
Housing Structures by Number of Rooms in Cal Nev Ari
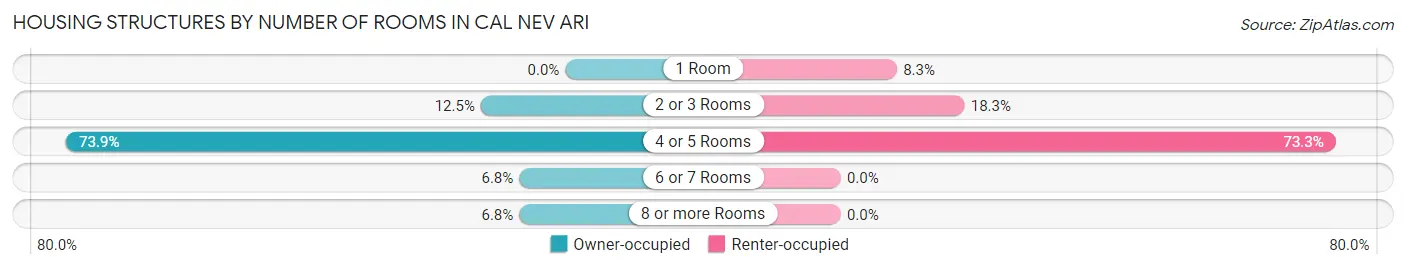
| Number of Rooms | Owner-occupied | Renter-occupied |
| 1 Room | 0 (0.0%) | 5 (8.3%) |
| 2 or 3 Rooms | 11 (12.5%) | 11 (18.3%) |
| 4 or 5 Rooms | 65 (73.9%) | 44 (73.3%) |
| 6 or 7 Rooms | 6 (6.8%) | 0 (0.0%) |
| 8 or more Rooms | 6 (6.8%) | 0 (0.0%) |
| Total | 88 (100.0%) | 60 (100.0%) |
Housing Structure by Heating Type in Cal Nev Ari
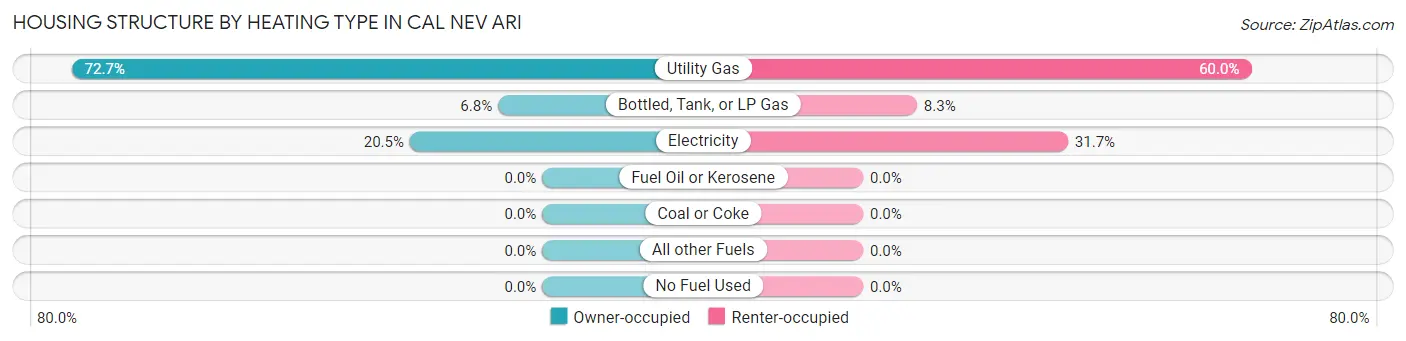
| Heating Type | Owner-occupied | Renter-occupied |
| Utility Gas | 64 (72.7%) | 36 (60.0%) |
| Bottled, Tank, or LP Gas | 6 (6.8%) | 5 (8.3%) |
| Electricity | 18 (20.4%) | 19 (31.7%) |
| Fuel Oil or Kerosene | 0 (0.0%) | 0 (0.0%) |
| Coal or Coke | 0 (0.0%) | 0 (0.0%) |
| All other Fuels | 0 (0.0%) | 0 (0.0%) |
| No Fuel Used | 0 (0.0%) | 0 (0.0%) |
| Total | 88 (100.0%) | 60 (100.0%) |
Household Vehicle Usage in Cal Nev Ari
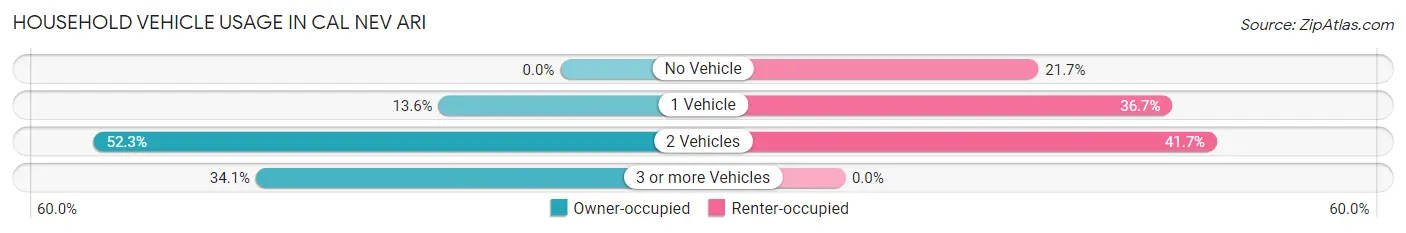
| Vehicles per Household | Owner-occupied | Renter-occupied |
| No Vehicle | 0 (0.0%) | 13 (21.7%) |
| 1 Vehicle | 12 (13.6%) | 22 (36.7%) |
| 2 Vehicles | 46 (52.3%) | 25 (41.7%) |
| 3 or more Vehicles | 30 (34.1%) | 0 (0.0%) |
| Total | 88 (100.0%) | 60 (100.0%) |
Real Estate & Mortgages in Cal Nev Ari
Real Estate and Mortgage Overview in Cal Nev Ari
| Characteristic | Without Mortgage | With Mortgage |
| Housing Units | 88 | 0 |
| Median Property Value | $67,700 | $0 |
| Median Household Income | $46,786 | $0 |
| Monthly Housing Costs | $209 | $0 |
| Real Estate Taxes | $264 | $0 |
Property Value by Mortgage Status in Cal Nev Ari
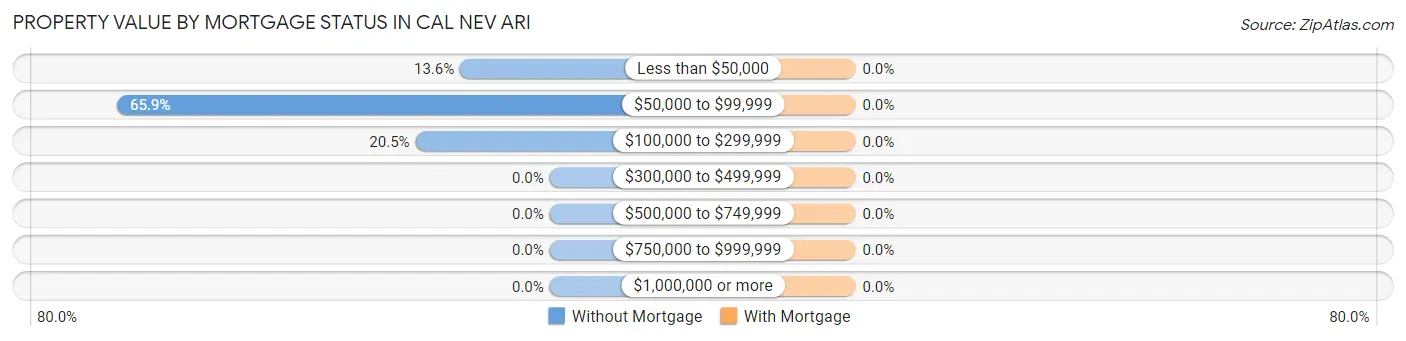
| Property Value | Without Mortgage | With Mortgage |
| Less than $50,000 | 12 (13.6%) | 0 (0.0%) |
| $50,000 to $99,999 | 58 (65.9%) | 0 (0.0%) |
| $100,000 to $299,999 | 18 (20.4%) | 0 (0.0%) |
| $300,000 to $499,999 | 0 (0.0%) | 0 (0.0%) |
| $500,000 to $749,999 | 0 (0.0%) | 0 (0.0%) |
| $750,000 to $999,999 | 0 (0.0%) | 0 (0.0%) |
| $1,000,000 or more | 0 (0.0%) | 0 (0.0%) |
| Total | 88 (100.0%) | 0 (0.0%) |
Household Income by Mortgage Status in Cal Nev Ari
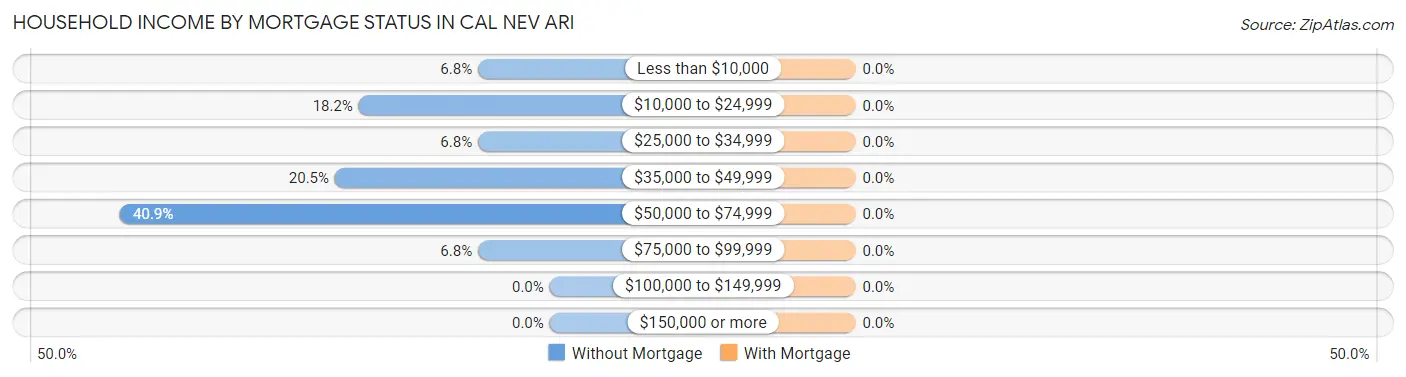
| Household Income | Without Mortgage | With Mortgage |
| Less than $10,000 | 6 (6.8%) | 0 (0.0%) |
| $10,000 to $24,999 | 16 (18.2%) | 0 (0.0%) |
| $25,000 to $34,999 | 6 (6.8%) | 0 (0.0%) |
| $35,000 to $49,999 | 18 (20.4%) | 0 (0.0%) |
| $50,000 to $74,999 | 36 (40.9%) | 0 (0.0%) |
| $75,000 to $99,999 | 6 (6.8%) | 0 (0.0%) |
| $100,000 to $149,999 | 0 (0.0%) | 0 (0.0%) |
| $150,000 or more | 0 (0.0%) | 0 (0.0%) |
| Total | 88 (100.0%) | 0 (0.0%) |
Property Value to Household Income Ratio in Cal Nev Ari
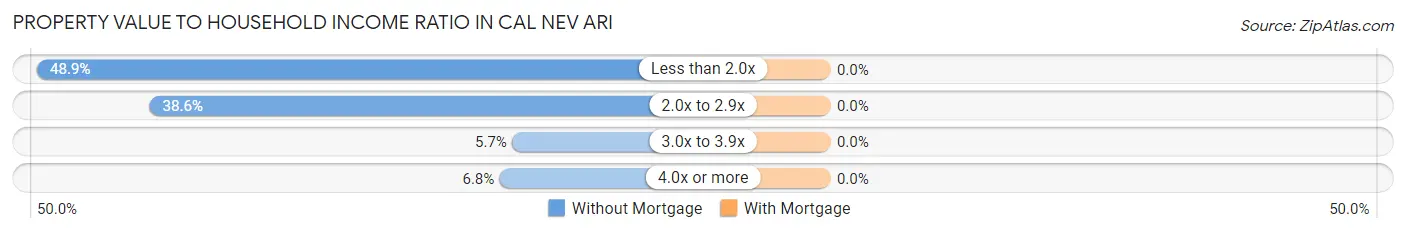
| Value-to-Income Ratio | Without Mortgage | With Mortgage |
| Less than 2.0x | 43 (48.9%) | 0 (0.0%) |
| 2.0x to 2.9x | 34 (38.6%) | 0 (0.0%) |
| 3.0x to 3.9x | 5 (5.7%) | 0 (0.0%) |
| 4.0x or more | 6 (6.8%) | 0 (0.0%) |
| Total | 88 (100.0%) | 0 (0.0%) |
Real Estate Taxes by Mortgage Status in Cal Nev Ari
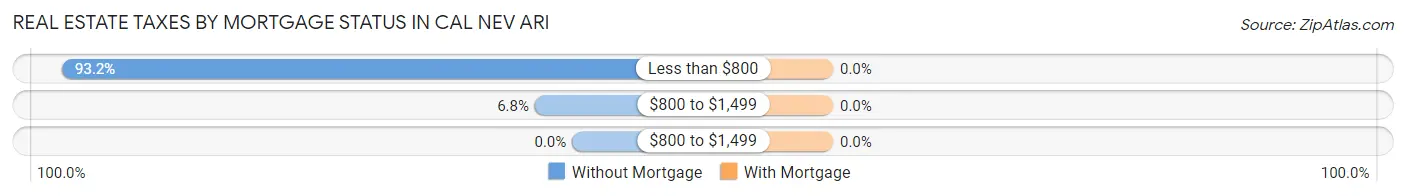
| Property Taxes | Without Mortgage | With Mortgage |
| Less than $800 | 82 (93.2%) | 0 (0.0%) |
| $800 to $1,499 | 6 (6.8%) | 0 (0.0%) |
| $800 to $1,499 | 0 (0.0%) | 0 (0.0%) |
| Total | 88 (100.0%) | 0 (0.0%) |
Health & Disability in Cal Nev Ari
Health Insurance Coverage by Age in Cal Nev Ari
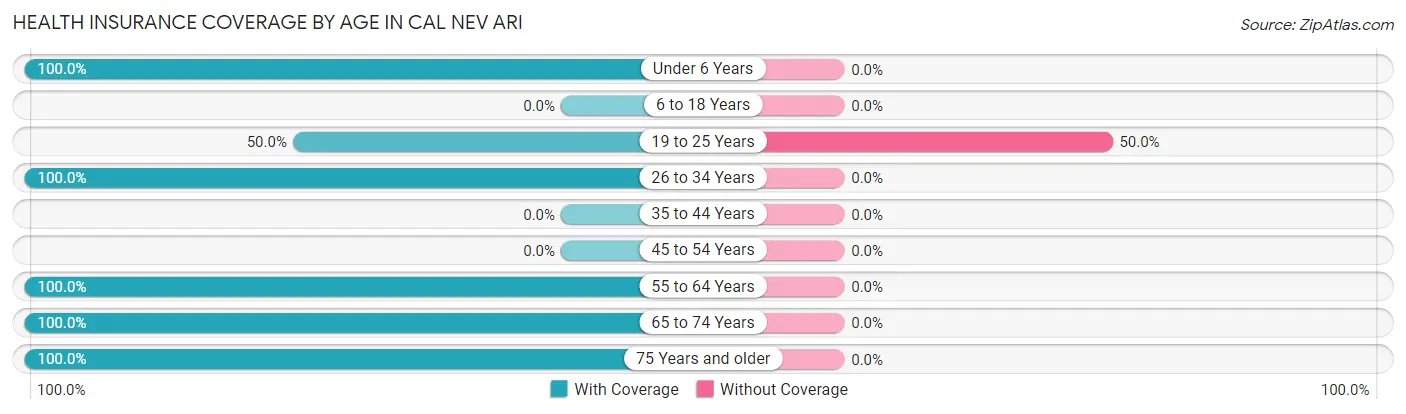
| Age Bracket | With Coverage | Without Coverage |
| Under 6 Years | 11 (100.0%) | 0 (0.0%) |
| 6 to 18 Years | 0 (0.0%) | 0 (0.0%) |
| 19 to 25 Years | 14 (50.0%) | 14 (50.0%) |
| 26 to 34 Years | 20 (100.0%) | 0 (0.0%) |
| 35 to 44 Years | 0 (0.0%) | 0 (0.0%) |
| 45 to 54 Years | 0 (0.0%) | 0 (0.0%) |
| 55 to 64 Years | 40 (100.0%) | 0 (0.0%) |
| 65 to 74 Years | 77 (100.0%) | 0 (0.0%) |
| 75 Years and older | 78 (100.0%) | 0 (0.0%) |
| Total | 240 (94.5%) | 14 (5.5%) |
Health Insurance Coverage by Citizenship Status in Cal Nev Ari
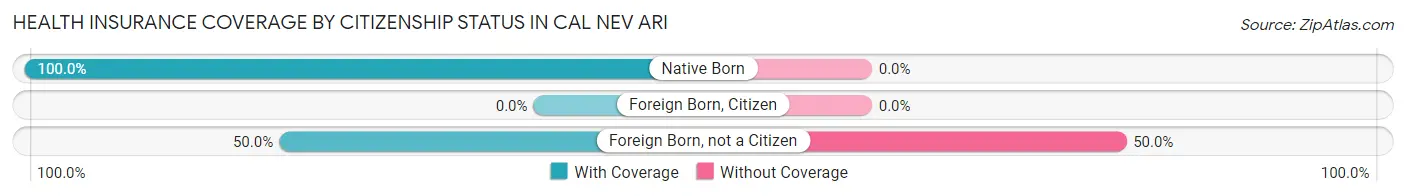
| Citizenship Status | With Coverage | Without Coverage |
| Native Born | 11 (100.0%) | 0 (0.0%) |
| Foreign Born, Citizen | 0 (0.0%) | 0 (0.0%) |
| Foreign Born, not a Citizen | 14 (50.0%) | 14 (50.0%) |
Health Insurance Coverage by Household Income in Cal Nev Ari
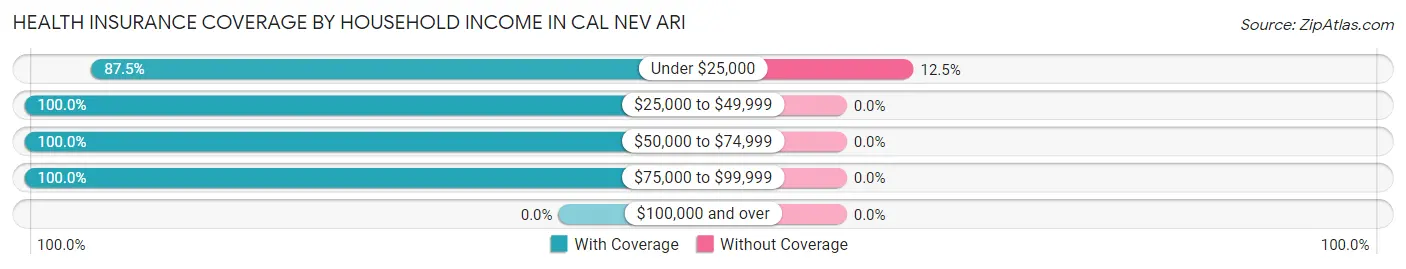
| Household Income | With Coverage | Without Coverage |
| Under $25,000 | 98 (87.5%) | 14 (12.5%) |
| $25,000 to $49,999 | 46 (100.0%) | 0 (0.0%) |
| $50,000 to $74,999 | 90 (100.0%) | 0 (0.0%) |
| $75,000 to $99,999 | 6 (100.0%) | 0 (0.0%) |
| $100,000 and over | 0 (0.0%) | 0 (0.0%) |
Public vs Private Health Insurance Coverage by Age in Cal Nev Ari
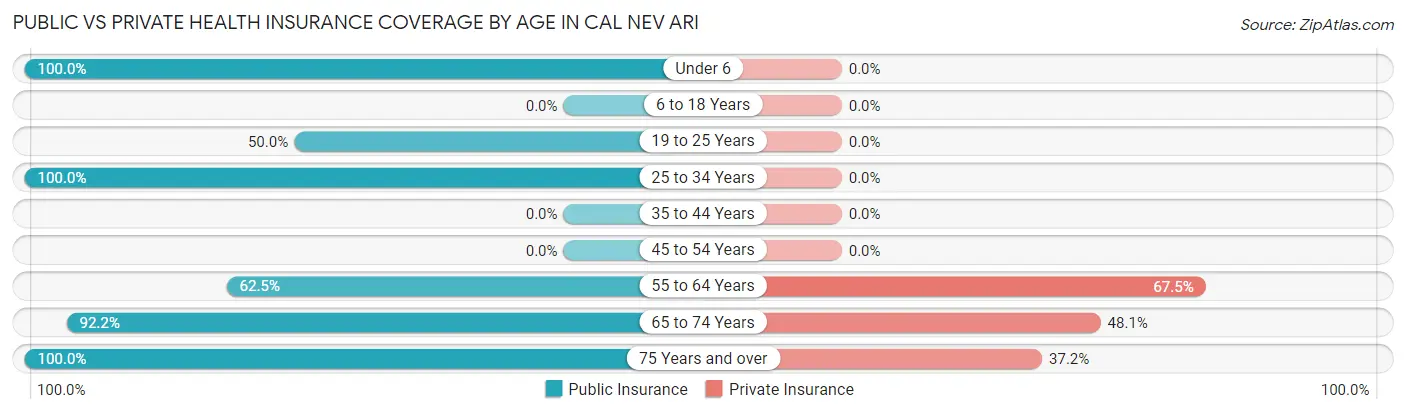
| Age Bracket | Public Insurance | Private Insurance |
| Under 6 | 11 (100.0%) | 0 (0.0%) |
| 6 to 18 Years | 0 (0.0%) | 0 (0.0%) |
| 19 to 25 Years | 14 (50.0%) | 0 (0.0%) |
| 25 to 34 Years | 20 (100.0%) | 0 (0.0%) |
| 35 to 44 Years | 0 (0.0%) | 0 (0.0%) |
| 45 to 54 Years | 0 (0.0%) | 0 (0.0%) |
| 55 to 64 Years | 25 (62.5%) | 27 (67.5%) |
| 65 to 74 Years | 71 (92.2%) | 37 (48.0%) |
| 75 Years and over | 78 (100.0%) | 29 (37.2%) |
| Total | 219 (86.2%) | 93 (36.6%) |
Disability Status by Sex by Age in Cal Nev Ari
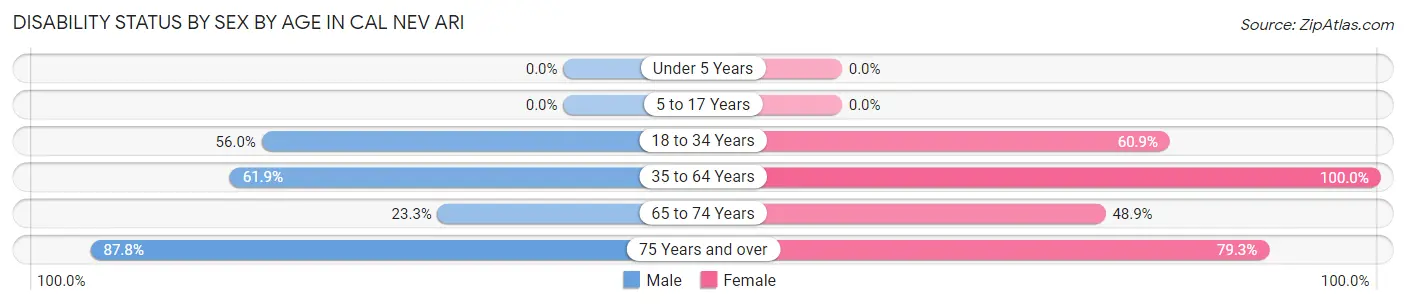
| Age Bracket | Male | Female |
| Under 5 Years | 0 (0.0%) | 0 (0.0%) |
| 5 to 17 Years | 0 (0.0%) | 0 (0.0%) |
| 18 to 34 Years | 14 (56.0%) | 14 (60.9%) |
| 35 to 64 Years | 13 (61.9%) | 19 (100.0%) |
| 65 to 74 Years | 7 (23.3%) | 23 (48.9%) |
| 75 Years and over | 43 (87.8%) | 23 (79.3%) |
Disability Class by Sex by Age in Cal Nev Ari
Disability Class: Hearing Difficulty
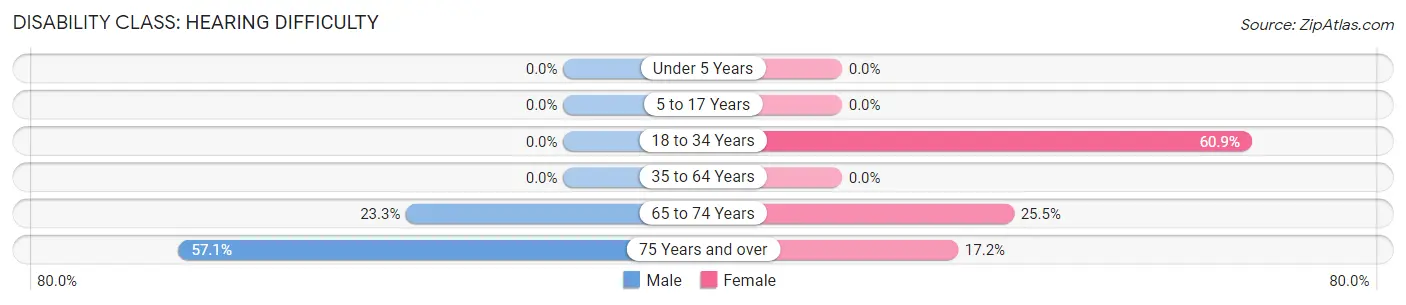
| Age Bracket | Male | Female |
| Under 5 Years | 0 (0.0%) | 0 (0.0%) |
| 5 to 17 Years | 0 (0.0%) | 0 (0.0%) |
| 18 to 34 Years | 0 (0.0%) | 14 (60.9%) |
| 35 to 64 Years | 0 (0.0%) | 0 (0.0%) |
| 65 to 74 Years | 7 (23.3%) | 12 (25.5%) |
| 75 Years and over | 28 (57.1%) | 5 (17.2%) |
Disability Class: Vision Difficulty
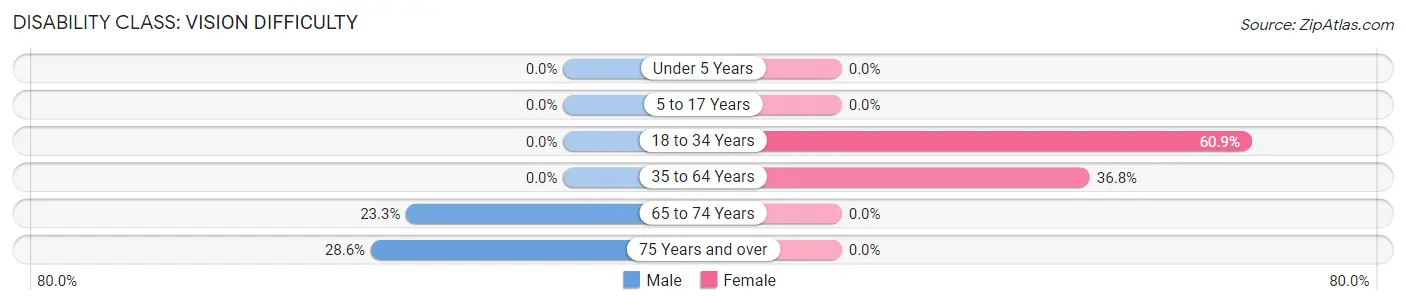
| Age Bracket | Male | Female |
| Under 5 Years | 0 (0.0%) | 0 (0.0%) |
| 5 to 17 Years | 0 (0.0%) | 0 (0.0%) |
| 18 to 34 Years | 0 (0.0%) | 14 (60.9%) |
| 35 to 64 Years | 0 (0.0%) | 7 (36.8%) |
| 65 to 74 Years | 7 (23.3%) | 0 (0.0%) |
| 75 Years and over | 14 (28.6%) | 0 (0.0%) |
Disability Class: Cognitive Difficulty
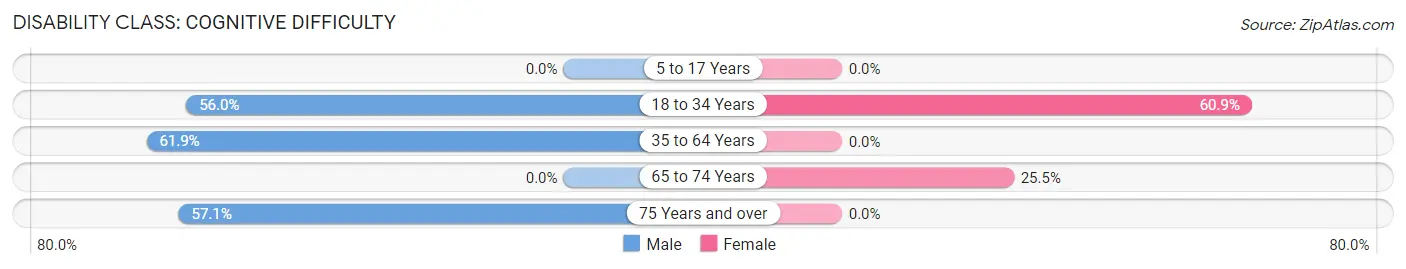
| Age Bracket | Male | Female |
| 5 to 17 Years | 0 (0.0%) | 0 (0.0%) |
| 18 to 34 Years | 14 (56.0%) | 14 (60.9%) |
| 35 to 64 Years | 13 (61.9%) | 0 (0.0%) |
| 65 to 74 Years | 0 (0.0%) | 12 (25.5%) |
| 75 Years and over | 28 (57.1%) | 0 (0.0%) |
Disability Class: Ambulatory Difficulty
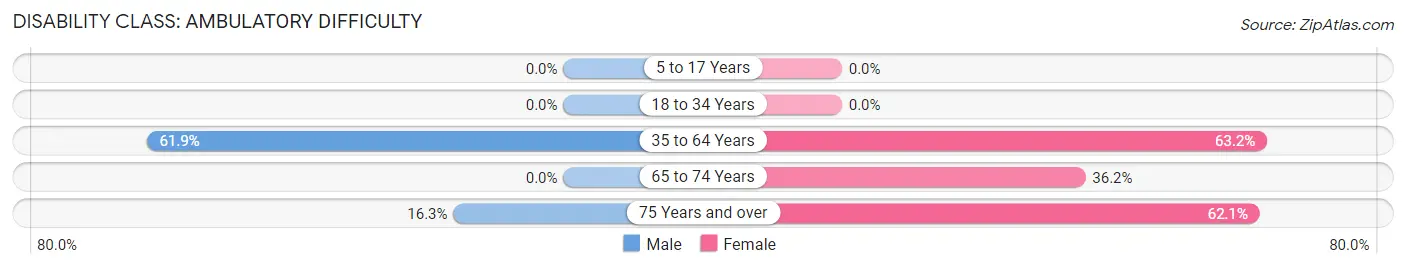
| Age Bracket | Male | Female |
| 5 to 17 Years | 0 (0.0%) | 0 (0.0%) |
| 18 to 34 Years | 0 (0.0%) | 0 (0.0%) |
| 35 to 64 Years | 13 (61.9%) | 12 (63.2%) |
| 65 to 74 Years | 0 (0.0%) | 17 (36.2%) |
| 75 Years and over | 8 (16.3%) | 18 (62.1%) |
Disability Class: Self-Care Difficulty
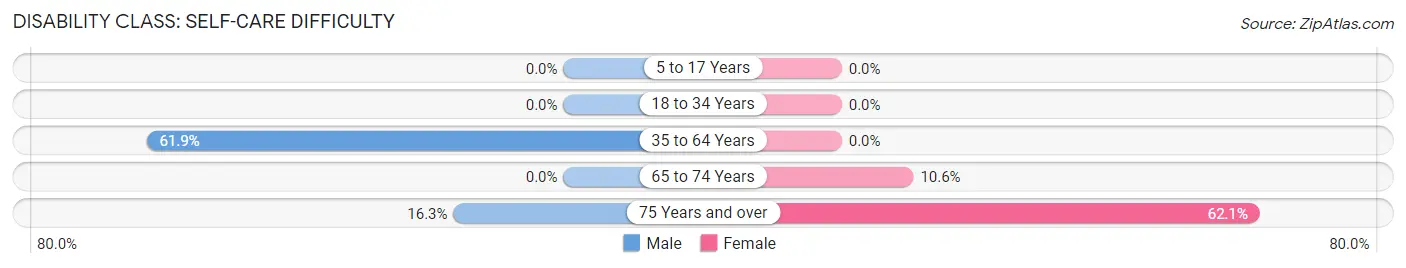
| Age Bracket | Male | Female |
| 5 to 17 Years | 0 (0.0%) | 0 (0.0%) |
| 18 to 34 Years | 0 (0.0%) | 0 (0.0%) |
| 35 to 64 Years | 13 (61.9%) | 0 (0.0%) |
| 65 to 74 Years | 0 (0.0%) | 5 (10.6%) |
| 75 Years and over | 8 (16.3%) | 18 (62.1%) |
Technology Access in Cal Nev Ari
Computing Device Access in Cal Nev Ari
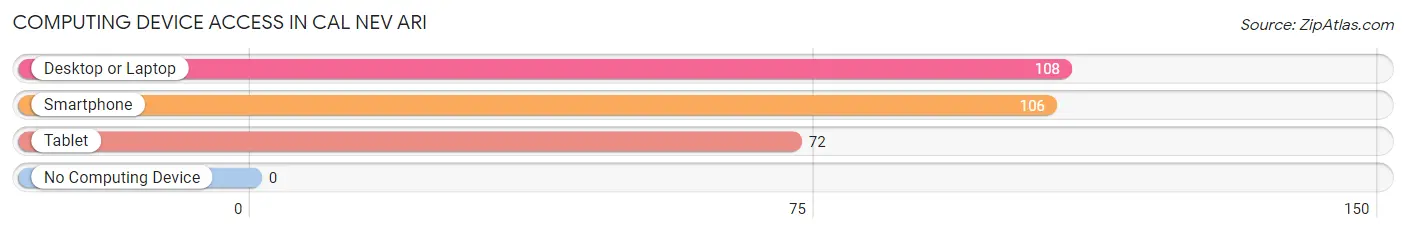
| Device Type | # Households | % Households |
| Desktop or Laptop | 108 | 73.0% |
| Smartphone | 106 | 71.6% |
| Tablet | 72 | 48.6% |
| No Computing Device | 0 | 0.0% |
| Total | 148 | 100.0% |
Internet Access in Cal Nev Ari
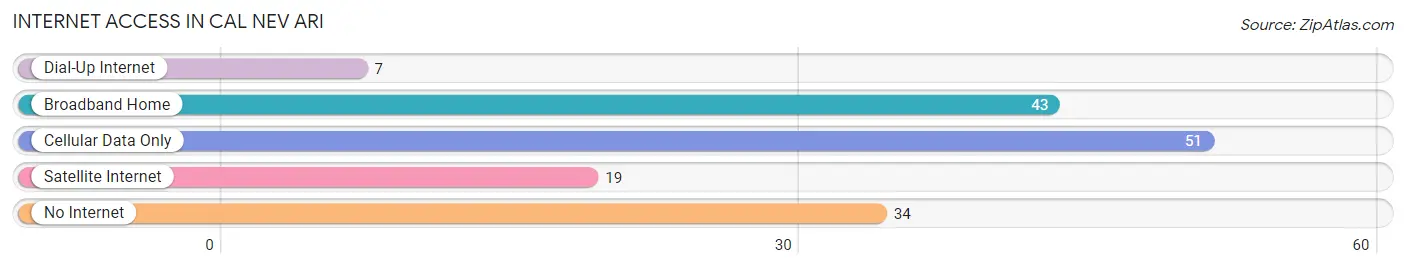
| Internet Type | # Households | % Households |
| Dial-Up Internet | 7 | 4.7% |
| Broadband Home | 43 | 29.0% |
| Cellular Data Only | 51 | 34.5% |
| Satellite Internet | 19 | 12.8% |
| No Internet | 34 | 23.0% |
| Total | 148 | 100.0% |
Cal Nev Ari Summary
Nevada is a state located in the western United States. It is bordered by Oregon to the northwest, Idaho to the northeast, California to the west, Arizona to the southeast, and Utah to the east. Nevada is the seventh most extensive, the 32nd most populous, and the ninth least densely populated of the 50 United States. The state's capital is Carson City.
History
The area that is now Nevada was first inhabited by Native American tribes, including the Paiute, Shoshone, and Washoe. The first European to explore the area was Spanish explorer Francisco Garcés in 1776. The area was later claimed by the United States as part of the Mexican Cession of 1848.
In 1861, Nevada became the 36th state to join the Union. The state was named after the Sierra Nevada mountain range, which means “snow-covered” in Spanish.
Geography
Nevada is the seventh largest state in the United States, covering an area of 110,561 square miles. It is the driest state in the country, with an average annual precipitation of only 7.5 inches.
The state is divided into two distinct regions: the Great Basin and the Mojave Desert. The Great Basin is a large area of high desert in the northern part of the state, while the Mojave Desert is a dry, arid region in the south.
The highest point in Nevada is Boundary Peak, which stands at 13,140 feet above sea level. The lowest point is the Colorado River, which is 479 feet above sea level.
Economy
Nevada has a diversified economy, with industries such as mining, tourism, manufacturing, and agriculture.
Mining is a major industry in Nevada, with gold, silver, and copper being the most important minerals. Tourism is also a major industry, with Las Vegas being the most popular destination. Other major industries include manufacturing, agriculture, and construction.
Demographics
As of the 2010 census, Nevada had a population of 2,700,551. The state is home to a diverse population, with the largest ethnic groups being White (72.2%), Hispanic or Latino (25.8%), and African American (7.7%).
The median household income in Nevada is $54,845, and the median age is 37.7 years. The state has a poverty rate of 13.3%, and the unemployment rate is 6.2%.
Conclusion
Nevada is a state located in the western United States. It is bordered by Oregon to the northwest, Idaho to the northeast, California to the west, Arizona to the southeast, and Utah to the east. Nevada is the seventh most extensive, the 32nd most populous, and the ninth least densely populated of the 50 United States. The state has a diverse population, with the largest ethnic groups being White (72.2%), Hispanic or Latino (25.8%), and African American (7.7%). The state has a diversified economy, with industries such as mining, tourism, manufacturing, and agriculture.
Common Questions
What is Per Capita Income in Cal Nev Ari?
Per Capita income in Cal Nev Ari is $21,953.
What is the Median Household income in Cal Nev Ari?
Median Household Income in Cal Nev Ari is $38,929.
What is Inequality or Gini Index in Cal Nev Ari?
Inequality or Gini Index in Cal Nev Ari is 0.33.
What is the Total Population of Cal Nev Ari?
Total Population of Cal Nev Ari is 254.
What is the Total Male Population of Cal Nev Ari?
Total Male Population of Cal Nev Ari is 132.
What is the Total Female Population of Cal Nev Ari?
Total Female Population of Cal Nev Ari is 122.
What is the Ratio of Males per 100 Females in Cal Nev Ari?
There are 108.20 Males per 100 Females in Cal Nev Ari.
What is the Ratio of Females per 100 Males in Cal Nev Ari?
There are 92.42 Females per 100 Males in Cal Nev Ari.
What is the Median Population Age in Cal Nev Ari?
Median Population Age in Cal Nev Ari is 69.4 Years.
What is the Average Family Size in Cal Nev Ari
Average Family Size in Cal Nev Ari is 2.4 People.
What is the Average Household Size in Cal Nev Ari
Average Household Size in Cal Nev Ari is 1.7 People.
How Large is the Labor Force in Cal Nev Ari?
There are 25 People in the Labor Forcein in Cal Nev Ari.
What is the Percentage of People in the Labor Force in Cal Nev Ari?
10.3% of People are in the Labor Force in Cal Nev Ari.
What is the Unemployment Rate in Cal Nev Ari?
Unemployment Rate in Cal Nev Ari is 44.0%.