Indian Springs, NV Map & Demographics
Indian Springs Map
Indian Springs Overview
$27,358
PER CAPITA INCOME
$78,472
AVG FAMILY INCOME
$56,250
AVG HOUSEHOLD INCOME
43.1%
WAGE / INCOME GAP [ % ]
56.9¢/ $1
WAGE / INCOME GAP [ $ ]
0.38
INEQUALITY / GINI INDEX
837
TOTAL POPULATION
424
MALE POPULATION
413
FEMALE POPULATION
102.66
MALES / 100 FEMALES
97.41
FEMALES / 100 MALES
35.0
MEDIAN AGE
3.7
AVG FAMILY SIZE
3.0
AVG HOUSEHOLD SIZE
404
LABOR FORCE [ PEOPLE ]
64.3%
PERCENT IN LABOR FORCE
5.8%
UNEMPLOYMENT RATE
Indian Springs Area Codes
Income in Indian Springs
Income Overview in Indian Springs
Per Capita Income in Indian Springs is $27,358, while median incomes of families and households are $78,472 and $56,250 respectively.
| Characteristic | Number | Measure |
| Per Capita Income | 837 | $27,358 |
| Median Family Income | 191 | $78,472 |
| Mean Family Income | 191 | $96,337 |
| Median Household Income | 283 | $56,250 |
| Mean Household Income | 283 | $78,881 |
| Income Deficit | 191 | $0 |
| Wage / Income Gap (%) | 837 | 43.07% |
| Wage / Income Gap ($) | 837 | 56.93¢ per $1 |
| Gini / Inequality Index | 837 | 0.38 |
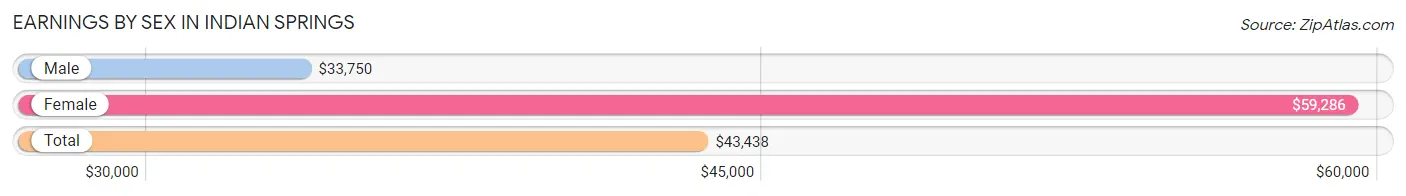
Earnings by Sex in Indian Springs
Average Earnings in Indian Springs are $43,438, $33,750 for men and $59,286 for women, a difference of 43.1%.
| Sex | Number | Average Earnings |
| Male | 188 (46.5%) | $33,750 |
| Female | 216 (53.5%) | $59,286 |
| Total | 404 (100.0%) | $43,438 |
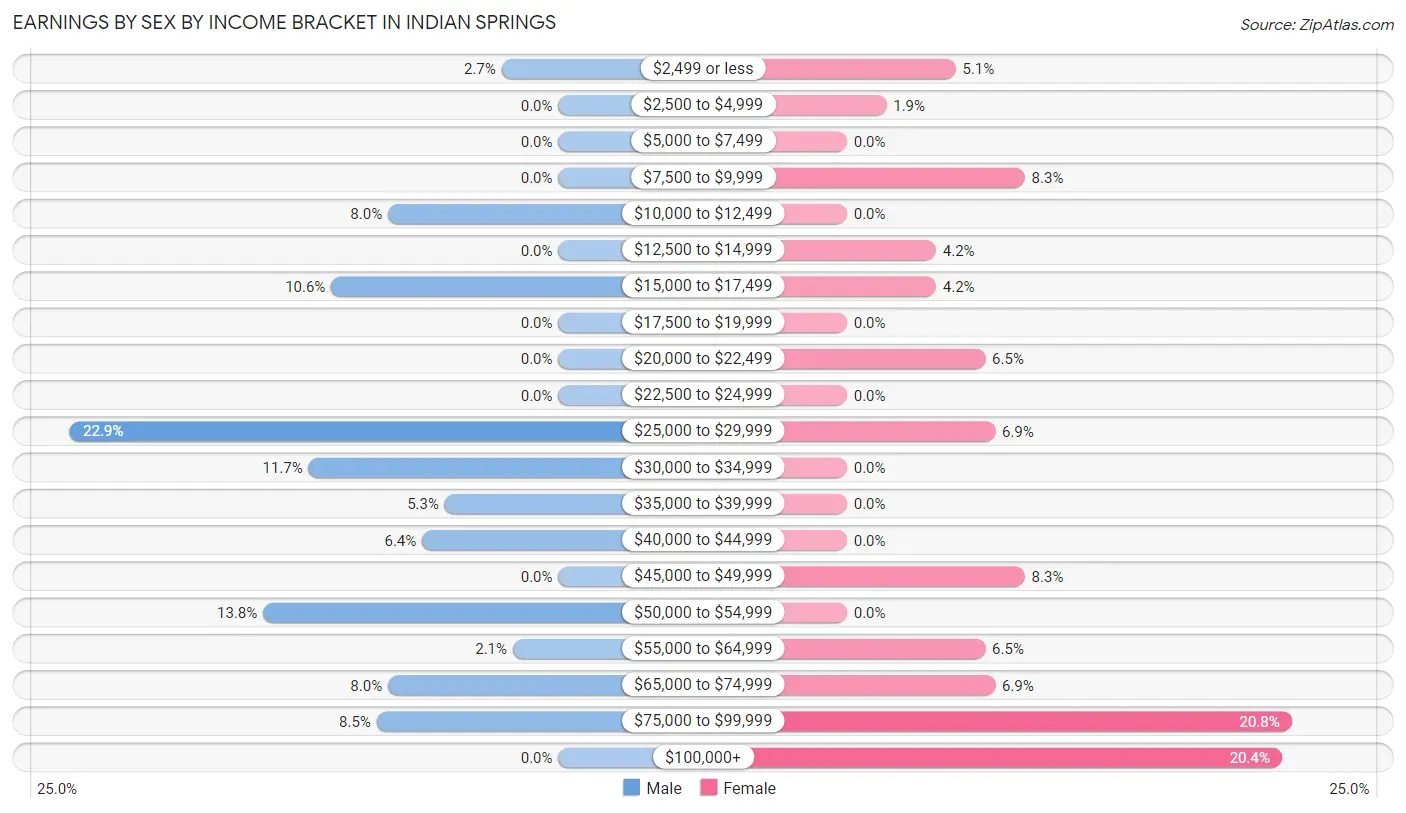
Earnings by Sex by Income Bracket in Indian Springs
The most common earnings brackets in Indian Springs are $25,000 to $29,999 for men (43 | 22.9%) and $75,000 to $99,999 for women (45 | 20.8%).
| Income | Male | Female |
| $2,499 or less | 5 (2.7%) | 11 (5.1%) |
| $2,500 to $4,999 | 0 (0.0%) | 4 (1.8%) |
| $5,000 to $7,499 | 0 (0.0%) | 0 (0.0%) |
| $7,500 to $9,999 | 0 (0.0%) | 18 (8.3%) |
| $10,000 to $12,499 | 15 (8.0%) | 0 (0.0%) |
| $12,500 to $14,999 | 0 (0.0%) | 9 (4.2%) |
| $15,000 to $17,499 | 20 (10.6%) | 9 (4.2%) |
| $17,500 to $19,999 | 0 (0.0%) | 0 (0.0%) |
| $20,000 to $22,499 | 0 (0.0%) | 14 (6.5%) |
| $22,500 to $24,999 | 0 (0.0%) | 0 (0.0%) |
| $25,000 to $29,999 | 43 (22.9%) | 15 (6.9%) |
| $30,000 to $34,999 | 22 (11.7%) | 0 (0.0%) |
| $35,000 to $39,999 | 10 (5.3%) | 0 (0.0%) |
| $40,000 to $44,999 | 12 (6.4%) | 0 (0.0%) |
| $45,000 to $49,999 | 0 (0.0%) | 18 (8.3%) |
| $50,000 to $54,999 | 26 (13.8%) | 0 (0.0%) |
| $55,000 to $64,999 | 4 (2.1%) | 14 (6.5%) |
| $65,000 to $74,999 | 15 (8.0%) | 15 (6.9%) |
| $75,000 to $99,999 | 16 (8.5%) | 45 (20.8%) |
| $100,000+ | 0 (0.0%) | 44 (20.4%) |
| Total | 188 (100.0%) | 216 (100.0%) |
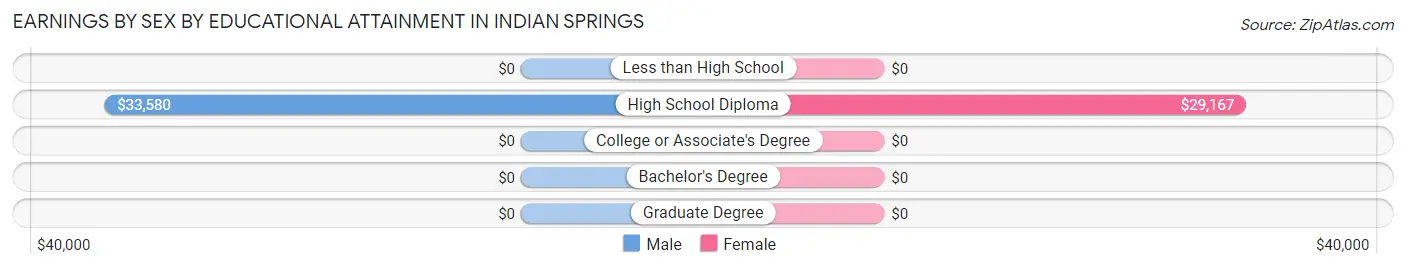
Earnings by Sex by Educational Attainment in Indian Springs
Average earnings in Indian Springs are $33,466 for men and $71,750 for women, a difference of 53.4%. Men with an educational attainment of high school diploma enjoy the highest average annual earnings of $33,580, while those with high school diploma education earn the least with $33,580. Women with an educational attainment of high school diploma earn the most with the average annual earnings of $29,167, while those with high school diploma education have the smallest earnings of $29,167.
| Educational Attainment | Male Income | Female Income |
| Less than High School | - | - |
| High School Diploma | $33,580 | $29,167 |
| College or Associate's Degree | - | - |
| Bachelor's Degree | - | - |
| Graduate Degree | - | - |
| Total | $33,466 | $71,750 |
Family Income in Indian Springs
Family Income Brackets in Indian Springs
According to the Indian Springs family income data, there are 47 families falling into the $50,000 to $74,999 income range, which is the most common income bracket and makes up 24.6% of all families.
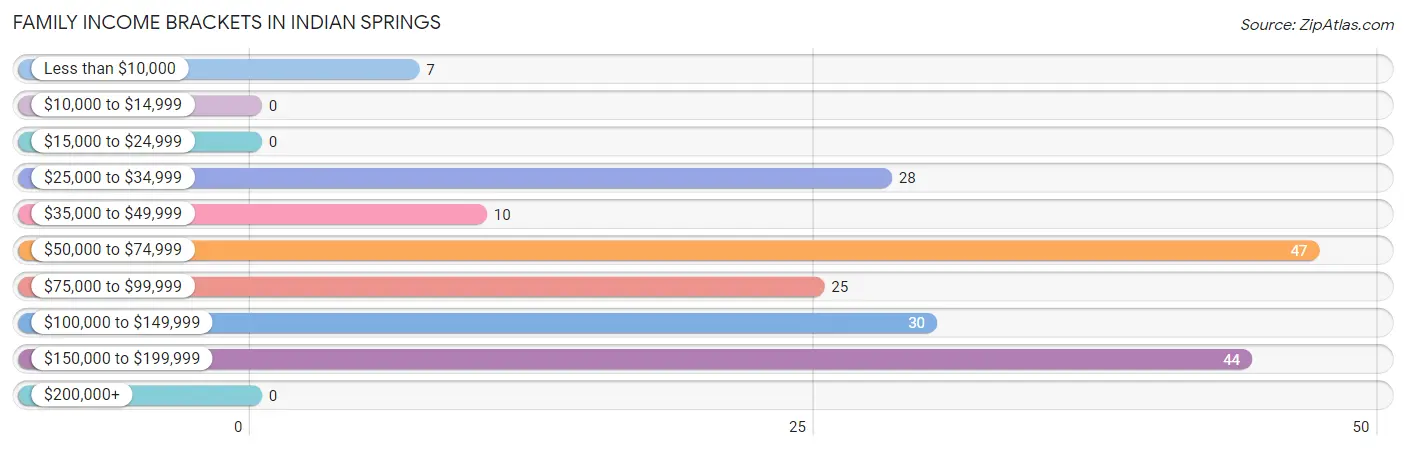
| Income Bracket | # Families | % Families |
| Less than $10,000 | 7 | 3.7% |
| $10,000 to $14,999 | 0 | 0.0% |
| $15,000 to $24,999 | 0 | 0.0% |
| $25,000 to $34,999 | 28 | 14.7% |
| $35,000 to $49,999 | 10 | 5.2% |
| $50,000 to $74,999 | 47 | 24.6% |
| $75,000 to $99,999 | 25 | 13.1% |
| $100,000 to $149,999 | 30 | 15.7% |
| $150,000 to $199,999 | 44 | 23.0% |
| $200,000+ | 0 | 0.0% |
Family Income by Famaliy Size in Indian Springs
3-person families (34 | 17.8%) account for the highest median family income in Indian Springs with $74,808 per family, while 3-person families (34 | 17.8%) have the highest median income of $24,936 per family member.
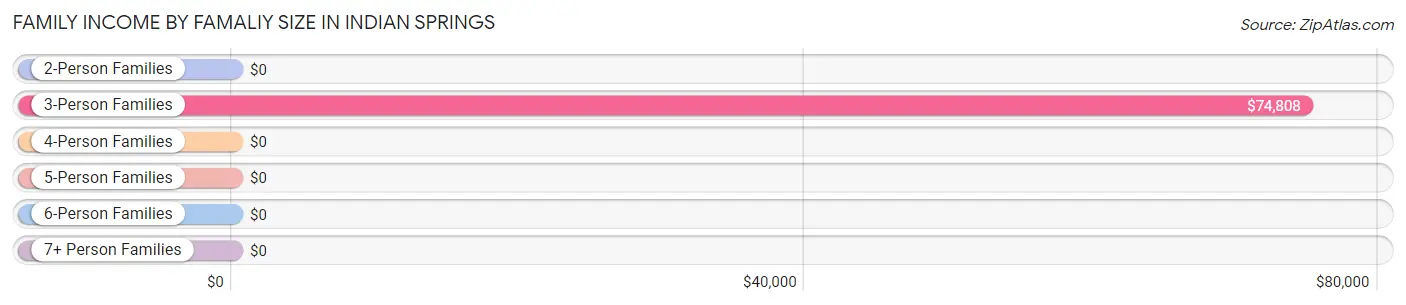
| Income Bracket | # Families | Median Income |
| 2-Person Families | 80 (41.9%) | $0 |
| 3-Person Families | 34 (17.8%) | $74,808 |
| 4-Person Families | 17 (8.9%) | $0 |
| 5-Person Families | 44 (23.0%) | $0 |
| 6-Person Families | 16 (8.4%) | $0 |
| 7+ Person Families | 0 (0.0%) | $0 |
| Total | 191 (100.0%) | $78,472 |
Family Income by Number of Earners in Indian Springs
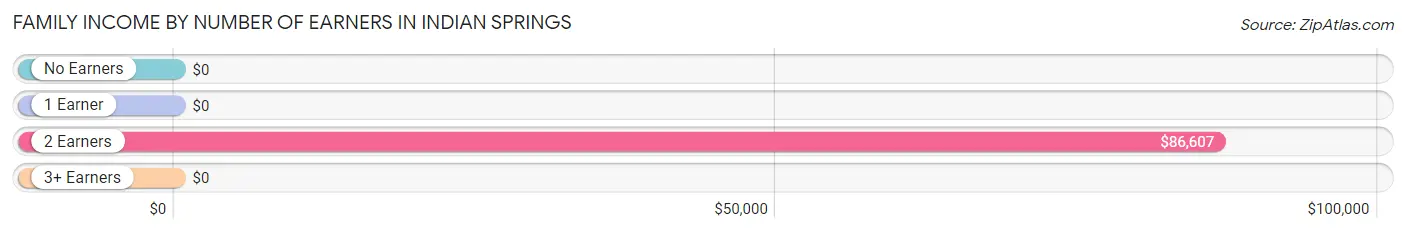
| Number of Earners | # Families | Median Income |
| No Earners | 7 (3.7%) | $0 |
| 1 Earner | 22 (11.5%) | $0 |
| 2 Earners | 162 (84.8%) | $86,607 |
| 3+ Earners | 0 (0.0%) | $0 |
| Total | 191 (100.0%) | $78,472 |
Household Income in Indian Springs
Household Income Brackets in Indian Springs
With 101 households falling in the category, the $50,000 to $74,999 income range is the most frequent in Indian Springs, accounting for 35.7% of all households.
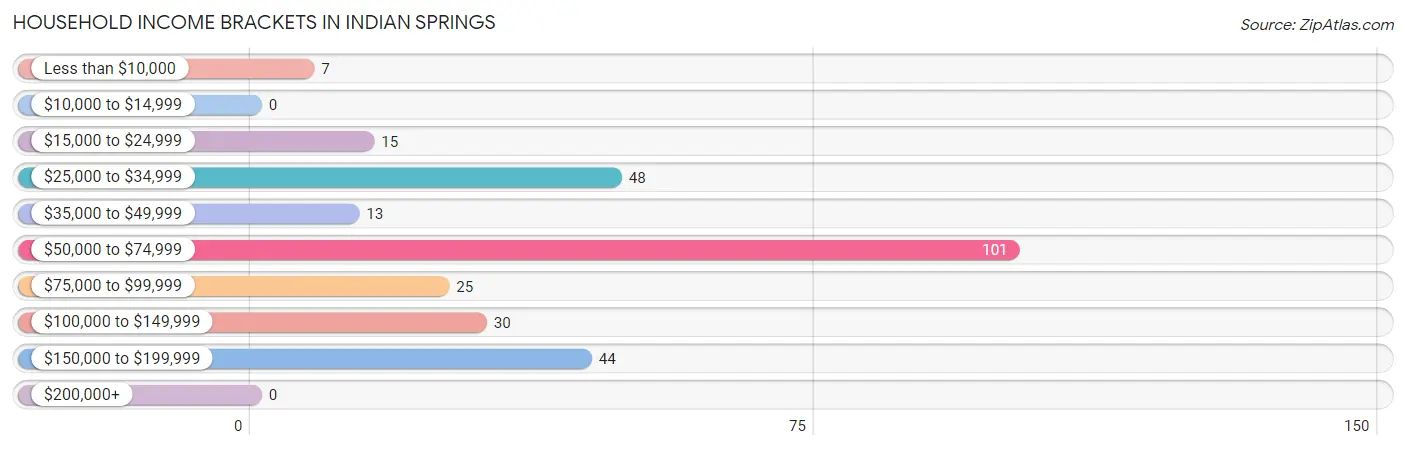
| Income Bracket | # Households | % Households |
| Less than $10,000 | 7 | 2.5% |
| $10,000 to $14,999 | 0 | 0.0% |
| $15,000 to $24,999 | 15 | 5.3% |
| $25,000 to $34,999 | 48 | 17.0% |
| $35,000 to $49,999 | 13 | 4.6% |
| $50,000 to $74,999 | 101 | 35.7% |
| $75,000 to $99,999 | 25 | 8.8% |
| $100,000 to $149,999 | 30 | 10.6% |
| $150,000 to $199,999 | 44 | 15.5% |
| $200,000+ | 0 | 0.0% |
Household Income by Householder Age in Indian Springs
The median household income in Indian Springs is $56,250, with the highest median household income of $85,357 found in the 45 to 64 years age bracket for the primary householder. A total of 84 households (29.7%) fall into this category. Meanwhile, the 15 to 24 years age bracket for the primary householder has the lowest median household income of $0, with 10 households (3.5%) in this group.
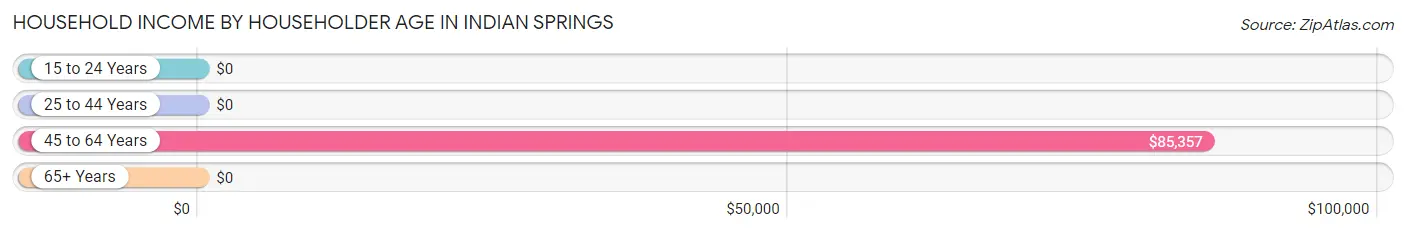
| Income Bracket | # Households | Median Income |
| 15 to 24 Years | 10 (3.5%) | $0 |
| 25 to 44 Years | 121 (42.8%) | $0 |
| 45 to 64 Years | 84 (29.7%) | $85,357 |
| 65+ Years | 68 (24.0%) | $0 |
| Total | 283 (100.0%) | $56,250 |
Poverty in Indian Springs
Income Below Poverty by Sex and Age in Indian Springs
With 9.7% poverty level for males and 13.3% for females among the residents of Indian Springs, 6 to 11 year old males and 18 to 24 year old females are the most vulnerable to poverty, with 14 males (45.2%) and 18 females (62.1%) in their respective age groups living below the poverty level.
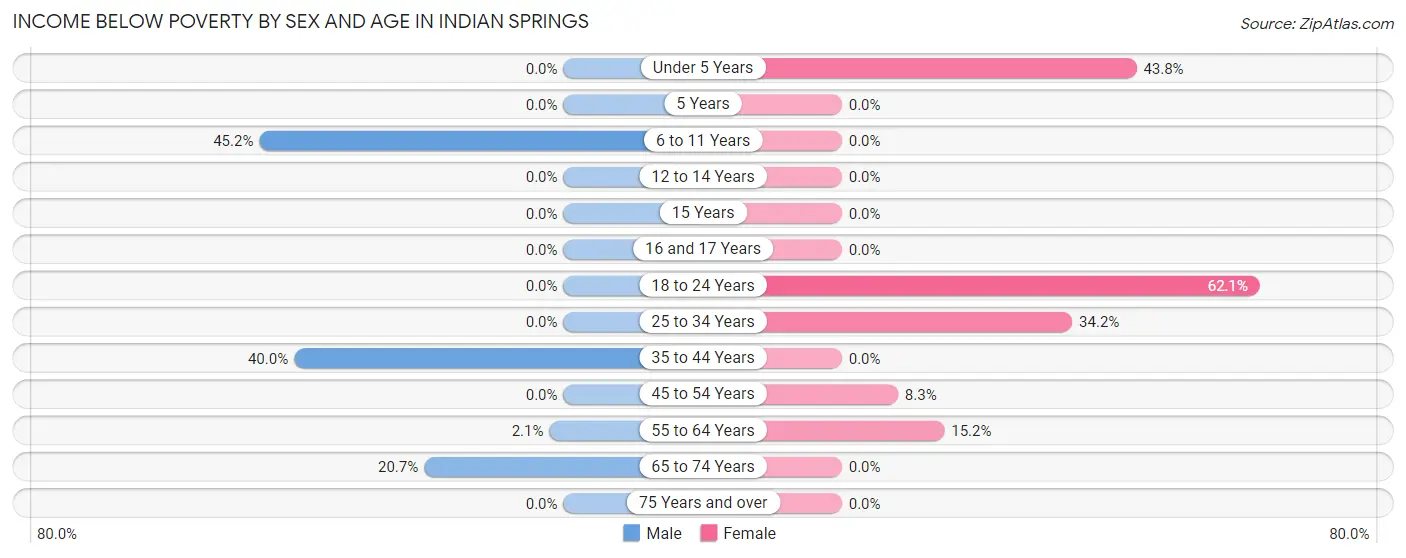
| Age Bracket | Male | Female |
| Under 5 Years | 0 (0.0%) | 14 (43.8%) |
| 5 Years | 0 (0.0%) | 0 (0.0%) |
| 6 to 11 Years | 14 (45.2%) | 0 (0.0%) |
| 12 to 14 Years | 0 (0.0%) | 0 (0.0%) |
| 15 Years | 0 (0.0%) | 0 (0.0%) |
| 16 and 17 Years | 0 (0.0%) | 0 (0.0%) |
| 18 to 24 Years | 0 (0.0%) | 18 (62.1%) |
| 25 to 34 Years | 0 (0.0%) | 13 (34.2%) |
| 35 to 44 Years | 14 (40.0%) | 0 (0.0%) |
| 45 to 54 Years | 0 (0.0%) | 3 (8.3%) |
| 55 to 64 Years | 1 (2.1%) | 7 (15.2%) |
| 65 to 74 Years | 12 (20.7%) | 0 (0.0%) |
| 75 Years and over | 0 (0.0%) | 0 (0.0%) |
| Total | 41 (9.7%) | 55 (13.3%) |
Income Above Poverty by Sex and Age in Indian Springs
According to the poverty statistics in Indian Springs, males aged under 5 years and females aged 6 to 11 years are the age groups that are most secure financially, with 100.0% of males and 100.0% of females in these age groups living above the poverty line.
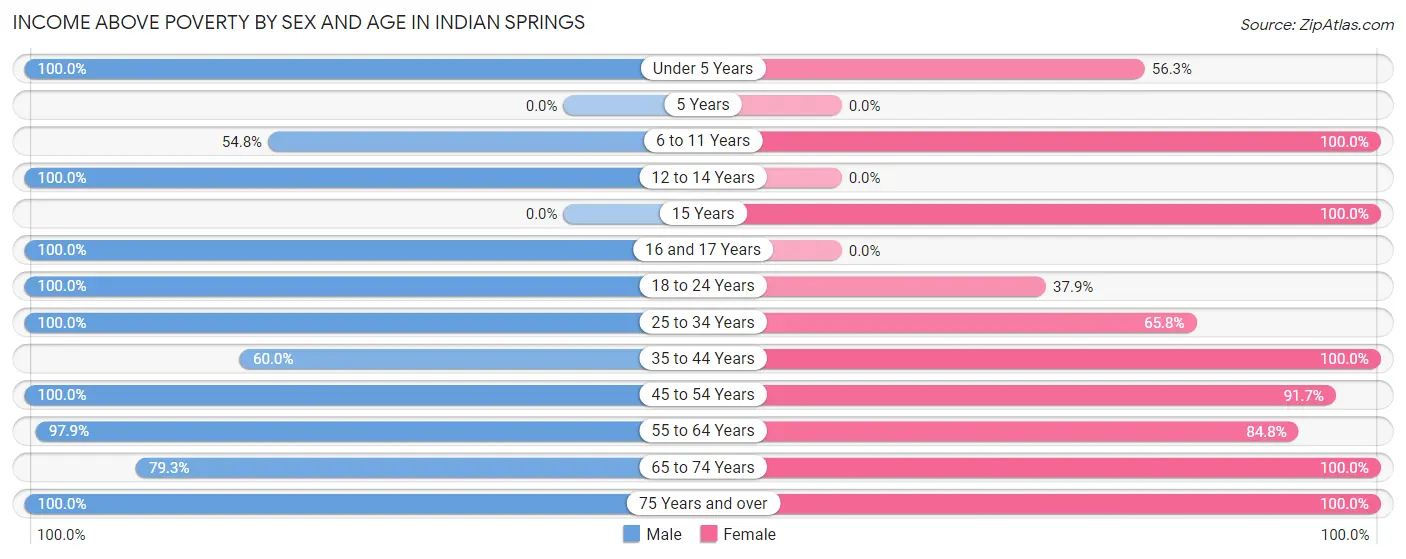
| Age Bracket | Male | Female |
| Under 5 Years | 4 (100.0%) | 18 (56.2%) |
| 5 Years | 0 (0.0%) | 0 (0.0%) |
| 6 to 11 Years | 17 (54.8%) | 42 (100.0%) |
| 12 to 14 Years | 48 (100.0%) | 0 (0.0%) |
| 15 Years | 0 (0.0%) | 52 (100.0%) |
| 16 and 17 Years | 63 (100.0%) | 0 (0.0%) |
| 18 to 24 Years | 25 (100.0%) | 11 (37.9%) |
| 25 to 34 Years | 55 (100.0%) | 25 (65.8%) |
| 35 to 44 Years | 21 (60.0%) | 106 (100.0%) |
| 45 to 54 Years | 41 (100.0%) | 33 (91.7%) |
| 55 to 64 Years | 47 (97.9%) | 39 (84.8%) |
| 65 to 74 Years | 46 (79.3%) | 14 (100.0%) |
| 75 Years and over | 16 (100.0%) | 18 (100.0%) |
| Total | 383 (90.3%) | 358 (86.7%) |
Income Below Poverty Among Married-Couple Families in Indian Springs
The poverty statistics for married-couple families in Indian Springs show that 10.7% or 20 of the total 186 families live below the poverty line. Families with 1 or 2 children have the highest poverty rate of 41.9%, comprising of 13 families. On the other hand, families with 3 or 4 children have the lowest poverty rate of 0.0%, which includes 0 families.
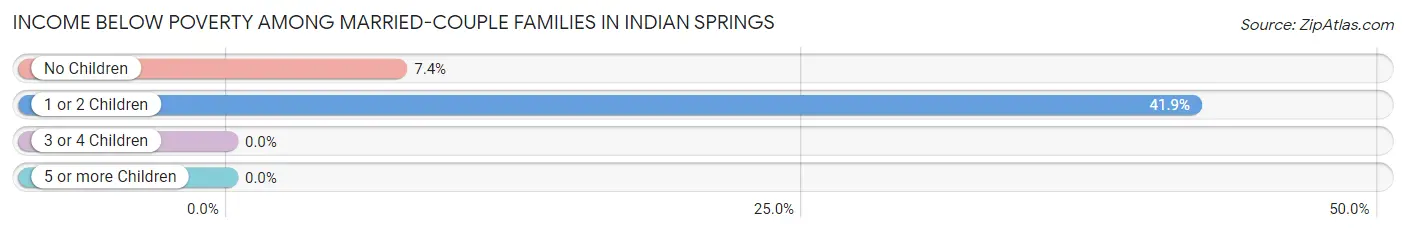
| Children | Above Poverty | Below Poverty |
| No Children | 88 (92.6%) | 7 (7.4%) |
| 1 or 2 Children | 18 (58.1%) | 13 (41.9%) |
| 3 or 4 Children | 60 (100.0%) | 0 (0.0%) |
| 5 or more Children | 0 (0.0%) | 0 (0.0%) |
| Total | 166 (89.2%) | 20 (10.7%) |
Income Below Poverty Among Single-Parent Households in Indian Springs
| Children | Single Father | Single Mother |
| No Children | 0 (0.0%) | 0 (0.0%) |
| 1 or 2 Children | 0 (0.0%) | 0 (0.0%) |
| 3 or 4 Children | 0 (0.0%) | 0 (0.0%) |
| 5 or more Children | 0 (0.0%) | 0 (0.0%) |
| Total | 0 (0.0%) | 0 (0.0%) |
Income Below Poverty Among Married-Couple vs Single-Parent Households in Indian Springs
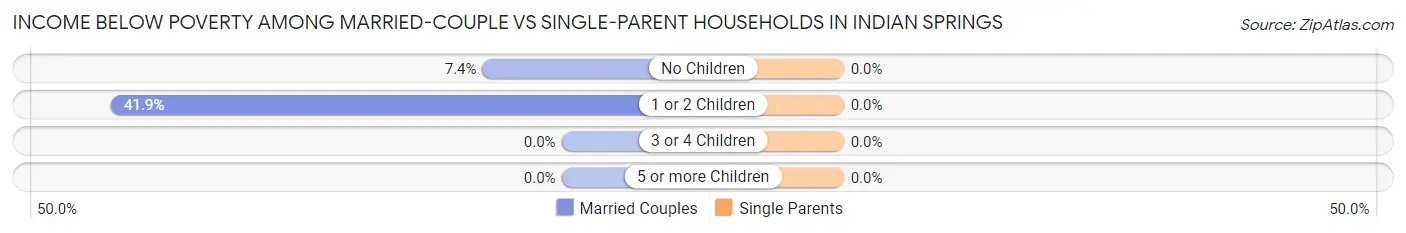
| Children | Married-Couple Families | Single-Parent Households |
| No Children | 7 (7.4%) | 0 (0.0%) |
| 1 or 2 Children | 13 (41.9%) | 0 (0.0%) |
| 3 or 4 Children | 0 (0.0%) | 0 (0.0%) |
| 5 or more Children | 0 (0.0%) | 0 (0.0%) |
| Total | 20 (10.7%) | 0 (0.0%) |
Race in Indian Springs
The most populous races in Indian Springs are White / Caucasian (624 | 74.6%), Hispanic or Latino (201 | 24.0%), and Two or more Races (144 | 17.2%).
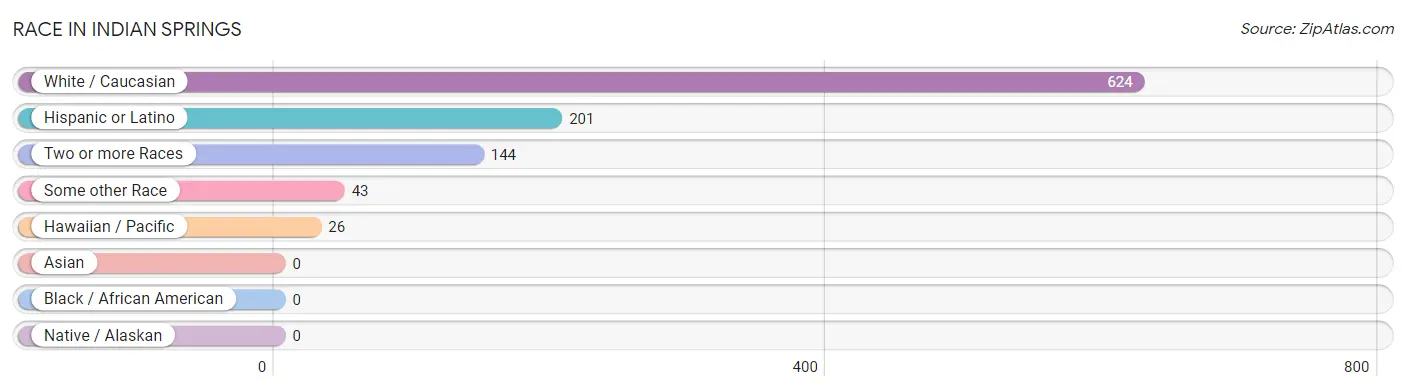
| Race | # Population | % Population |
| Asian | 0 | 0.0% |
| Black / African American | 0 | 0.0% |
| Hawaiian / Pacific | 26 | 3.1% |
| Hispanic or Latino | 201 | 24.0% |
| Native / Alaskan | 0 | 0.0% |
| White / Caucasian | 624 | 74.6% |
| Two or more Races | 144 | 17.2% |
| Some other Race | 43 | 5.1% |
| Total | 837 | 100.0% |
Ancestry in Indian Springs
The most populous ancestries reported in Indian Springs are English (281 | 33.6%), German (168 | 20.1%), Mexican (153 | 18.3%), Irish (136 | 16.3%), and Puerto Rican (48 | 5.7%), together accounting for 93.9% of all Indian Springs residents.
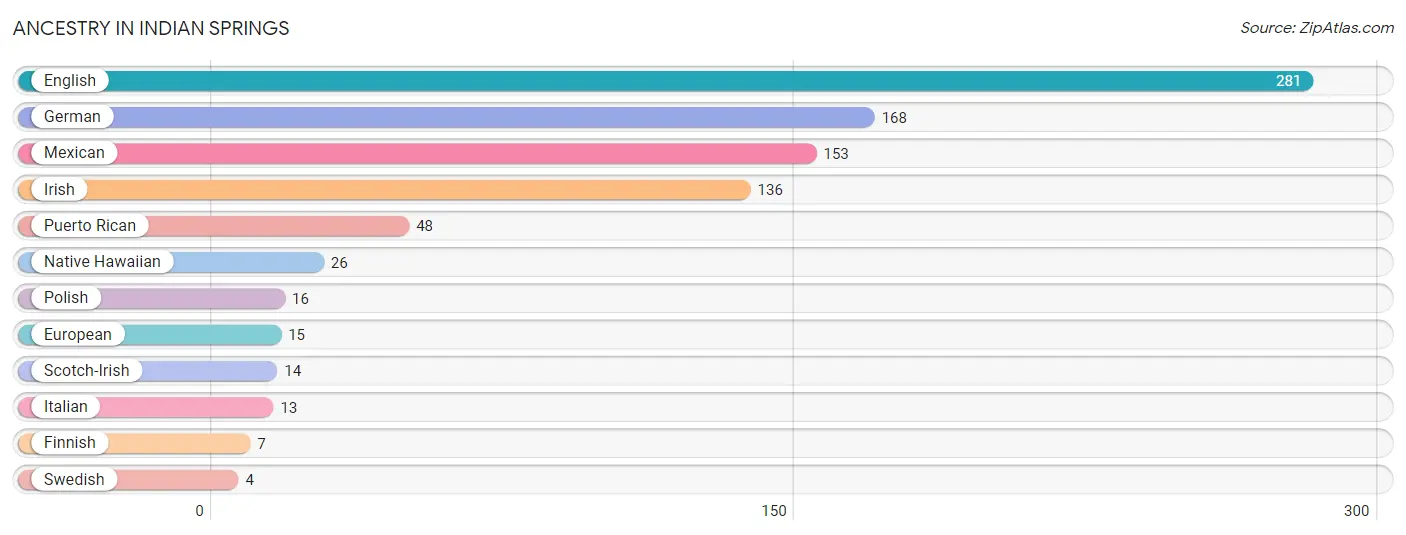
| Ancestry | # Population | % Population |
| English | 281 | 33.6% |
| European | 15 | 1.8% |
| Finnish | 7 | 0.8% |
| German | 168 | 20.1% |
| Irish | 136 | 16.3% |
| Italian | 13 | 1.5% |
| Mexican | 153 | 18.3% |
| Native Hawaiian | 26 | 3.1% |
| Polish | 16 | 1.9% |
| Puerto Rican | 48 | 5.7% |
| Scotch-Irish | 14 | 1.7% |
| Swedish | 4 | 0.5% | View All 12 Rows |
Immigrants in Indian Springs
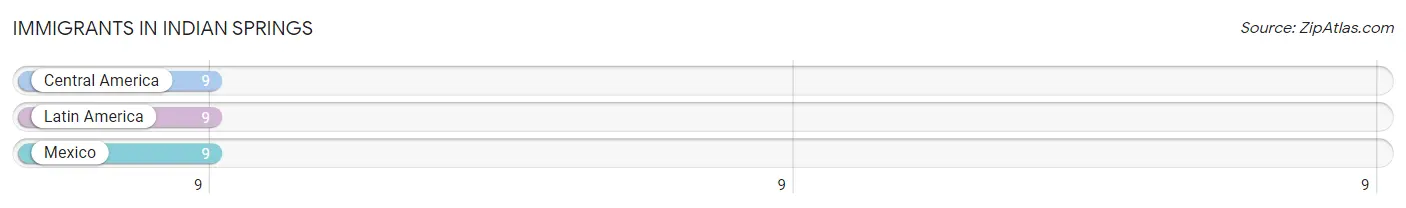
The most numerous immigrant groups reported in Indian Springs came from Central America (9 | 1.1%), Latin America (9 | 1.1%), and Mexico (9 | 1.1%), together accounting for 3.2% of all Indian Springs residents.
| Immigration Origin | # Population | % Population |
| Central America | 9 | 1.1% |
| Latin America | 9 | 1.1% |
| Mexico | 9 | 1.1% | View All 3 Rows |
Sex and Age in Indian Springs
Sex and Age in Indian Springs
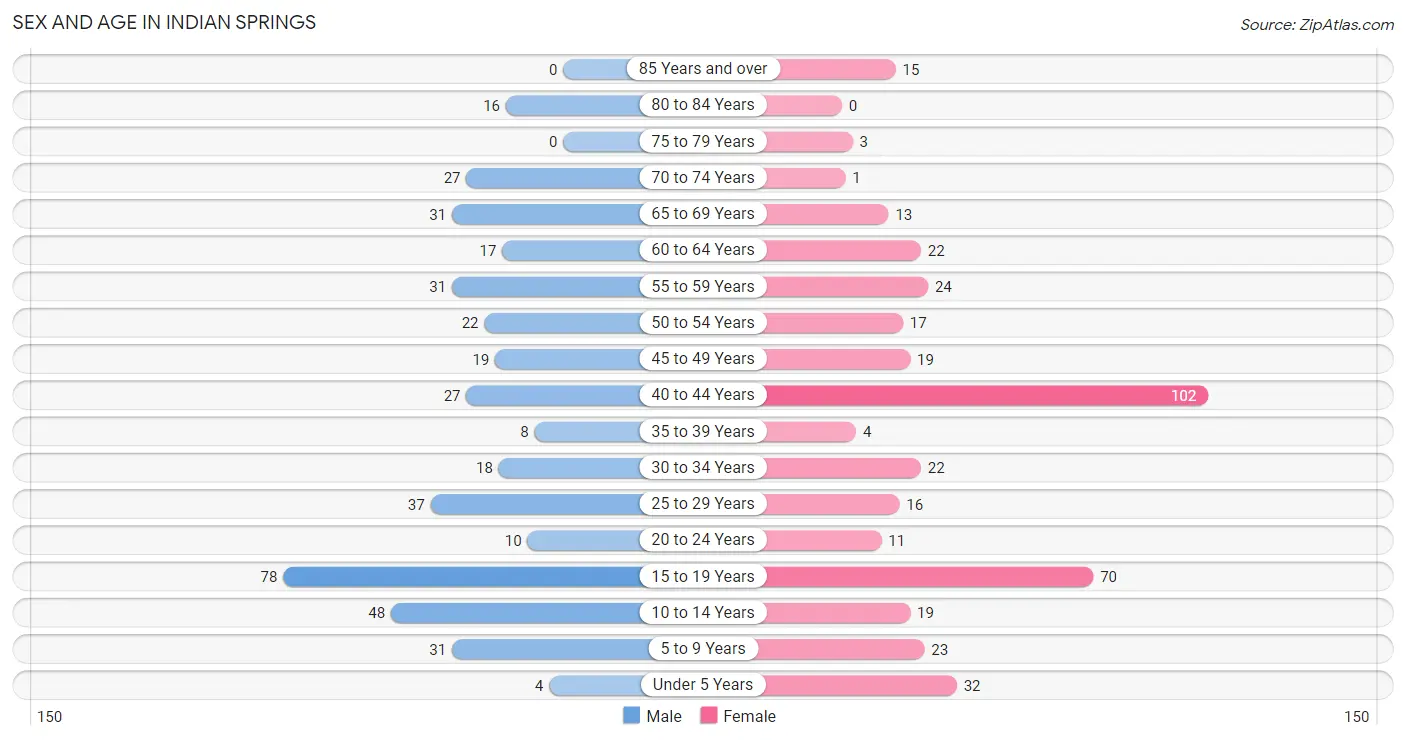
The most populous age groups in Indian Springs are 15 to 19 Years (78 | 18.4%) for men and 40 to 44 Years (102 | 24.7%) for women.
| Age Bracket | Male | Female |
| Under 5 Years | 4 (0.9%) | 32 (7.7%) |
| 5 to 9 Years | 31 (7.3%) | 23 (5.6%) |
| 10 to 14 Years | 48 (11.3%) | 19 (4.6%) |
| 15 to 19 Years | 78 (18.4%) | 70 (17.0%) |
| 20 to 24 Years | 10 (2.4%) | 11 (2.7%) |
| 25 to 29 Years | 37 (8.7%) | 16 (3.9%) |
| 30 to 34 Years | 18 (4.3%) | 22 (5.3%) |
| 35 to 39 Years | 8 (1.9%) | 4 (1.0%) |
| 40 to 44 Years | 27 (6.4%) | 102 (24.7%) |
| 45 to 49 Years | 19 (4.5%) | 19 (4.6%) |
| 50 to 54 Years | 22 (5.2%) | 17 (4.1%) |
| 55 to 59 Years | 31 (7.3%) | 24 (5.8%) |
| 60 to 64 Years | 17 (4.0%) | 22 (5.3%) |
| 65 to 69 Years | 31 (7.3%) | 13 (3.2%) |
| 70 to 74 Years | 27 (6.4%) | 1 (0.2%) |
| 75 to 79 Years | 0 (0.0%) | 3 (0.7%) |
| 80 to 84 Years | 16 (3.8%) | 0 (0.0%) |
| 85 Years and over | 0 (0.0%) | 15 (3.6%) |
| Total | 424 (100.0%) | 413 (100.0%) |
Families and Households in Indian Springs
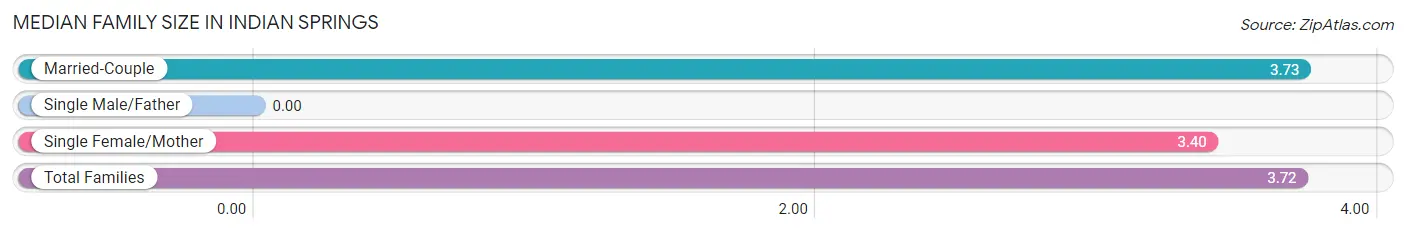
Median Family Size in Indian Springs
| Family Type | # Families | Family Size |
| Married-Couple | 186 (97.4%) | 3.73 |
| Single Male/Father | 0 (0.0%) | - |
| Single Female/Mother | 5 (2.6%) | 3.40 |
| Total Families | 191 (100.0%) | 3.72 |
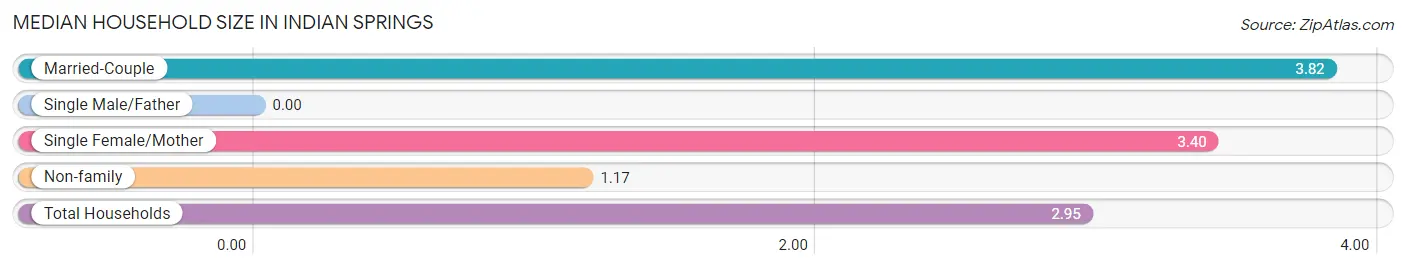
Median Household Size in Indian Springs
| Household Type | # Households | Household Size |
| Married-Couple | 186 (65.7%) | 3.82 |
| Single Male/Father | 0 (0.0%) | - |
| Single Female/Mother | 5 (1.8%) | 3.40 |
| Non-family | 92 (32.5%) | 1.17 |
| Total Households | 283 (100.0%) | 2.95 |
Household Size by Marriage Status in Indian Springs
Out of a total of 283 households in Indian Springs, 191 (67.5%) are family households, while 92 (32.5%) are nonfamily households. The most numerous type of family households are 2-person households, comprising 80, and the most common type of nonfamily households are 1-person households, comprising 75.
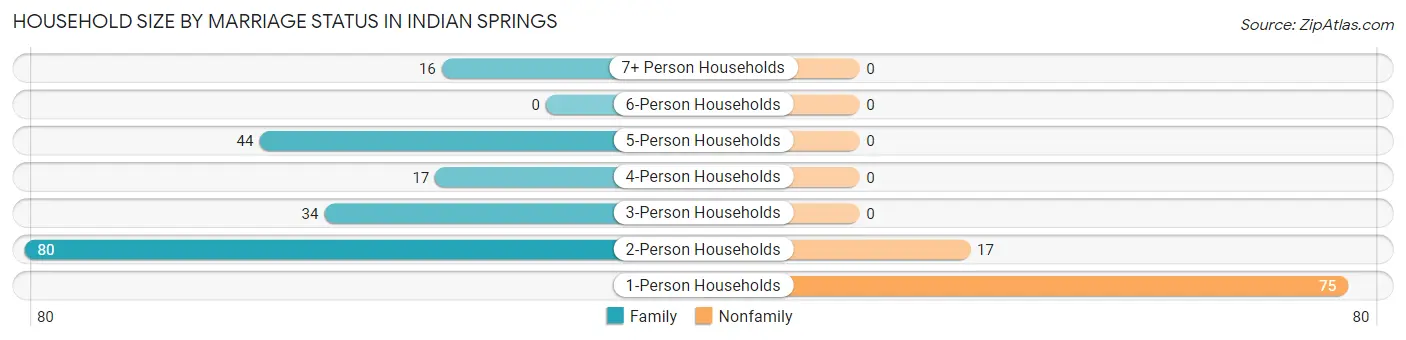
| Household Size | Family Households | Nonfamily Households |
| 1-Person Households | - | 75 (26.5%) |
| 2-Person Households | 80 (28.3%) | 17 (6.0%) |
| 3-Person Households | 34 (12.0%) | 0 (0.0%) |
| 4-Person Households | 17 (6.0%) | 0 (0.0%) |
| 5-Person Households | 44 (15.5%) | 0 (0.0%) |
| 6-Person Households | 0 (0.0%) | 0 (0.0%) |
| 7+ Person Households | 16 (5.7%) | 0 (0.0%) |
| Total | 191 (67.5%) | 92 (32.5%) |
Female Fertility in Indian Springs
Fertility by Age in Indian Springs
| Age Bracket | Women with Births | Births / 1,000 Women |
| 15 to 19 years | 0 (0.0%) | 0.0 |
| 20 to 34 years | 0 (0.0%) | 0.0 |
| 35 to 50 years | 0 (0.0%) | 0.0 |
| Total | 0 (0.0%) | 0.0 |
Fertility by Age by Marriage Status in Indian Springs
| Age Bracket | Married | Unmarried |
| 15 to 19 years | 0 (0.0%) | 0 (0.0%) |
| 20 to 34 years | 0 (0.0%) | 0 (0.0%) |
| 35 to 50 years | 0 (0.0%) | 0 (0.0%) |
| Total | 0 (0.0%) | 0 (0.0%) |
Fertility by Education in Indian Springs
| Educational Attainment | Women with Births | Births / 1,000 Women |
| Less than High School | 0 (0.0%) | 0.0 |
| High School Diploma | 0 (0.0%) | 0.0 |
| College or Associate's Degree | 0 (0.0%) | 0.0 |
| Bachelor's Degree | 0 (0.0%) | 0.0 |
| Graduate Degree | 0 (0.0%) | 0.0 |
| Total | 0 (0.0%) | 0.0 |
Fertility by Education by Marriage Status in Indian Springs
| Educational Attainment | Married | Unmarried |
| Less than High School | 0 (0.0%) | 0 (0.0%) |
| High School Diploma | 0 (0.0%) | 0 (0.0%) |
| College or Associate's Degree | 0 (0.0%) | 0 (0.0%) |
| Bachelor's Degree | 0 (0.0%) | 0 (0.0%) |
| Graduate Degree | 0 (0.0%) | 0 (0.0%) |
| Total | 0 (0.0%) | 0 (0.0%) |
Employment Characteristics in Indian Springs
Employment by Class of Employer in Indian Springs
Among the 381 employed individuals in Indian Springs, private company employees (265 | 69.6%), self-employed (not incorporated) (45 | 11.8%), and federal government employees (37 | 9.7%) make up the most common classes of employment.
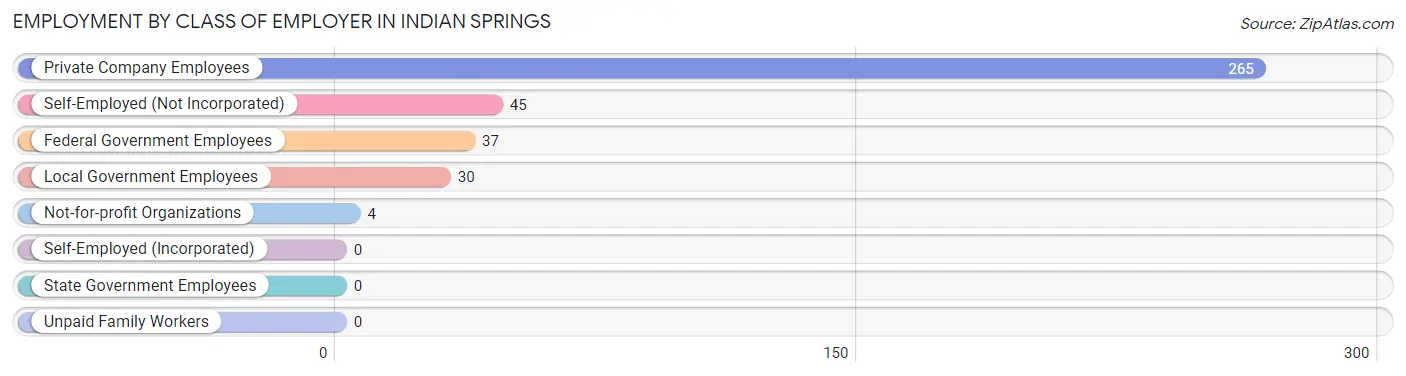
| Employer Class | # Employees | % Employees |
| Private Company Employees | 265 | 69.6% |
| Self-Employed (Incorporated) | 0 | 0.0% |
| Self-Employed (Not Incorporated) | 45 | 11.8% |
| Not-for-profit Organizations | 4 | 1.1% |
| Local Government Employees | 30 | 7.9% |
| State Government Employees | 0 | 0.0% |
| Federal Government Employees | 37 | 9.7% |
| Unpaid Family Workers | 0 | 0.0% |
| Total | 381 | 100.0% |
Employment Status by Age in Indian Springs
According to the labor force statistics for Indian Springs, out of the total population over 16 years of age (628), 64.3% or 404 individuals are in the labor force, with 5.8% or 23 of them unemployed. The age group with the highest labor force participation rate is 20 to 24 years, with 100.0% or 21 individuals in the labor force. Within the labor force, the 16 to 19 years age range has the highest percentage of unemployed individuals, with 100.0% or 23 of them being unemployed.
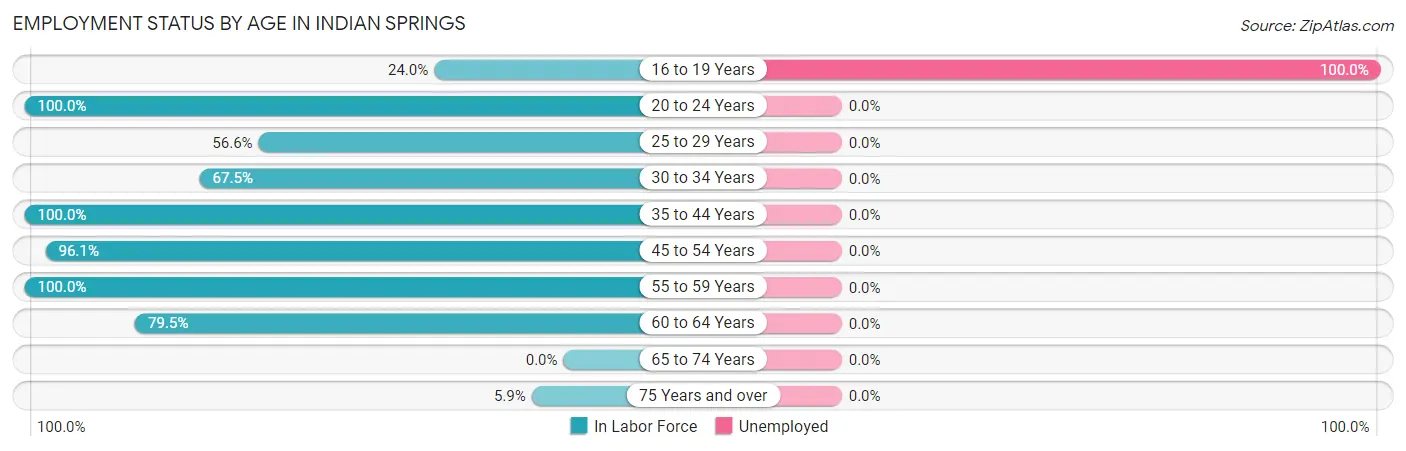
| Age Bracket | In Labor Force | Unemployed |
| 16 to 19 Years | 23 (24.0%) | 23 (100.0%) |
| 20 to 24 Years | 21 (100.0%) | 0 (0.0%) |
| 25 to 29 Years | 30 (56.6%) | 0 (0.0%) |
| 30 to 34 Years | 27 (67.5%) | 0 (0.0%) |
| 35 to 44 Years | 141 (100.0%) | 0 (0.0%) |
| 45 to 54 Years | 74 (96.1%) | 0 (0.0%) |
| 55 to 59 Years | 55 (100.0%) | 0 (0.0%) |
| 60 to 64 Years | 31 (79.5%) | 0 (0.0%) |
| 65 to 74 Years | 0 (0.0%) | 0 (0.0%) |
| 75 Years and over | 2 (5.9%) | 0 (0.0%) |
| Total | 404 (64.3%) | 23 (5.8%) |
Employment Status by Educational Attainment in Indian Springs
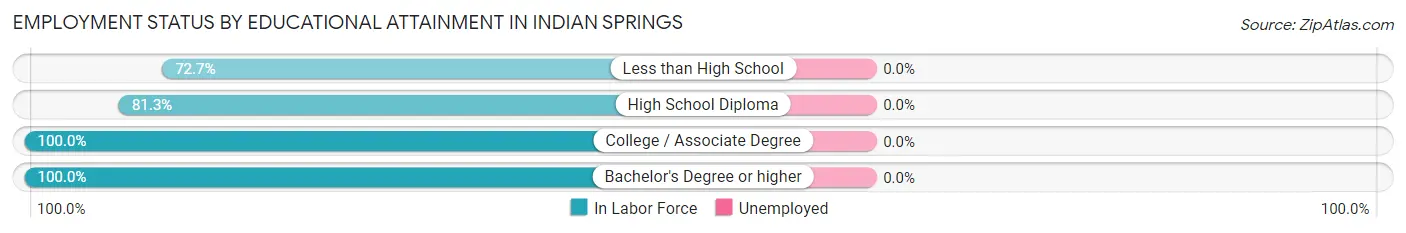
| Educational Attainment | In Labor Force | Unemployed |
| Less than High School | 8 (72.7%) | 0 (0.0%) |
| High School Diploma | 191 (81.3%) | 0 (0.0%) |
| College / Associate Degree | 70 (100.0%) | 0 (0.0%) |
| Bachelor's Degree or higher | 89 (100.0%) | 0 (0.0%) |
| Total | 358 (88.4%) | 0 (0.0%) |
Employment Occupations by Sex in Indian Springs
Management, Business, Science and Arts Occupations
The most common Management, Business, Science and Arts occupations in Indian Springs are Health Diagnosing & Treating (59 | 15.9%), Business & Financial (45 | 12.1%), Health Technologists (44 | 11.9%), Community & Social Service (15 | 4.0%), and Education Instruction & Library (15 | 4.0%).
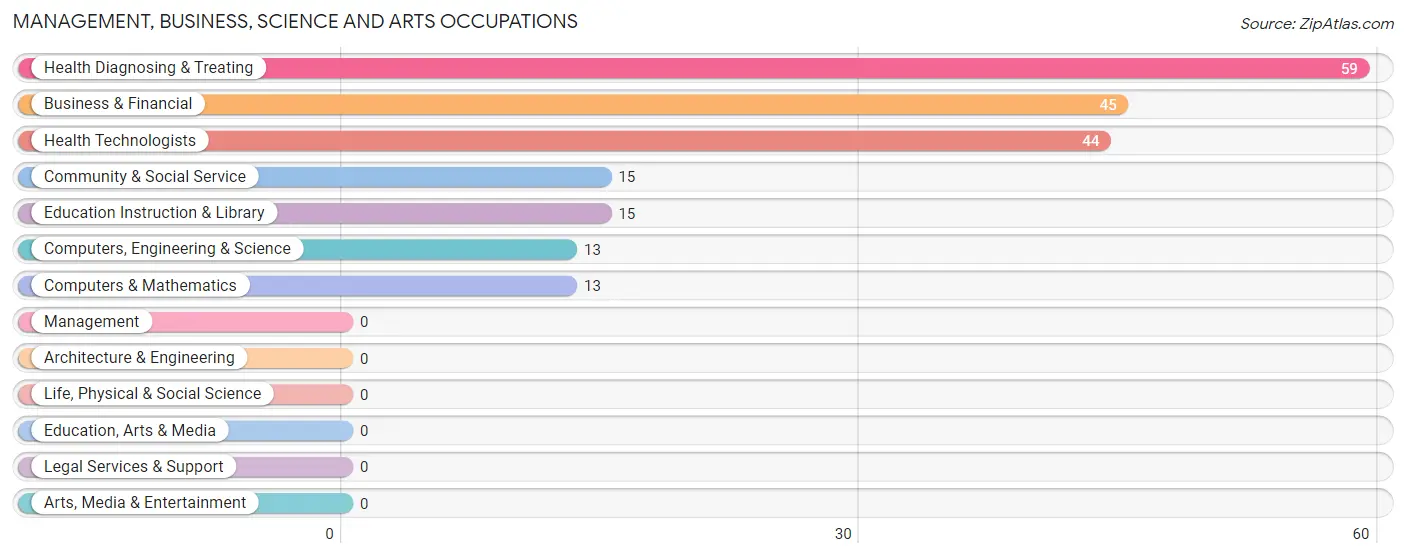
Management, Business, Science and Arts Occupations by Sex
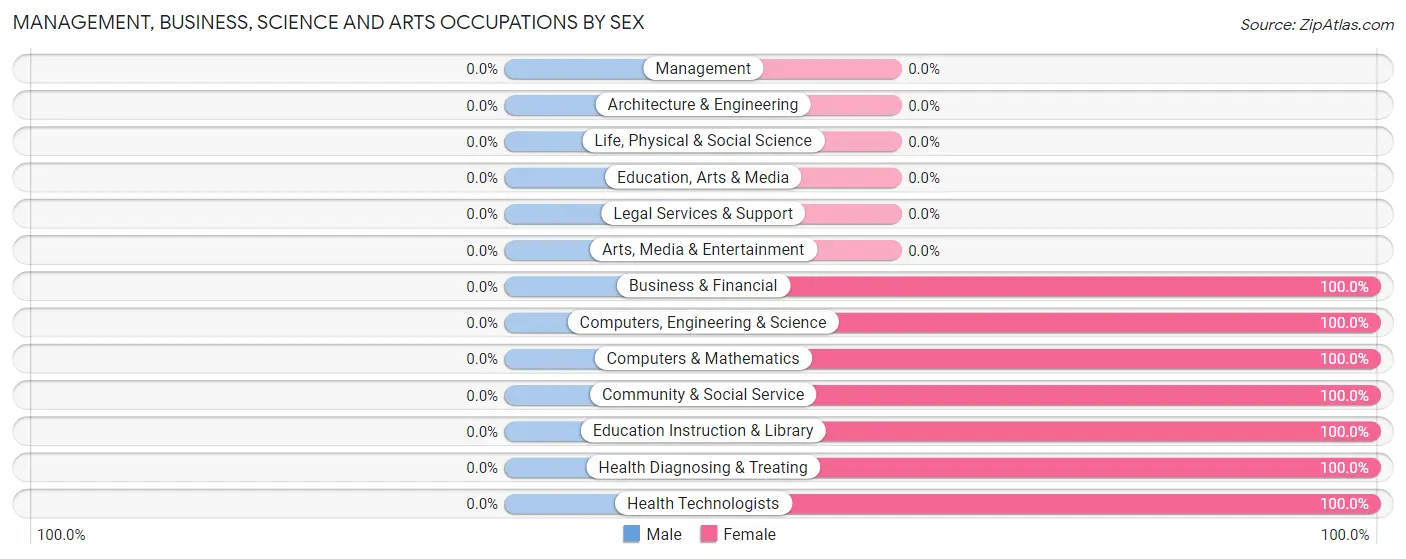
| Occupation | Male | Female |
| Management | 0 (0.0%) | 0 (0.0%) |
| Business & Financial | 0 (0.0%) | 45 (100.0%) |
| Computers, Engineering & Science | 0 (0.0%) | 13 (100.0%) |
| Computers & Mathematics | 0 (0.0%) | 13 (100.0%) |
| Architecture & Engineering | 0 (0.0%) | 0 (0.0%) |
| Life, Physical & Social Science | 0 (0.0%) | 0 (0.0%) |
| Community & Social Service | 0 (0.0%) | 15 (100.0%) |
| Education, Arts & Media | 0 (0.0%) | 0 (0.0%) |
| Legal Services & Support | 0 (0.0%) | 0 (0.0%) |
| Education Instruction & Library | 0 (0.0%) | 15 (100.0%) |
| Arts, Media & Entertainment | 0 (0.0%) | 0 (0.0%) |
| Health Diagnosing & Treating | 0 (0.0%) | 59 (100.0%) |
| Health Technologists | 0 (0.0%) | 44 (100.0%) |
| Total (Category) | 0 (0.0%) | 132 (100.0%) |
| Total (Overall) | 173 (46.6%) | 198 (53.4%) |
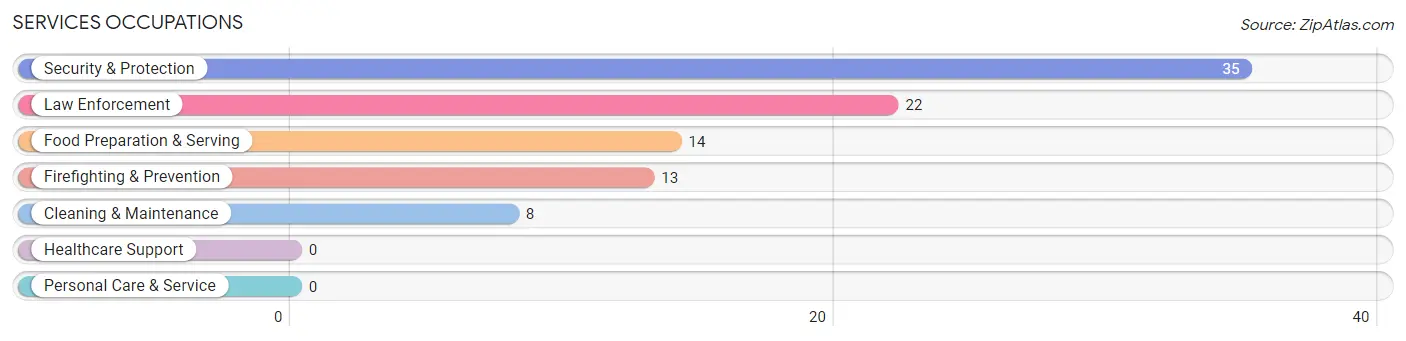
Services Occupations
The most common Services occupations in Indian Springs are Security & Protection (35 | 9.4%), Law Enforcement (22 | 5.9%), Food Preparation & Serving (14 | 3.8%), Firefighting & Prevention (13 | 3.5%), and Cleaning & Maintenance (8 | 2.2%).
Services Occupations by Sex
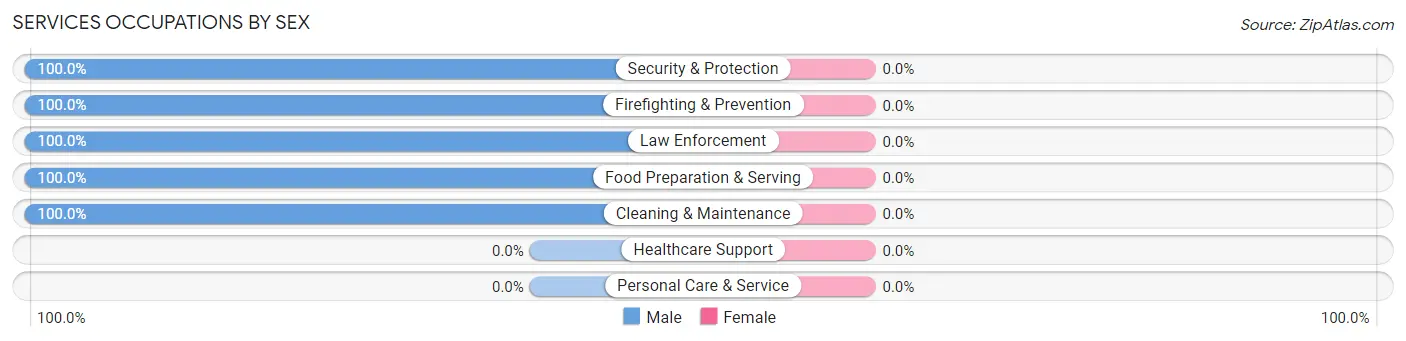
| Occupation | Male | Female |
| Healthcare Support | 0 (0.0%) | 0 (0.0%) |
| Security & Protection | 35 (100.0%) | 0 (0.0%) |
| Firefighting & Prevention | 13 (100.0%) | 0 (0.0%) |
| Law Enforcement | 22 (100.0%) | 0 (0.0%) |
| Food Preparation & Serving | 14 (100.0%) | 0 (0.0%) |
| Cleaning & Maintenance | 8 (100.0%) | 0 (0.0%) |
| Personal Care & Service | 0 (0.0%) | 0 (0.0%) |
| Total (Category) | 57 (100.0%) | 0 (0.0%) |
| Total (Overall) | 173 (46.6%) | 198 (53.4%) |
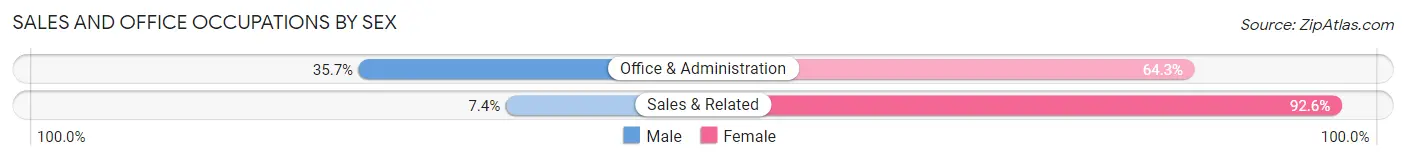
Sales and Office Occupations
The most common Sales and Office occupations in Indian Springs are Office & Administration (42 | 11.3%), and Sales & Related (27 | 7.3%).
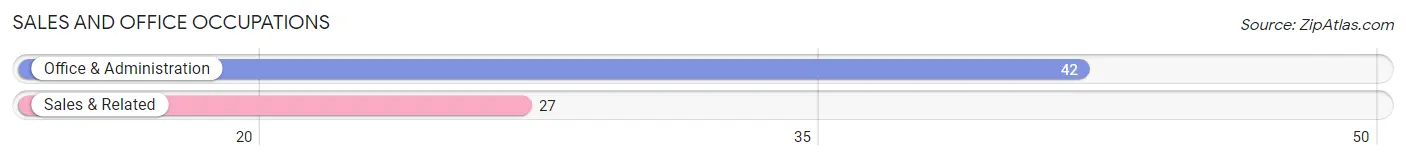
Sales and Office Occupations by Sex
| Occupation | Male | Female |
| Sales & Related | 2 (7.4%) | 25 (92.6%) |
| Office & Administration | 15 (35.7%) | 27 (64.3%) |
| Total (Category) | 17 (24.6%) | 52 (75.4%) |
| Total (Overall) | 173 (46.6%) | 198 (53.4%) |
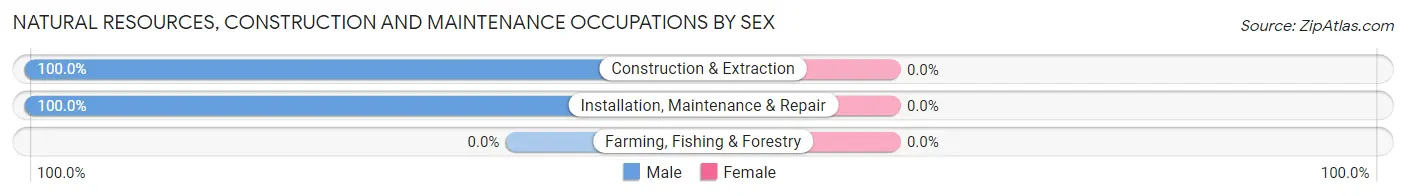
Natural Resources, Construction and Maintenance Occupations
The most common Natural Resources, Construction and Maintenance occupations in Indian Springs are Construction & Extraction (37 | 10.0%), and Installation, Maintenance & Repair (16 | 4.3%).
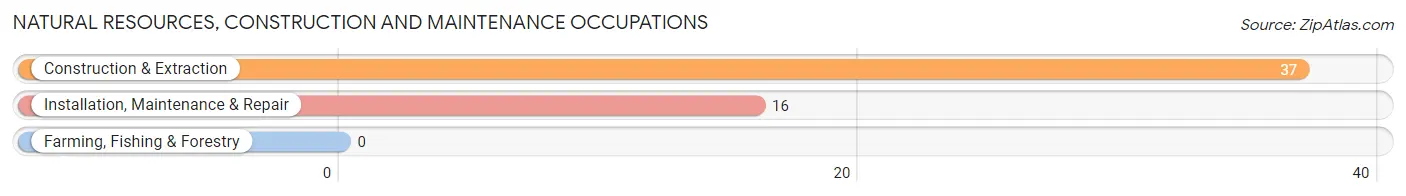
Natural Resources, Construction and Maintenance Occupations by Sex
| Occupation | Male | Female |
| Farming, Fishing & Forestry | 0 (0.0%) | 0 (0.0%) |
| Construction & Extraction | 37 (100.0%) | 0 (0.0%) |
| Installation, Maintenance & Repair | 16 (100.0%) | 0 (0.0%) |
| Total (Category) | 53 (100.0%) | 0 (0.0%) |
| Total (Overall) | 173 (46.6%) | 198 (53.4%) |
Production, Transportation and Moving Occupations
The most common Production, Transportation and Moving occupations in Indian Springs are Material Moving (42 | 11.3%), Production (14 | 3.8%), and Transportation (4 | 1.1%).
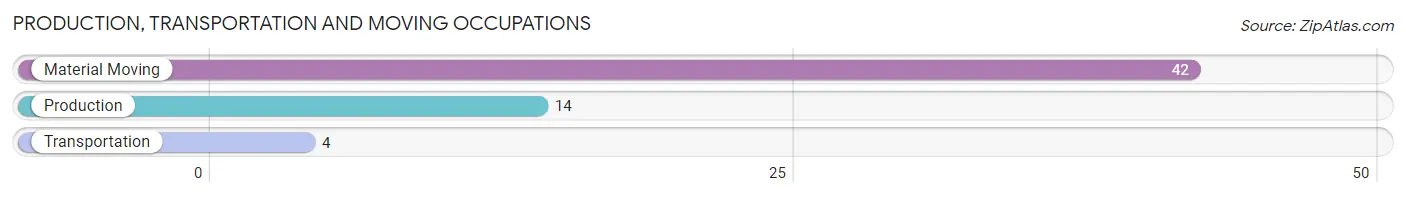
Production, Transportation and Moving Occupations by Sex
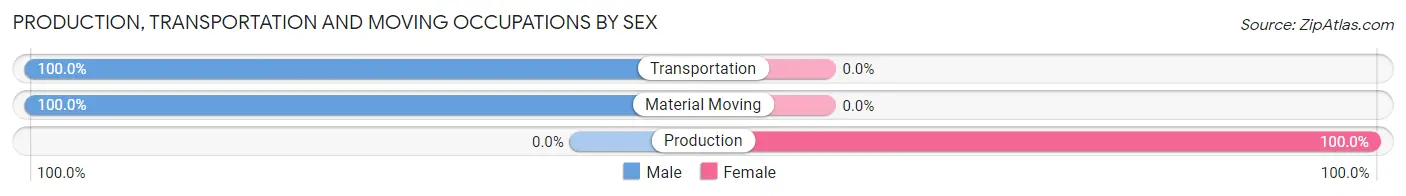
| Occupation | Male | Female |
| Production | 0 (0.0%) | 14 (100.0%) |
| Transportation | 4 (100.0%) | 0 (0.0%) |
| Material Moving | 42 (100.0%) | 0 (0.0%) |
| Total (Category) | 46 (76.7%) | 14 (23.3%) |
| Total (Overall) | 173 (46.6%) | 198 (53.4%) |
Employment Industries by Sex in Indian Springs
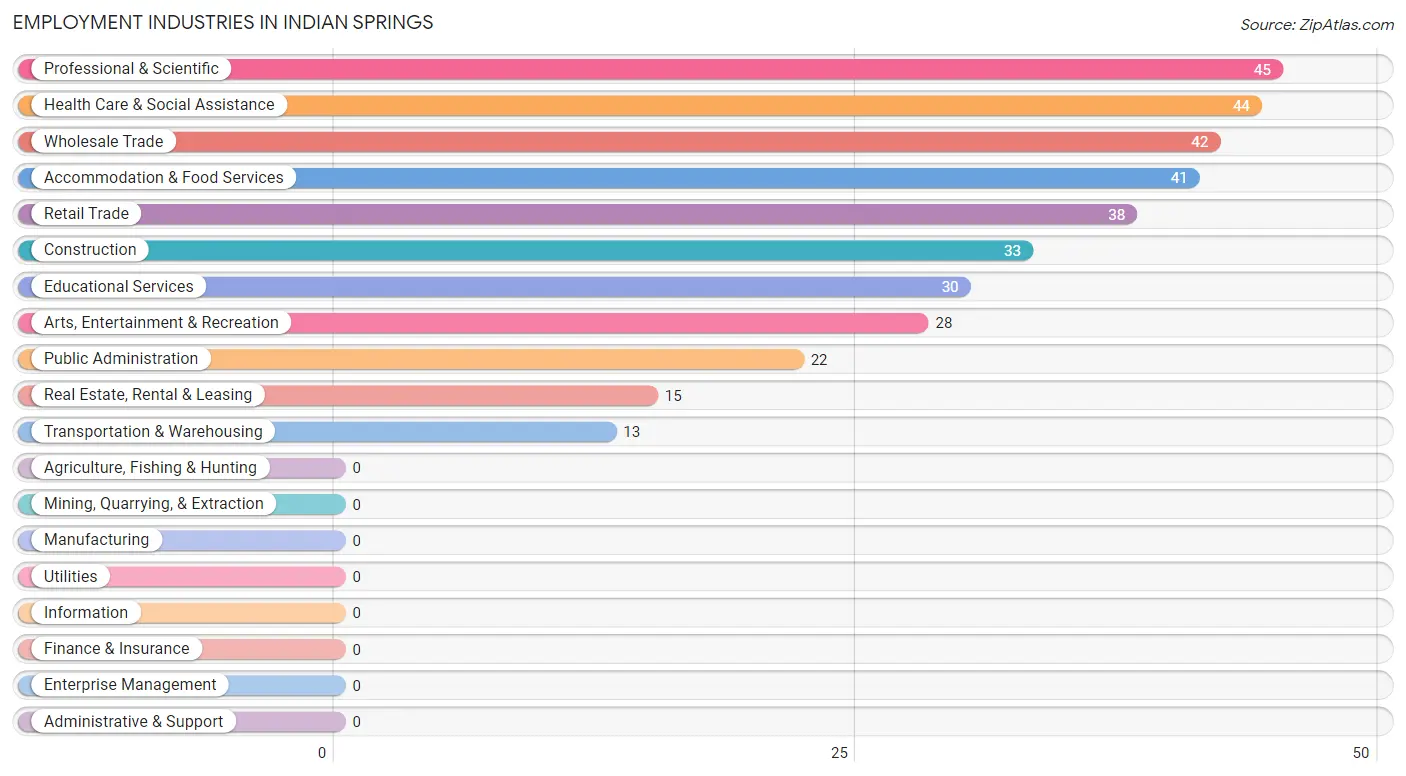
Employment Industries in Indian Springs
The major employment industries in Indian Springs include Professional & Scientific (45 | 12.1%), Health Care & Social Assistance (44 | 11.9%), Wholesale Trade (42 | 11.3%), Accommodation & Food Services (41 | 11.1%), and Retail Trade (38 | 10.2%).
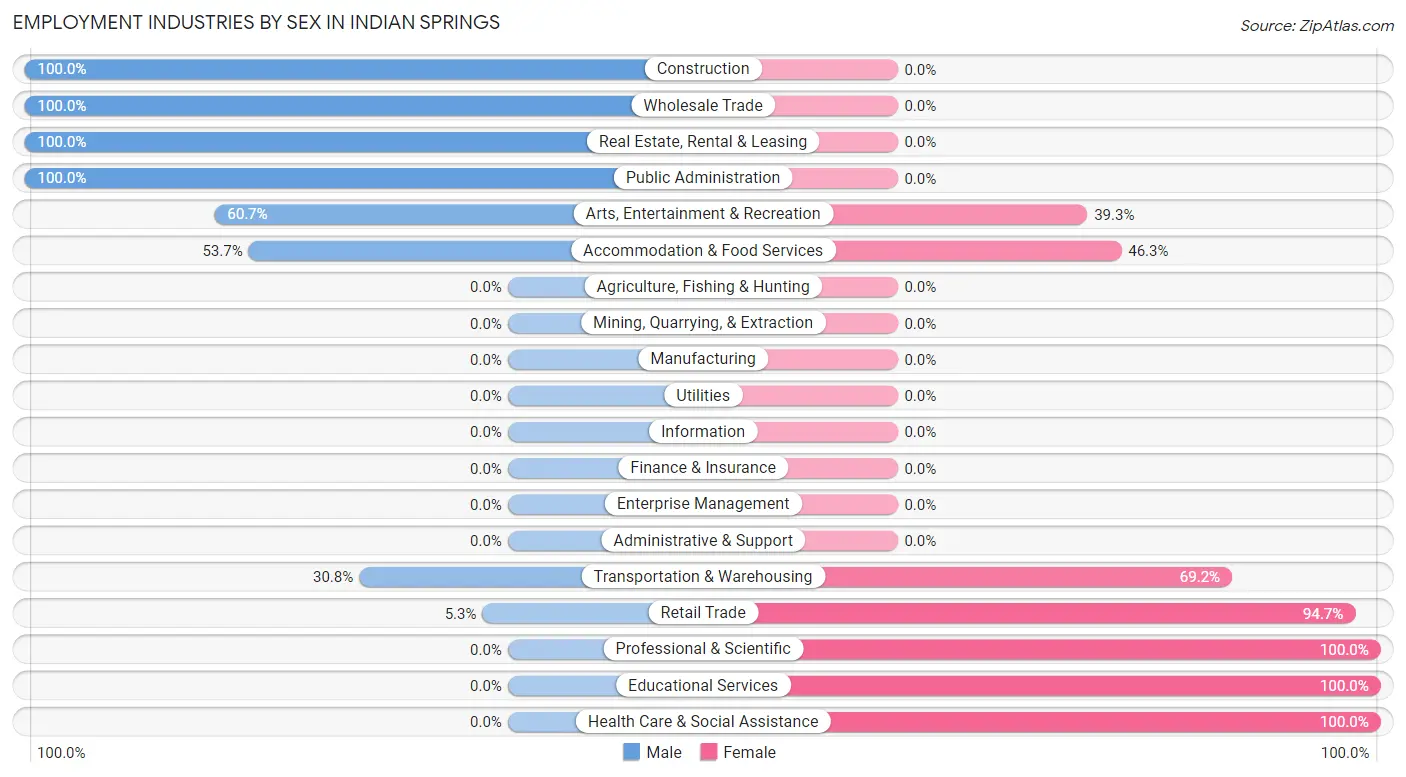
Employment Industries by Sex in Indian Springs
The Indian Springs industries that see more men than women are Construction (100.0%), Wholesale Trade (100.0%), and Real Estate, Rental & Leasing (100.0%), whereas the industries that tend to have a higher number of women are Professional & Scientific (100.0%), Educational Services (100.0%), and Health Care & Social Assistance (100.0%).
| Industry | Male | Female |
| Agriculture, Fishing & Hunting | 0 (0.0%) | 0 (0.0%) |
| Mining, Quarrying, & Extraction | 0 (0.0%) | 0 (0.0%) |
| Construction | 33 (100.0%) | 0 (0.0%) |
| Manufacturing | 0 (0.0%) | 0 (0.0%) |
| Wholesale Trade | 42 (100.0%) | 0 (0.0%) |
| Retail Trade | 2 (5.3%) | 36 (94.7%) |
| Transportation & Warehousing | 4 (30.8%) | 9 (69.2%) |
| Utilities | 0 (0.0%) | 0 (0.0%) |
| Information | 0 (0.0%) | 0 (0.0%) |
| Finance & Insurance | 0 (0.0%) | 0 (0.0%) |
| Real Estate, Rental & Leasing | 15 (100.0%) | 0 (0.0%) |
| Professional & Scientific | 0 (0.0%) | 45 (100.0%) |
| Enterprise Management | 0 (0.0%) | 0 (0.0%) |
| Administrative & Support | 0 (0.0%) | 0 (0.0%) |
| Educational Services | 0 (0.0%) | 30 (100.0%) |
| Health Care & Social Assistance | 0 (0.0%) | 44 (100.0%) |
| Arts, Entertainment & Recreation | 17 (60.7%) | 11 (39.3%) |
| Accommodation & Food Services | 22 (53.7%) | 19 (46.3%) |
| Public Administration | 22 (100.0%) | 0 (0.0%) |
| Total | 173 (46.6%) | 198 (53.4%) |
Education in Indian Springs
School Enrollment in Indian Springs
The most common levels of schooling among the 273 students in Indian Springs are high school (80 | 29.3%), middle school (67 | 24.5%), and college / undergraduate (58 | 21.2%).
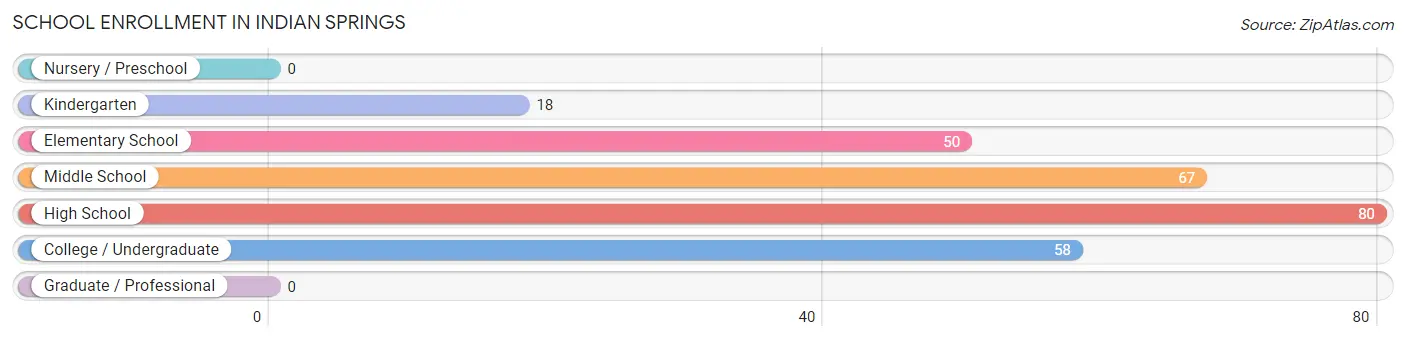
| School Level | # Students | % Students |
| Nursery / Preschool | 0 | 0.0% |
| Kindergarten | 18 | 6.6% |
| Elementary School | 50 | 18.3% |
| Middle School | 67 | 24.5% |
| High School | 80 | 29.3% |
| College / Undergraduate | 58 | 21.2% |
| Graduate / Professional | 0 | 0.0% |
| Total | 273 | 100.0% |
School Enrollment by Age by Funding Source in Indian Springs
Out of a total of 273 students who are enrolled in schools in Indian Springs, 4 (1.5%) attend a private institution, while the remaining 269 (98.5%) are enrolled in public schools. The age group of 5 to 9 year old has the highest likelihood of being enrolled in private schools, with 4 (7.4% in the age bracket) enrolled. Conversely, the age group of 3 to 4 year olds has the lowest likelihood of being enrolled in a private school, with 14 (100.0% in the age bracket) attending a public institution.
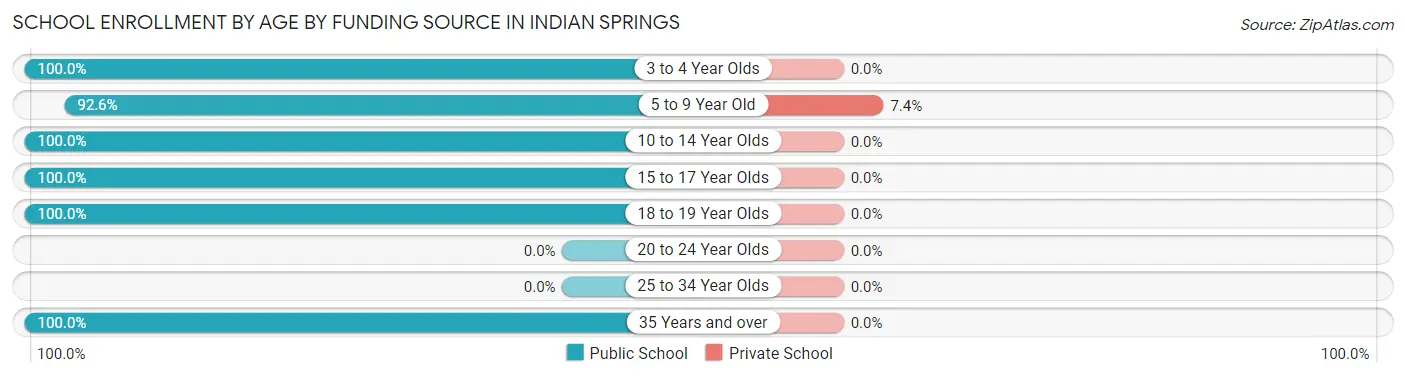
| Age Bracket | Public School | Private School |
| 3 to 4 Year Olds | 14 (100.0%) | 0 (0.0%) |
| 5 to 9 Year Old | 50 (92.6%) | 4 (7.4%) |
| 10 to 14 Year Olds | 67 (100.0%) | 0 (0.0%) |
| 15 to 17 Year Olds | 115 (100.0%) | 0 (0.0%) |
| 18 to 19 Year Olds | 15 (100.0%) | 0 (0.0%) |
| 20 to 24 Year Olds | 0 (0.0%) | 0 (0.0%) |
| 25 to 34 Year Olds | 0 (0.0%) | 0 (0.0%) |
| 35 Years and over | 8 (100.0%) | 0 (0.0%) |
| Total | 269 (98.5%) | 4 (1.5%) |
Educational Attainment by Field of Study in Indian Springs
, and science & technology (89 | 100.0%) are the most common fields of study among 89 individuals in Indian Springs who have obtained a bachelor's degree or higher.
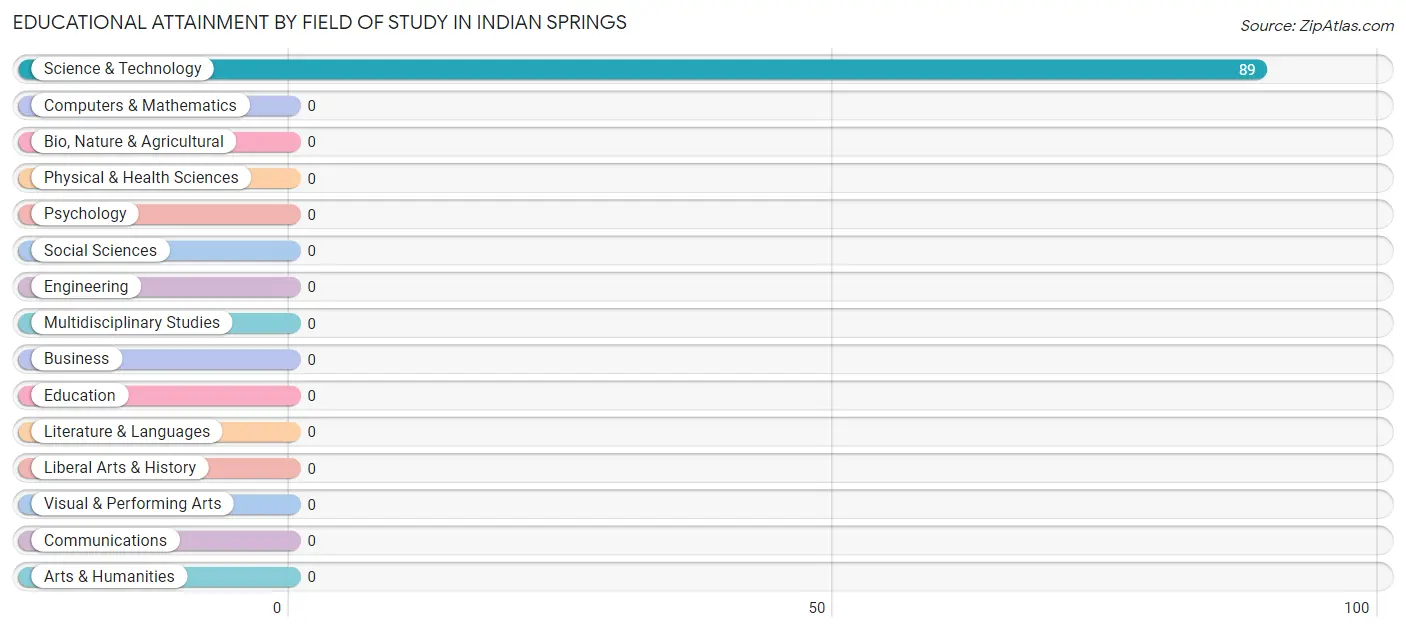
| Field of Study | # Graduates | % Graduates |
| Computers & Mathematics | 0 | 0.0% |
| Bio, Nature & Agricultural | 0 | 0.0% |
| Physical & Health Sciences | 0 | 0.0% |
| Psychology | 0 | 0.0% |
| Social Sciences | 0 | 0.0% |
| Engineering | 0 | 0.0% |
| Multidisciplinary Studies | 0 | 0.0% |
| Science & Technology | 89 | 100.0% |
| Business | 0 | 0.0% |
| Education | 0 | 0.0% |
| Literature & Languages | 0 | 0.0% |
| Liberal Arts & History | 0 | 0.0% |
| Visual & Performing Arts | 0 | 0.0% |
| Communications | 0 | 0.0% |
| Arts & Humanities | 0 | 0.0% |
| Total | 89 | 100.0% |
Transportation & Commute in Indian Springs
Vehicle Availability by Sex in Indian Springs
The most prevalent vehicle ownership categories in Indian Springs are males with 2 vehicles (83, accounting for 45.4%) and females with 2 vehicles (85, making up 41.9%).
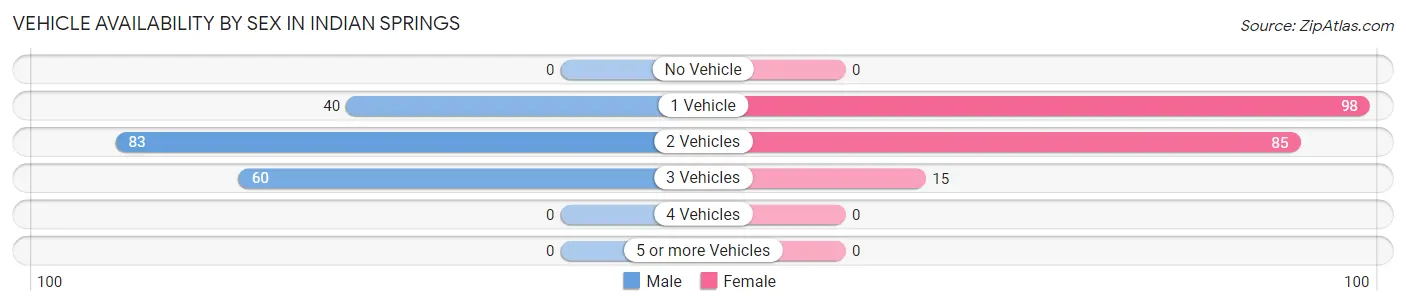
| Vehicles Available | Male | Female |
| No Vehicle | 0 (0.0%) | 0 (0.0%) |
| 1 Vehicle | 40 (21.9%) | 98 (49.5%) |
| 2 Vehicles | 83 (45.4%) | 85 (42.9%) |
| 3 Vehicles | 60 (32.8%) | 15 (7.6%) |
| 4 Vehicles | 0 (0.0%) | 0 (0.0%) |
| 5 or more Vehicles | 0 (0.0%) | 0 (0.0%) |
| Total | 183 (100.0%) | 198 (100.0%) |
Commute Time in Indian Springs
The most frequently occuring commute durations in Indian Springs are 60 to 89 minutes (143 commuters, 38.4%), 10 to 14 minutes (68 commuters, 18.3%), and 5 to 9 minutes (46 commuters, 12.4%).
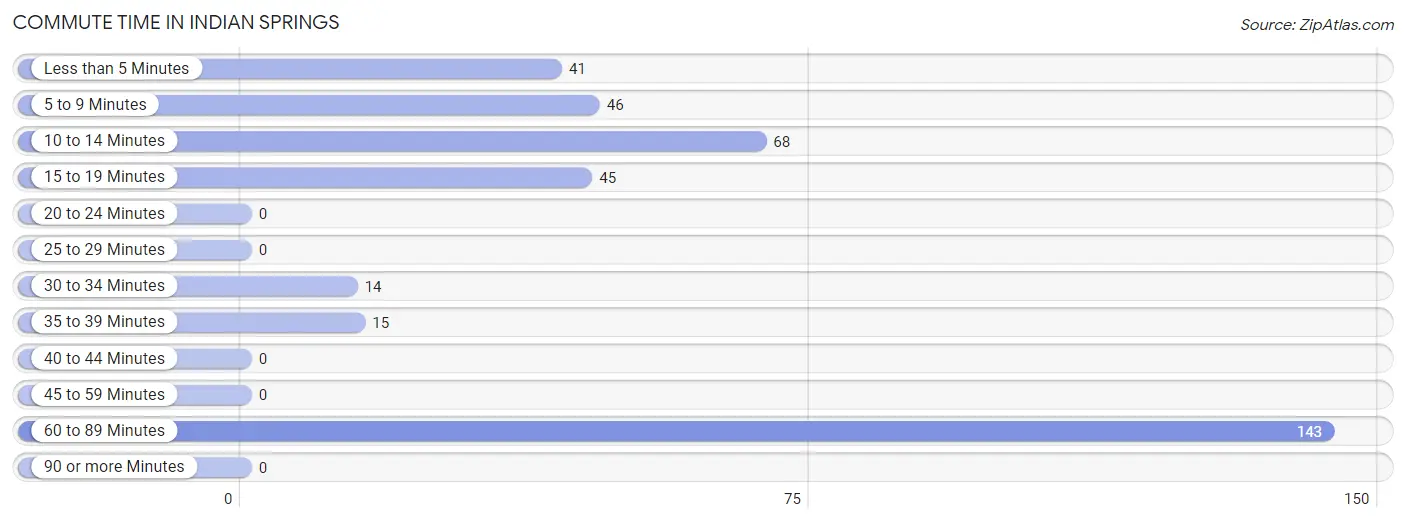
| Commute Time | # Commuters | % Commuters |
| Less than 5 Minutes | 41 | 11.0% |
| 5 to 9 Minutes | 46 | 12.4% |
| 10 to 14 Minutes | 68 | 18.3% |
| 15 to 19 Minutes | 45 | 12.1% |
| 20 to 24 Minutes | 0 | 0.0% |
| 25 to 29 Minutes | 0 | 0.0% |
| 30 to 34 Minutes | 14 | 3.8% |
| 35 to 39 Minutes | 15 | 4.0% |
| 40 to 44 Minutes | 0 | 0.0% |
| 45 to 59 Minutes | 0 | 0.0% |
| 60 to 89 Minutes | 143 | 38.4% |
| 90 or more Minutes | 0 | 0.0% |
Commute Time by Sex in Indian Springs
The most common commute times in Indian Springs are 60 to 89 minutes (73 commuters, 39.9%) for males and 60 to 89 minutes (70 commuters, 37.0%) for females.
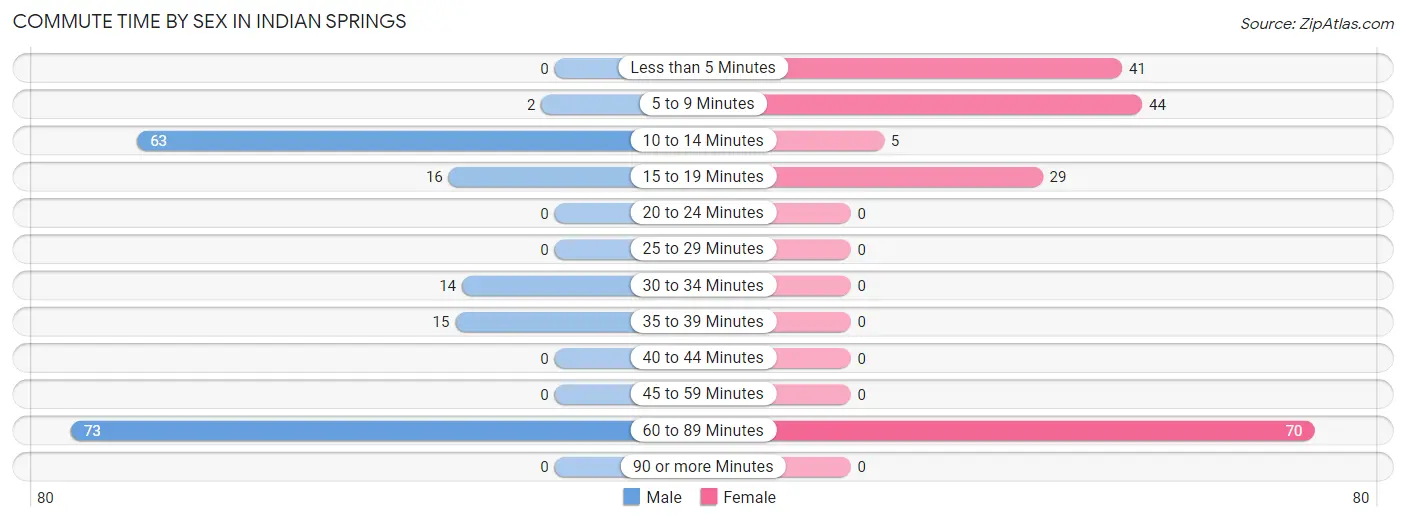
| Commute Time | Male | Female |
| Less than 5 Minutes | 0 (0.0%) | 41 (21.7%) |
| 5 to 9 Minutes | 2 (1.1%) | 44 (23.3%) |
| 10 to 14 Minutes | 63 (34.4%) | 5 (2.6%) |
| 15 to 19 Minutes | 16 (8.7%) | 29 (15.3%) |
| 20 to 24 Minutes | 0 (0.0%) | 0 (0.0%) |
| 25 to 29 Minutes | 0 (0.0%) | 0 (0.0%) |
| 30 to 34 Minutes | 14 (7.6%) | 0 (0.0%) |
| 35 to 39 Minutes | 15 (8.2%) | 0 (0.0%) |
| 40 to 44 Minutes | 0 (0.0%) | 0 (0.0%) |
| 45 to 59 Minutes | 0 (0.0%) | 0 (0.0%) |
| 60 to 89 Minutes | 73 (39.9%) | 70 (37.0%) |
| 90 or more Minutes | 0 (0.0%) | 0 (0.0%) |
Time of Departure to Work by Sex in Indian Springs
The most frequent times of departure to work in Indian Springs are 12:00 PM to 3:59 PM (69, 37.7%) for males and 6:30 AM to 6:59 AM (59, 31.2%) for females.
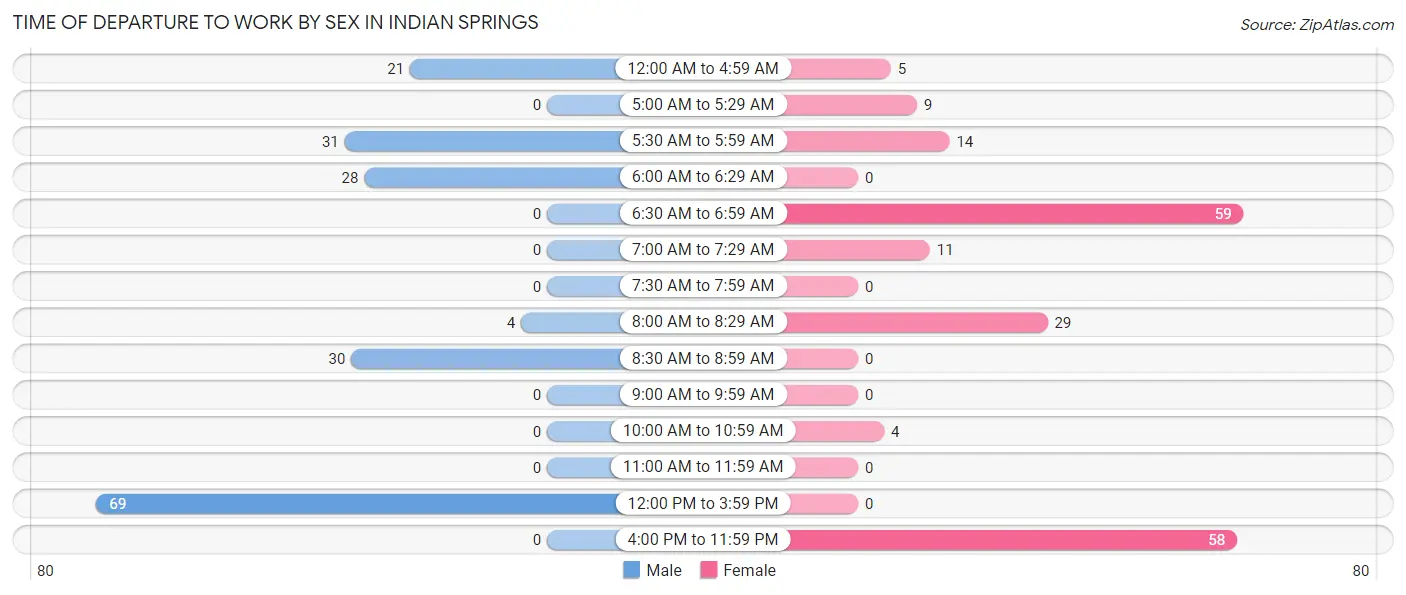
| Time of Departure | Male | Female |
| 12:00 AM to 4:59 AM | 21 (11.5%) | 5 (2.6%) |
| 5:00 AM to 5:29 AM | 0 (0.0%) | 9 (4.8%) |
| 5:30 AM to 5:59 AM | 31 (16.9%) | 14 (7.4%) |
| 6:00 AM to 6:29 AM | 28 (15.3%) | 0 (0.0%) |
| 6:30 AM to 6:59 AM | 0 (0.0%) | 59 (31.2%) |
| 7:00 AM to 7:29 AM | 0 (0.0%) | 11 (5.8%) |
| 7:30 AM to 7:59 AM | 0 (0.0%) | 0 (0.0%) |
| 8:00 AM to 8:29 AM | 4 (2.2%) | 29 (15.3%) |
| 8:30 AM to 8:59 AM | 30 (16.4%) | 0 (0.0%) |
| 9:00 AM to 9:59 AM | 0 (0.0%) | 0 (0.0%) |
| 10:00 AM to 10:59 AM | 0 (0.0%) | 4 (2.1%) |
| 11:00 AM to 11:59 AM | 0 (0.0%) | 0 (0.0%) |
| 12:00 PM to 3:59 PM | 69 (37.7%) | 0 (0.0%) |
| 4:00 PM to 11:59 PM | 0 (0.0%) | 58 (30.7%) |
| Total | 183 (100.0%) | 189 (100.0%) |
Housing Occupancy in Indian Springs
Occupancy by Ownership in Indian Springs
Of the total 283 dwellings in Indian Springs, owner-occupied units account for 186 (65.7%), while renter-occupied units make up 97 (34.3%).
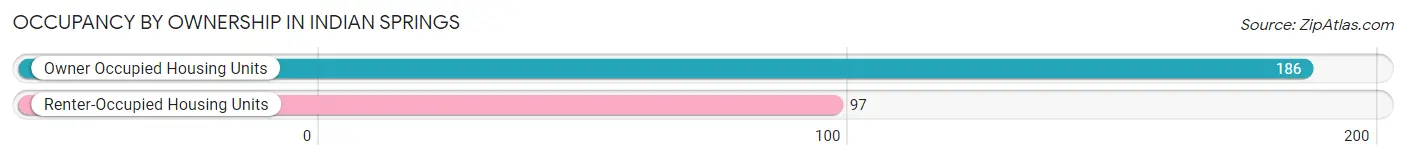
| Occupancy | # Housing Units | % Housing Units |
| Owner Occupied Housing Units | 186 | 65.7% |
| Renter-Occupied Housing Units | 97 | 34.3% |
| Total Occupied Housing Units | 283 | 100.0% |
Occupancy by Household Size in Indian Springs
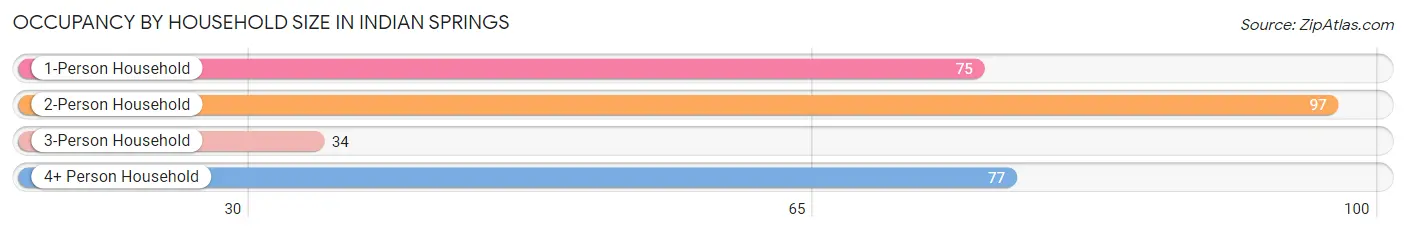
| Household Size | # Housing Units | % Housing Units |
| 1-Person Household | 75 | 26.5% |
| 2-Person Household | 97 | 34.3% |
| 3-Person Household | 34 | 12.0% |
| 4+ Person Household | 77 | 27.2% |
| Total Housing Units | 283 | 100.0% |
Occupancy by Ownership by Household Size in Indian Springs
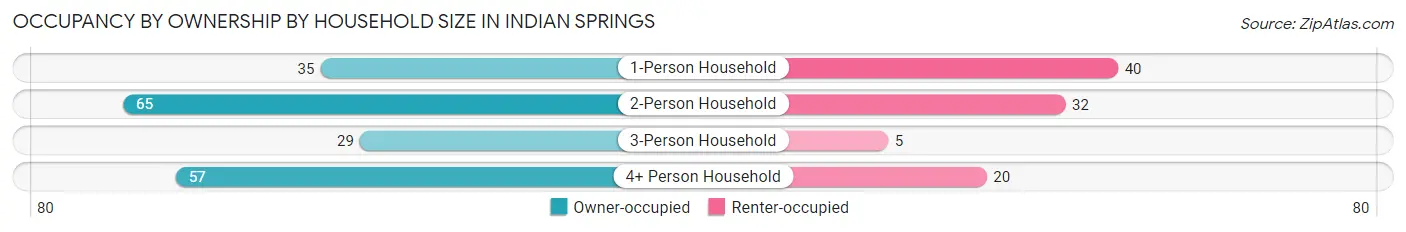
| Household Size | Owner-occupied | Renter-occupied |
| 1-Person Household | 35 (46.7%) | 40 (53.3%) |
| 2-Person Household | 65 (67.0%) | 32 (33.0%) |
| 3-Person Household | 29 (85.3%) | 5 (14.7%) |
| 4+ Person Household | 57 (74.0%) | 20 (26.0%) |
| Total Housing Units | 186 (65.7%) | 97 (34.3%) |
Occupancy by Educational Attainment in Indian Springs
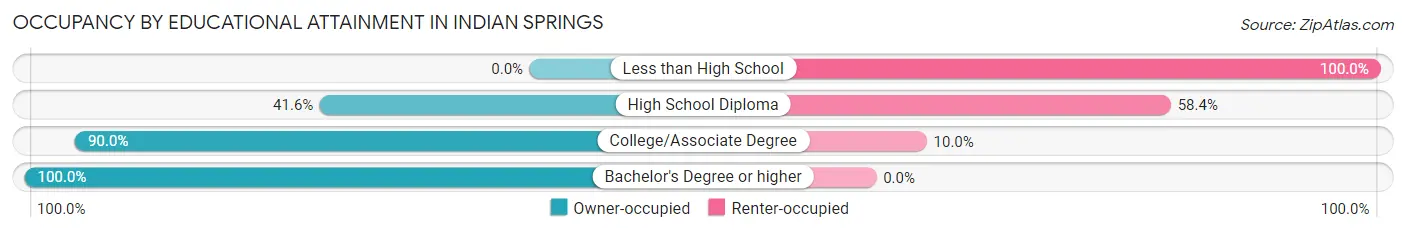
| Household Size | Owner-occupied | Renter-occupied |
| Less than High School | 0 (0.0%) | 14 (100.0%) |
| High School Diploma | 52 (41.6%) | 73 (58.4%) |
| College/Associate Degree | 90 (90.0%) | 10 (10.0%) |
| Bachelor's Degree or higher | 44 (100.0%) | 0 (0.0%) |
Occupancy by Age of Householder in Indian Springs
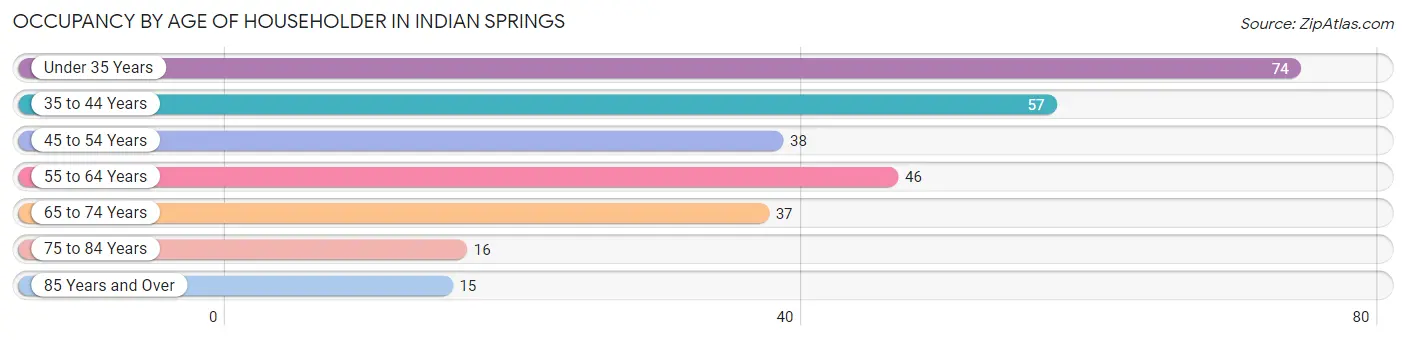
| Age Bracket | # Households | % Households |
| Under 35 Years | 74 | 26.2% |
| 35 to 44 Years | 57 | 20.1% |
| 45 to 54 Years | 38 | 13.4% |
| 55 to 64 Years | 46 | 16.3% |
| 65 to 74 Years | 37 | 13.1% |
| 75 to 84 Years | 16 | 5.7% |
| 85 Years and Over | 15 | 5.3% |
| Total | 283 | 100.0% |
Housing Finances in Indian Springs
Median Income by Occupancy in Indian Springs
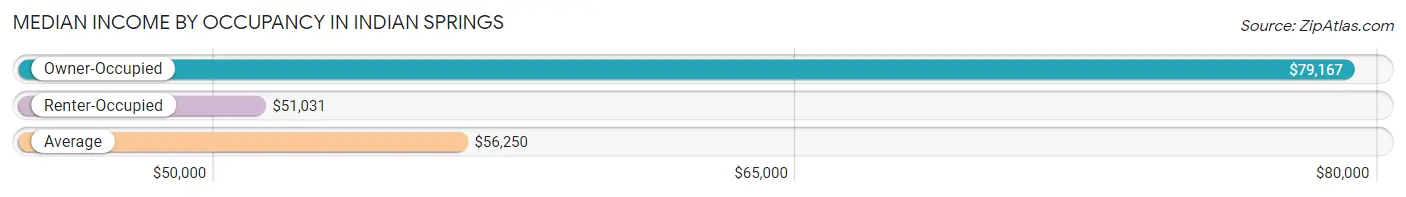
| Occupancy Type | # Households | Median Income |
| Owner-Occupied | 186 (65.7%) | $79,167 |
| Renter-Occupied | 97 (34.3%) | $51,031 |
| Average | 283 (100.0%) | $56,250 |
Occupancy by Householder Income Bracket in Indian Springs
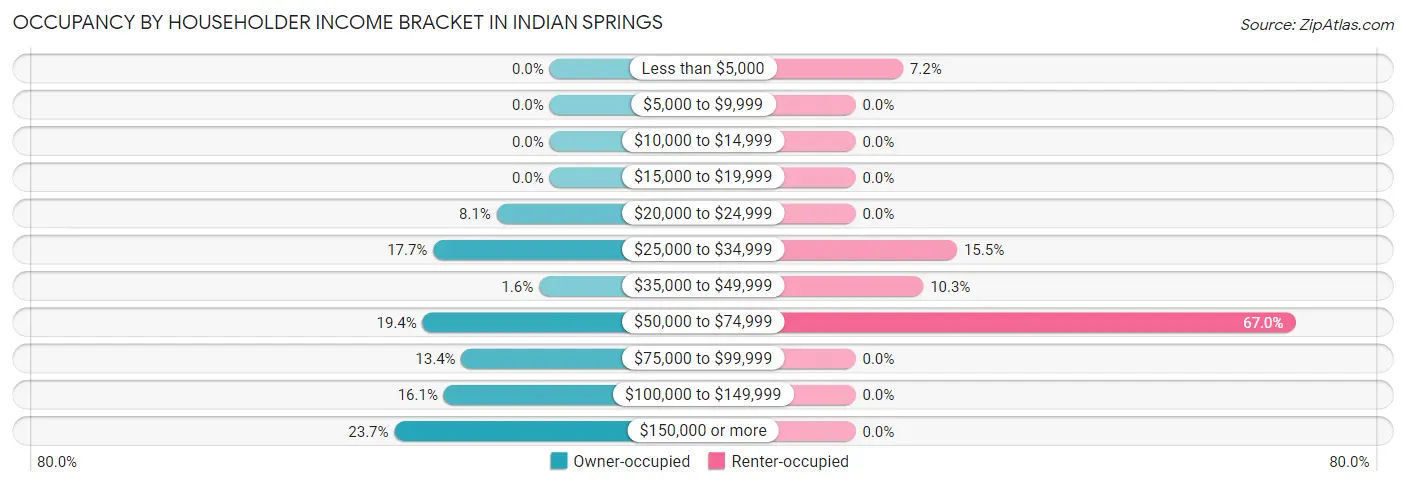
| Income Bracket | Owner-occupied | Renter-occupied |
| Less than $5,000 | 0 (0.0%) | 7 (7.2%) |
| $5,000 to $9,999 | 0 (0.0%) | 0 (0.0%) |
| $10,000 to $14,999 | 0 (0.0%) | 0 (0.0%) |
| $15,000 to $19,999 | 0 (0.0%) | 0 (0.0%) |
| $20,000 to $24,999 | 15 (8.1%) | 0 (0.0%) |
| $25,000 to $34,999 | 33 (17.7%) | 15 (15.5%) |
| $35,000 to $49,999 | 3 (1.6%) | 10 (10.3%) |
| $50,000 to $74,999 | 36 (19.4%) | 65 (67.0%) |
| $75,000 to $99,999 | 25 (13.4%) | 0 (0.0%) |
| $100,000 to $149,999 | 30 (16.1%) | 0 (0.0%) |
| $150,000 or more | 44 (23.7%) | 0 (0.0%) |
| Total | 186 (100.0%) | 97 (100.0%) |
Monthly Housing Cost Tiers in Indian Springs
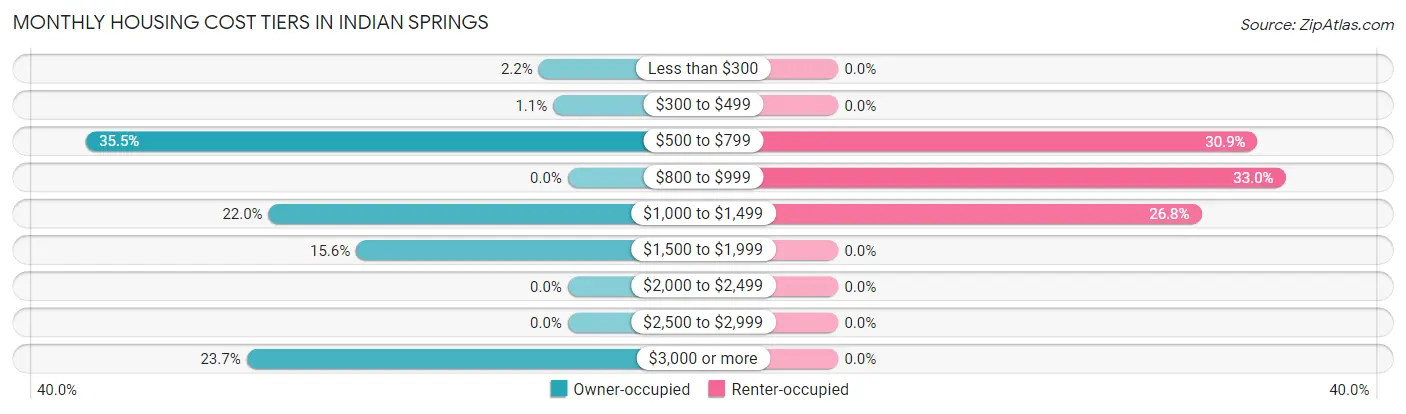
| Monthly Cost | Owner-occupied | Renter-occupied |
| Less than $300 | 4 (2.1%) | 0 (0.0%) |
| $300 to $499 | 2 (1.1%) | 0 (0.0%) |
| $500 to $799 | 66 (35.5%) | 30 (30.9%) |
| $800 to $999 | 0 (0.0%) | 32 (33.0%) |
| $1,000 to $1,499 | 41 (22.0%) | 26 (26.8%) |
| $1,500 to $1,999 | 29 (15.6%) | 0 (0.0%) |
| $2,000 to $2,499 | 0 (0.0%) | 0 (0.0%) |
| $2,500 to $2,999 | 0 (0.0%) | 0 (0.0%) |
| $3,000 or more | 44 (23.7%) | 0 (0.0%) |
| Total | 186 (100.0%) | 97 (100.0%) |
Physical Housing Characteristics in Indian Springs
Housing Structures in Indian Springs
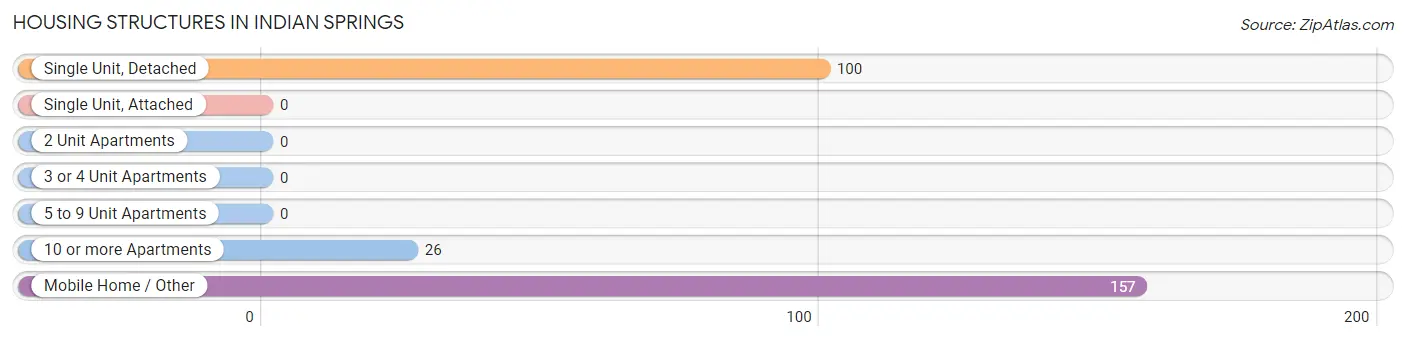
| Structure Type | # Housing Units | % Housing Units |
| Single Unit, Detached | 100 | 35.3% |
| Single Unit, Attached | 0 | 0.0% |
| 2 Unit Apartments | 0 | 0.0% |
| 3 or 4 Unit Apartments | 0 | 0.0% |
| 5 to 9 Unit Apartments | 0 | 0.0% |
| 10 or more Apartments | 26 | 9.2% |
| Mobile Home / Other | 157 | 55.5% |
| Total | 283 | 100.0% |
Housing Structures by Occupancy in Indian Springs
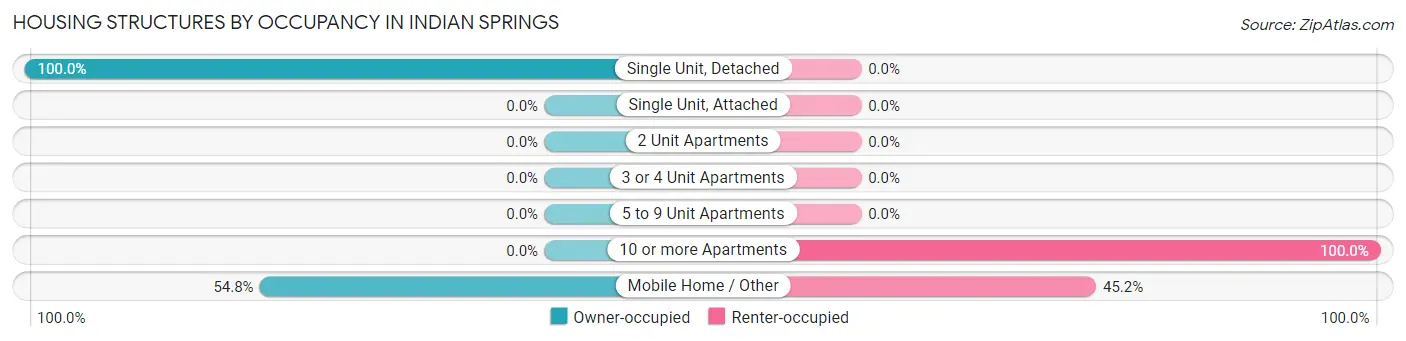
| Structure Type | Owner-occupied | Renter-occupied |
| Single Unit, Detached | 100 (100.0%) | 0 (0.0%) |
| Single Unit, Attached | 0 (0.0%) | 0 (0.0%) |
| 2 Unit Apartments | 0 (0.0%) | 0 (0.0%) |
| 3 or 4 Unit Apartments | 0 (0.0%) | 0 (0.0%) |
| 5 to 9 Unit Apartments | 0 (0.0%) | 0 (0.0%) |
| 10 or more Apartments | 0 (0.0%) | 26 (100.0%) |
| Mobile Home / Other | 86 (54.8%) | 71 (45.2%) |
| Total | 186 (65.7%) | 97 (34.3%) |
Housing Structures by Number of Rooms in Indian Springs
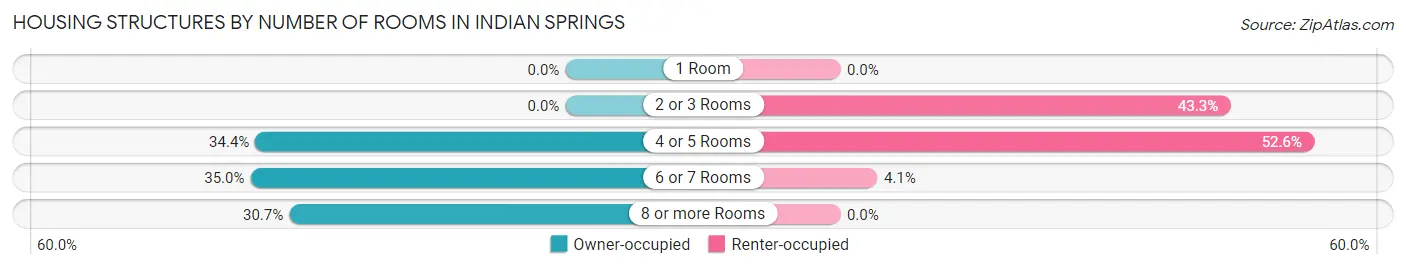
| Number of Rooms | Owner-occupied | Renter-occupied |
| 1 Room | 0 (0.0%) | 0 (0.0%) |
| 2 or 3 Rooms | 0 (0.0%) | 42 (43.3%) |
| 4 or 5 Rooms | 64 (34.4%) | 51 (52.6%) |
| 6 or 7 Rooms | 65 (34.9%) | 4 (4.1%) |
| 8 or more Rooms | 57 (30.6%) | 0 (0.0%) |
| Total | 186 (100.0%) | 97 (100.0%) |
Housing Structure by Heating Type in Indian Springs
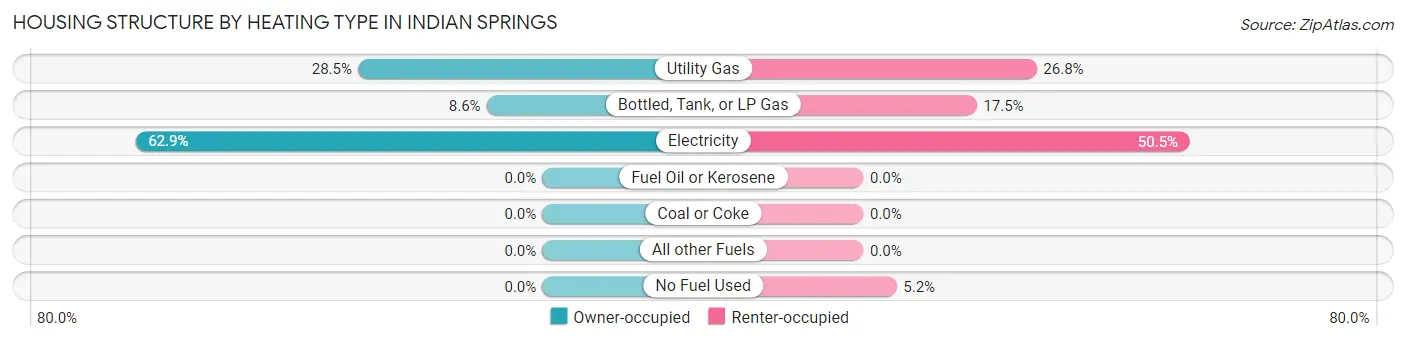
| Heating Type | Owner-occupied | Renter-occupied |
| Utility Gas | 53 (28.5%) | 26 (26.8%) |
| Bottled, Tank, or LP Gas | 16 (8.6%) | 17 (17.5%) |
| Electricity | 117 (62.9%) | 49 (50.5%) |
| Fuel Oil or Kerosene | 0 (0.0%) | 0 (0.0%) |
| Coal or Coke | 0 (0.0%) | 0 (0.0%) |
| All other Fuels | 0 (0.0%) | 0 (0.0%) |
| No Fuel Used | 0 (0.0%) | 5 (5.1%) |
| Total | 186 (100.0%) | 97 (100.0%) |
Household Vehicle Usage in Indian Springs
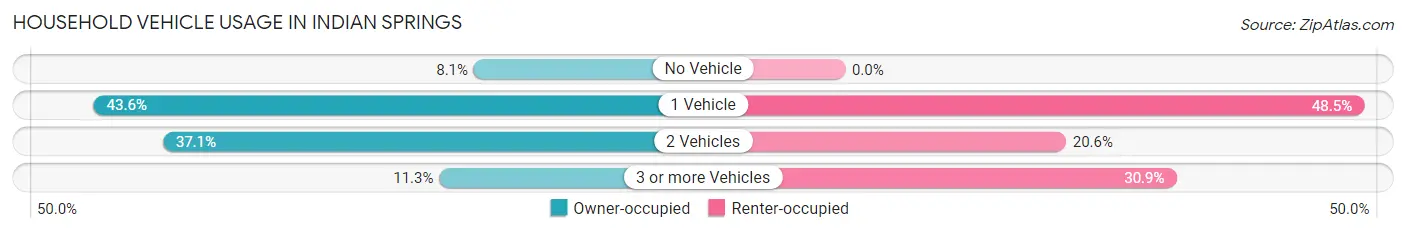
| Vehicles per Household | Owner-occupied | Renter-occupied |
| No Vehicle | 15 (8.1%) | 0 (0.0%) |
| 1 Vehicle | 81 (43.5%) | 47 (48.4%) |
| 2 Vehicles | 69 (37.1%) | 20 (20.6%) |
| 3 or more Vehicles | 21 (11.3%) | 30 (30.9%) |
| Total | 186 (100.0%) | 97 (100.0%) |
Real Estate & Mortgages in Indian Springs
Real Estate and Mortgage Overview in Indian Springs
| Characteristic | Without Mortgage | With Mortgage |
| Housing Units | 70 | 116 |
| Median Property Value | - | - |
| Median Household Income | $50,536 | $44 |
| Monthly Housing Costs | $570 | $44 |
| Real Estate Taxes | - | - |
Property Value by Mortgage Status in Indian Springs
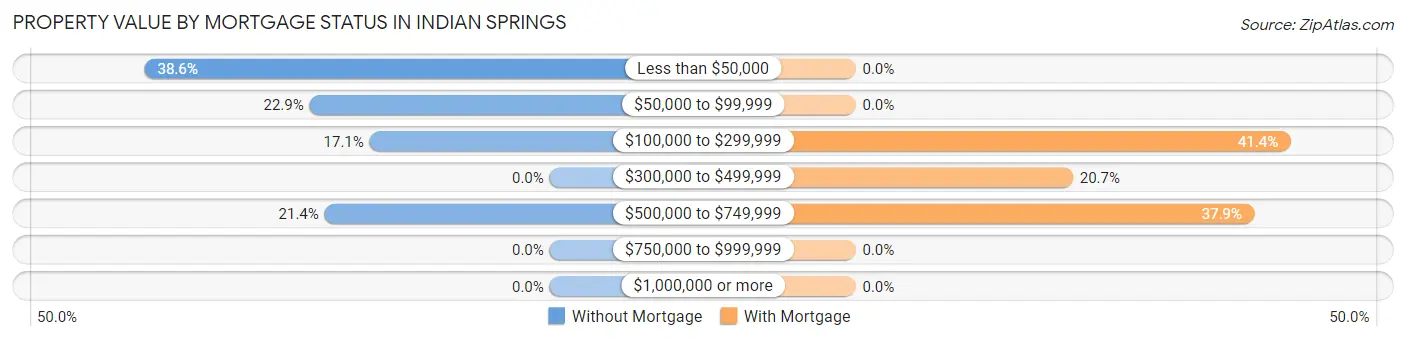
| Property Value | Without Mortgage | With Mortgage |
| Less than $50,000 | 27 (38.6%) | 0 (0.0%) |
| $50,000 to $99,999 | 16 (22.9%) | 0 (0.0%) |
| $100,000 to $299,999 | 12 (17.1%) | 48 (41.4%) |
| $300,000 to $499,999 | 0 (0.0%) | 24 (20.7%) |
| $500,000 to $749,999 | 15 (21.4%) | 44 (37.9%) |
| $750,000 to $999,999 | 0 (0.0%) | 0 (0.0%) |
| $1,000,000 or more | 0 (0.0%) | 0 (0.0%) |
| Total | 70 (100.0%) | 116 (100.0%) |
Household Income by Mortgage Status in Indian Springs
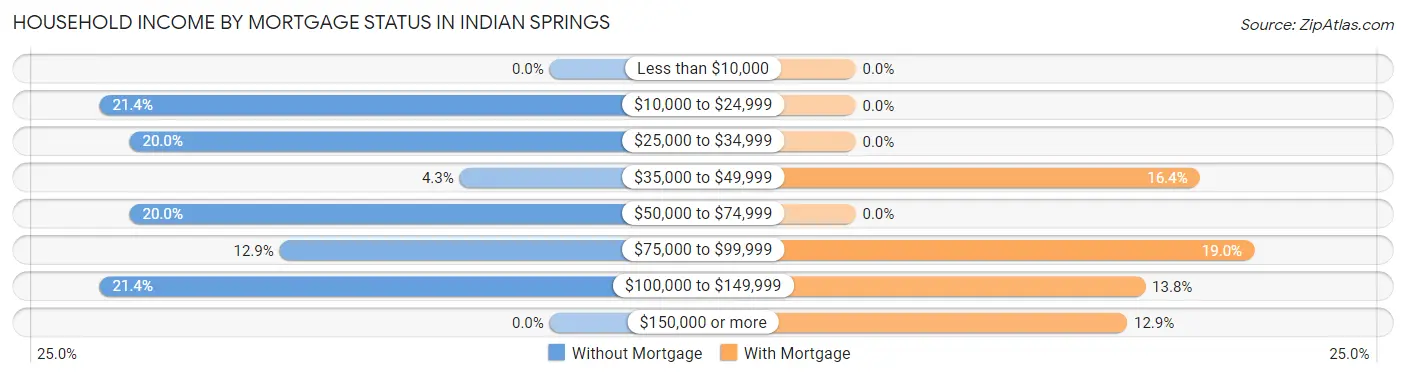
| Household Income | Without Mortgage | With Mortgage |
| Less than $10,000 | 0 (0.0%) | 0 (0.0%) |
| $10,000 to $24,999 | 15 (21.4%) | 0 (0.0%) |
| $25,000 to $34,999 | 14 (20.0%) | 0 (0.0%) |
| $35,000 to $49,999 | 3 (4.3%) | 19 (16.4%) |
| $50,000 to $74,999 | 14 (20.0%) | 0 (0.0%) |
| $75,000 to $99,999 | 9 (12.9%) | 22 (19.0%) |
| $100,000 to $149,999 | 15 (21.4%) | 16 (13.8%) |
| $150,000 or more | 0 (0.0%) | 15 (12.9%) |
| Total | 70 (100.0%) | 116 (100.0%) |
Property Value to Household Income Ratio in Indian Springs
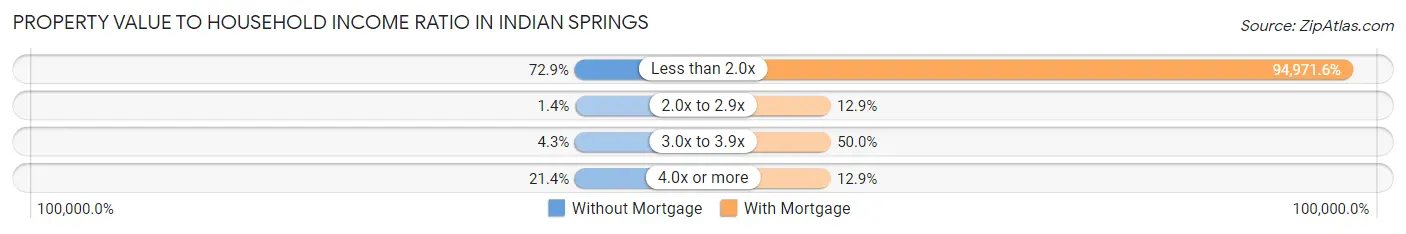
| Value-to-Income Ratio | Without Mortgage | With Mortgage |
| Less than 2.0x | 51 (72.9%) | 110,167 (94,971.6%) |
| 2.0x to 2.9x | 1 (1.4%) | 15 (12.9%) |
| 3.0x to 3.9x | 3 (4.3%) | 58 (50.0%) |
| 4.0x or more | 15 (21.4%) | 15 (12.9%) |
| Total | 70 (100.0%) | 116 (100.0%) |
Real Estate Taxes by Mortgage Status in Indian Springs
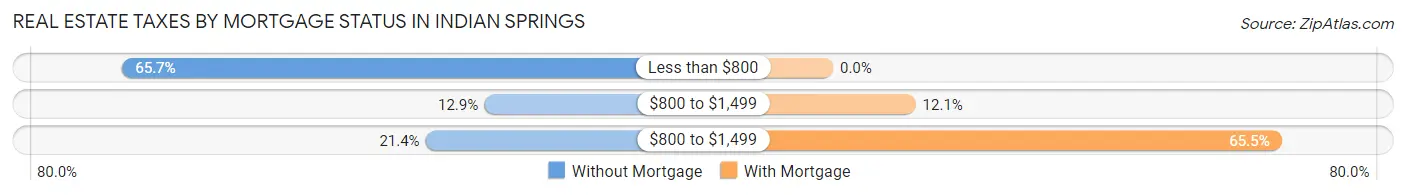
| Property Taxes | Without Mortgage | With Mortgage |
| Less than $800 | 46 (65.7%) | 0 (0.0%) |
| $800 to $1,499 | 9 (12.9%) | 14 (12.1%) |
| $800 to $1,499 | 15 (21.4%) | 76 (65.5%) |
| Total | 70 (100.0%) | 116 (100.0%) |
Health & Disability in Indian Springs
Health Insurance Coverage by Age in Indian Springs
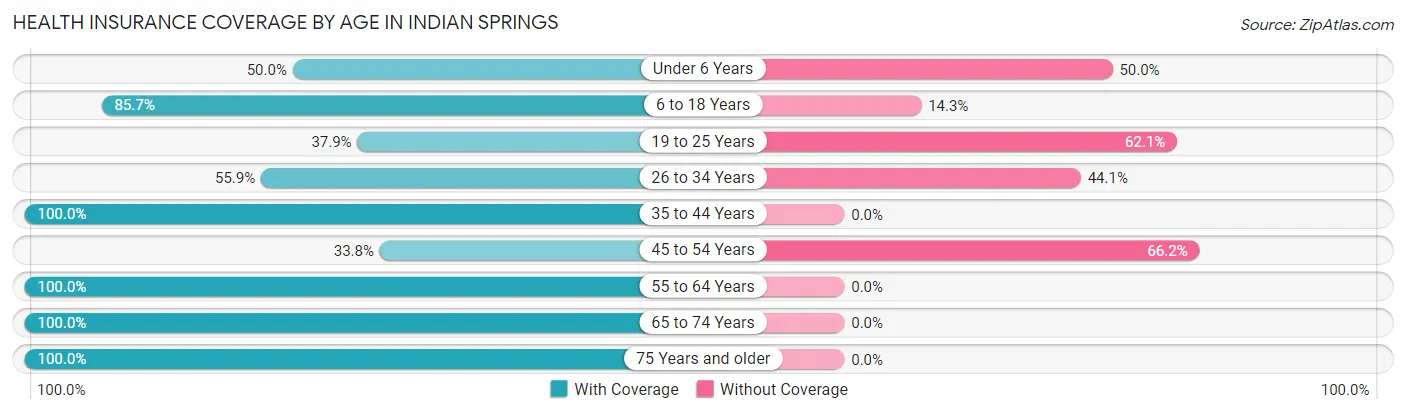
| Age Bracket | With Coverage | Without Coverage |
| Under 6 Years | 18 (50.0%) | 18 (50.0%) |
| 6 to 18 Years | 215 (85.7%) | 36 (14.3%) |
| 19 to 25 Years | 11 (37.9%) | 18 (62.1%) |
| 26 to 34 Years | 52 (55.9%) | 41 (44.1%) |
| 35 to 44 Years | 141 (100.0%) | 0 (0.0%) |
| 45 to 54 Years | 26 (33.8%) | 51 (66.2%) |
| 55 to 64 Years | 94 (100.0%) | 0 (0.0%) |
| 65 to 74 Years | 72 (100.0%) | 0 (0.0%) |
| 75 Years and older | 34 (100.0%) | 0 (0.0%) |
| Total | 663 (80.2%) | 164 (19.8%) |
Health Insurance Coverage by Citizenship Status in Indian Springs
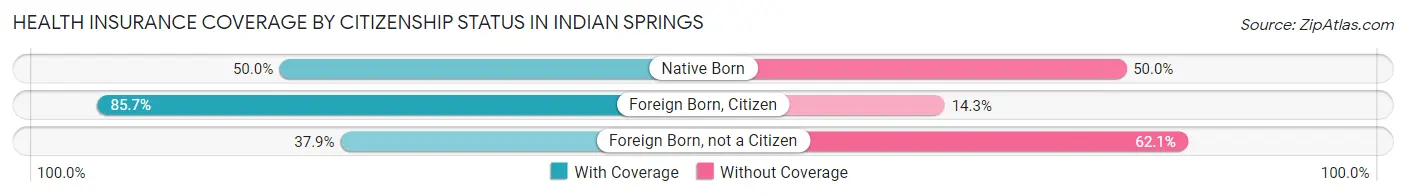
| Citizenship Status | With Coverage | Without Coverage |
| Native Born | 18 (50.0%) | 18 (50.0%) |
| Foreign Born, Citizen | 215 (85.7%) | 36 (14.3%) |
| Foreign Born, not a Citizen | 11 (37.9%) | 18 (62.1%) |
Health Insurance Coverage by Household Income in Indian Springs
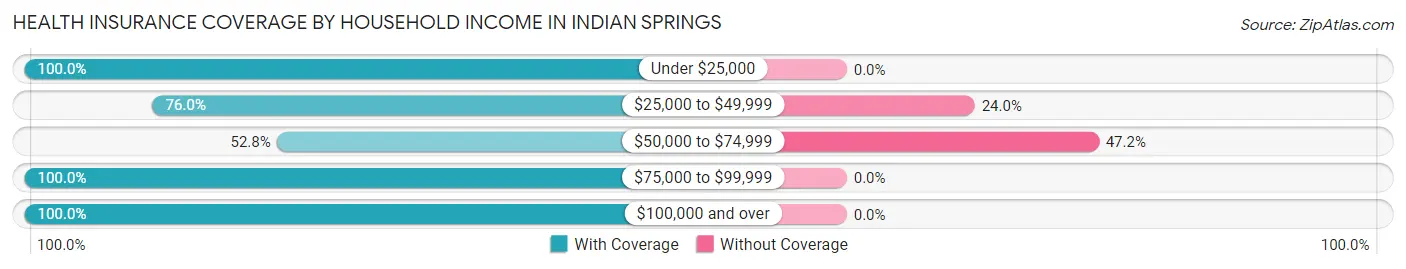
| Household Income | With Coverage | Without Coverage |
| Under $25,000 | 34 (100.0%) | 0 (0.0%) |
| $25,000 to $49,999 | 92 (76.0%) | 29 (24.0%) |
| $50,000 to $74,999 | 151 (52.8%) | 135 (47.2%) |
| $75,000 to $99,999 | 77 (100.0%) | 0 (0.0%) |
| $100,000 and over | 308 (100.0%) | 0 (0.0%) |
Public vs Private Health Insurance Coverage by Age in Indian Springs
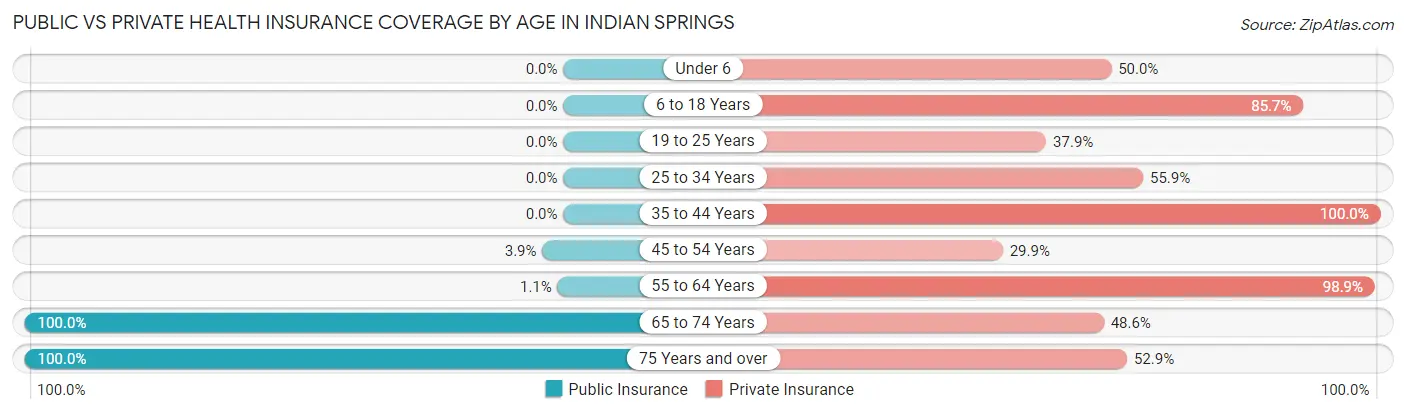
| Age Bracket | Public Insurance | Private Insurance |
| Under 6 | 0 (0.0%) | 18 (50.0%) |
| 6 to 18 Years | 0 (0.0%) | 215 (85.7%) |
| 19 to 25 Years | 0 (0.0%) | 11 (37.9%) |
| 25 to 34 Years | 0 (0.0%) | 52 (55.9%) |
| 35 to 44 Years | 0 (0.0%) | 141 (100.0%) |
| 45 to 54 Years | 3 (3.9%) | 23 (29.9%) |
| 55 to 64 Years | 1 (1.1%) | 93 (98.9%) |
| 65 to 74 Years | 72 (100.0%) | 35 (48.6%) |
| 75 Years and over | 34 (100.0%) | 18 (52.9%) |
| Total | 110 (13.3%) | 606 (73.3%) |
Disability Status by Sex by Age in Indian Springs
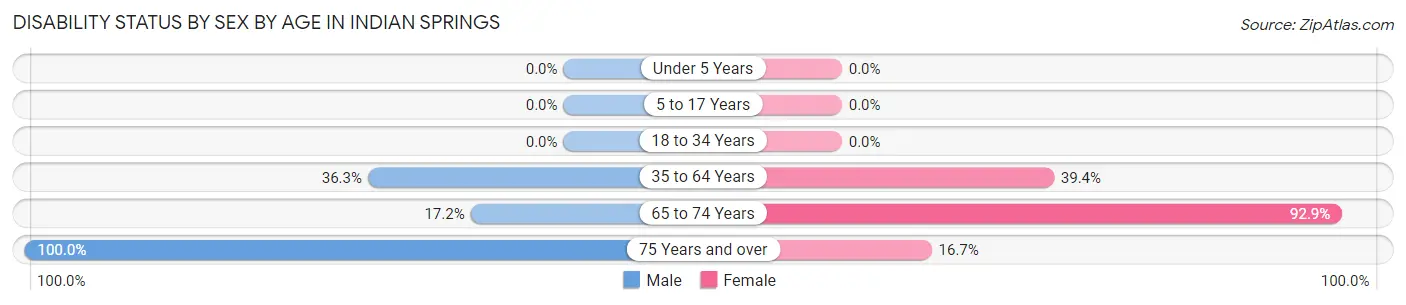
| Age Bracket | Male | Female |
| Under 5 Years | 0 (0.0%) | 0 (0.0%) |
| 5 to 17 Years | 0 (0.0%) | 0 (0.0%) |
| 18 to 34 Years | 0 (0.0%) | 0 (0.0%) |
| 35 to 64 Years | 45 (36.3%) | 74 (39.4%) |
| 65 to 74 Years | 10 (17.2%) | 13 (92.9%) |
| 75 Years and over | 16 (100.0%) | 3 (16.7%) |
Disability Class by Sex by Age in Indian Springs
Disability Class: Hearing Difficulty
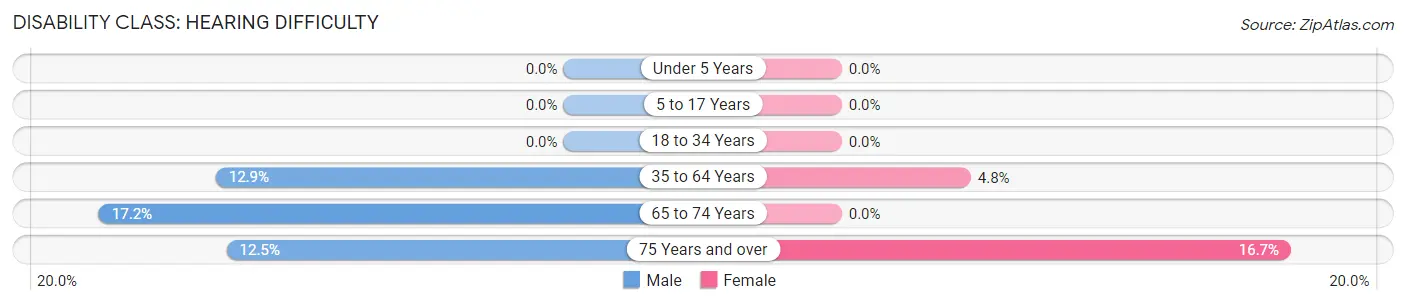
| Age Bracket | Male | Female |
| Under 5 Years | 0 (0.0%) | 0 (0.0%) |
| 5 to 17 Years | 0 (0.0%) | 0 (0.0%) |
| 18 to 34 Years | 0 (0.0%) | 0 (0.0%) |
| 35 to 64 Years | 16 (12.9%) | 9 (4.8%) |
| 65 to 74 Years | 10 (17.2%) | 0 (0.0%) |
| 75 Years and over | 2 (12.5%) | 3 (16.7%) |
Disability Class: Vision Difficulty
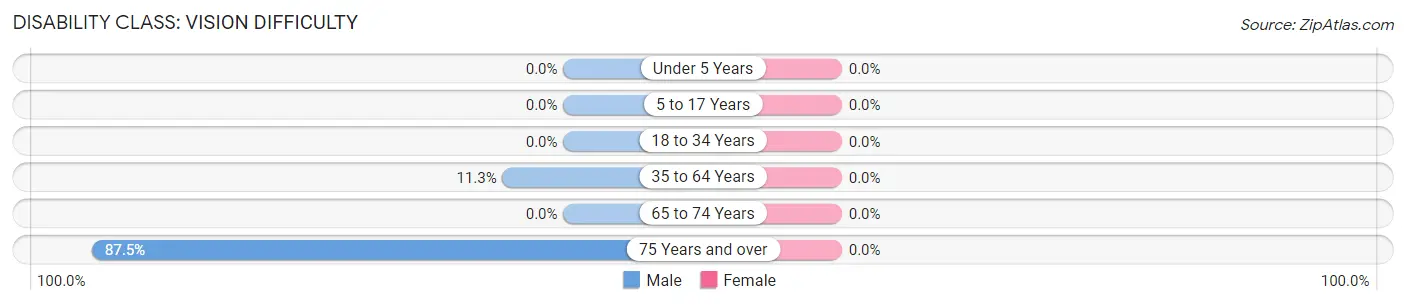
| Age Bracket | Male | Female |
| Under 5 Years | 0 (0.0%) | 0 (0.0%) |
| 5 to 17 Years | 0 (0.0%) | 0 (0.0%) |
| 18 to 34 Years | 0 (0.0%) | 0 (0.0%) |
| 35 to 64 Years | 14 (11.3%) | 0 (0.0%) |
| 65 to 74 Years | 0 (0.0%) | 0 (0.0%) |
| 75 Years and over | 14 (87.5%) | 0 (0.0%) |
Disability Class: Cognitive Difficulty
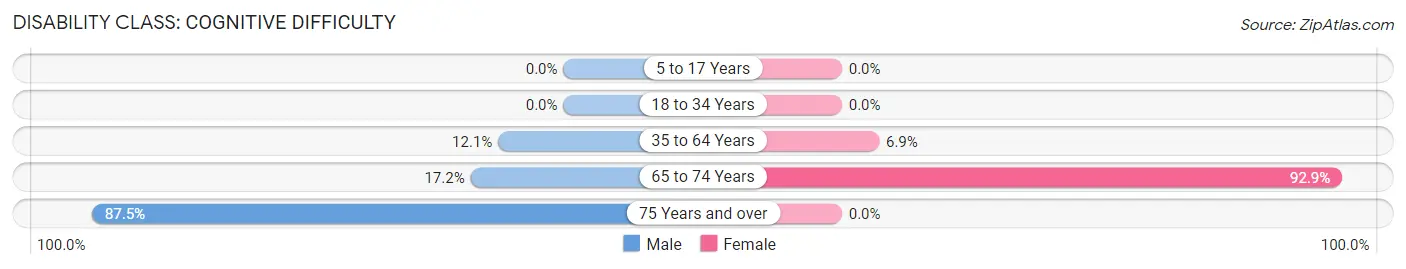
| Age Bracket | Male | Female |
| 5 to 17 Years | 0 (0.0%) | 0 (0.0%) |
| 18 to 34 Years | 0 (0.0%) | 0 (0.0%) |
| 35 to 64 Years | 15 (12.1%) | 13 (6.9%) |
| 65 to 74 Years | 10 (17.2%) | 13 (92.9%) |
| 75 Years and over | 14 (87.5%) | 0 (0.0%) |
Disability Class: Ambulatory Difficulty
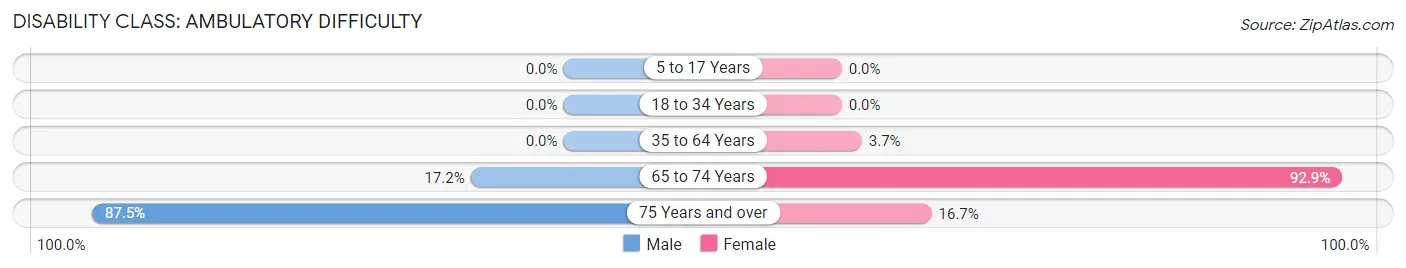
| Age Bracket | Male | Female |
| 5 to 17 Years | 0 (0.0%) | 0 (0.0%) |
| 18 to 34 Years | 0 (0.0%) | 0 (0.0%) |
| 35 to 64 Years | 0 (0.0%) | 7 (3.7%) |
| 65 to 74 Years | 10 (17.2%) | 13 (92.9%) |
| 75 Years and over | 14 (87.5%) | 3 (16.7%) |
Disability Class: Self-Care Difficulty
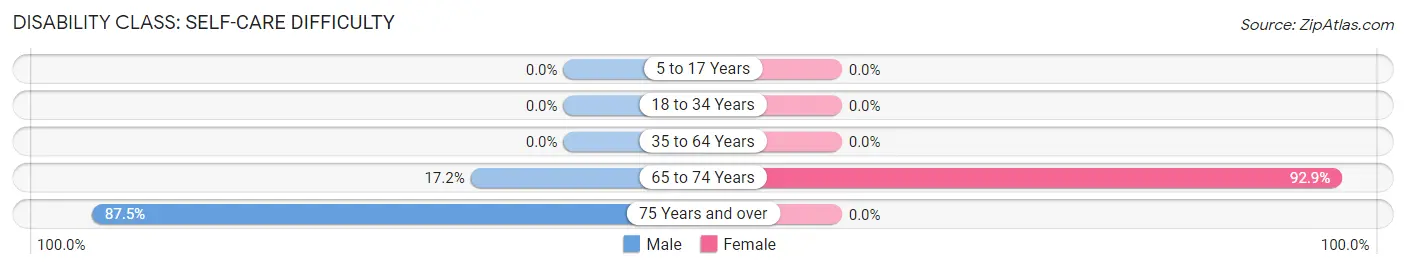
| Age Bracket | Male | Female |
| 5 to 17 Years | 0 (0.0%) | 0 (0.0%) |
| 18 to 34 Years | 0 (0.0%) | 0 (0.0%) |
| 35 to 64 Years | 0 (0.0%) | 0 (0.0%) |
| 65 to 74 Years | 10 (17.2%) | 13 (92.9%) |
| 75 Years and over | 14 (87.5%) | 0 (0.0%) |
Technology Access in Indian Springs
Computing Device Access in Indian Springs
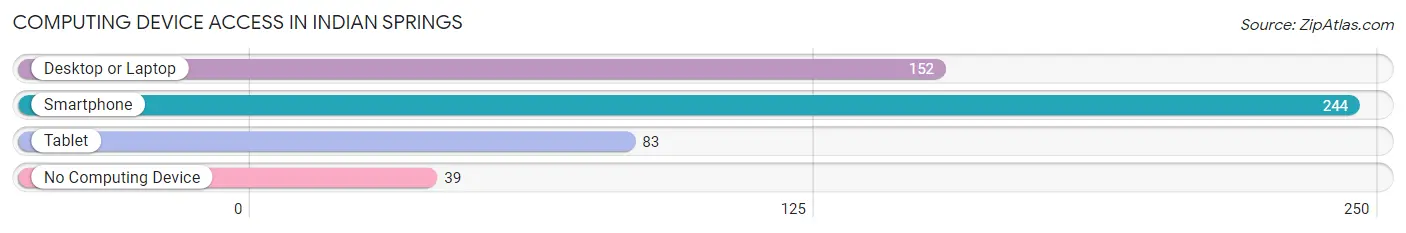
| Device Type | # Households | % Households |
| Desktop or Laptop | 152 | 53.7% |
| Smartphone | 244 | 86.2% |
| Tablet | 83 | 29.3% |
| No Computing Device | 39 | 13.8% |
| Total | 283 | 100.0% |
Internet Access in Indian Springs
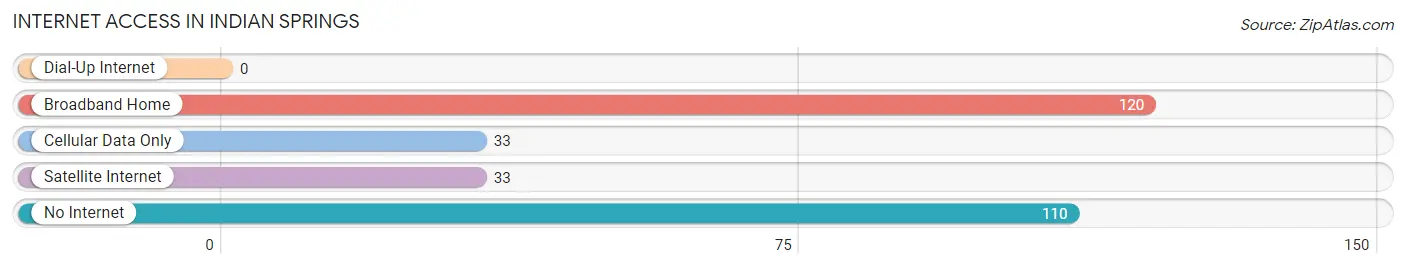
| Internet Type | # Households | % Households |
| Dial-Up Internet | 0 | 0.0% |
| Broadband Home | 120 | 42.4% |
| Cellular Data Only | 33 | 11.7% |
| Satellite Internet | 33 | 11.7% |
| No Internet | 110 | 38.9% |
| Total | 283 | 100.0% |
Indian Springs Summary
History
Indian Springs is an unincorporated town located in Clark County, Nevada. It is located approximately 45 miles northwest of Las Vegas and is home to Creech Air Force Base. The town was founded in the early 1950s by a group of Native Americans who were looking for a place to settle and raise their families. The town was named after the nearby Indian Springs, which is a natural spring that has been used by Native Americans for centuries.
The town was originally a small farming community, but it has since grown to become a popular tourist destination. The town is home to a variety of attractions, including the Indian Springs National Wildlife Refuge, the Indian Springs Air Force Base, and the Indian Springs State Park.
Geography
Indian Springs is located in the Mojave Desert in Clark County, Nevada. It is situated at an elevation of 3,000 feet and is surrounded by mountains on all sides. The town is located approximately 45 miles northwest of Las Vegas and is bordered by the cities of Las Vegas, North Las Vegas, and Henderson.
The town is located in a semi-arid climate, with hot summers and mild winters. The average annual temperature is around 70 degrees Fahrenheit, with temperatures reaching up to 100 degrees Fahrenheit in the summer months. The town receives an average of 8 inches of precipitation per year.
Economy
The economy of Indian Springs is largely driven by tourism and the military. The town is home to the Indian Springs Air Force Base, which is a major employer in the area. The base is home to the U.S. Air Force's 99th Air Base Wing and the U.S. Air Force's 57th Wing. The base is also home to a variety of other military units, including the U.S. Army's 1st Armored Division and the U.S. Navy's Strike Fighter Squadron.
The town is also home to a variety of tourist attractions, including the Indian Springs National Wildlife Refuge, the Indian Springs State Park, and the Indian Springs Golf Course. The town is also home to a variety of restaurants, bars, and shops.
Demographics
As of the 2010 census, the population of Indian Springs was 1,711. The population is largely made up of Native Americans, with the majority of the population being of Navajo descent. The town also has a large Hispanic population, with the majority of the population being of Mexican descent. The town also has a small population of African Americans, with the majority of the population being of African American descent.
The median household income in Indian Springs is $45,000, and the median home value is $150,000. The town has a poverty rate of 16.3%, which is higher than the national average. The town also has a high unemployment rate, with the unemployment rate being 8.2%.
Conclusion
Indian Springs is an unincorporated town located in Clark County, Nevada. It is located approximately 45 miles northwest of Las Vegas and is home to Creech Air Force Base. The town was founded in the early 1950s by a group of Native Americans who were looking for a place to settle and raise their families. The town is located in a semi-arid climate, with hot summers and mild winters. The economy of Indian Springs is largely driven by tourism and the military. The population of Indian Springs is largely made up of Native Americans, with the majority of the population being of Navajo descent. The town also has a large Hispanic population, with the majority of the population being of Mexican descent. The median household income in Indian Springs is $45,000, and the median home value is $150,000. The town has a poverty rate of 16.3%, which is higher than the national average.
Common Questions
What is Per Capita Income in Indian Springs?
Per Capita income in Indian Springs is $27,358.
What is the Median Family Income in Indian Springs?
Median Family Income in Indian Springs is $78,472.
What is the Median Household income in Indian Springs?
Median Household Income in Indian Springs is $56,250.
What is Income or Wage Gap in Indian Springs?
Income or Wage Gap in Indian Springs is 43.1%.
Women in Indian Springs earn 56.9 cents for every dollar earned by a man.
What is Inequality or Gini Index in Indian Springs?
Inequality or Gini Index in Indian Springs is 0.38.
What is the Total Population of Indian Springs?
Total Population of Indian Springs is 837.
What is the Total Male Population of Indian Springs?
Total Male Population of Indian Springs is 424.
What is the Total Female Population of Indian Springs?
Total Female Population of Indian Springs is 413.
What is the Ratio of Males per 100 Females in Indian Springs?
There are 102.66 Males per 100 Females in Indian Springs.
What is the Ratio of Females per 100 Males in Indian Springs?
There are 97.41 Females per 100 Males in Indian Springs.
What is the Median Population Age in Indian Springs?
Median Population Age in Indian Springs is 35.0 Years.
What is the Average Family Size in Indian Springs
Average Family Size in Indian Springs is 3.7 People.
What is the Average Household Size in Indian Springs
Average Household Size in Indian Springs is 3.0 People.
How Large is the Labor Force in Indian Springs?
There are 404 People in the Labor Forcein in Indian Springs.
What is the Percentage of People in the Labor Force in Indian Springs?
64.3% of People are in the Labor Force in Indian Springs.
What is the Unemployment Rate in Indian Springs?
Unemployment Rate in Indian Springs is 5.8%.