Searchlight, NV Map & Demographics
Searchlight Map
Searchlight Overview
$31,202
PER CAPITA INCOME
$42,708
AVG FAMILY INCOME
0.48
INEQUALITY / GINI INDEX
278
TOTAL POPULATION
172
MALE POPULATION
106
FEMALE POPULATION
162.26
MALES / 100 FEMALES
61.63
FEMALES / 100 MALES
68.0
MEDIAN AGE
2.1
AVG FAMILY SIZE
1.4
AVG HOUSEHOLD SIZE
67
LABOR FORCE [ PEOPLE ]
24.5%
PERCENT IN LABOR FORCE
Searchlight Zip Codes
Income in Searchlight
Income Overview in Searchlight
| Characteristic | Number | Measure |
| Per Capita Income | 278 | $31,202 |
| Median Family Income | 70 | $42,708 |
| Mean Family Income | 70 | $43,237 |
| Median Household Income | 198 | $0 |
| Mean Household Income | 198 | $43,621 |
| Income Deficit | 70 | $0 |
| Wage / Income Gap (%) | 278 | 0.00% |
| Wage / Income Gap ($) | 278 | 100.00¢ per $1 |
| Gini / Inequality Index | 278 | 0.48 |
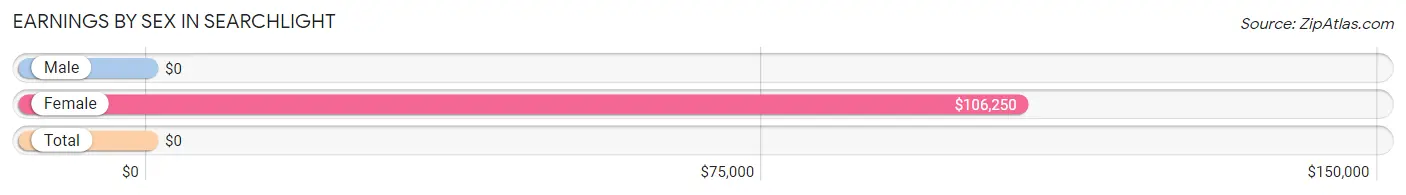
Earnings by Sex in Searchlight
| Sex | Number | Average Earnings |
| Male | 35 (52.2%) | $0 |
| Female | 32 (47.8%) | $106,250 |
| Total | 67 (100.0%) | $0 |
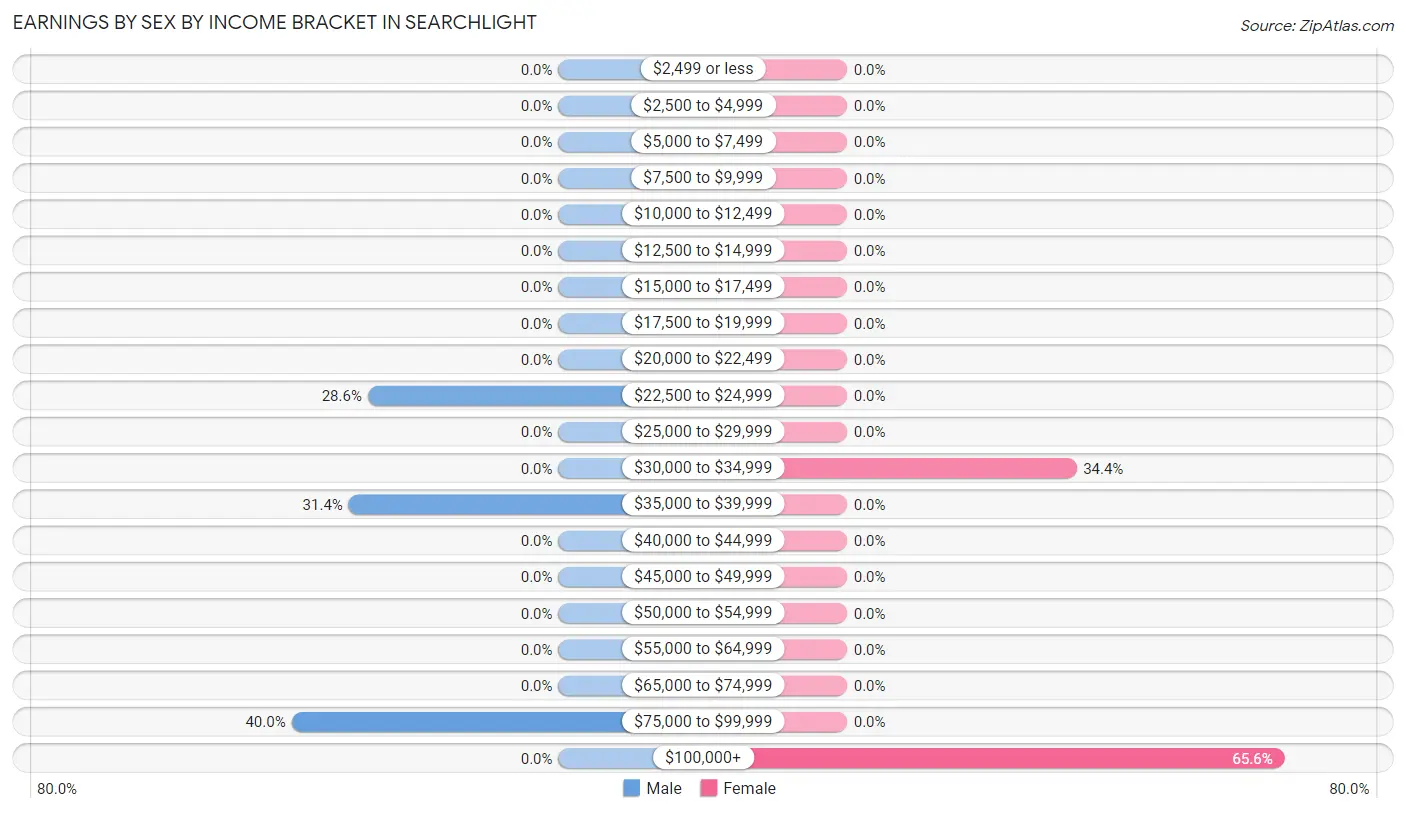
Earnings by Sex by Income Bracket in Searchlight
The most common earnings brackets in Searchlight are $75,000 to $99,999 for men (14 | 40.0%) and $100,000+ for women (21 | 65.6%).
| Income | Male | Female |
| $2,499 or less | 0 (0.0%) | 0 (0.0%) |
| $2,500 to $4,999 | 0 (0.0%) | 0 (0.0%) |
| $5,000 to $7,499 | 0 (0.0%) | 0 (0.0%) |
| $7,500 to $9,999 | 0 (0.0%) | 0 (0.0%) |
| $10,000 to $12,499 | 0 (0.0%) | 0 (0.0%) |
| $12,500 to $14,999 | 0 (0.0%) | 0 (0.0%) |
| $15,000 to $17,499 | 0 (0.0%) | 0 (0.0%) |
| $17,500 to $19,999 | 0 (0.0%) | 0 (0.0%) |
| $20,000 to $22,499 | 0 (0.0%) | 0 (0.0%) |
| $22,500 to $24,999 | 10 (28.6%) | 0 (0.0%) |
| $25,000 to $29,999 | 0 (0.0%) | 0 (0.0%) |
| $30,000 to $34,999 | 0 (0.0%) | 11 (34.4%) |
| $35,000 to $39,999 | 11 (31.4%) | 0 (0.0%) |
| $40,000 to $44,999 | 0 (0.0%) | 0 (0.0%) |
| $45,000 to $49,999 | 0 (0.0%) | 0 (0.0%) |
| $50,000 to $54,999 | 0 (0.0%) | 0 (0.0%) |
| $55,000 to $64,999 | 0 (0.0%) | 0 (0.0%) |
| $65,000 to $74,999 | 0 (0.0%) | 0 (0.0%) |
| $75,000 to $99,999 | 14 (40.0%) | 0 (0.0%) |
| $100,000+ | 0 (0.0%) | 21 (65.6%) |
| Total | 35 (100.0%) | 32 (100.0%) |
Earnings by Sex by Educational Attainment in Searchlight
| Educational Attainment | Male Income | Female Income |
| Less than High School | - | - |
| High School Diploma | - | - |
| College or Associate's Degree | - | - |
| Bachelor's Degree | - | - |
| Graduate Degree | - | - |
| Total | - | - |
Family Income in Searchlight
Family Income Brackets in Searchlight
According to the Searchlight family income data, there are 24 families falling into the $35,000 to $49,999 income range, which is the most common income bracket and makes up 34.3% of all families.
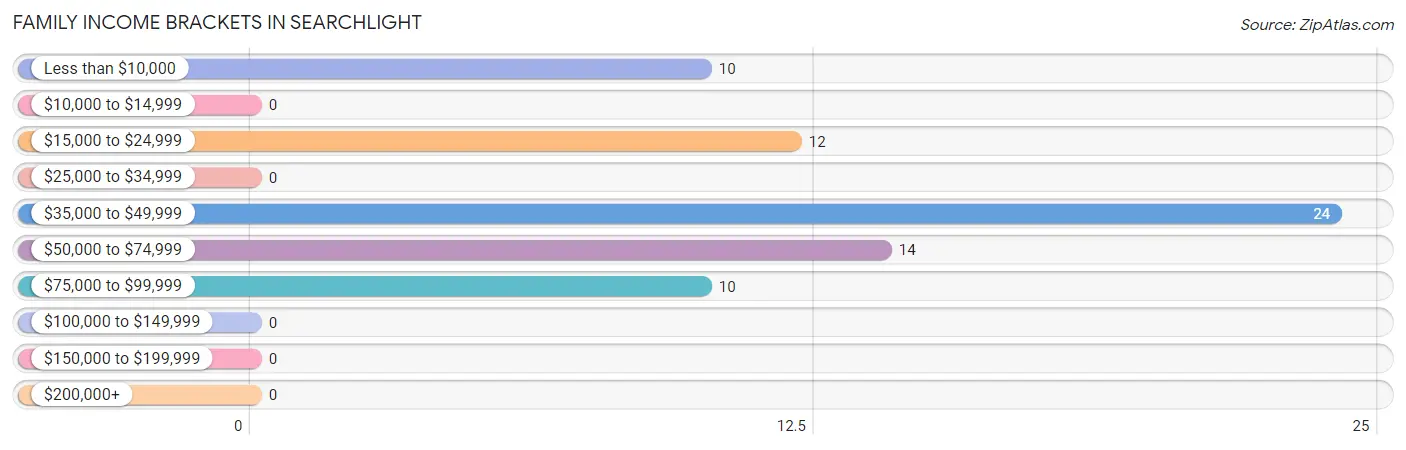
| Income Bracket | # Families | % Families |
| Less than $10,000 | 10 | 14.3% |
| $10,000 to $14,999 | 0 | 0.0% |
| $15,000 to $24,999 | 12 | 17.1% |
| $25,000 to $34,999 | 0 | 0.0% |
| $35,000 to $49,999 | 24 | 34.3% |
| $50,000 to $74,999 | 14 | 20.0% |
| $75,000 to $99,999 | 10 | 14.3% |
| $100,000 to $149,999 | 0 | 0.0% |
| $150,000 to $199,999 | 0 | 0.0% |
| $200,000+ | 0 | 0.0% |
Family Income by Famaliy Size in Searchlight
2-person families (58 | 82.9%) account for the highest median family income in Searchlight with $43,958 per family, while 2-person families (58 | 82.9%) have the highest median income of $21,979 per family member.
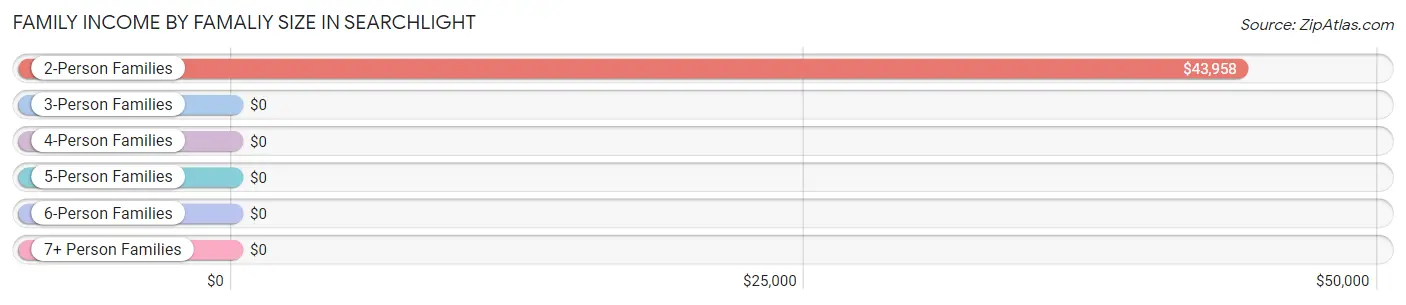
| Income Bracket | # Families | Median Income |
| 2-Person Families | 58 (82.9%) | $43,958 |
| 3-Person Families | 12 (17.1%) | $0 |
| 4-Person Families | 0 (0.0%) | $0 |
| 5-Person Families | 0 (0.0%) | $0 |
| 6-Person Families | 0 (0.0%) | $0 |
| 7+ Person Families | 0 (0.0%) | $0 |
| Total | 70 (100.0%) | $42,708 |
Family Income by Number of Earners in Searchlight
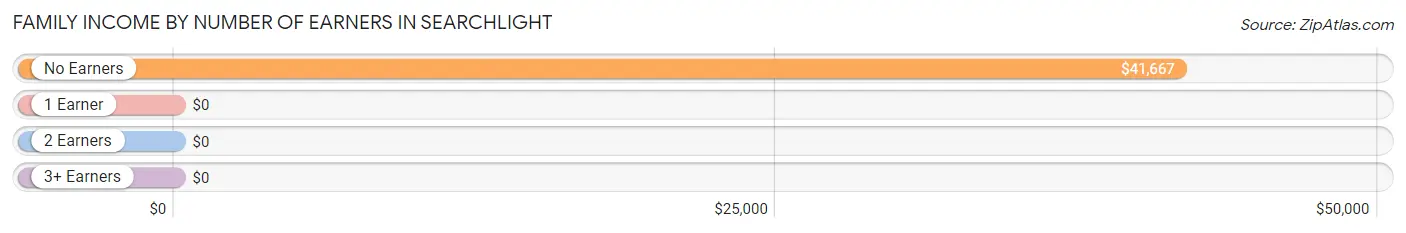
| Number of Earners | # Families | Median Income |
| No Earners | 60 (85.7%) | $41,667 |
| 1 Earner | 0 (0.0%) | $0 |
| 2 Earners | 10 (14.3%) | $0 |
| 3+ Earners | 0 (0.0%) | $0 |
| Total | 70 (100.0%) | $42,708 |
Household Income in Searchlight
Household Income Brackets in Searchlight
With 59 households falling in the category, the less than $10,000 income range is the most frequent in Searchlight, accounting for 29.8% of all households.
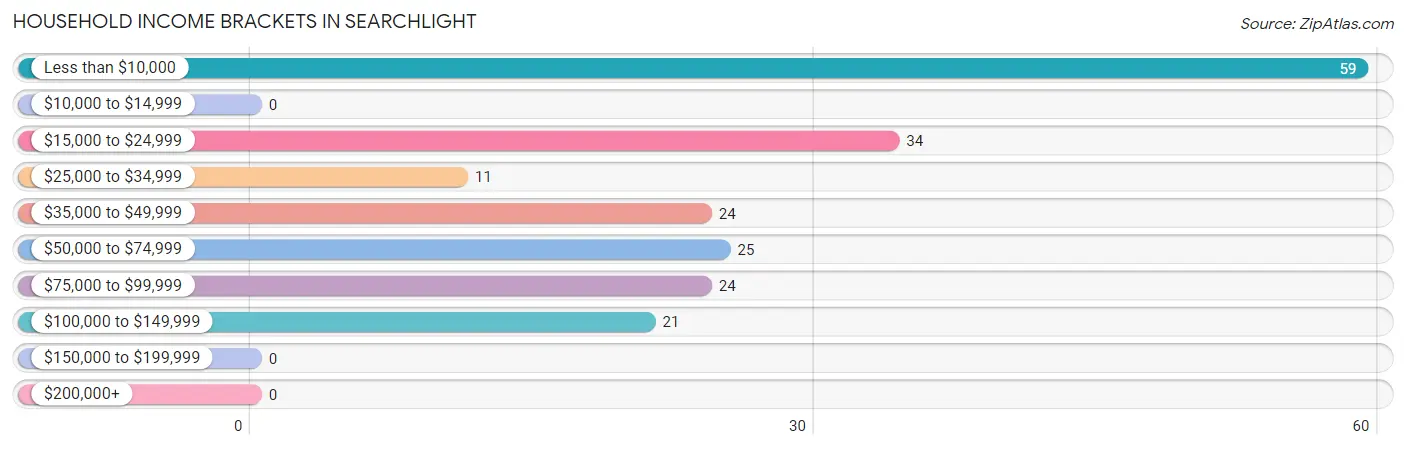
| Income Bracket | # Households | % Households |
| Less than $10,000 | 59 | 29.8% |
| $10,000 to $14,999 | 0 | 0.0% |
| $15,000 to $24,999 | 34 | 17.2% |
| $25,000 to $34,999 | 11 | 5.6% |
| $35,000 to $49,999 | 24 | 12.1% |
| $50,000 to $74,999 | 25 | 12.6% |
| $75,000 to $99,999 | 24 | 12.1% |
| $100,000 to $149,999 | 21 | 10.6% |
| $150,000 to $199,999 | 0 | 0.0% |
| $200,000+ | 0 | 0.0% |
Household Income by Householder Age in Searchlight
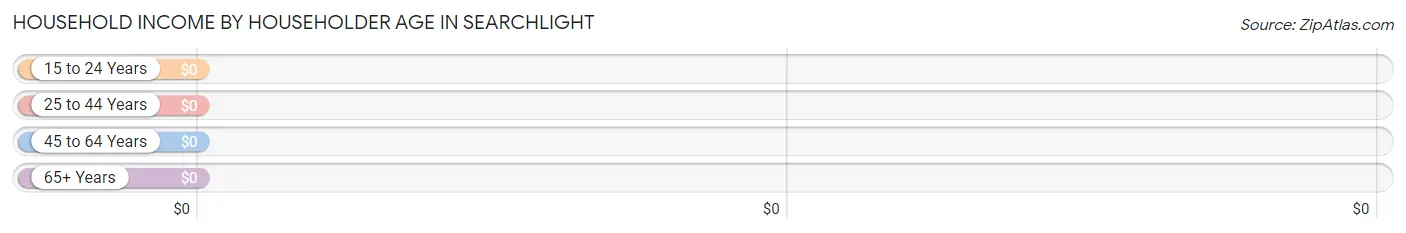
| Income Bracket | # Households | Median Income |
| 15 to 24 Years | 0 (0.0%) | $0 |
| 25 to 44 Years | 14 (7.1%) | $0 |
| 45 to 64 Years | 55 (27.8%) | $0 |
| 65+ Years | 129 (65.1%) | $0 |
| Total | 198 (100.0%) | $0 |
Poverty in Searchlight
Income Below Poverty by Sex and Age in Searchlight
With 35.5% poverty level for males and 23.6% for females among the residents of Searchlight, 75 year old and over males and 15 year old females are the most vulnerable to poverty, with 49 males (81.7%) and 4 females (100.0%) in their respective age groups living below the poverty level.
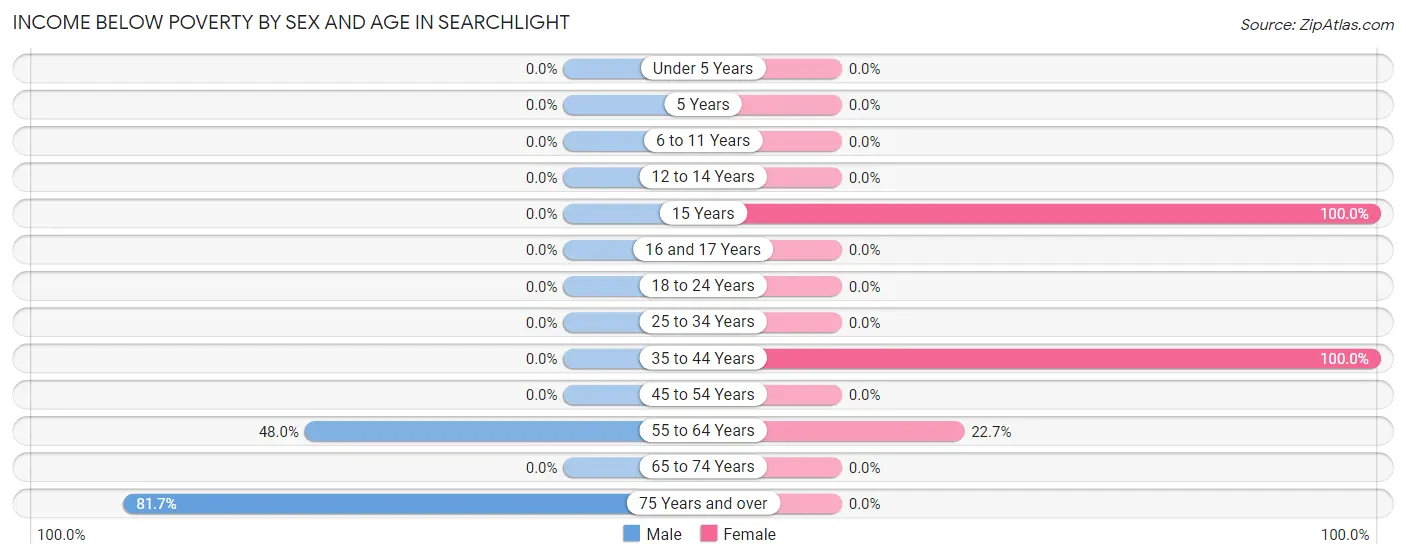
| Age Bracket | Male | Female |
| Under 5 Years | 0 (0.0%) | 0 (0.0%) |
| 5 Years | 0 (0.0%) | 0 (0.0%) |
| 6 to 11 Years | 0 (0.0%) | 0 (0.0%) |
| 12 to 14 Years | 0 (0.0%) | 0 (0.0%) |
| 15 Years | 0 (0.0%) | 4 (100.0%) |
| 16 and 17 Years | 0 (0.0%) | 0 (0.0%) |
| 18 to 24 Years | 0 (0.0%) | 0 (0.0%) |
| 25 to 34 Years | 0 (0.0%) | 0 (0.0%) |
| 35 to 44 Years | 0 (0.0%) | 11 (100.0%) |
| 45 to 54 Years | 0 (0.0%) | 0 (0.0%) |
| 55 to 64 Years | 12 (48.0%) | 10 (22.7%) |
| 65 to 74 Years | 0 (0.0%) | 0 (0.0%) |
| 75 Years and over | 49 (81.7%) | 0 (0.0%) |
| Total | 61 (35.5%) | 25 (23.6%) |
Income Above Poverty by Sex and Age in Searchlight
According to the poverty statistics in Searchlight, males aged 25 to 34 years and females aged 45 to 54 years are the age groups that are most secure financially, with 100.0% of males and 100.0% of females in these age groups living above the poverty line.
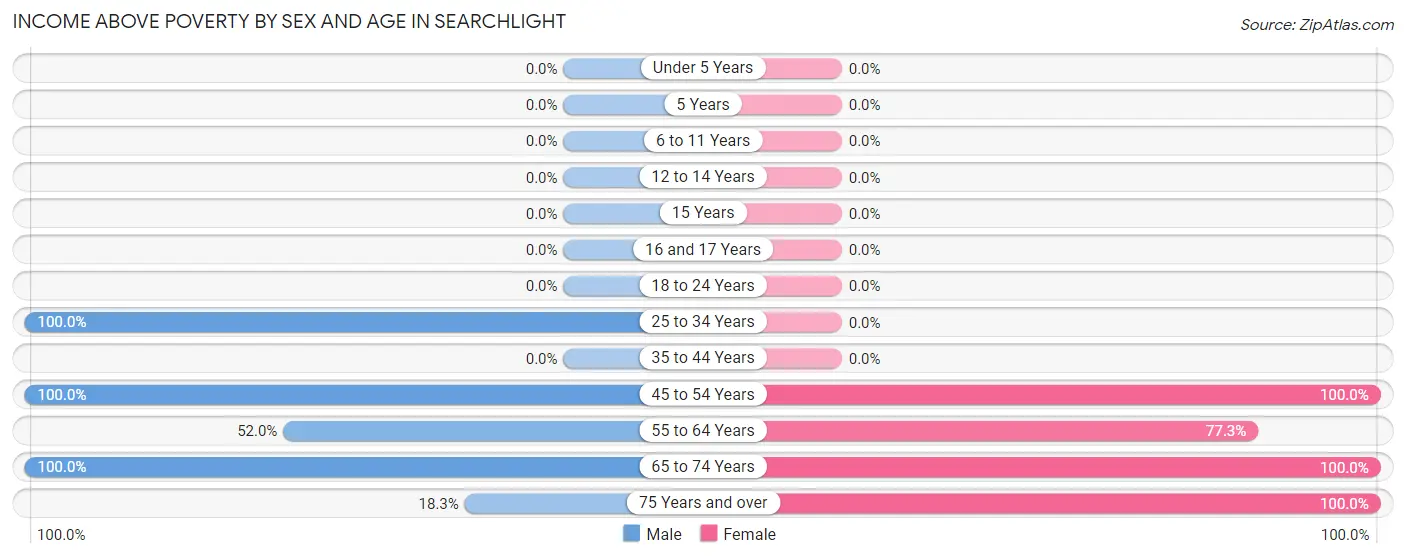
| Age Bracket | Male | Female |
| Under 5 Years | 0 (0.0%) | 0 (0.0%) |
| 5 Years | 0 (0.0%) | 0 (0.0%) |
| 6 to 11 Years | 0 (0.0%) | 0 (0.0%) |
| 12 to 14 Years | 0 (0.0%) | 0 (0.0%) |
| 15 Years | 0 (0.0%) | 0 (0.0%) |
| 16 and 17 Years | 0 (0.0%) | 0 (0.0%) |
| 18 to 24 Years | 0 (0.0%) | 0 (0.0%) |
| 25 to 34 Years | 14 (100.0%) | 0 (0.0%) |
| 35 to 44 Years | 0 (0.0%) | 0 (0.0%) |
| 45 to 54 Years | 17 (100.0%) | 10 (100.0%) |
| 55 to 64 Years | 13 (52.0%) | 34 (77.3%) |
| 65 to 74 Years | 56 (100.0%) | 25 (100.0%) |
| 75 Years and over | 11 (18.3%) | 12 (100.0%) |
| Total | 111 (64.5%) | 81 (76.4%) |
Income Below Poverty Among Married-Couple Families in Searchlight
The poverty statistics for married-couple families in Searchlight show that 20.0% or 12 of the total 60 families live below the poverty line. Families with no children have the highest poverty rate of 20.0%, comprising of 12 families. On the other hand, families with no children have the lowest poverty rate of 20.0%, which includes 12 families.
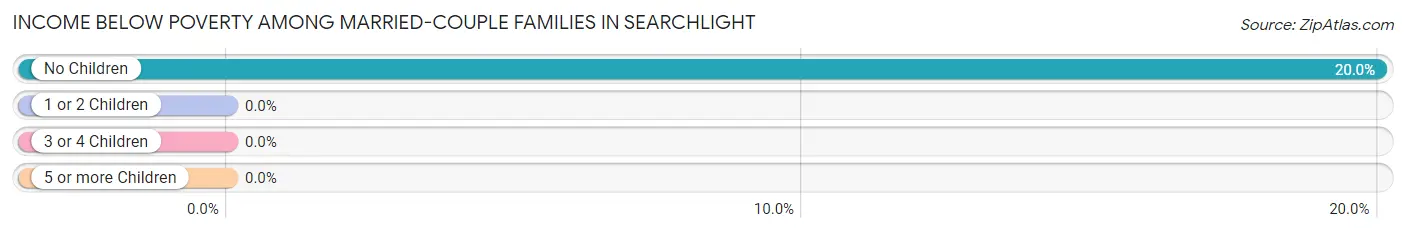
| Children | Above Poverty | Below Poverty |
| No Children | 48 (80.0%) | 12 (20.0%) |
| 1 or 2 Children | 0 (0.0%) | 0 (0.0%) |
| 3 or 4 Children | 0 (0.0%) | 0 (0.0%) |
| 5 or more Children | 0 (0.0%) | 0 (0.0%) |
| Total | 48 (80.0%) | 12 (20.0%) |
Income Below Poverty Among Single-Parent Households in Searchlight
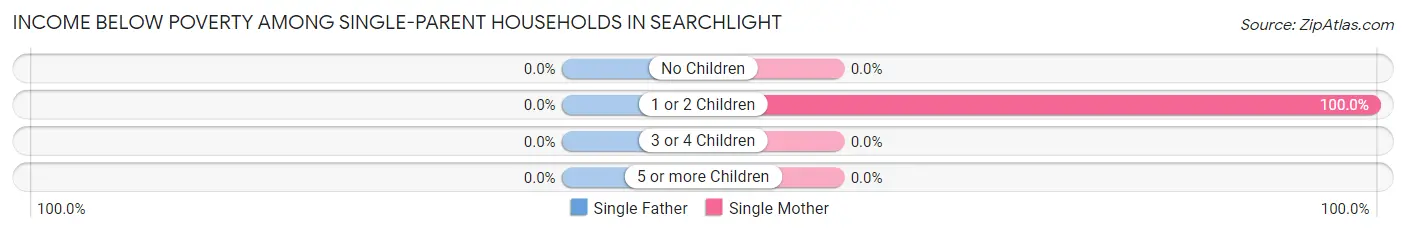
| Children | Single Father | Single Mother |
| No Children | 0 (0.0%) | 0 (0.0%) |
| 1 or 2 Children | 0 (0.0%) | 10 (100.0%) |
| 3 or 4 Children | 0 (0.0%) | 0 (0.0%) |
| 5 or more Children | 0 (0.0%) | 0 (0.0%) |
| Total | 0 (0.0%) | 10 (100.0%) |
Income Below Poverty Among Married-Couple vs Single-Parent Households in Searchlight
The poverty data for Searchlight shows that 12 of the married-couple family households (20.0%) and 10 of the single-parent households (100.0%) are living below the poverty level. Within the married-couple family households, those with no children have the highest poverty rate, with 12 households (20.0%) falling below the poverty line. Among the single-parent households, those with 1 or 2 children have the highest poverty rate, with 10 household (100.0%) living below poverty.
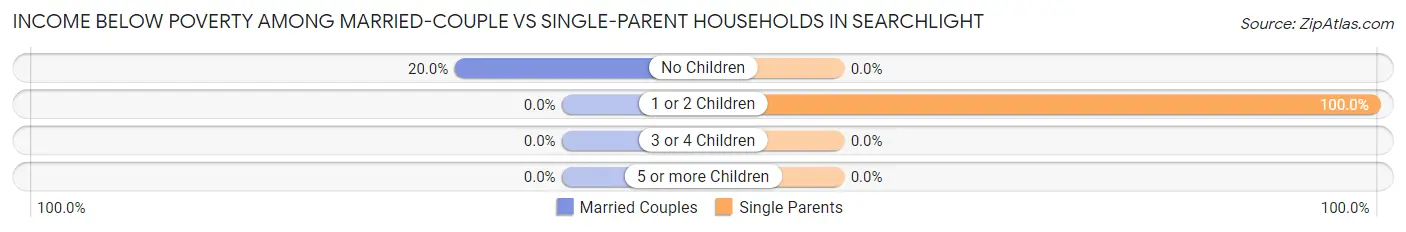
| Children | Married-Couple Families | Single-Parent Households |
| No Children | 12 (20.0%) | 0 (0.0%) |
| 1 or 2 Children | 0 (0.0%) | 10 (100.0%) |
| 3 or 4 Children | 0 (0.0%) | 0 (0.0%) |
| 5 or more Children | 0 (0.0%) | 0 (0.0%) |
| Total | 12 (20.0%) | 10 (100.0%) |
Race in Searchlight
The most populous races in Searchlight are White / Caucasian (256 | 92.1%), Two or more Races (22 | 7.9%), and Hispanic or Latino (21 | 7.5%).
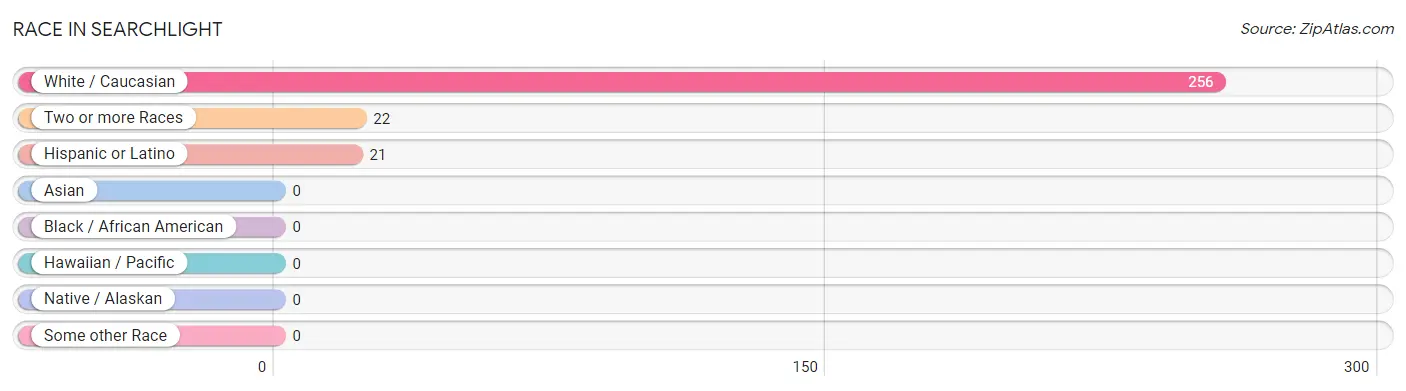
| Race | # Population | % Population |
| Asian | 0 | 0.0% |
| Black / African American | 0 | 0.0% |
| Hawaiian / Pacific | 0 | 0.0% |
| Hispanic or Latino | 21 | 7.5% |
| Native / Alaskan | 0 | 0.0% |
| White / Caucasian | 256 | 92.1% |
| Two or more Races | 22 | 7.9% |
| Some other Race | 0 | 0.0% |
| Total | 278 | 100.0% |
Ancestry in Searchlight
The most populous ancestries reported in Searchlight are English (50 | 18.0%), German (49 | 17.6%), Irish (24 | 8.6%), American (13 | 4.7%), and South American (11 | 4.0%), together accounting for 52.9% of all Searchlight residents.
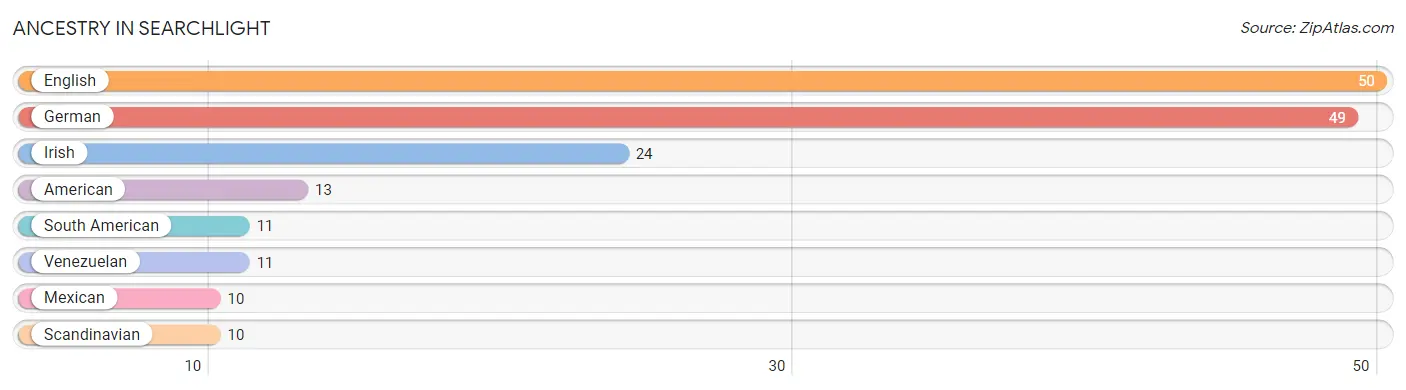
| Ancestry | # Population | % Population |
| American | 13 | 4.7% |
| English | 50 | 18.0% |
| German | 49 | 17.6% |
| Irish | 24 | 8.6% |
| Mexican | 10 | 3.6% |
| Scandinavian | 10 | 3.6% |
| South American | 11 | 4.0% |
| Venezuelan | 11 | 4.0% | View All 8 Rows |
Immigrants in Searchlight

| Immigration Origin | # Population | % Population | View All 0 Rows |
Sex and Age in Searchlight
Sex and Age in Searchlight
The most populous age groups in Searchlight are 70 to 74 Years (46 | 26.7%) for men and 65 to 69 Years (25 | 23.6%) for women.
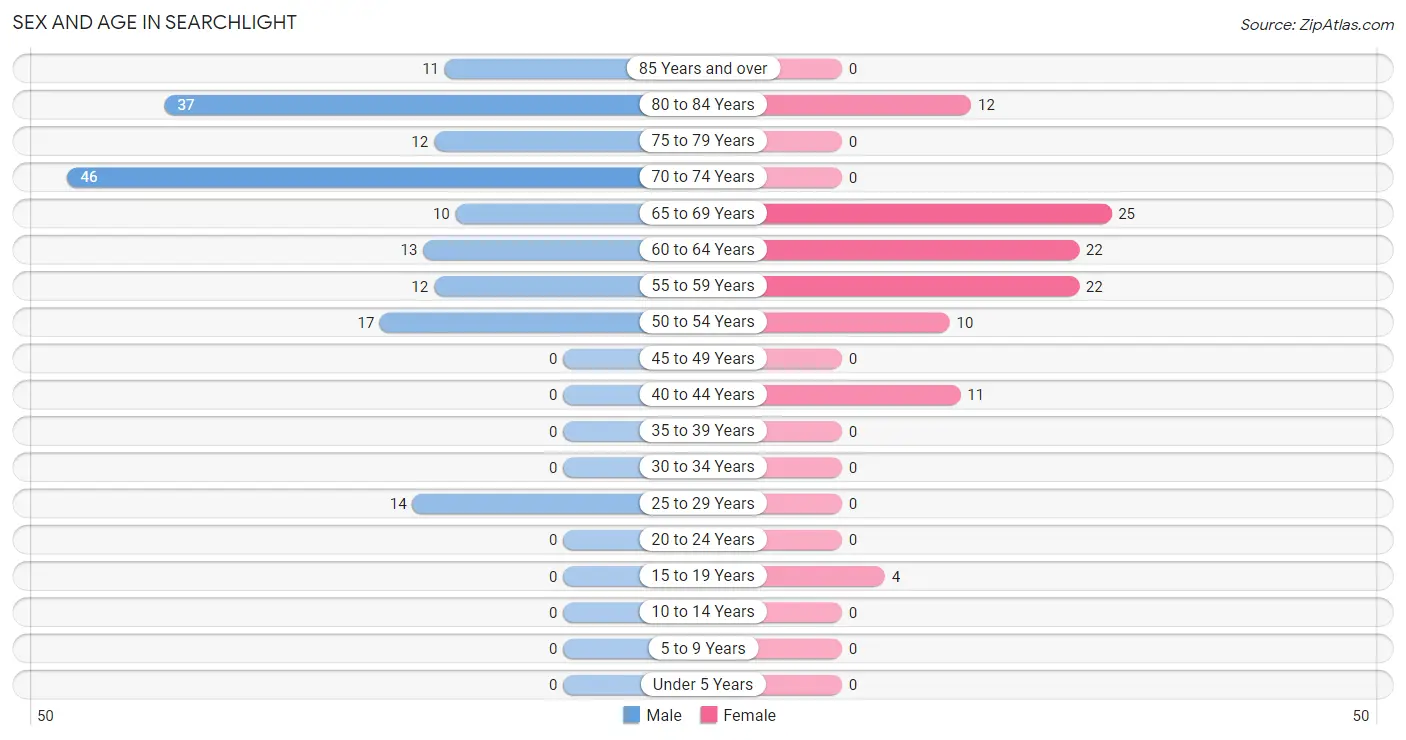
| Age Bracket | Male | Female |
| Under 5 Years | 0 (0.0%) | 0 (0.0%) |
| 5 to 9 Years | 0 (0.0%) | 0 (0.0%) |
| 10 to 14 Years | 0 (0.0%) | 0 (0.0%) |
| 15 to 19 Years | 0 (0.0%) | 4 (3.8%) |
| 20 to 24 Years | 0 (0.0%) | 0 (0.0%) |
| 25 to 29 Years | 14 (8.1%) | 0 (0.0%) |
| 30 to 34 Years | 0 (0.0%) | 0 (0.0%) |
| 35 to 39 Years | 0 (0.0%) | 0 (0.0%) |
| 40 to 44 Years | 0 (0.0%) | 11 (10.4%) |
| 45 to 49 Years | 0 (0.0%) | 0 (0.0%) |
| 50 to 54 Years | 17 (9.9%) | 10 (9.4%) |
| 55 to 59 Years | 12 (7.0%) | 22 (20.7%) |
| 60 to 64 Years | 13 (7.6%) | 22 (20.7%) |
| 65 to 69 Years | 10 (5.8%) | 25 (23.6%) |
| 70 to 74 Years | 46 (26.7%) | 0 (0.0%) |
| 75 to 79 Years | 12 (7.0%) | 0 (0.0%) |
| 80 to 84 Years | 37 (21.5%) | 12 (11.3%) |
| 85 Years and over | 11 (6.4%) | 0 (0.0%) |
| Total | 172 (100.0%) | 106 (100.0%) |
Families and Households in Searchlight
Median Family Size in Searchlight
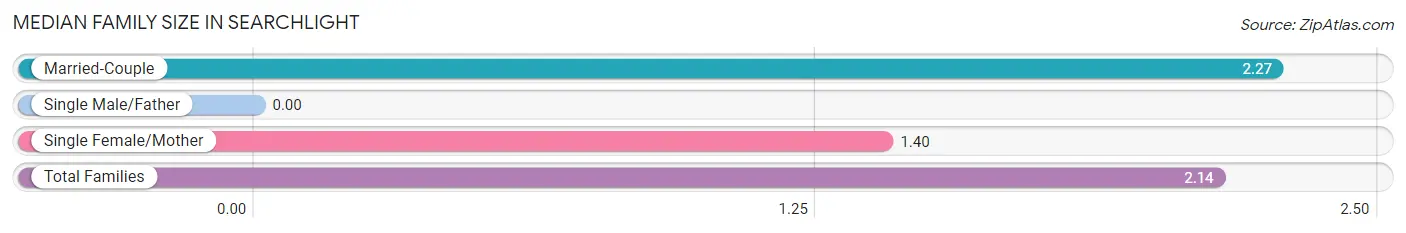
| Family Type | # Families | Family Size |
| Married-Couple | 60 (85.7%) | 2.27 |
| Single Male/Father | 0 (0.0%) | - |
| Single Female/Mother | 10 (14.3%) | 1.40 |
| Total Families | 70 (100.0%) | 2.14 |
Median Household Size in Searchlight
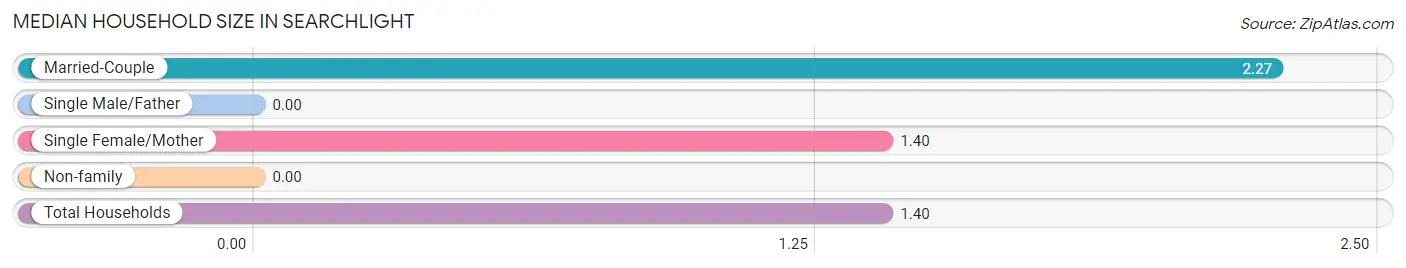
| Household Type | # Households | Household Size |
| Married-Couple | 60 (30.3%) | 2.27 |
| Single Male/Father | 0 (0.0%) | - |
| Single Female/Mother | 10 (5.1%) | 1.40 |
| Non-family | 128 (64.6%) | - |
| Total Households | 198 (100.0%) | 1.40 |
Household Size by Marriage Status in Searchlight
Out of a total of 198 households in Searchlight, 70 (35.3%) are family households, while 128 (64.6%) are nonfamily households. The most numerous type of family households are 2-person households, comprising 58, and the most common type of nonfamily households are 1-person households, comprising 128.
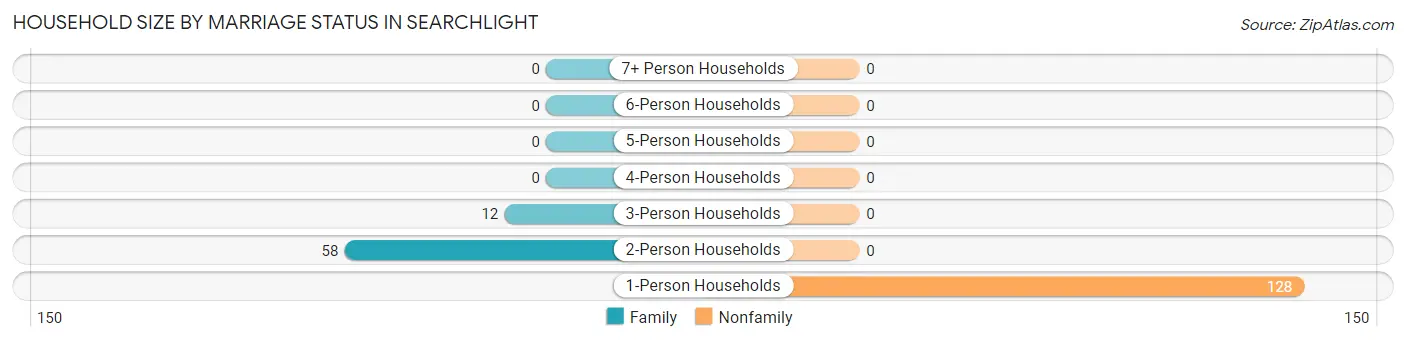
| Household Size | Family Households | Nonfamily Households |
| 1-Person Households | - | 128 (64.6%) |
| 2-Person Households | 58 (29.3%) | 0 (0.0%) |
| 3-Person Households | 12 (6.1%) | 0 (0.0%) |
| 4-Person Households | 0 (0.0%) | 0 (0.0%) |
| 5-Person Households | 0 (0.0%) | 0 (0.0%) |
| 6-Person Households | 0 (0.0%) | 0 (0.0%) |
| 7+ Person Households | 0 (0.0%) | 0 (0.0%) |
| Total | 70 (35.3%) | 128 (64.6%) |
Female Fertility in Searchlight
Fertility by Age in Searchlight
| Age Bracket | Women with Births | Births / 1,000 Women |
| 15 to 19 years | 0 (0.0%) | 0.0 |
| 20 to 34 years | 0 (0.0%) | 0.0 |
| 35 to 50 years | 0 (0.0%) | 0.0 |
| Total | 0 (0.0%) | 0.0 |
Fertility by Age by Marriage Status in Searchlight
| Age Bracket | Married | Unmarried |
| 15 to 19 years | 0 (0.0%) | 0 (0.0%) |
| 20 to 34 years | 0 (0.0%) | 0 (0.0%) |
| 35 to 50 years | 0 (0.0%) | 0 (0.0%) |
| Total | 0 (0.0%) | 0 (0.0%) |
Fertility by Education in Searchlight
| Educational Attainment | Women with Births | Births / 1,000 Women |
| Less than High School | 0 (0.0%) | 0.0 |
| High School Diploma | 0 (0.0%) | 0.0 |
| College or Associate's Degree | 0 (0.0%) | 0.0 |
| Bachelor's Degree | 0 (0.0%) | 0.0 |
| Graduate Degree | 0 (0.0%) | 0.0 |
| Total | 0 (0.0%) | 0.0 |
Fertility by Education by Marriage Status in Searchlight
| Educational Attainment | Married | Unmarried |
| Less than High School | 0 (0.0%) | 0 (0.0%) |
| High School Diploma | 0 (0.0%) | 0 (0.0%) |
| College or Associate's Degree | 0 (0.0%) | 0 (0.0%) |
| Bachelor's Degree | 0 (0.0%) | 0 (0.0%) |
| Graduate Degree | 0 (0.0%) | 0 (0.0%) |
| Total | 0 (0.0%) | 0 (0.0%) |
Employment Characteristics in Searchlight
Employment by Class of Employer in Searchlight
Among the 67 employed individuals in Searchlight, private company employees (56 | 83.6%), and state government employees (11 | 16.4%) make up the most common classes of employment.
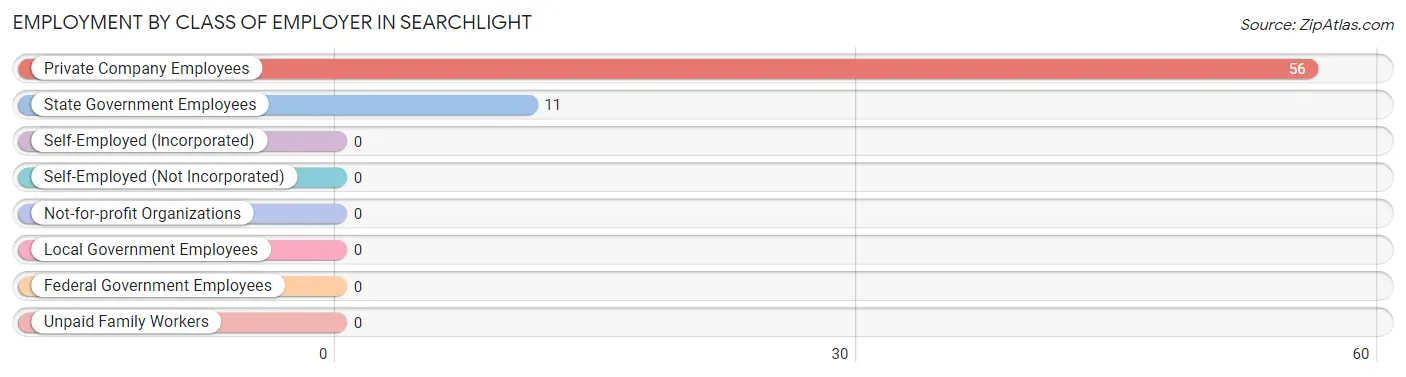
| Employer Class | # Employees | % Employees |
| Private Company Employees | 56 | 83.6% |
| Self-Employed (Incorporated) | 0 | 0.0% |
| Self-Employed (Not Incorporated) | 0 | 0.0% |
| Not-for-profit Organizations | 0 | 0.0% |
| Local Government Employees | 0 | 0.0% |
| State Government Employees | 11 | 16.4% |
| Federal Government Employees | 0 | 0.0% |
| Unpaid Family Workers | 0 | 0.0% |
| Total | 67 | 100.0% |
Employment Status by Age in Searchlight
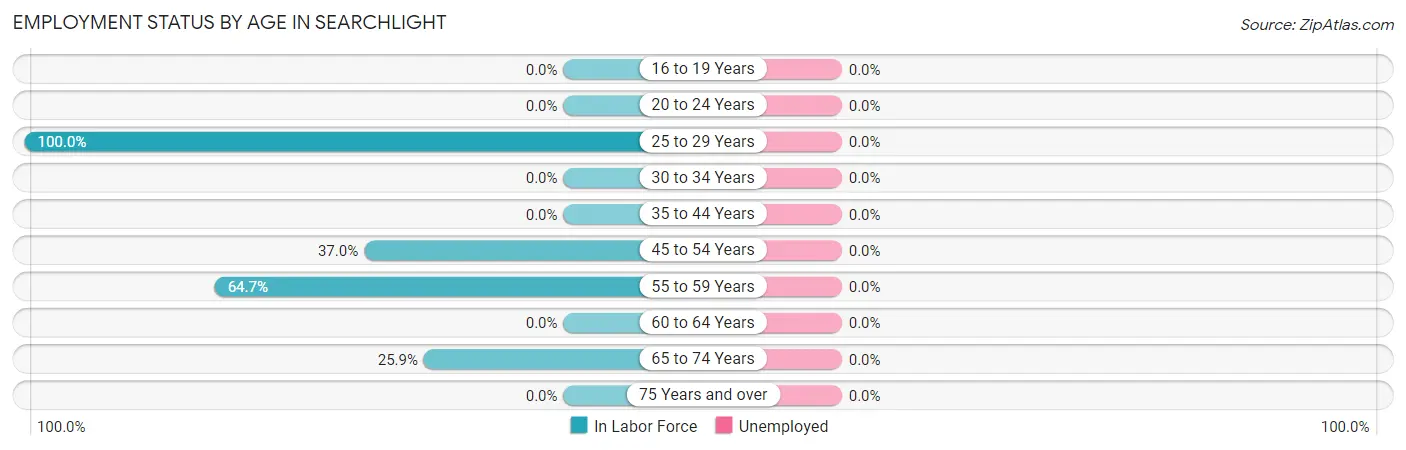
| Age Bracket | In Labor Force | Unemployed |
| 16 to 19 Years | 0 (0.0%) | 0 (0.0%) |
| 20 to 24 Years | 0 (0.0%) | 0 (0.0%) |
| 25 to 29 Years | 14 (100.0%) | 0 (0.0%) |
| 30 to 34 Years | 0 (0.0%) | 0 (0.0%) |
| 35 to 44 Years | 0 (0.0%) | 0 (0.0%) |
| 45 to 54 Years | 10 (37.0%) | 0 (0.0%) |
| 55 to 59 Years | 22 (64.7%) | 0 (0.0%) |
| 60 to 64 Years | 0 (0.0%) | 0 (0.0%) |
| 65 to 74 Years | 21 (25.9%) | 0 (0.0%) |
| 75 Years and over | 0 (0.0%) | 0 (0.0%) |
| Total | 67 (24.5%) | 0 (0.0%) |
Employment Status by Educational Attainment in Searchlight
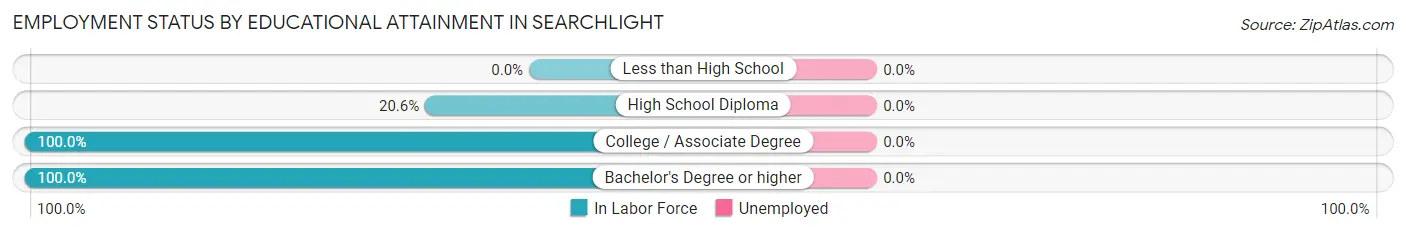
| Educational Attainment | In Labor Force | Unemployed |
| Less than High School | 0 (0.0%) | 0 (0.0%) |
| High School Diploma | 14 (20.6%) | 0 (0.0%) |
| College / Associate Degree | 11 (100.0%) | 0 (0.0%) |
| Bachelor's Degree or higher | 21 (100.0%) | 0 (0.0%) |
| Total | 46 (38.0%) | 0 (0.0%) |
Employment Occupations by Sex in Searchlight
Management, Business, Science and Arts Occupations
The most common Management, Business, Science and Arts occupations in Searchlight are , and Business & Financial (21 | 31.3%).
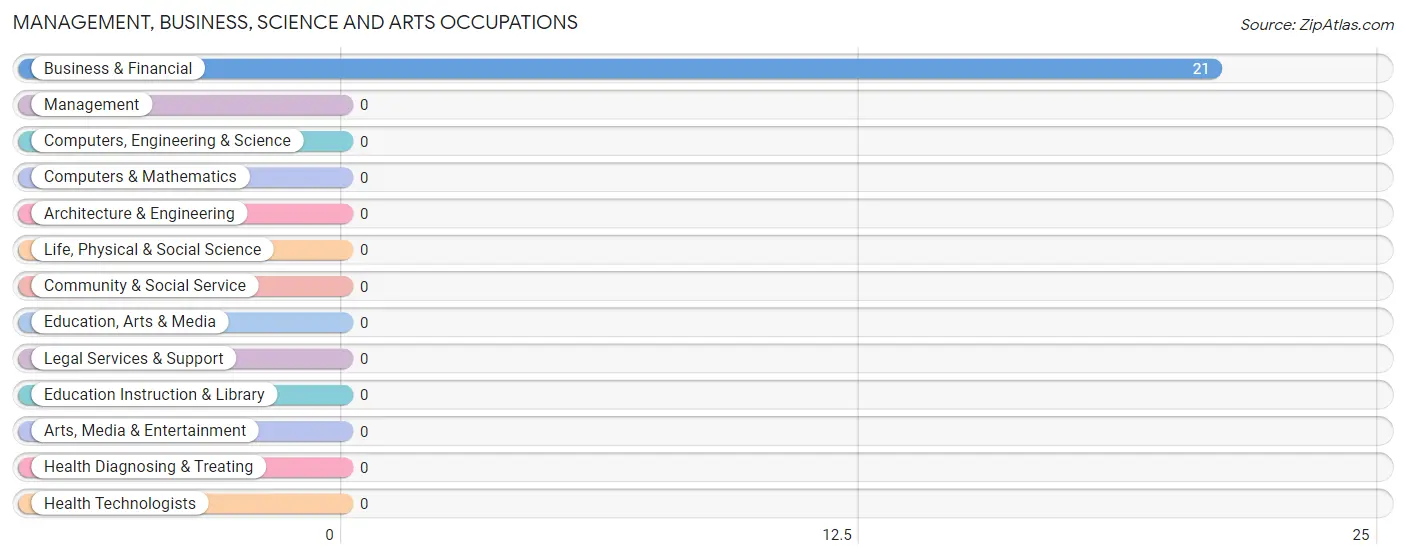
Management, Business, Science and Arts Occupations by Sex
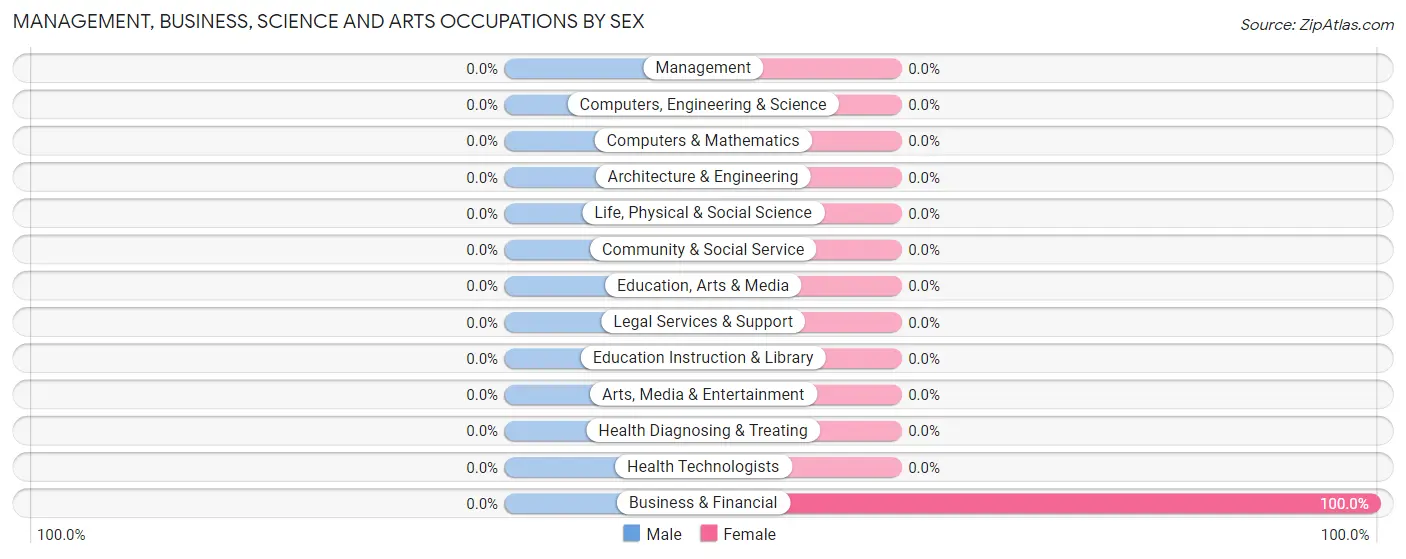
| Occupation | Male | Female |
| Management | 0 (0.0%) | 0 (0.0%) |
| Business & Financial | 0 (0.0%) | 21 (100.0%) |
| Computers, Engineering & Science | 0 (0.0%) | 0 (0.0%) |
| Computers & Mathematics | 0 (0.0%) | 0 (0.0%) |
| Architecture & Engineering | 0 (0.0%) | 0 (0.0%) |
| Life, Physical & Social Science | 0 (0.0%) | 0 (0.0%) |
| Community & Social Service | 0 (0.0%) | 0 (0.0%) |
| Education, Arts & Media | 0 (0.0%) | 0 (0.0%) |
| Legal Services & Support | 0 (0.0%) | 0 (0.0%) |
| Education Instruction & Library | 0 (0.0%) | 0 (0.0%) |
| Arts, Media & Entertainment | 0 (0.0%) | 0 (0.0%) |
| Health Diagnosing & Treating | 0 (0.0%) | 0 (0.0%) |
| Health Technologists | 0 (0.0%) | 0 (0.0%) |
| Total (Category) | 0 (0.0%) | 21 (100.0%) |
| Total (Overall) | 35 (52.2%) | 32 (47.8%) |
Services Occupations
The most common Services occupations in Searchlight are , and Cleaning & Maintenance (21 | 31.3%).
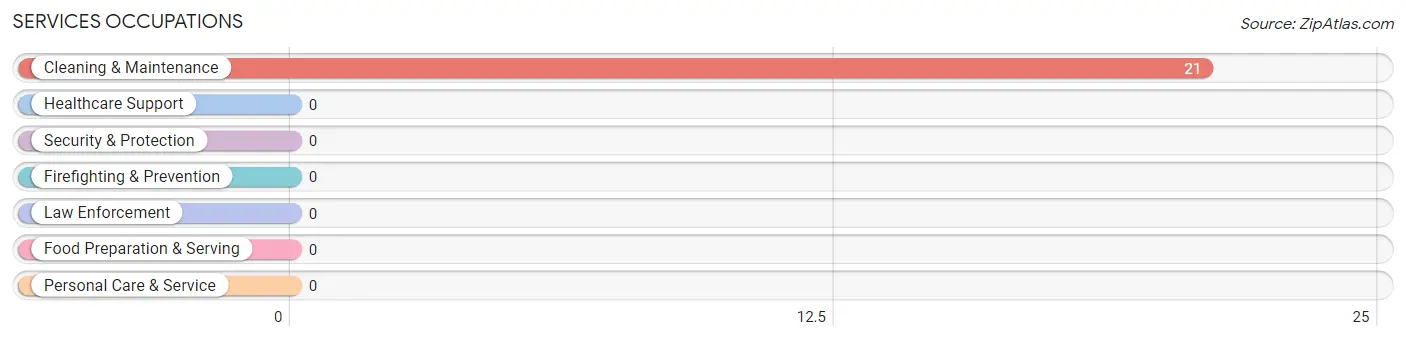
Services Occupations by Sex
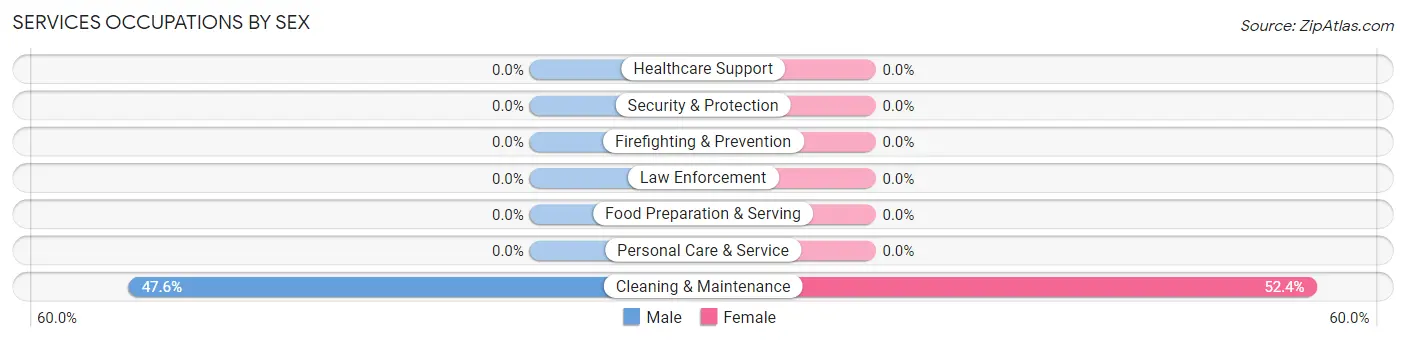
| Occupation | Male | Female |
| Healthcare Support | 0 (0.0%) | 0 (0.0%) |
| Security & Protection | 0 (0.0%) | 0 (0.0%) |
| Firefighting & Prevention | 0 (0.0%) | 0 (0.0%) |
| Law Enforcement | 0 (0.0%) | 0 (0.0%) |
| Food Preparation & Serving | 0 (0.0%) | 0 (0.0%) |
| Cleaning & Maintenance | 10 (47.6%) | 11 (52.4%) |
| Personal Care & Service | 0 (0.0%) | 0 (0.0%) |
| Total (Category) | 10 (47.6%) | 11 (52.4%) |
| Total (Overall) | 35 (52.2%) | 32 (47.8%) |
Sales and Office Occupations
The most common Sales and Office occupations in Searchlight are , and Sales & Related (11 | 16.4%).
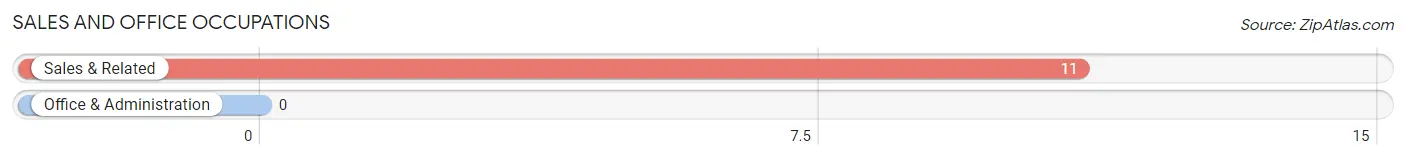
Sales and Office Occupations by Sex
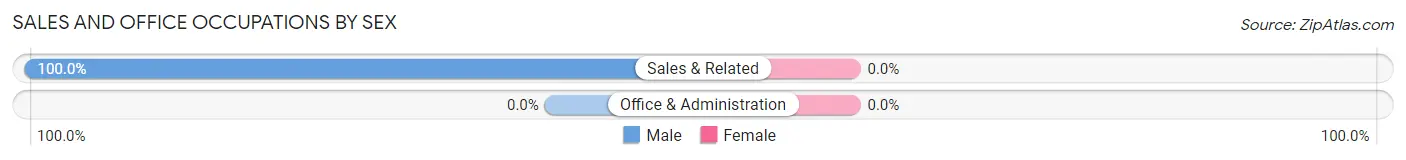
| Occupation | Male | Female |
| Sales & Related | 11 (100.0%) | 0 (0.0%) |
| Office & Administration | 0 (0.0%) | 0 (0.0%) |
| Total (Category) | 11 (100.0%) | 0 (0.0%) |
| Total (Overall) | 35 (52.2%) | 32 (47.8%) |
Natural Resources, Construction and Maintenance Occupations
Natural Resources, Construction and Maintenance Occupations by Sex
| Occupation | Male | Female |
| Farming, Fishing & Forestry | 0 (0.0%) | 0 (0.0%) |
| Construction & Extraction | 0 (0.0%) | 0 (0.0%) |
| Installation, Maintenance & Repair | 0 (0.0%) | 0 (0.0%) |
| Total (Category) | 0 (0.0%) | 0 (0.0%) |
| Total (Overall) | 35 (52.2%) | 32 (47.8%) |
Production, Transportation and Moving Occupations
The most common Production, Transportation and Moving occupations in Searchlight are , and Material Moving (14 | 20.9%).
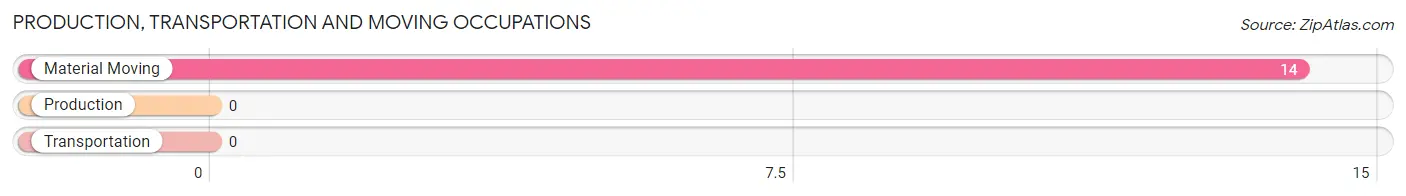
Production, Transportation and Moving Occupations by Sex
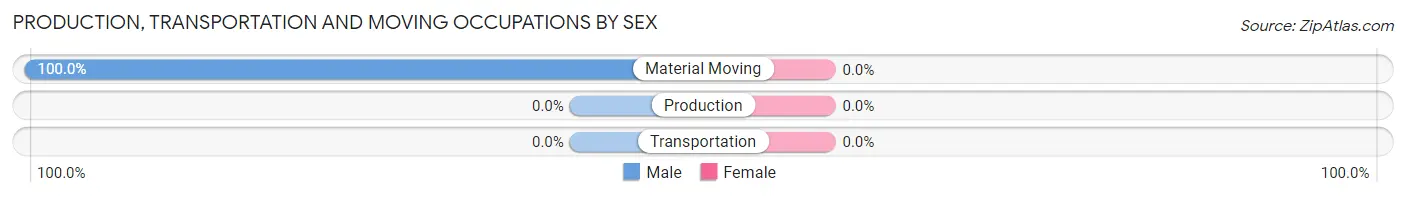
| Occupation | Male | Female |
| Production | 0 (0.0%) | 0 (0.0%) |
| Transportation | 0 (0.0%) | 0 (0.0%) |
| Material Moving | 14 (100.0%) | 0 (0.0%) |
| Total (Category) | 14 (100.0%) | 0 (0.0%) |
| Total (Overall) | 35 (52.2%) | 32 (47.8%) |
Employment Industries by Sex in Searchlight
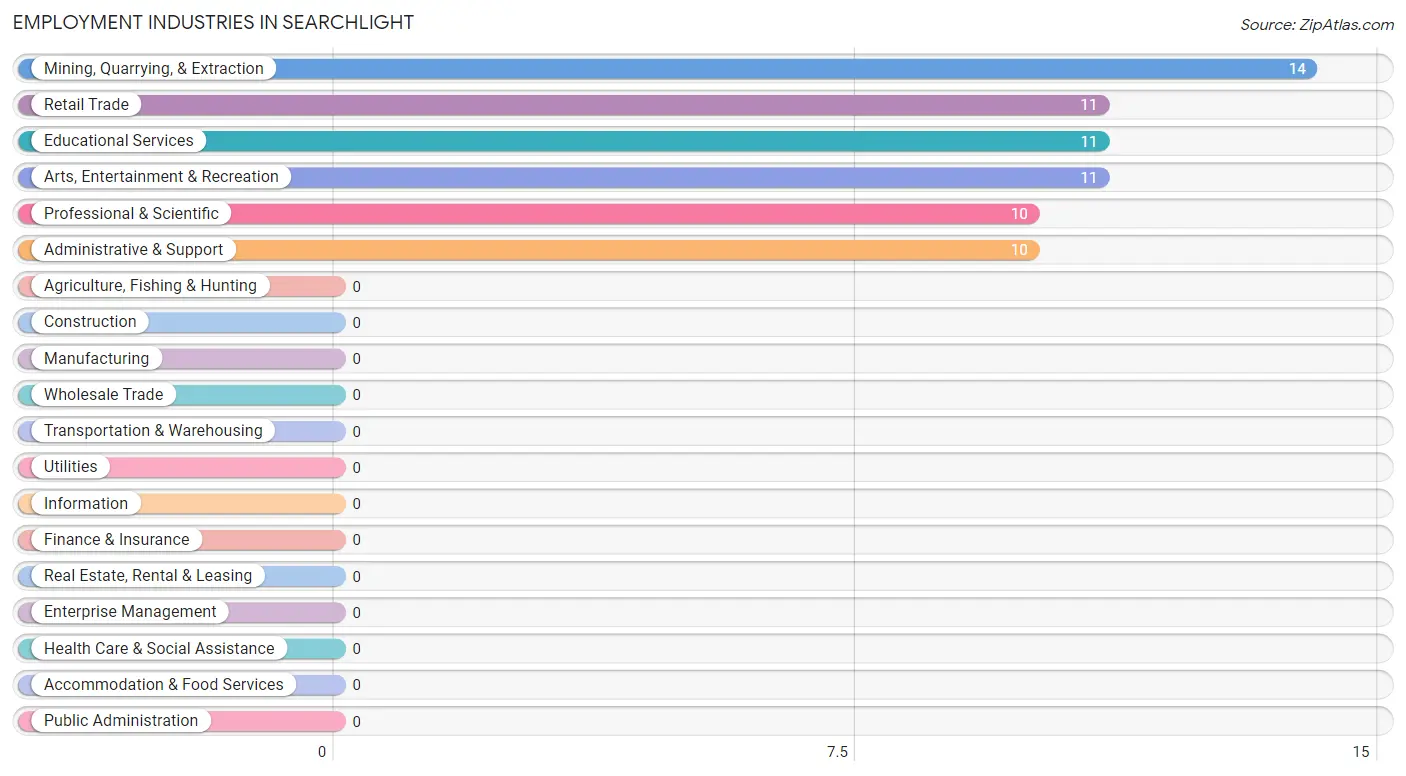
Employment Industries in Searchlight
The major employment industries in Searchlight include Mining, Quarrying, & Extraction (14 | 20.9%), Retail Trade (11 | 16.4%), Educational Services (11 | 16.4%), Arts, Entertainment & Recreation (11 | 16.4%), and Professional & Scientific (10 | 14.9%).
Employment Industries by Sex in Searchlight
The Searchlight industries that see more men than women are Mining, Quarrying, & Extraction (100.0%), Retail Trade (100.0%), and Administrative & Support (100.0%), whereas the industries that tend to have a higher number of women are Professional & Scientific (100.0%), Educational Services (100.0%), and Arts, Entertainment & Recreation (100.0%).
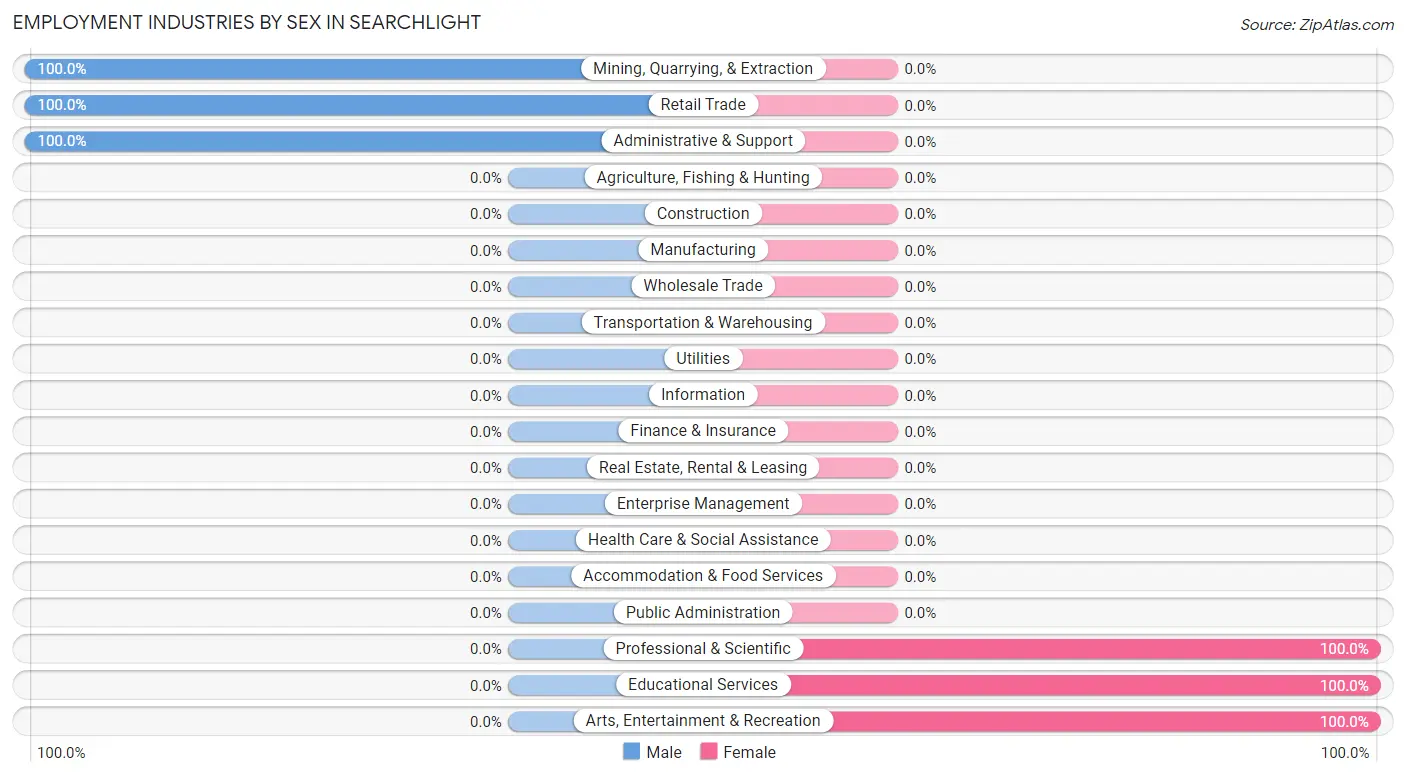
| Industry | Male | Female |
| Agriculture, Fishing & Hunting | 0 (0.0%) | 0 (0.0%) |
| Mining, Quarrying, & Extraction | 14 (100.0%) | 0 (0.0%) |
| Construction | 0 (0.0%) | 0 (0.0%) |
| Manufacturing | 0 (0.0%) | 0 (0.0%) |
| Wholesale Trade | 0 (0.0%) | 0 (0.0%) |
| Retail Trade | 11 (100.0%) | 0 (0.0%) |
| Transportation & Warehousing | 0 (0.0%) | 0 (0.0%) |
| Utilities | 0 (0.0%) | 0 (0.0%) |
| Information | 0 (0.0%) | 0 (0.0%) |
| Finance & Insurance | 0 (0.0%) | 0 (0.0%) |
| Real Estate, Rental & Leasing | 0 (0.0%) | 0 (0.0%) |
| Professional & Scientific | 0 (0.0%) | 10 (100.0%) |
| Enterprise Management | 0 (0.0%) | 0 (0.0%) |
| Administrative & Support | 10 (100.0%) | 0 (0.0%) |
| Educational Services | 0 (0.0%) | 11 (100.0%) |
| Health Care & Social Assistance | 0 (0.0%) | 0 (0.0%) |
| Arts, Entertainment & Recreation | 0 (0.0%) | 11 (100.0%) |
| Accommodation & Food Services | 0 (0.0%) | 0 (0.0%) |
| Public Administration | 0 (0.0%) | 0 (0.0%) |
| Total | 35 (52.2%) | 32 (47.8%) |
Education in Searchlight
School Enrollment in Searchlight
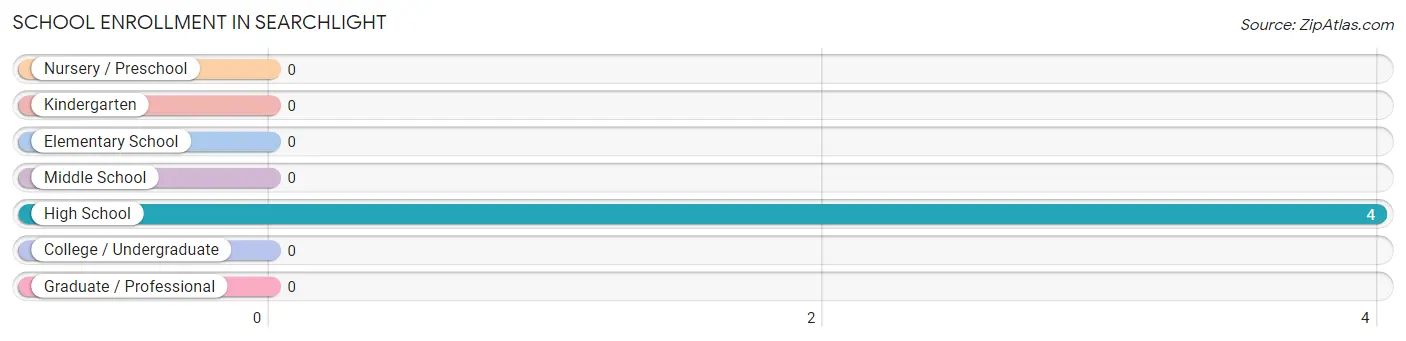
| School Level | # Students | % Students |
| Nursery / Preschool | 0 | 0.0% |
| Kindergarten | 0 | 0.0% |
| Elementary School | 0 | 0.0% |
| Middle School | 0 | 0.0% |
| High School | 4 | 100.0% |
| College / Undergraduate | 0 | 0.0% |
| Graduate / Professional | 0 | 0.0% |
| Total | 4 | 100.0% |
School Enrollment by Age by Funding Source in Searchlight
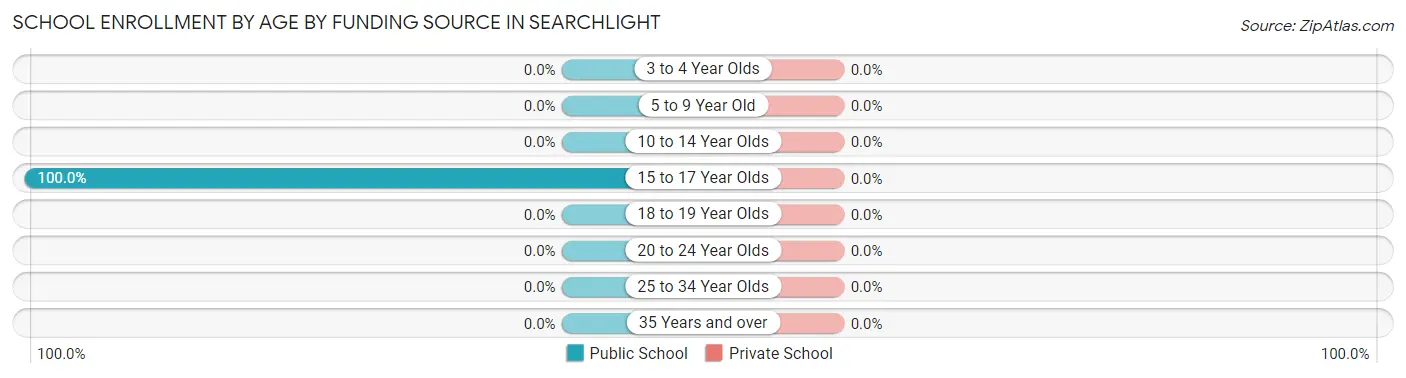
| Age Bracket | Public School | Private School |
| 3 to 4 Year Olds | 0 (0.0%) | 0 (0.0%) |
| 5 to 9 Year Old | 0 (0.0%) | 0 (0.0%) |
| 10 to 14 Year Olds | 0 (0.0%) | 0 (0.0%) |
| 15 to 17 Year Olds | 4 (100.0%) | 0 (0.0%) |
| 18 to 19 Year Olds | 0 (0.0%) | 0 (0.0%) |
| 20 to 24 Year Olds | 0 (0.0%) | 0 (0.0%) |
| 25 to 34 Year Olds | 0 (0.0%) | 0 (0.0%) |
| 35 Years and over | 0 (0.0%) | 0 (0.0%) |
| Total | 4 (100.0%) | 0 (0.0%) |
Educational Attainment by Field of Study in Searchlight
, and business (21 | 100.0%) are the most common fields of study among 21 individuals in Searchlight who have obtained a bachelor's degree or higher.
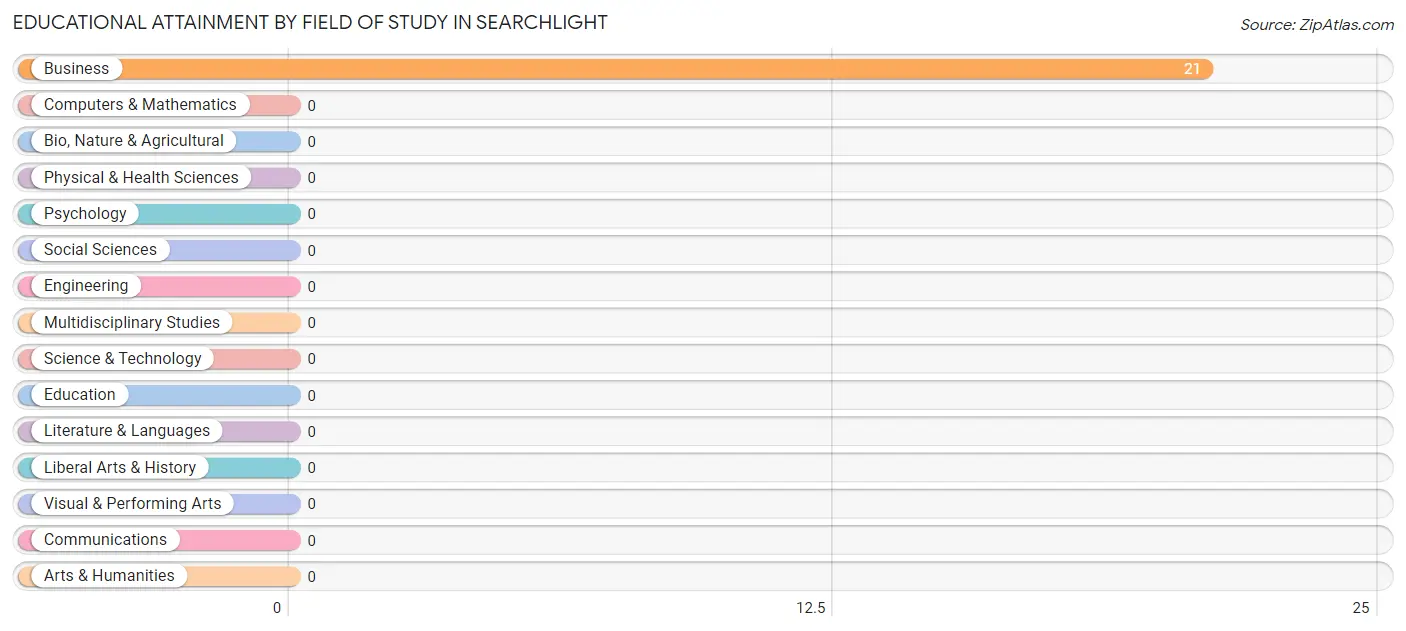
| Field of Study | # Graduates | % Graduates |
| Computers & Mathematics | 0 | 0.0% |
| Bio, Nature & Agricultural | 0 | 0.0% |
| Physical & Health Sciences | 0 | 0.0% |
| Psychology | 0 | 0.0% |
| Social Sciences | 0 | 0.0% |
| Engineering | 0 | 0.0% |
| Multidisciplinary Studies | 0 | 0.0% |
| Science & Technology | 0 | 0.0% |
| Business | 21 | 100.0% |
| Education | 0 | 0.0% |
| Literature & Languages | 0 | 0.0% |
| Liberal Arts & History | 0 | 0.0% |
| Visual & Performing Arts | 0 | 0.0% |
| Communications | 0 | 0.0% |
| Arts & Humanities | 0 | 0.0% |
| Total | 21 | 100.0% |
Transportation & Commute in Searchlight
Vehicle Availability by Sex in Searchlight
The most prevalent vehicle ownership categories in Searchlight are males with 2 vehicles (25, accounting for 71.4%) and females with 2 vehicles (21, making up 78.1%).
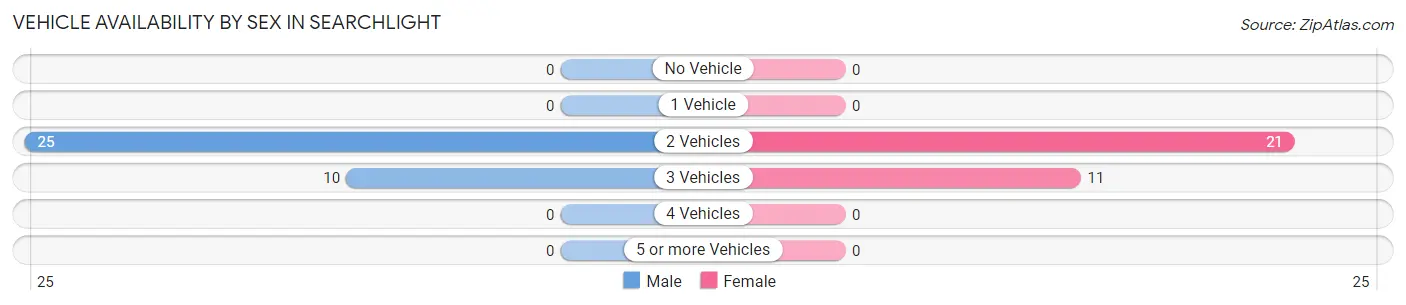
| Vehicles Available | Male | Female |
| No Vehicle | 0 (0.0%) | 0 (0.0%) |
| 1 Vehicle | 0 (0.0%) | 0 (0.0%) |
| 2 Vehicles | 25 (71.4%) | 21 (65.6%) |
| 3 Vehicles | 10 (28.6%) | 11 (34.4%) |
| 4 Vehicles | 0 (0.0%) | 0 (0.0%) |
| 5 or more Vehicles | 0 (0.0%) | 0 (0.0%) |
| Total | 35 (100.0%) | 32 (100.0%) |
Commute Time in Searchlight
The most frequently occuring commute durations in Searchlight are 45 to 59 minutes (21 commuters, 31.3%), 60 to 89 minutes (14 commuters, 20.9%), and 10 to 14 minutes (11 commuters, 16.4%).
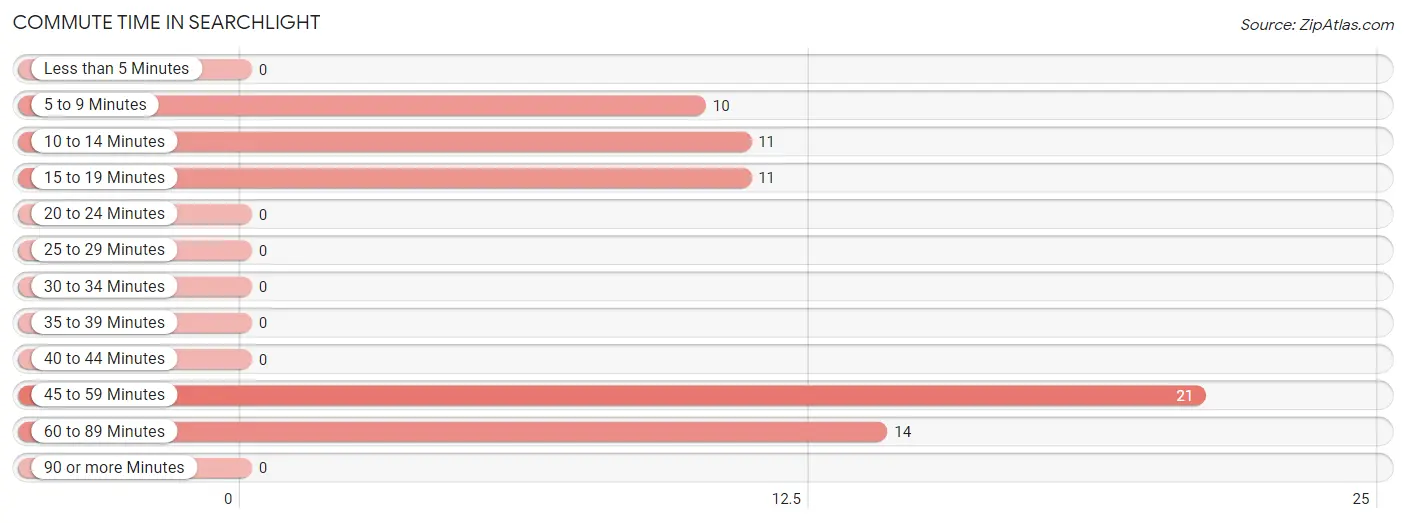
| Commute Time | # Commuters | % Commuters |
| Less than 5 Minutes | 0 | 0.0% |
| 5 to 9 Minutes | 10 | 14.9% |
| 10 to 14 Minutes | 11 | 16.4% |
| 15 to 19 Minutes | 11 | 16.4% |
| 20 to 24 Minutes | 0 | 0.0% |
| 25 to 29 Minutes | 0 | 0.0% |
| 30 to 34 Minutes | 0 | 0.0% |
| 35 to 39 Minutes | 0 | 0.0% |
| 40 to 44 Minutes | 0 | 0.0% |
| 45 to 59 Minutes | 21 | 31.3% |
| 60 to 89 Minutes | 14 | 20.9% |
| 90 or more Minutes | 0 | 0.0% |
Commute Time by Sex in Searchlight
The most common commute times in Searchlight are 60 to 89 minutes (14 commuters, 40.0%) for males and 10 to 14 minutes (11 commuters, 34.4%) for females.
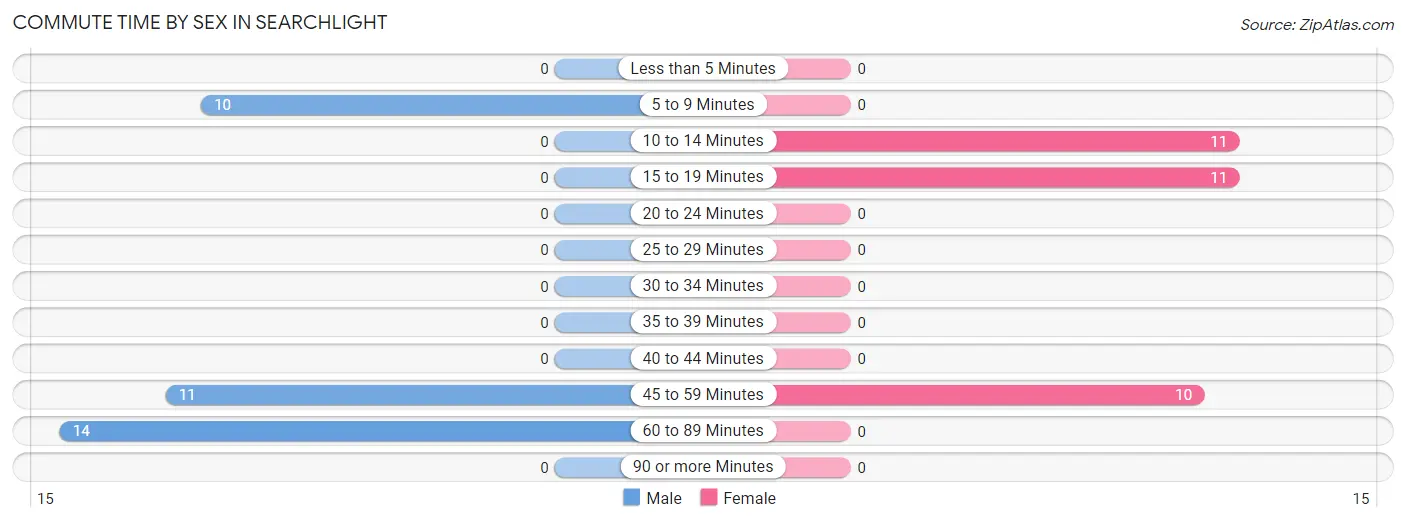
| Commute Time | Male | Female |
| Less than 5 Minutes | 0 (0.0%) | 0 (0.0%) |
| 5 to 9 Minutes | 10 (28.6%) | 0 (0.0%) |
| 10 to 14 Minutes | 0 (0.0%) | 11 (34.4%) |
| 15 to 19 Minutes | 0 (0.0%) | 11 (34.4%) |
| 20 to 24 Minutes | 0 (0.0%) | 0 (0.0%) |
| 25 to 29 Minutes | 0 (0.0%) | 0 (0.0%) |
| 30 to 34 Minutes | 0 (0.0%) | 0 (0.0%) |
| 35 to 39 Minutes | 0 (0.0%) | 0 (0.0%) |
| 40 to 44 Minutes | 0 (0.0%) | 0 (0.0%) |
| 45 to 59 Minutes | 11 (31.4%) | 10 (31.2%) |
| 60 to 89 Minutes | 14 (40.0%) | 0 (0.0%) |
| 90 or more Minutes | 0 (0.0%) | 0 (0.0%) |
Time of Departure to Work by Sex in Searchlight
The most frequent times of departure to work in Searchlight are 12:00 AM to 4:59 AM (14, 40.0%) for males and 5:00 AM to 5:29 AM (11, 34.4%) for females.
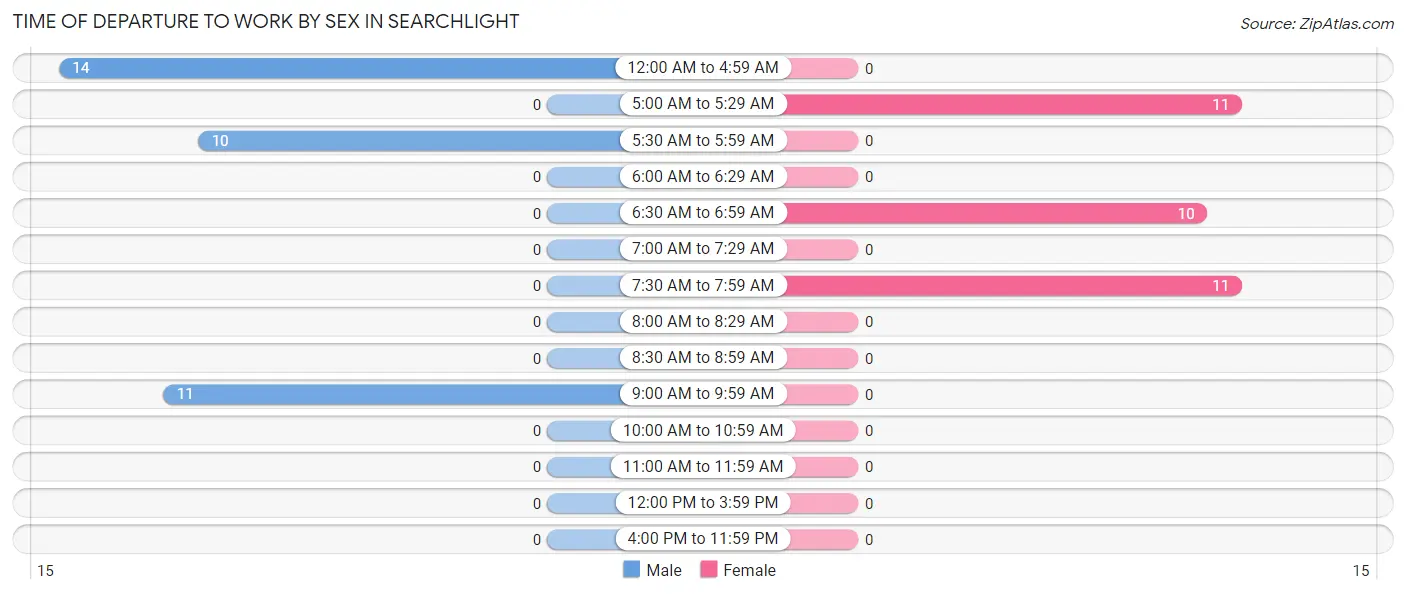
| Time of Departure | Male | Female |
| 12:00 AM to 4:59 AM | 14 (40.0%) | 0 (0.0%) |
| 5:00 AM to 5:29 AM | 0 (0.0%) | 11 (34.4%) |
| 5:30 AM to 5:59 AM | 10 (28.6%) | 0 (0.0%) |
| 6:00 AM to 6:29 AM | 0 (0.0%) | 0 (0.0%) |
| 6:30 AM to 6:59 AM | 0 (0.0%) | 10 (31.2%) |
| 7:00 AM to 7:29 AM | 0 (0.0%) | 0 (0.0%) |
| 7:30 AM to 7:59 AM | 0 (0.0%) | 11 (34.4%) |
| 8:00 AM to 8:29 AM | 0 (0.0%) | 0 (0.0%) |
| 8:30 AM to 8:59 AM | 0 (0.0%) | 0 (0.0%) |
| 9:00 AM to 9:59 AM | 11 (31.4%) | 0 (0.0%) |
| 10:00 AM to 10:59 AM | 0 (0.0%) | 0 (0.0%) |
| 11:00 AM to 11:59 AM | 0 (0.0%) | 0 (0.0%) |
| 12:00 PM to 3:59 PM | 0 (0.0%) | 0 (0.0%) |
| 4:00 PM to 11:59 PM | 0 (0.0%) | 0 (0.0%) |
| Total | 35 (100.0%) | 32 (100.0%) |
Housing Occupancy in Searchlight
Occupancy by Ownership in Searchlight
Of the total 198 dwellings in Searchlight, owner-occupied units account for 137 (69.2%), while renter-occupied units make up 61 (30.8%).
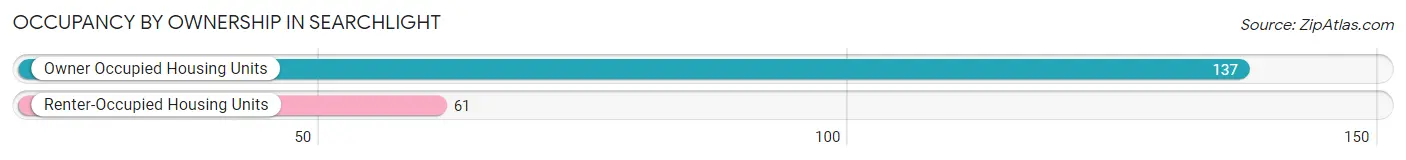
| Occupancy | # Housing Units | % Housing Units |
| Owner Occupied Housing Units | 137 | 69.2% |
| Renter-Occupied Housing Units | 61 | 30.8% |
| Total Occupied Housing Units | 198 | 100.0% |
Occupancy by Household Size in Searchlight
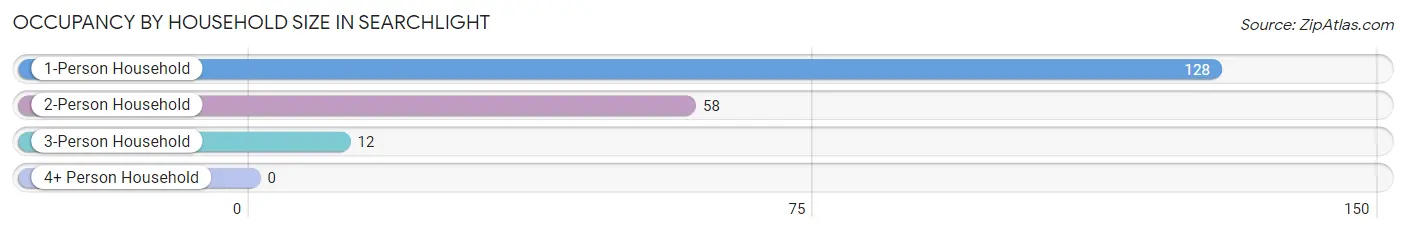
| Household Size | # Housing Units | % Housing Units |
| 1-Person Household | 128 | 64.6% |
| 2-Person Household | 58 | 29.3% |
| 3-Person Household | 12 | 6.1% |
| 4+ Person Household | 0 | 0.0% |
| Total Housing Units | 198 | 100.0% |
Occupancy by Ownership by Household Size in Searchlight
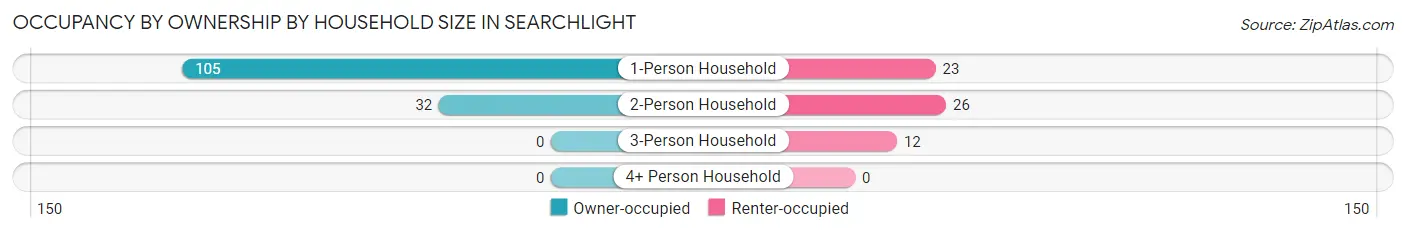
| Household Size | Owner-occupied | Renter-occupied |
| 1-Person Household | 105 (82.0%) | 23 (18.0%) |
| 2-Person Household | 32 (55.2%) | 26 (44.8%) |
| 3-Person Household | 0 (0.0%) | 12 (100.0%) |
| 4+ Person Household | 0 (0.0%) | 0 (0.0%) |
| Total Housing Units | 137 (69.2%) | 61 (30.8%) |
Occupancy by Educational Attainment in Searchlight
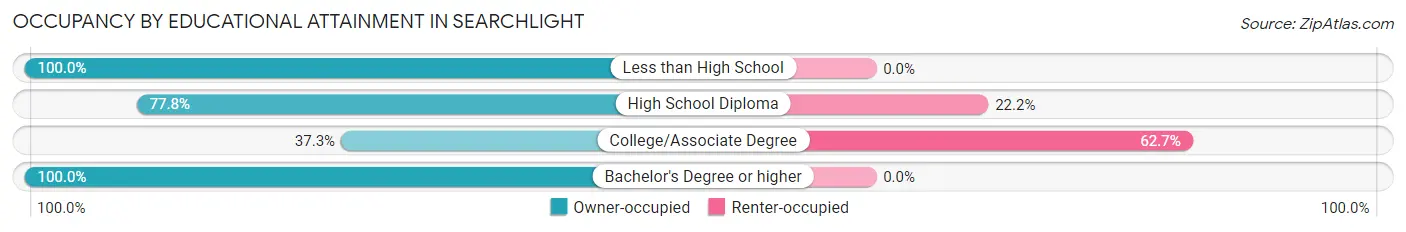
| Household Size | Owner-occupied | Renter-occupied |
| Less than High School | 10 (100.0%) | 0 (0.0%) |
| High School Diploma | 84 (77.8%) | 24 (22.2%) |
| College/Associate Degree | 22 (37.3%) | 37 (62.7%) |
| Bachelor's Degree or higher | 21 (100.0%) | 0 (0.0%) |
Occupancy by Age of Householder in Searchlight
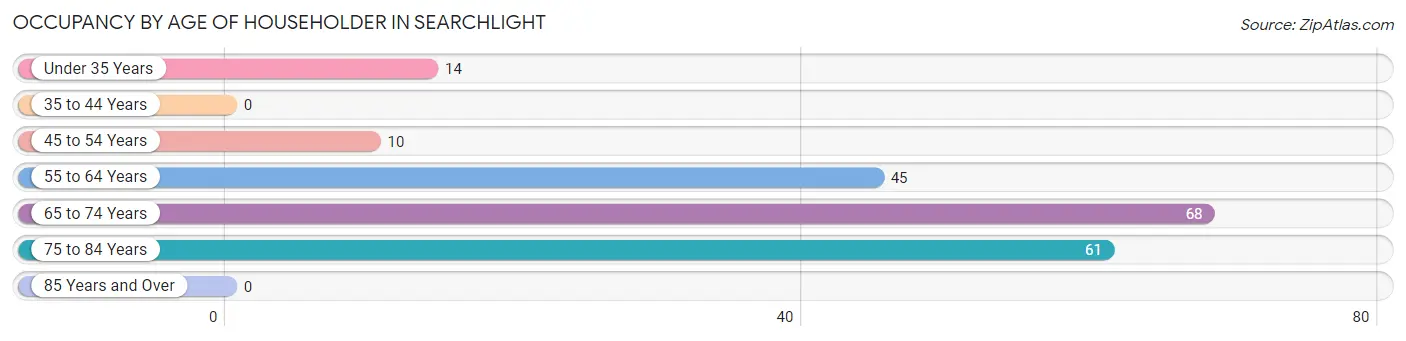
| Age Bracket | # Households | % Households |
| Under 35 Years | 14 | 7.1% |
| 35 to 44 Years | 0 | 0.0% |
| 45 to 54 Years | 10 | 5.1% |
| 55 to 64 Years | 45 | 22.7% |
| 65 to 74 Years | 68 | 34.3% |
| 75 to 84 Years | 61 | 30.8% |
| 85 Years and Over | 0 | 0.0% |
| Total | 198 | 100.0% |
Housing Finances in Searchlight
Median Income by Occupancy in Searchlight
| Occupancy Type | # Households | Median Income |
| Owner-Occupied | 137 (69.2%) | $0 |
| Renter-Occupied | 61 (30.8%) | $0 |
| Average | 198 (100.0%) | $0 |
Occupancy by Householder Income Bracket in Searchlight
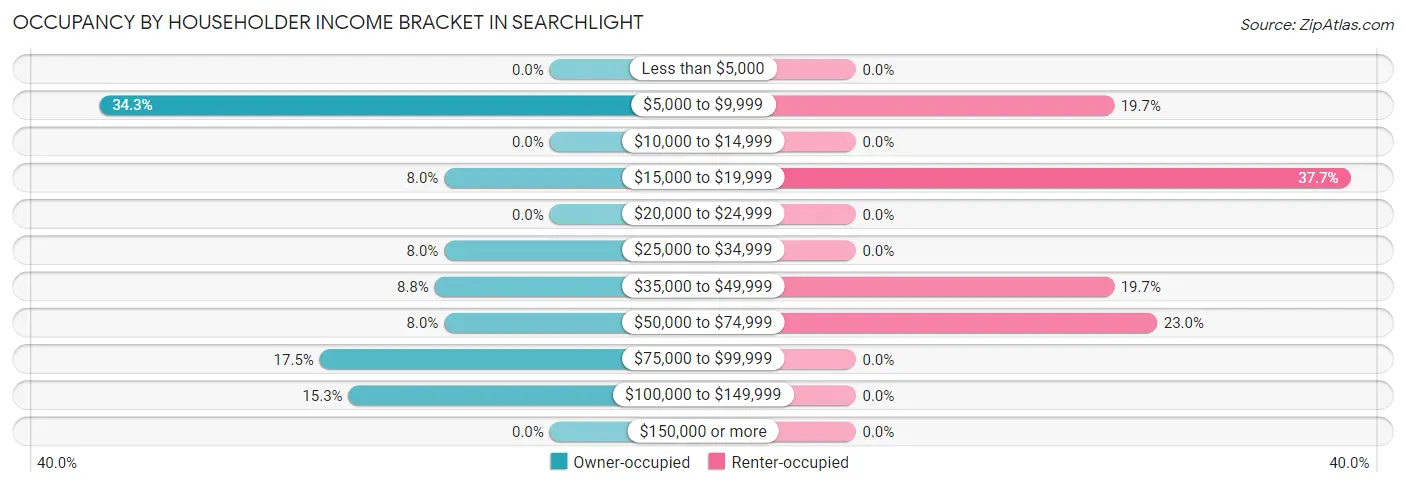
| Income Bracket | Owner-occupied | Renter-occupied |
| Less than $5,000 | 0 (0.0%) | 0 (0.0%) |
| $5,000 to $9,999 | 47 (34.3%) | 12 (19.7%) |
| $10,000 to $14,999 | 0 (0.0%) | 0 (0.0%) |
| $15,000 to $19,999 | 11 (8.0%) | 23 (37.7%) |
| $20,000 to $24,999 | 0 (0.0%) | 0 (0.0%) |
| $25,000 to $34,999 | 11 (8.0%) | 0 (0.0%) |
| $35,000 to $49,999 | 12 (8.8%) | 12 (19.7%) |
| $50,000 to $74,999 | 11 (8.0%) | 14 (23.0%) |
| $75,000 to $99,999 | 24 (17.5%) | 0 (0.0%) |
| $100,000 to $149,999 | 21 (15.3%) | 0 (0.0%) |
| $150,000 or more | 0 (0.0%) | 0 (0.0%) |
| Total | 137 (100.0%) | 61 (100.0%) |
Monthly Housing Cost Tiers in Searchlight
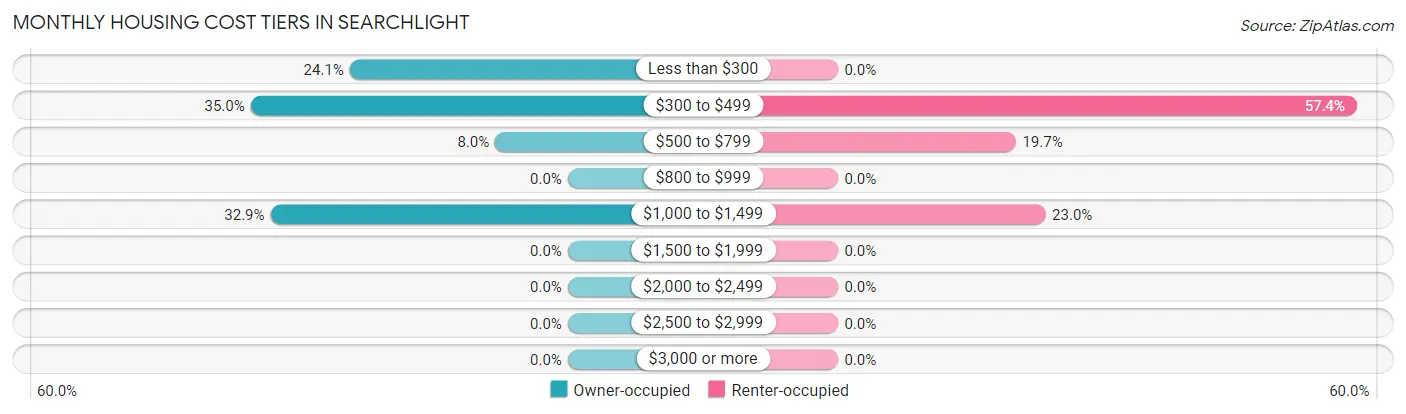
| Monthly Cost | Owner-occupied | Renter-occupied |
| Less than $300 | 33 (24.1%) | 0 (0.0%) |
| $300 to $499 | 48 (35.0%) | 35 (57.4%) |
| $500 to $799 | 11 (8.0%) | 12 (19.7%) |
| $800 to $999 | 0 (0.0%) | 0 (0.0%) |
| $1,000 to $1,499 | 45 (32.9%) | 14 (23.0%) |
| $1,500 to $1,999 | 0 (0.0%) | 0 (0.0%) |
| $2,000 to $2,499 | 0 (0.0%) | 0 (0.0%) |
| $2,500 to $2,999 | 0 (0.0%) | 0 (0.0%) |
| $3,000 or more | 0 (0.0%) | 0 (0.0%) |
| Total | 137 (100.0%) | 61 (100.0%) |
Physical Housing Characteristics in Searchlight
Housing Structures in Searchlight
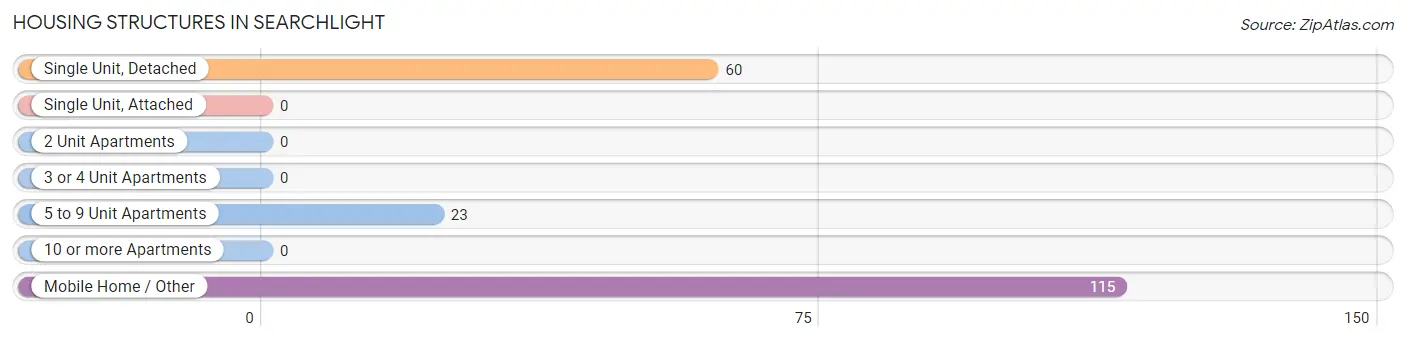
| Structure Type | # Housing Units | % Housing Units |
| Single Unit, Detached | 60 | 30.3% |
| Single Unit, Attached | 0 | 0.0% |
| 2 Unit Apartments | 0 | 0.0% |
| 3 or 4 Unit Apartments | 0 | 0.0% |
| 5 to 9 Unit Apartments | 23 | 11.6% |
| 10 or more Apartments | 0 | 0.0% |
| Mobile Home / Other | 115 | 58.1% |
| Total | 198 | 100.0% |
Housing Structures by Occupancy in Searchlight
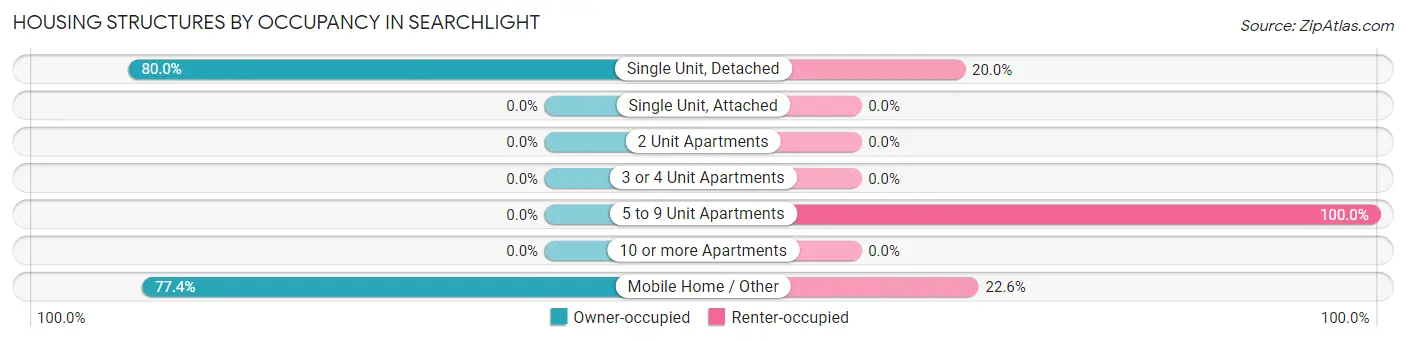
| Structure Type | Owner-occupied | Renter-occupied |
| Single Unit, Detached | 48 (80.0%) | 12 (20.0%) |
| Single Unit, Attached | 0 (0.0%) | 0 (0.0%) |
| 2 Unit Apartments | 0 (0.0%) | 0 (0.0%) |
| 3 or 4 Unit Apartments | 0 (0.0%) | 0 (0.0%) |
| 5 to 9 Unit Apartments | 0 (0.0%) | 23 (100.0%) |
| 10 or more Apartments | 0 (0.0%) | 0 (0.0%) |
| Mobile Home / Other | 89 (77.4%) | 26 (22.6%) |
| Total | 137 (69.2%) | 61 (30.8%) |
Housing Structures by Number of Rooms in Searchlight
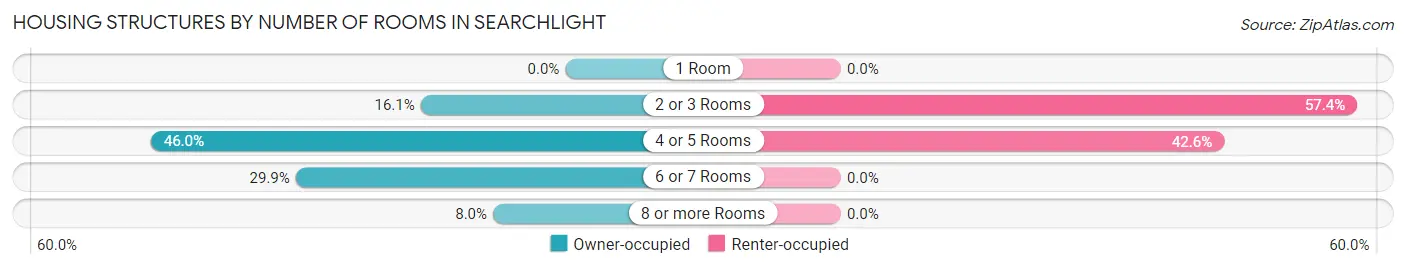
| Number of Rooms | Owner-occupied | Renter-occupied |
| 1 Room | 0 (0.0%) | 0 (0.0%) |
| 2 or 3 Rooms | 22 (16.1%) | 35 (57.4%) |
| 4 or 5 Rooms | 63 (46.0%) | 26 (42.6%) |
| 6 or 7 Rooms | 41 (29.9%) | 0 (0.0%) |
| 8 or more Rooms | 11 (8.0%) | 0 (0.0%) |
| Total | 137 (100.0%) | 61 (100.0%) |
Housing Structure by Heating Type in Searchlight
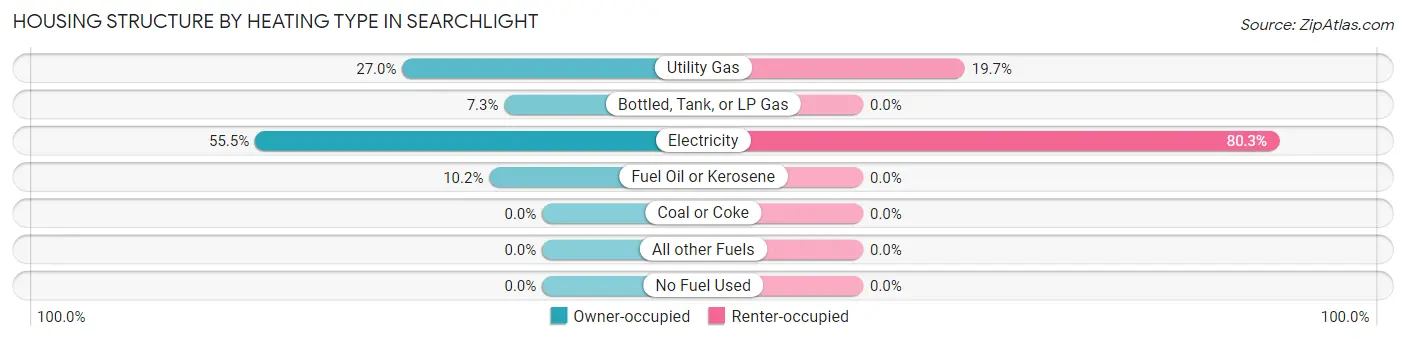
| Heating Type | Owner-occupied | Renter-occupied |
| Utility Gas | 37 (27.0%) | 12 (19.7%) |
| Bottled, Tank, or LP Gas | 10 (7.3%) | 0 (0.0%) |
| Electricity | 76 (55.5%) | 49 (80.3%) |
| Fuel Oil or Kerosene | 14 (10.2%) | 0 (0.0%) |
| Coal or Coke | 0 (0.0%) | 0 (0.0%) |
| All other Fuels | 0 (0.0%) | 0 (0.0%) |
| No Fuel Used | 0 (0.0%) | 0 (0.0%) |
| Total | 137 (100.0%) | 61 (100.0%) |
Household Vehicle Usage in Searchlight
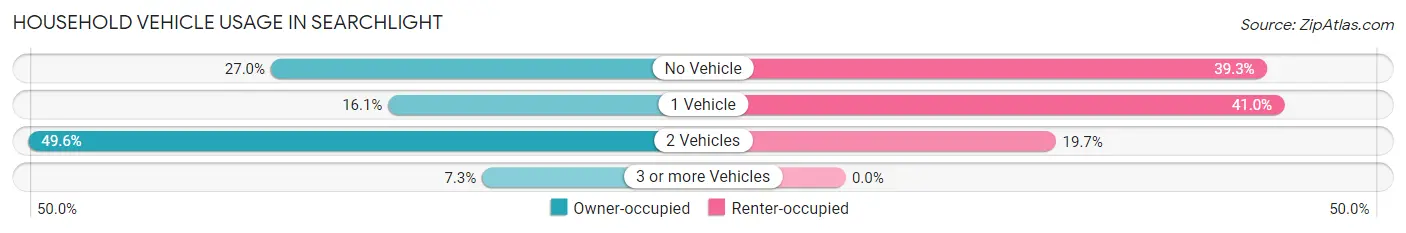
| Vehicles per Household | Owner-occupied | Renter-occupied |
| No Vehicle | 37 (27.0%) | 24 (39.3%) |
| 1 Vehicle | 22 (16.1%) | 25 (41.0%) |
| 2 Vehicles | 68 (49.6%) | 12 (19.7%) |
| 3 or more Vehicles | 10 (7.3%) | 0 (0.0%) |
| Total | 137 (100.0%) | 61 (100.0%) |
Real Estate & Mortgages in Searchlight
Real Estate and Mortgage Overview in Searchlight
| Characteristic | Without Mortgage | With Mortgage |
| Housing Units | 102 | 35 |
| Median Property Value | $104,700 | $193,200 |
| Median Household Income | - | - |
| Monthly Housing Costs | $369 | $0 |
| Real Estate Taxes | $700 | $0 |
Property Value by Mortgage Status in Searchlight
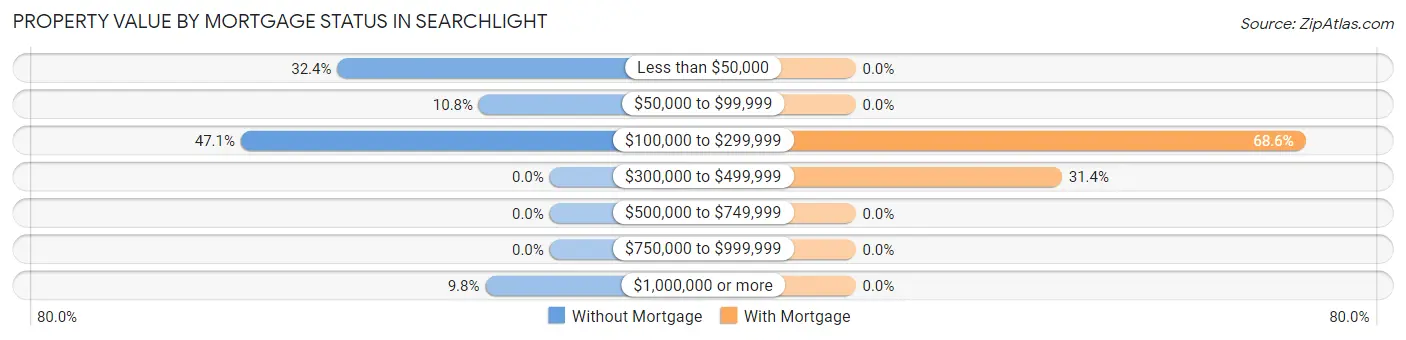
| Property Value | Without Mortgage | With Mortgage |
| Less than $50,000 | 33 (32.4%) | 0 (0.0%) |
| $50,000 to $99,999 | 11 (10.8%) | 0 (0.0%) |
| $100,000 to $299,999 | 48 (47.1%) | 24 (68.6%) |
| $300,000 to $499,999 | 0 (0.0%) | 11 (31.4%) |
| $500,000 to $749,999 | 0 (0.0%) | 0 (0.0%) |
| $750,000 to $999,999 | 0 (0.0%) | 0 (0.0%) |
| $1,000,000 or more | 10 (9.8%) | 0 (0.0%) |
| Total | 102 (100.0%) | 35 (100.0%) |
Household Income by Mortgage Status in Searchlight
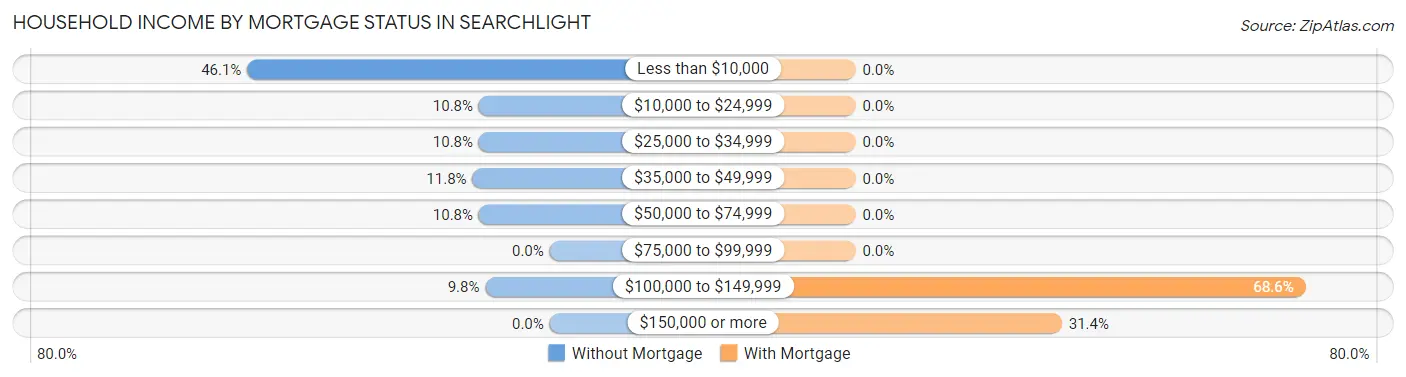
| Household Income | Without Mortgage | With Mortgage |
| Less than $10,000 | 47 (46.1%) | 0 (0.0%) |
| $10,000 to $24,999 | 11 (10.8%) | 0 (0.0%) |
| $25,000 to $34,999 | 11 (10.8%) | 0 (0.0%) |
| $35,000 to $49,999 | 12 (11.8%) | 0 (0.0%) |
| $50,000 to $74,999 | 11 (10.8%) | 0 (0.0%) |
| $75,000 to $99,999 | 0 (0.0%) | 0 (0.0%) |
| $100,000 to $149,999 | 10 (9.8%) | 24 (68.6%) |
| $150,000 or more | 0 (0.0%) | 11 (31.4%) |
| Total | 102 (100.0%) | 35 (100.0%) |
Property Value to Household Income Ratio in Searchlight
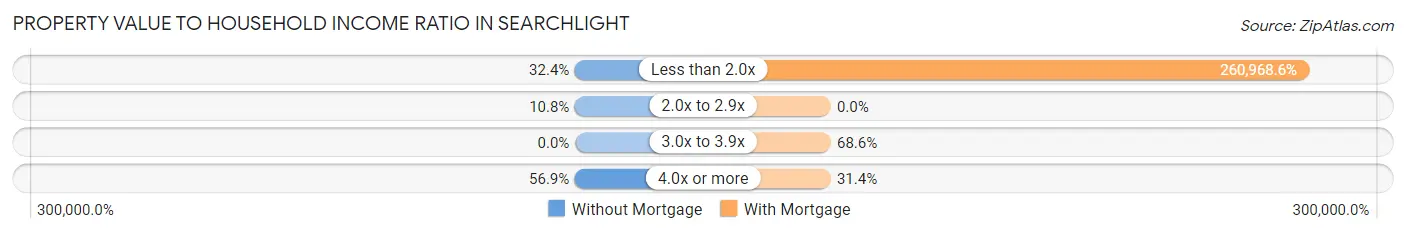
| Value-to-Income Ratio | Without Mortgage | With Mortgage |
| Less than 2.0x | 33 (32.4%) | 91,339 (260,968.6%) |
| 2.0x to 2.9x | 11 (10.8%) | 0 (0.0%) |
| 3.0x to 3.9x | 0 (0.0%) | 24 (68.6%) |
| 4.0x or more | 58 (56.9%) | 11 (31.4%) |
| Total | 102 (100.0%) | 35 (100.0%) |
Real Estate Taxes by Mortgage Status in Searchlight
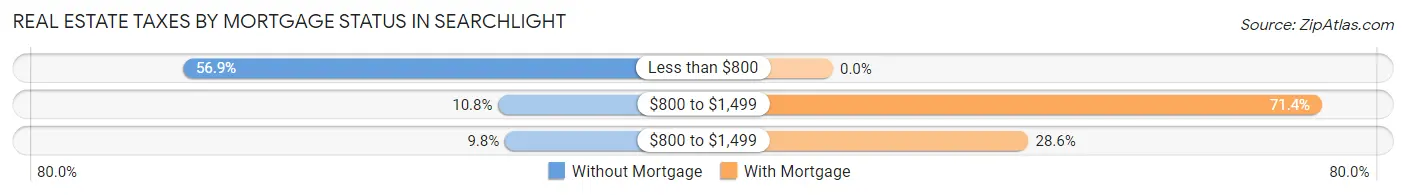
| Property Taxes | Without Mortgage | With Mortgage |
| Less than $800 | 58 (56.9%) | 0 (0.0%) |
| $800 to $1,499 | 11 (10.8%) | 25 (71.4%) |
| $800 to $1,499 | 10 (9.8%) | 10 (28.6%) |
| Total | 102 (100.0%) | 35 (100.0%) |
Health & Disability in Searchlight
Health Insurance Coverage by Age in Searchlight
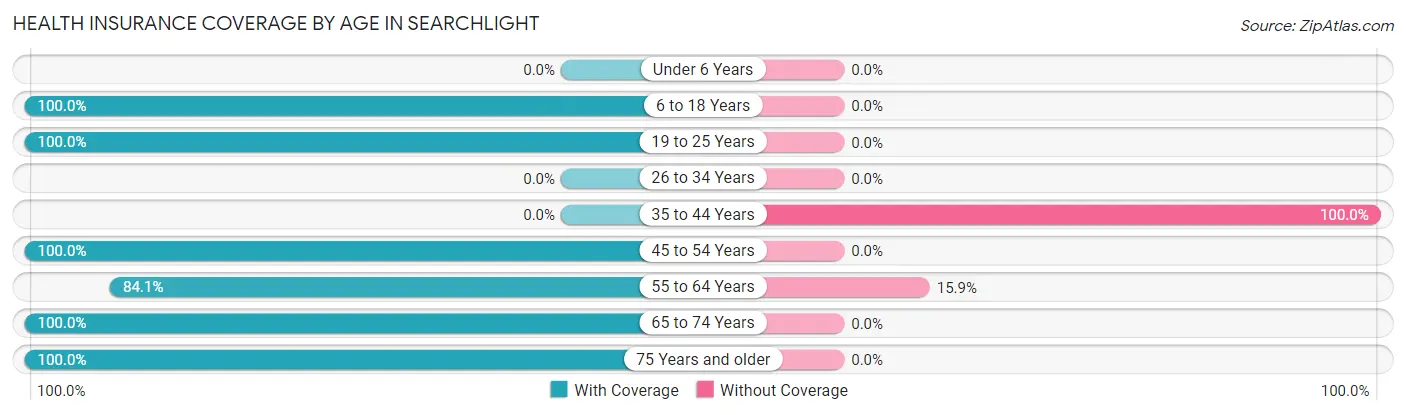
| Age Bracket | With Coverage | Without Coverage |
| Under 6 Years | 0 (0.0%) | 0 (0.0%) |
| 6 to 18 Years | 4 (100.0%) | 0 (0.0%) |
| 19 to 25 Years | 14 (100.0%) | 0 (0.0%) |
| 26 to 34 Years | 0 (0.0%) | 0 (0.0%) |
| 35 to 44 Years | 0 (0.0%) | 11 (100.0%) |
| 45 to 54 Years | 27 (100.0%) | 0 (0.0%) |
| 55 to 64 Years | 58 (84.1%) | 11 (15.9%) |
| 65 to 74 Years | 81 (100.0%) | 0 (0.0%) |
| 75 Years and older | 72 (100.0%) | 0 (0.0%) |
| Total | 256 (92.1%) | 22 (7.9%) |
Health Insurance Coverage by Citizenship Status in Searchlight
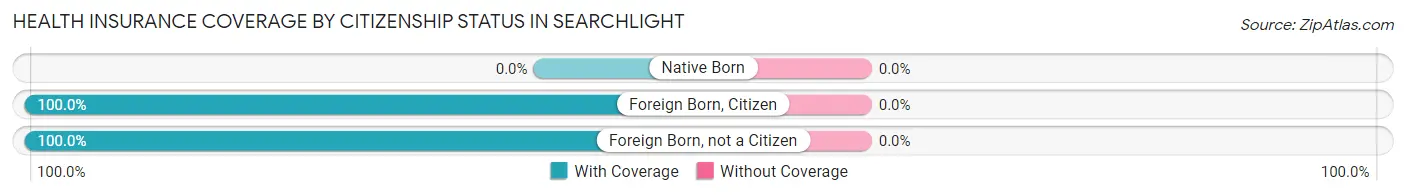
| Citizenship Status | With Coverage | Without Coverage |
| Native Born | 0 (0.0%) | 0 (0.0%) |
| Foreign Born, Citizen | 4 (100.0%) | 0 (0.0%) |
| Foreign Born, not a Citizen | 14 (100.0%) | 0 (0.0%) |
Health Insurance Coverage by Household Income in Searchlight
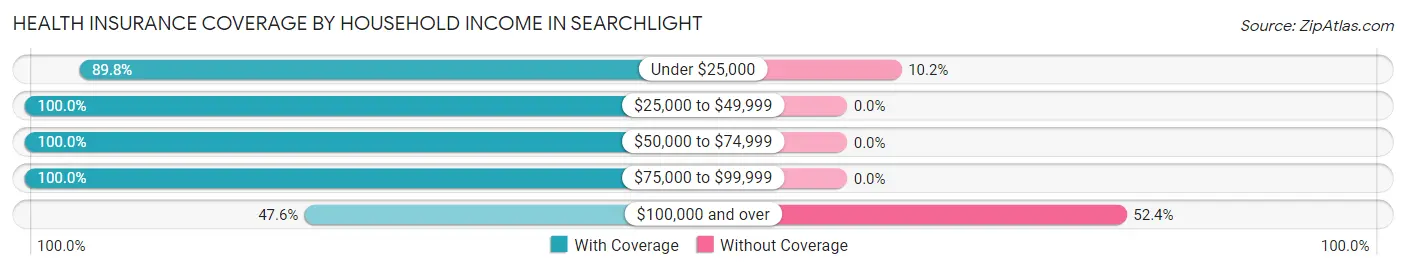
| Household Income | With Coverage | Without Coverage |
| Under $25,000 | 97 (89.8%) | 11 (10.2%) |
| $25,000 to $49,999 | 76 (100.0%) | 0 (0.0%) |
| $50,000 to $74,999 | 38 (100.0%) | 0 (0.0%) |
| $75,000 to $99,999 | 35 (100.0%) | 0 (0.0%) |
| $100,000 and over | 10 (47.6%) | 11 (52.4%) |
Public vs Private Health Insurance Coverage by Age in Searchlight
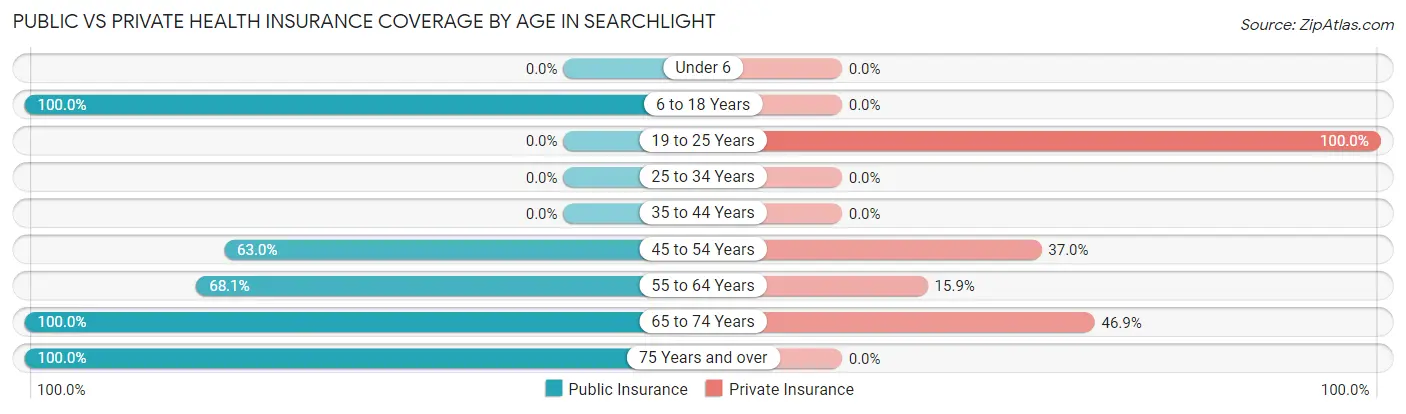
| Age Bracket | Public Insurance | Private Insurance |
| Under 6 | 0 (0.0%) | 0 (0.0%) |
| 6 to 18 Years | 4 (100.0%) | 0 (0.0%) |
| 19 to 25 Years | 0 (0.0%) | 14 (100.0%) |
| 25 to 34 Years | 0 (0.0%) | 0 (0.0%) |
| 35 to 44 Years | 0 (0.0%) | 0 (0.0%) |
| 45 to 54 Years | 17 (63.0%) | 10 (37.0%) |
| 55 to 64 Years | 47 (68.1%) | 11 (15.9%) |
| 65 to 74 Years | 81 (100.0%) | 38 (46.9%) |
| 75 Years and over | 72 (100.0%) | 0 (0.0%) |
| Total | 221 (79.5%) | 73 (26.3%) |
Disability Status by Sex by Age in Searchlight
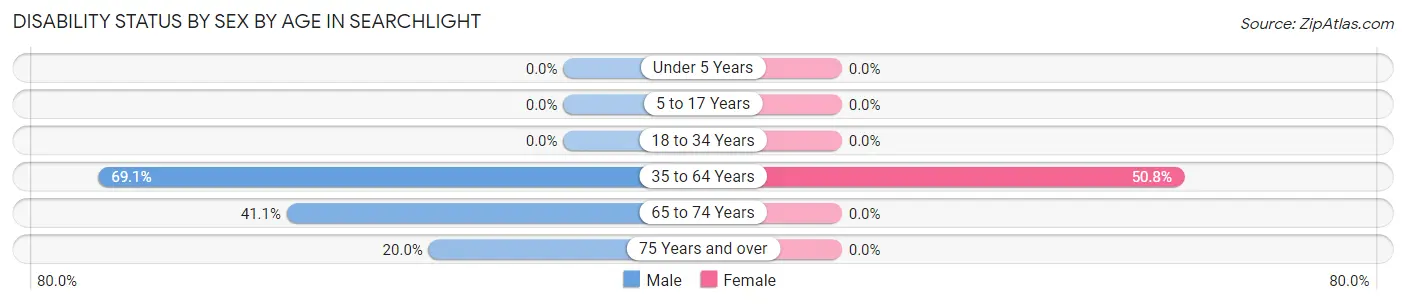
| Age Bracket | Male | Female |
| Under 5 Years | 0 (0.0%) | 0 (0.0%) |
| 5 to 17 Years | 0 (0.0%) | 0 (0.0%) |
| 18 to 34 Years | 0 (0.0%) | 0 (0.0%) |
| 35 to 64 Years | 29 (69.1%) | 33 (50.8%) |
| 65 to 74 Years | 23 (41.1%) | 0 (0.0%) |
| 75 Years and over | 12 (20.0%) | 0 (0.0%) |
Disability Class by Sex by Age in Searchlight
Disability Class: Hearing Difficulty
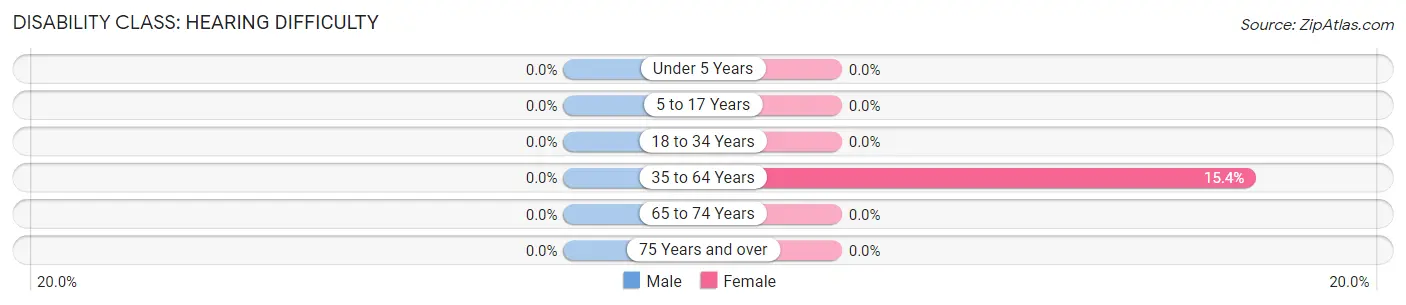
| Age Bracket | Male | Female |
| Under 5 Years | 0 (0.0%) | 0 (0.0%) |
| 5 to 17 Years | 0 (0.0%) | 0 (0.0%) |
| 18 to 34 Years | 0 (0.0%) | 0 (0.0%) |
| 35 to 64 Years | 0 (0.0%) | 10 (15.4%) |
| 65 to 74 Years | 0 (0.0%) | 0 (0.0%) |
| 75 Years and over | 0 (0.0%) | 0 (0.0%) |
Disability Class: Vision Difficulty
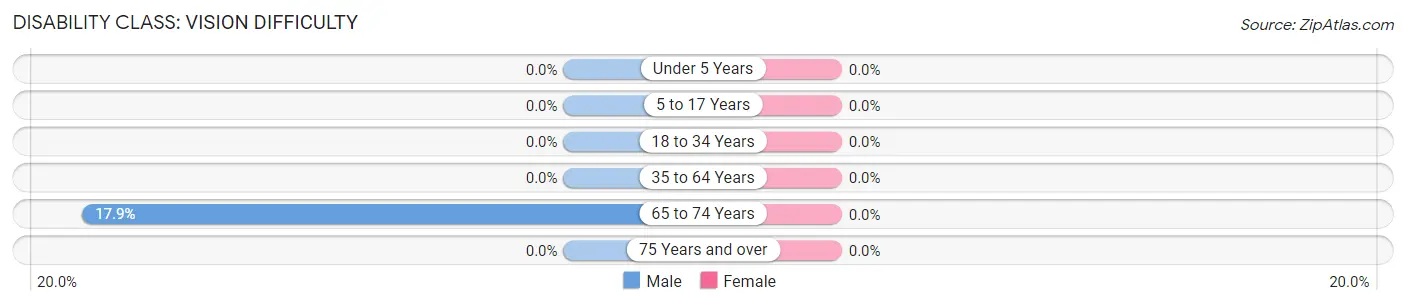
| Age Bracket | Male | Female |
| Under 5 Years | 0 (0.0%) | 0 (0.0%) |
| 5 to 17 Years | 0 (0.0%) | 0 (0.0%) |
| 18 to 34 Years | 0 (0.0%) | 0 (0.0%) |
| 35 to 64 Years | 0 (0.0%) | 0 (0.0%) |
| 65 to 74 Years | 10 (17.9%) | 0 (0.0%) |
| 75 Years and over | 0 (0.0%) | 0 (0.0%) |
Disability Class: Cognitive Difficulty
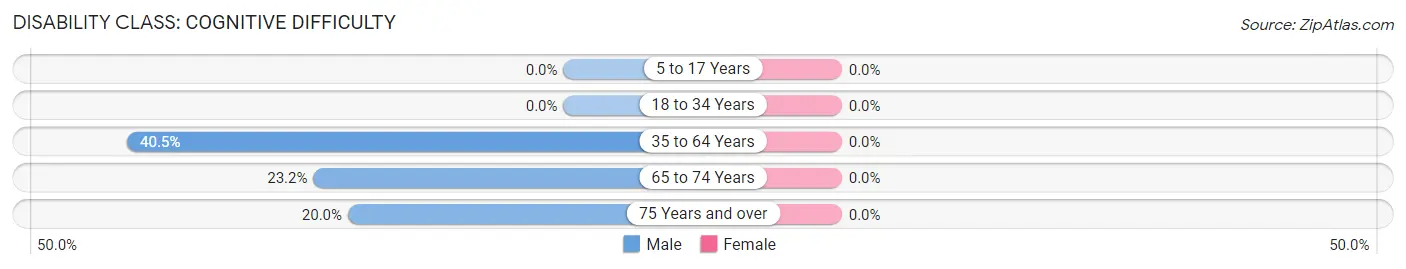
| Age Bracket | Male | Female |
| 5 to 17 Years | 0 (0.0%) | 0 (0.0%) |
| 18 to 34 Years | 0 (0.0%) | 0 (0.0%) |
| 35 to 64 Years | 17 (40.5%) | 0 (0.0%) |
| 65 to 74 Years | 13 (23.2%) | 0 (0.0%) |
| 75 Years and over | 12 (20.0%) | 0 (0.0%) |
Disability Class: Ambulatory Difficulty
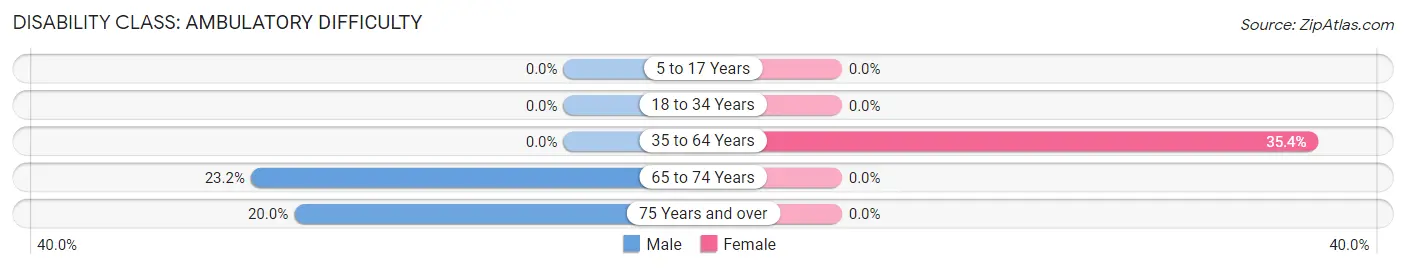
| Age Bracket | Male | Female |
| 5 to 17 Years | 0 (0.0%) | 0 (0.0%) |
| 18 to 34 Years | 0 (0.0%) | 0 (0.0%) |
| 35 to 64 Years | 0 (0.0%) | 23 (35.4%) |
| 65 to 74 Years | 13 (23.2%) | 0 (0.0%) |
| 75 Years and over | 12 (20.0%) | 0 (0.0%) |
Disability Class: Self-Care Difficulty
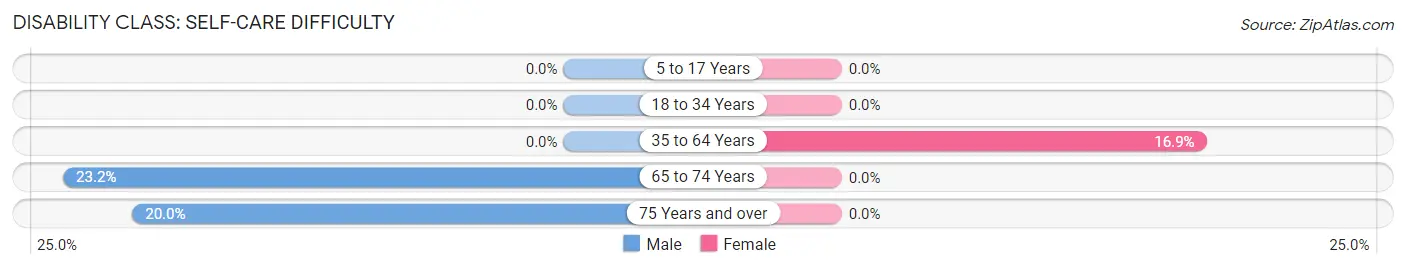
| Age Bracket | Male | Female |
| 5 to 17 Years | 0 (0.0%) | 0 (0.0%) |
| 18 to 34 Years | 0 (0.0%) | 0 (0.0%) |
| 35 to 64 Years | 0 (0.0%) | 11 (16.9%) |
| 65 to 74 Years | 13 (23.2%) | 0 (0.0%) |
| 75 Years and over | 12 (20.0%) | 0 (0.0%) |
Technology Access in Searchlight
Computing Device Access in Searchlight
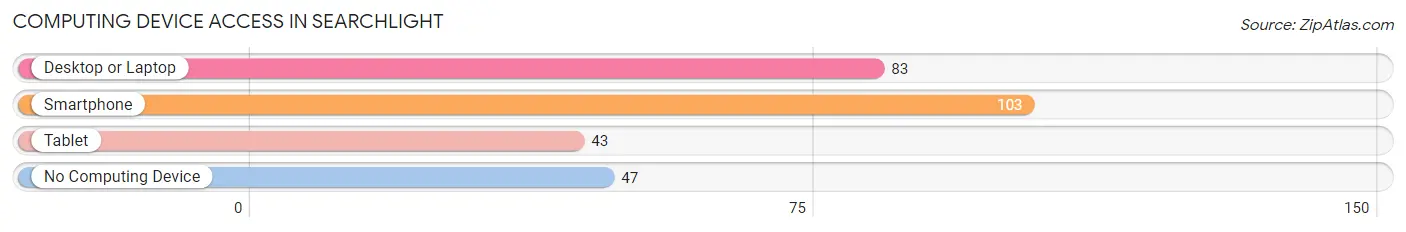
| Device Type | # Households | % Households |
| Desktop or Laptop | 83 | 41.9% |
| Smartphone | 103 | 52.0% |
| Tablet | 43 | 21.7% |
| No Computing Device | 47 | 23.7% |
| Total | 198 | 100.0% |
Internet Access in Searchlight
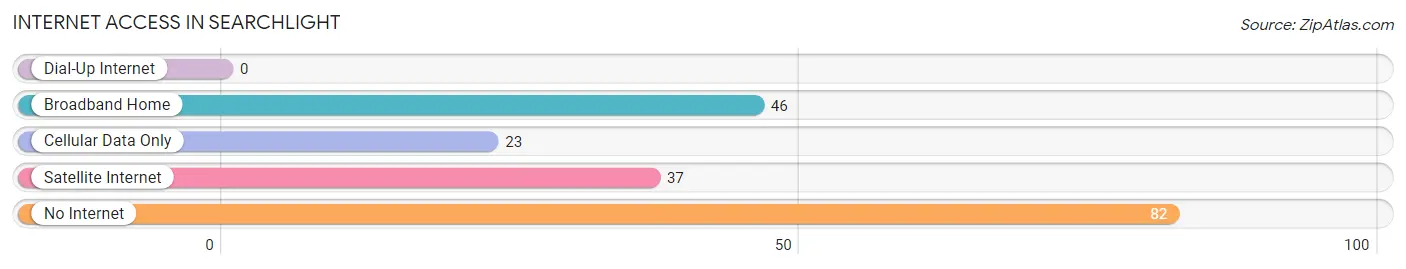
| Internet Type | # Households | % Households |
| Dial-Up Internet | 0 | 0.0% |
| Broadband Home | 46 | 23.2% |
| Cellular Data Only | 23 | 11.6% |
| Satellite Internet | 37 | 18.7% |
| No Internet | 82 | 41.4% |
| Total | 198 | 100.0% |
Searchlight Summary
Searchlight, Nevada is a small unincorporated town located in Clark County, Nevada. It is situated in the Mojave Desert, approximately 60 miles south of Las Vegas. The town was founded in 1901 by George F. Colton and named after the nearby Searchlight Mine. The town has a population of approximately 545 people, as of the 2010 census.
History
Searchlight was founded in 1901 by George F. Colton, who named the town after the nearby Searchlight Mine. The mine was discovered in 1897 by a prospector named Frank "Shorty" Harris. The mine was a major producer of gold and silver, and the town quickly grew to a population of over 1,000 people.
The town was a popular stop for travelers on the Arrowhead Trail, a major route between Los Angeles and Salt Lake City. The town also had a railroad station, which was used to transport ore from the mine.
In the 1920s, the town began to decline as the mine's production decreased. The town's population dropped to just over 200 people by the 1950s.
Geography
Searchlight is located in Clark County, Nevada, approximately 60 miles south of Las Vegas. The town is situated in the Mojave Desert, at an elevation of 2,890 feet. The town is surrounded by the McCullough Mountains to the east and the Newberry Mountains to the west.
The town is located on U.S. Route 95, which runs north-south through the town. The town is also served by a small airstrip, which is used for recreational flying.
Economy
The economy of Searchlight is largely based on tourism. The town is a popular destination for visitors to the nearby Lake Mead National Recreation Area. The town also has a few small businesses, including a gas station, a convenience store, and a few restaurants.
The town is also home to the Searchlight Historic District, which is listed on the National Register of Historic Places. The district includes several historic buildings, including the Searchlight Hotel, the Searchlight Post Office, and the Searchlight School.
Demographics
As of the 2010 census, the population of Searchlight was 545 people. The racial makeup of the town was 94.2% White, 0.2% African American, 0.7% Native American, 0.2% Asian, 0.2% Pacific Islander, 2.2% from other races, and 2.5% from two or more races. Hispanic or Latino of any race were 5.3% of the population.
The median household income in Searchlight was $31,250, and the median family income was $35,000. The per capita income for the town was $14,818. About 15.2% of the population was below the poverty line.
Conclusion
Searchlight, Nevada is a small unincorporated town located in Clark County, Nevada. It is situated in the Mojave Desert, approximately 60 miles south of Las Vegas. The town was founded in 1901 by George F. Colton and named after the nearby Searchlight Mine. The town has a population of approximately 545 people, as of the 2010 census. The economy of Searchlight is largely based on tourism, and the town is home to the Searchlight Historic District, which is listed on the National Register of Historic Places. The racial makeup of the town is 94.2% White, 0.2% African American, 0.7% Native American, 0.2% Asian, 0.2% Pacific Islander, 2.2% from other races, and 2.5% from two or more races. The median household income in Searchlight was $31,250, and the median family income was $35,000. About 15.2% of the population was below the poverty line.
Common Questions
What is Per Capita Income in Searchlight?
Per Capita income in Searchlight is $31,202.
What is the Median Family Income in Searchlight?
Median Family Income in Searchlight is $42,708.
What is Inequality or Gini Index in Searchlight?
Inequality or Gini Index in Searchlight is 0.48.
What is the Total Population of Searchlight?
Total Population of Searchlight is 278.
What is the Total Male Population of Searchlight?
Total Male Population of Searchlight is 172.
What is the Total Female Population of Searchlight?
Total Female Population of Searchlight is 106.
What is the Ratio of Males per 100 Females in Searchlight?
There are 162.26 Males per 100 Females in Searchlight.
What is the Ratio of Females per 100 Males in Searchlight?
There are 61.63 Females per 100 Males in Searchlight.
What is the Median Population Age in Searchlight?
Median Population Age in Searchlight is 68.0 Years.
What is the Average Family Size in Searchlight
Average Family Size in Searchlight is 2.1 People.
What is the Average Household Size in Searchlight
Average Household Size in Searchlight is 1.4 People.
How Large is the Labor Force in Searchlight?
There are 67 People in the Labor Forcein in Searchlight.
What is the Percentage of People in the Labor Force in Searchlight?
24.5% of People are in the Labor Force in Searchlight.