Nellis AFB, NV Map & Demographics
Nellis AFB Map
Nellis AFB Overview
$18,557
PER CAPITA INCOME
$64,100
AVG FAMILY INCOME
$67,733
AVG HOUSEHOLD INCOME
56.7%
WAGE / INCOME GAP [ % ]
43.3¢/ $1
WAGE / INCOME GAP [ $ ]
0.33
INEQUALITY / GINI INDEX
4,278
TOTAL POPULATION
2,446
MALE POPULATION
1,832
FEMALE POPULATION
133.52
MALES / 100 FEMALES
74.90
FEMALES / 100 MALES
21.4
MEDIAN AGE
4.0
AVG FAMILY SIZE
3.7
AVG HOUSEHOLD SIZE
1,974
LABOR FORCE [ PEOPLE ]
77.5%
PERCENT IN LABOR FORCE
22.4%
UNEMPLOYMENT RATE
Nellis AFB Zip Codes
Nellis AFB Area Codes
Income in Nellis AFB
Income Overview in Nellis AFB
Per Capita Income in Nellis AFB is $18,557, while median incomes of families and households are $64,100 and $67,733 respectively.
| Characteristic | Number | Measure |
| Per Capita Income | 4,278 | $18,557 |
| Median Family Income | 930 | $64,100 |
| Mean Family Income | 930 | $69,168 |
| Median Household Income | 1,076 | $67,733 |
| Mean Household Income | 1,076 | $66,478 |
| Income Deficit | 930 | $0 |
| Wage / Income Gap (%) | 4,278 | 56.68% |
| Wage / Income Gap ($) | 4,278 | 43.32¢ per $1 |
| Gini / Inequality Index | 4,278 | 0.33 |
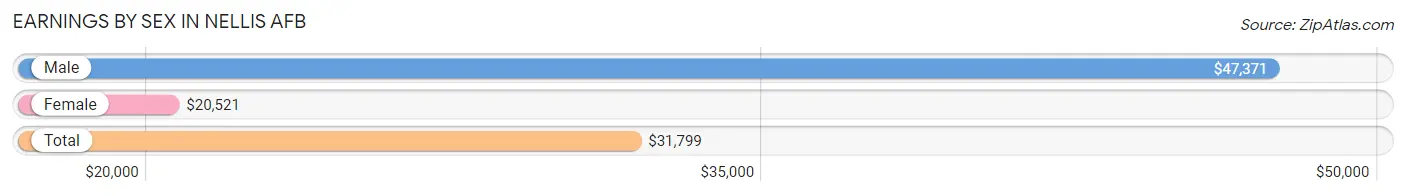
Earnings by Sex in Nellis AFB
Average Earnings in Nellis AFB are $31,799, $47,371 for men and $20,521 for women, a difference of 56.7%.
| Sex | Number | Average Earnings |
| Male | 1,197 (61.3%) | $47,371 |
| Female | 756 (38.7%) | $20,521 |
| Total | 1,953 (100.0%) | $31,799 |
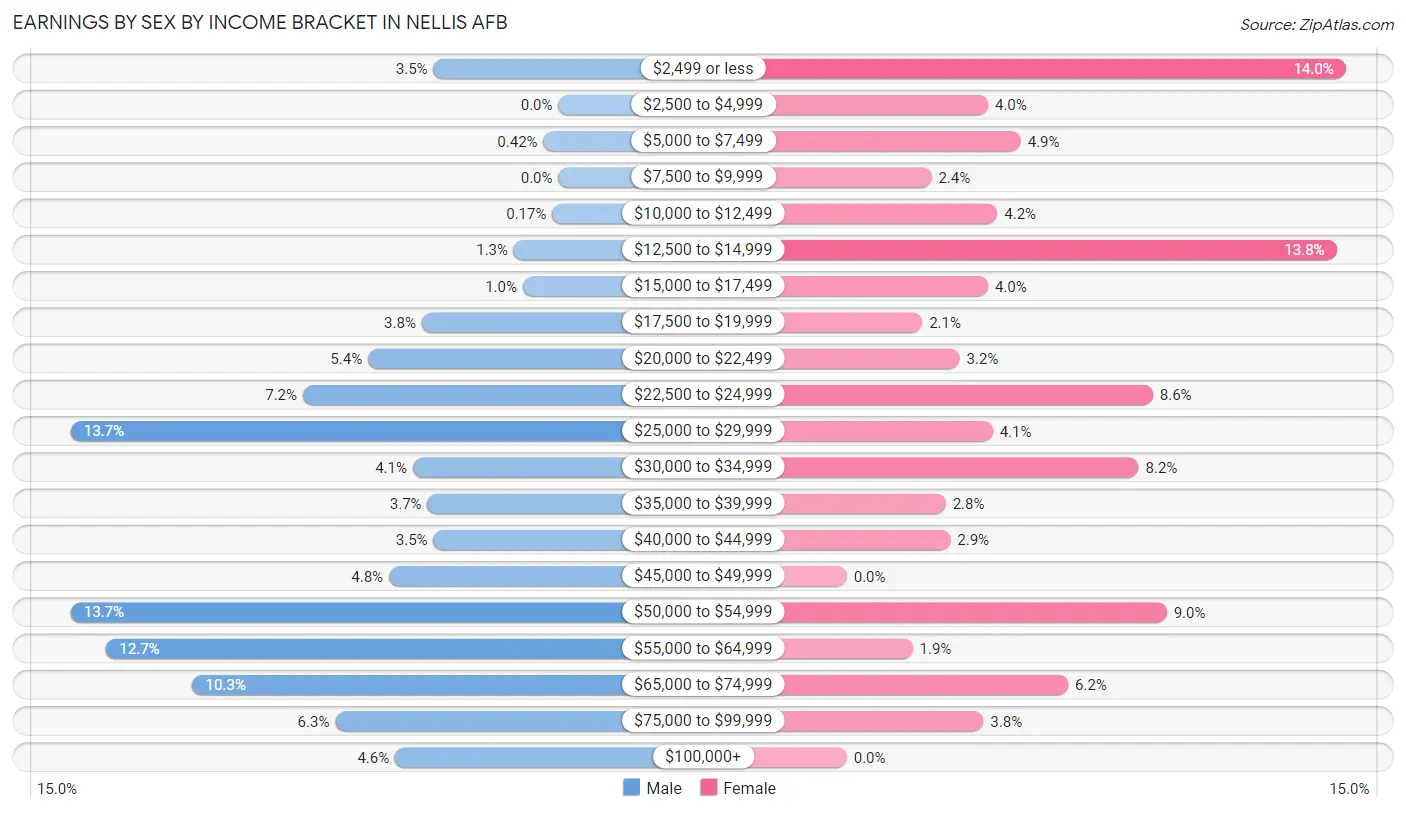
Earnings by Sex by Income Bracket in Nellis AFB
The most common earnings brackets in Nellis AFB are $25,000 to $29,999 for men (164 | 13.7%) and $2,499 or less for women (106 | 14.0%).
| Income | Male | Female |
| $2,499 or less | 42 (3.5%) | 106 (14.0%) |
| $2,500 to $4,999 | 0 (0.0%) | 30 (4.0%) |
| $5,000 to $7,499 | 5 (0.4%) | 37 (4.9%) |
| $7,500 to $9,999 | 0 (0.0%) | 18 (2.4%) |
| $10,000 to $12,499 | 2 (0.2%) | 32 (4.2%) |
| $12,500 to $14,999 | 15 (1.3%) | 104 (13.8%) |
| $15,000 to $17,499 | 12 (1.0%) | 30 (4.0%) |
| $17,500 to $19,999 | 46 (3.8%) | 16 (2.1%) |
| $20,000 to $22,499 | 64 (5.3%) | 24 (3.2%) |
| $22,500 to $24,999 | 86 (7.2%) | 65 (8.6%) |
| $25,000 to $29,999 | 164 (13.7%) | 31 (4.1%) |
| $30,000 to $34,999 | 49 (4.1%) | 62 (8.2%) |
| $35,000 to $39,999 | 44 (3.7%) | 21 (2.8%) |
| $40,000 to $44,999 | 42 (3.5%) | 22 (2.9%) |
| $45,000 to $49,999 | 57 (4.8%) | 0 (0.0%) |
| $50,000 to $54,999 | 164 (13.7%) | 68 (9.0%) |
| $55,000 to $64,999 | 152 (12.7%) | 14 (1.8%) |
| $65,000 to $74,999 | 123 (10.3%) | 47 (6.2%) |
| $75,000 to $99,999 | 75 (6.3%) | 29 (3.8%) |
| $100,000+ | 55 (4.6%) | 0 (0.0%) |
| Total | 1,197 (100.0%) | 756 (100.0%) |
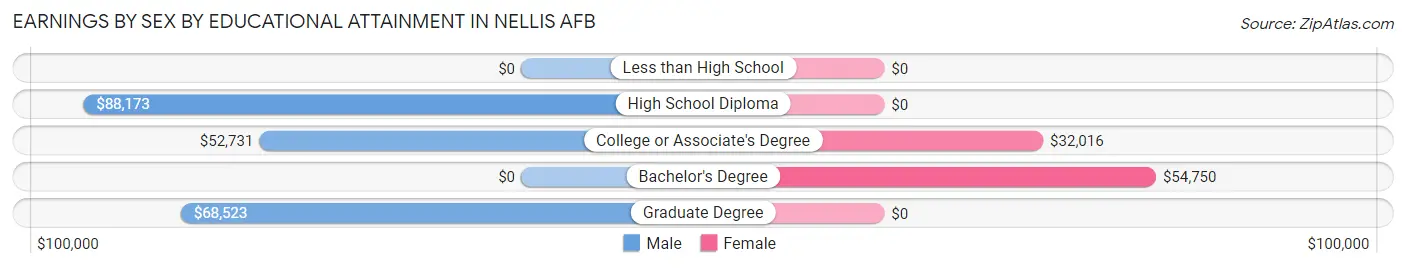
Earnings by Sex by Educational Attainment in Nellis AFB
Average earnings in Nellis AFB are $53,125 for men and $31,371 for women, a difference of 40.9%. Men with an educational attainment of high school diploma enjoy the highest average annual earnings of $88,173, while those with college or associate's degree education earn the least with $52,731. Women with an educational attainment of bachelor's degree earn the most with the average annual earnings of $54,750, while those with college or associate's degree education have the smallest earnings of $32,016.
| Educational Attainment | Male Income | Female Income |
| Less than High School | - | - |
| High School Diploma | $88,173 | $0 |
| College or Associate's Degree | $52,731 | $32,016 |
| Bachelor's Degree | - | - |
| Graduate Degree | $68,523 | $0 |
| Total | $53,125 | $31,371 |
Family Income in Nellis AFB
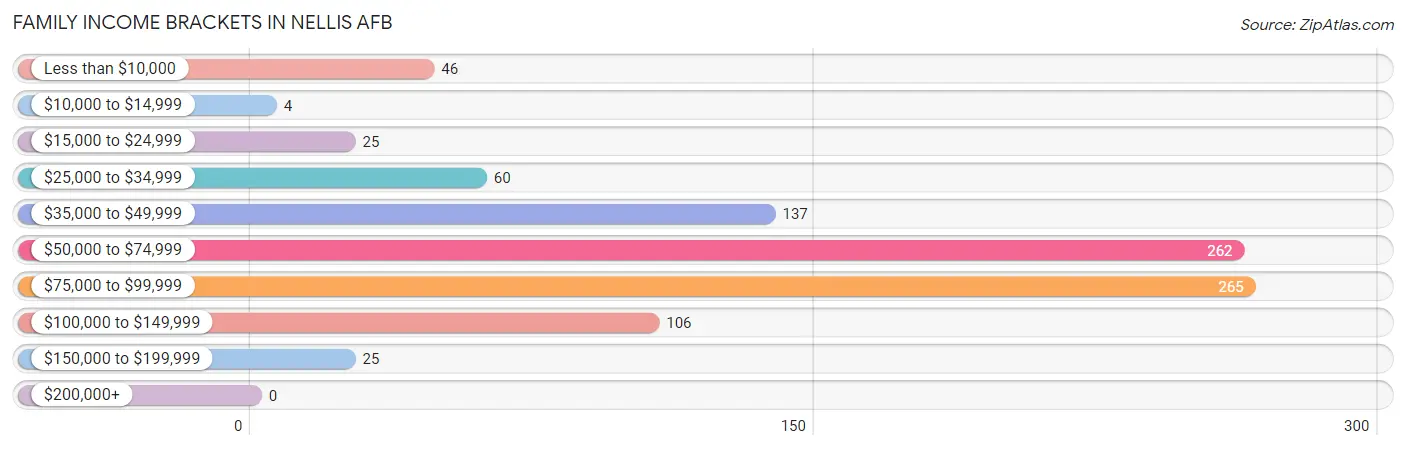
Family Income Brackets in Nellis AFB
According to the Nellis AFB family income data, there are 265 families falling into the $75,000 to $99,999 income range, which is the most common income bracket and makes up 28.5% of all families.
| Income Bracket | # Families | % Families |
| Less than $10,000 | 46 | 4.9% |
| $10,000 to $14,999 | 4 | 0.4% |
| $15,000 to $24,999 | 25 | 2.7% |
| $25,000 to $34,999 | 60 | 6.5% |
| $35,000 to $49,999 | 137 | 14.7% |
| $50,000 to $74,999 | 262 | 28.2% |
| $75,000 to $99,999 | 265 | 28.5% |
| $100,000 to $149,999 | 106 | 11.4% |
| $150,000 to $199,999 | 25 | 2.7% |
| $200,000+ | 0 | 0.0% |
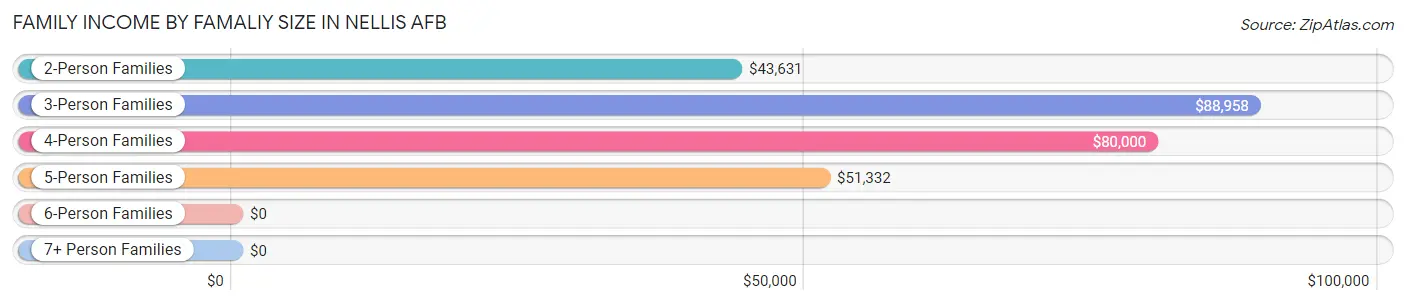
Family Income by Famaliy Size in Nellis AFB
3-person families (230 | 24.7%) account for the highest median family income in Nellis AFB with $88,958 per family, while 3-person families (230 | 24.7%) have the highest median income of $29,653 per family member.
| Income Bracket | # Families | Median Income |
| 2-Person Families | 167 (18.0%) | $43,631 |
| 3-Person Families | 230 (24.7%) | $88,958 |
| 4-Person Families | 220 (23.7%) | $80,000 |
| 5-Person Families | 262 (28.2%) | $51,332 |
| 6-Person Families | 23 (2.5%) | $0 |
| 7+ Person Families | 28 (3.0%) | $0 |
| Total | 930 (100.0%) | $64,100 |
Family Income by Number of Earners in Nellis AFB
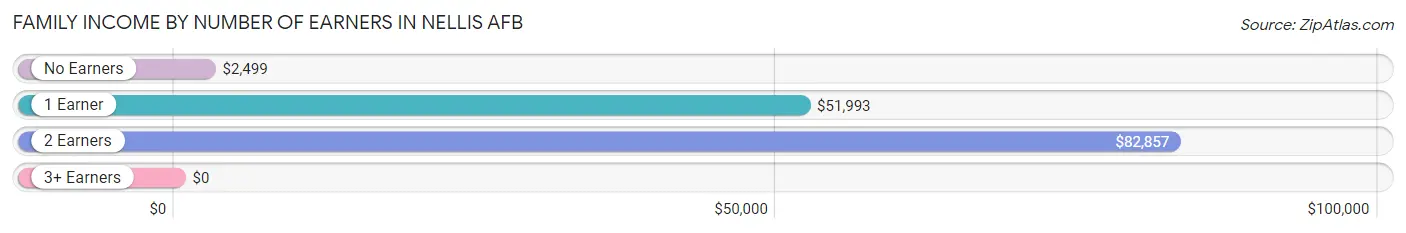
| Number of Earners | # Families | Median Income |
| No Earners | 50 (5.4%) | $2,499 |
| 1 Earner | 406 (43.7%) | $51,993 |
| 2 Earners | 446 (48.0%) | $82,857 |
| 3+ Earners | 28 (3.0%) | $0 |
| Total | 930 (100.0%) | $64,100 |
Household Income in Nellis AFB
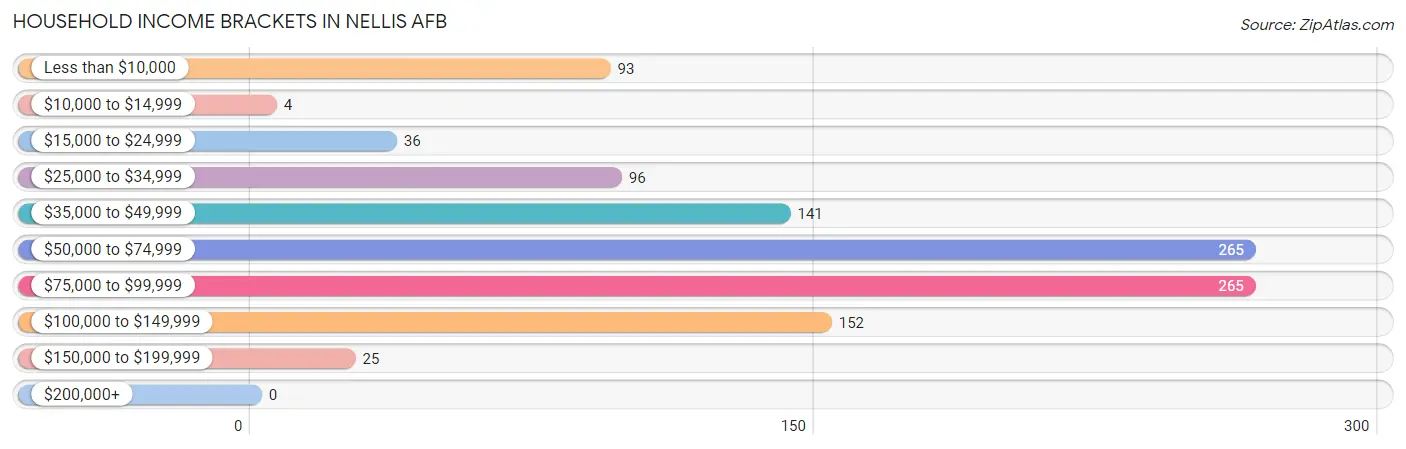
Household Income Brackets in Nellis AFB
With 265 households falling in the category, the $50,000 to $74,999 income range is the most frequent in Nellis AFB, accounting for 24.6% of all households.
| Income Bracket | # Households | % Households |
| Less than $10,000 | 93 | 8.6% |
| $10,000 to $14,999 | 4 | 0.4% |
| $15,000 to $24,999 | 36 | 3.3% |
| $25,000 to $34,999 | 96 | 8.9% |
| $35,000 to $49,999 | 141 | 13.1% |
| $50,000 to $74,999 | 265 | 24.6% |
| $75,000 to $99,999 | 265 | 24.6% |
| $100,000 to $149,999 | 152 | 14.1% |
| $150,000 to $199,999 | 25 | 2.3% |
| $200,000+ | 0 | 0.0% |
Household Income by Householder Age in Nellis AFB
The median household income in Nellis AFB is $67,733, with the highest median household income of $77,857 found in the 25 to 44 years age bracket for the primary householder. A total of 798 households (74.2%) fall into this category. Meanwhile, the 45 to 64 years age bracket for the primary householder has the lowest median household income of $0, with 47 households (4.4%) in this group.
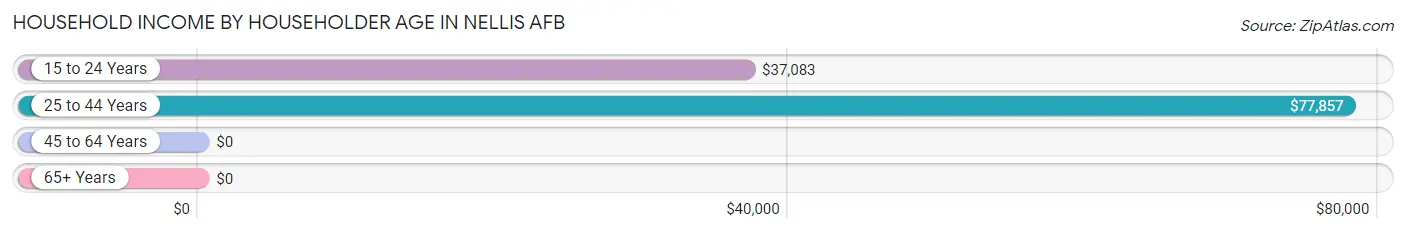
| Income Bracket | # Households | Median Income |
| 15 to 24 Years | 221 (20.5%) | $37,083 |
| 25 to 44 Years | 798 (74.2%) | $77,857 |
| 45 to 64 Years | 47 (4.4%) | $0 |
| 65+ Years | 10 (0.9%) | $0 |
| Total | 1,076 (100.0%) | $67,733 |
Poverty in Nellis AFB
Income Below Poverty by Sex and Age in Nellis AFB
With 11.1% poverty level for males and 10.6% for females among the residents of Nellis AFB, 12 to 14 year old males and 12 to 14 year old females are the most vulnerable to poverty, with 23 males (76.7%) and 25 females (27.2%) in their respective age groups living below the poverty level.
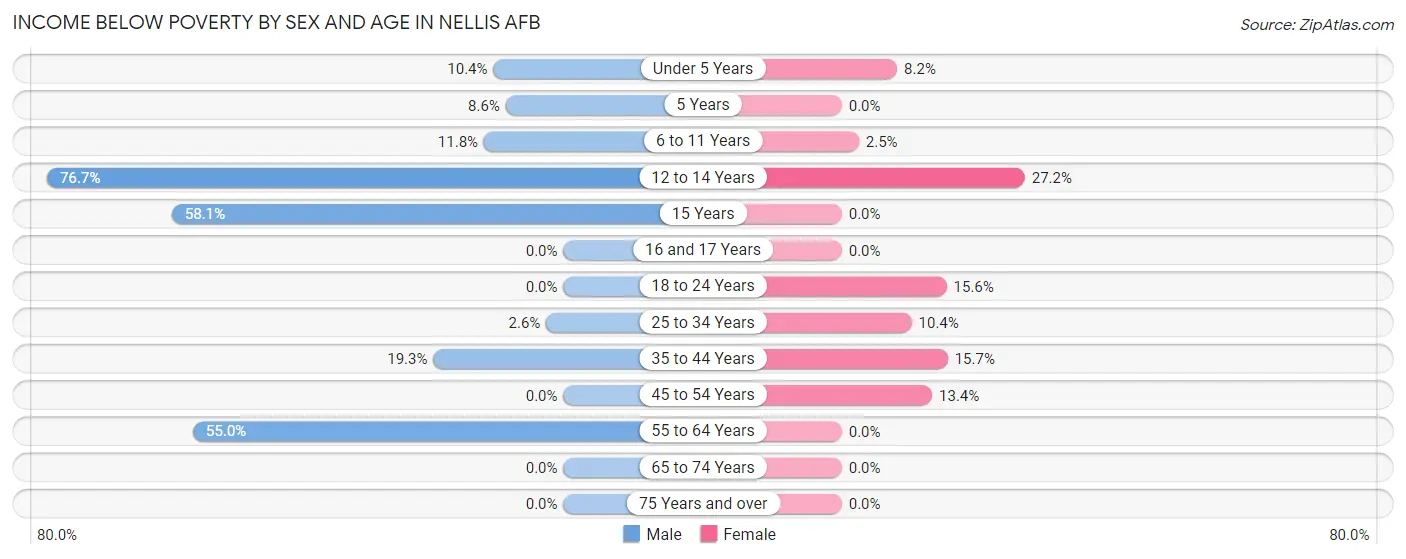
| Age Bracket | Male | Female |
| Under 5 Years | 37 (10.4%) | 18 (8.2%) |
| 5 Years | 18 (8.6%) | 0 (0.0%) |
| 6 to 11 Years | 63 (11.8%) | 5 (2.5%) |
| 12 to 14 Years | 23 (76.7%) | 25 (27.2%) |
| 15 Years | 25 (58.1%) | 0 (0.0%) |
| 16 and 17 Years | 0 (0.0%) | 0 (0.0%) |
| 18 to 24 Years | 0 (0.0%) | 40 (15.6%) |
| 25 to 34 Years | 13 (2.5%) | 61 (10.4%) |
| 35 to 44 Years | 56 (19.3%) | 28 (15.7%) |
| 45 to 54 Years | 0 (0.0%) | 11 (13.4%) |
| 55 to 64 Years | 11 (55.0%) | 0 (0.0%) |
| 65 to 74 Years | 0 (0.0%) | 0 (0.0%) |
| 75 Years and over | 0 (0.0%) | 0 (0.0%) |
| Total | 246 (11.1%) | 188 (10.6%) |
Income Above Poverty by Sex and Age in Nellis AFB
According to the poverty statistics in Nellis AFB, males aged 16 and 17 years and females aged 5 years are the age groups that are most secure financially, with 100.0% of males and 100.0% of females in these age groups living above the poverty line.
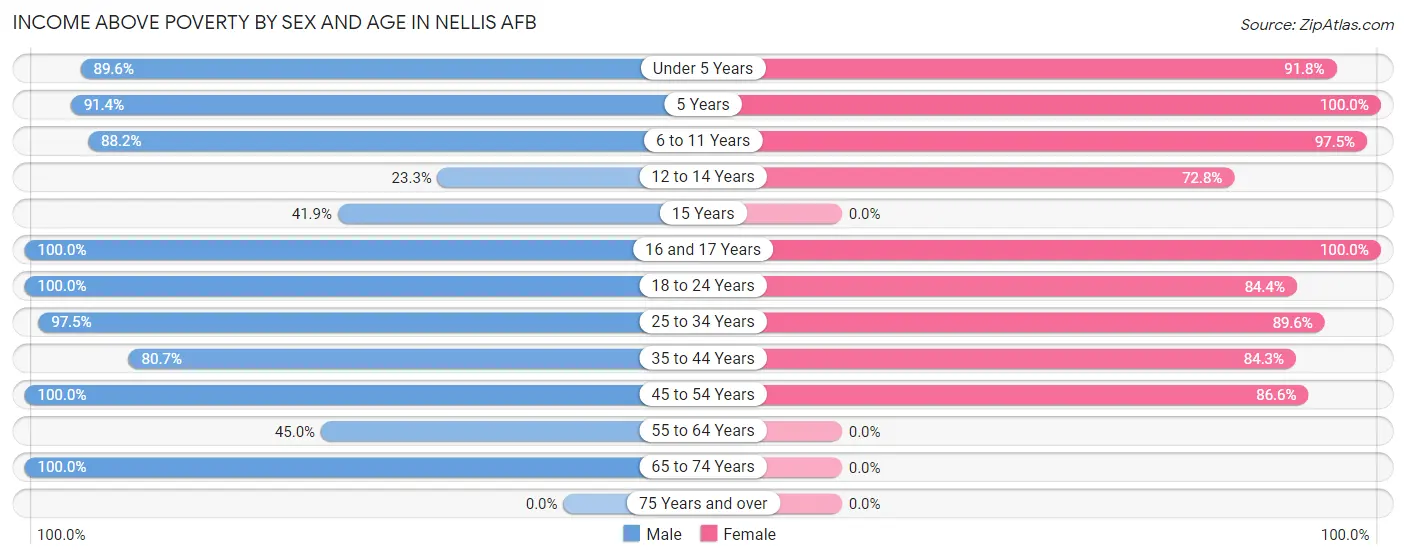
| Age Bracket | Male | Female |
| Under 5 Years | 319 (89.6%) | 201 (91.8%) |
| 5 Years | 192 (91.4%) | 49 (100.0%) |
| 6 to 11 Years | 471 (88.2%) | 193 (97.5%) |
| 12 to 14 Years | 7 (23.3%) | 67 (72.8%) |
| 15 Years | 18 (41.9%) | 0 (0.0%) |
| 16 and 17 Years | 31 (100.0%) | 117 (100.0%) |
| 18 to 24 Years | 160 (100.0%) | 217 (84.4%) |
| 25 to 34 Years | 496 (97.5%) | 527 (89.6%) |
| 35 to 44 Years | 234 (80.7%) | 150 (84.3%) |
| 45 to 54 Years | 18 (100.0%) | 71 (86.6%) |
| 55 to 64 Years | 9 (45.0%) | 0 (0.0%) |
| 65 to 74 Years | 10 (100.0%) | 0 (0.0%) |
| 75 Years and over | 0 (0.0%) | 0 (0.0%) |
| Total | 1,965 (88.9%) | 1,592 (89.4%) |
Income Below Poverty Among Married-Couple Families in Nellis AFB
The poverty statistics for married-couple families in Nellis AFB show that 3.5% or 27 of the total 776 families live below the poverty line. Families with 3 or 4 children have the highest poverty rate of 5.4%, comprising of 13 families. On the other hand, families with no children have the lowest poverty rate of 0.0%, which includes 0 families.
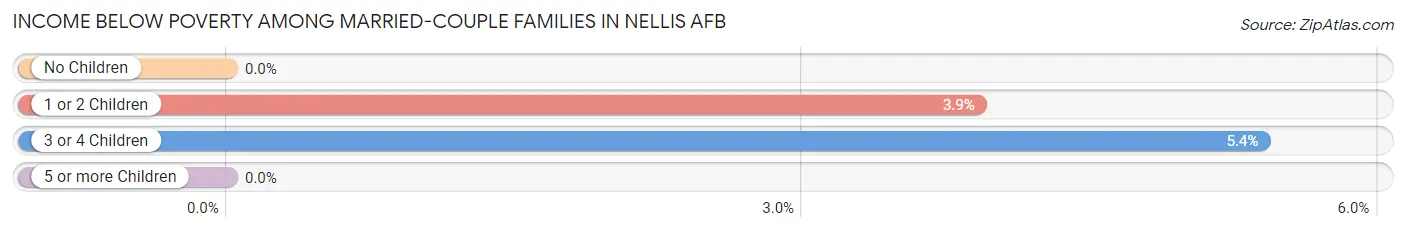
| Children | Above Poverty | Below Poverty |
| No Children | 149 (100.0%) | 0 (0.0%) |
| 1 or 2 Children | 344 (96.1%) | 14 (3.9%) |
| 3 or 4 Children | 228 (94.6%) | 13 (5.4%) |
| 5 or more Children | 28 (100.0%) | 0 (0.0%) |
| Total | 749 (96.5%) | 27 (3.5%) |
Income Below Poverty Among Single-Parent Households in Nellis AFB
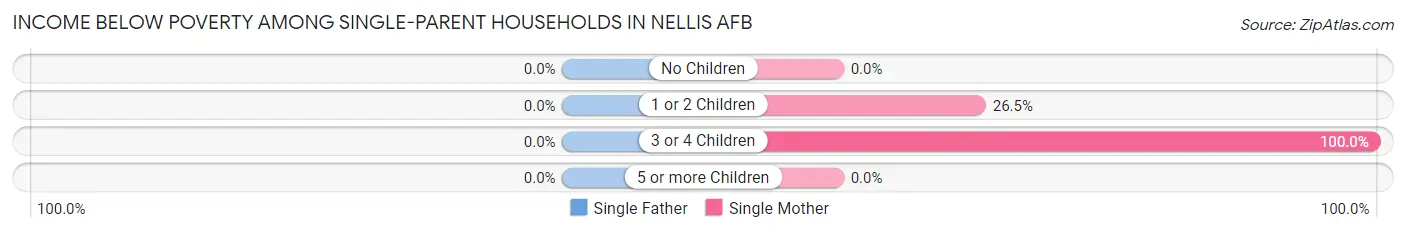
| Children | Single Father | Single Mother |
| No Children | 0 (0.0%) | 0 (0.0%) |
| 1 or 2 Children | 0 (0.0%) | 27 (26.5%) |
| 3 or 4 Children | 0 (0.0%) | 23 (100.0%) |
| 5 or more Children | 0 (0.0%) | 0 (0.0%) |
| Total | 0 (0.0%) | 50 (40.0%) |
Income Below Poverty Among Married-Couple vs Single-Parent Households in Nellis AFB
The poverty data for Nellis AFB shows that 27 of the married-couple family households (3.5%) and 50 of the single-parent households (32.5%) are living below the poverty level. Within the married-couple family households, those with 3 or 4 children have the highest poverty rate, with 13 households (5.4%) falling below the poverty line. Among the single-parent households, those with 3 or 4 children have the highest poverty rate, with 23 household (100.0%) living below poverty.
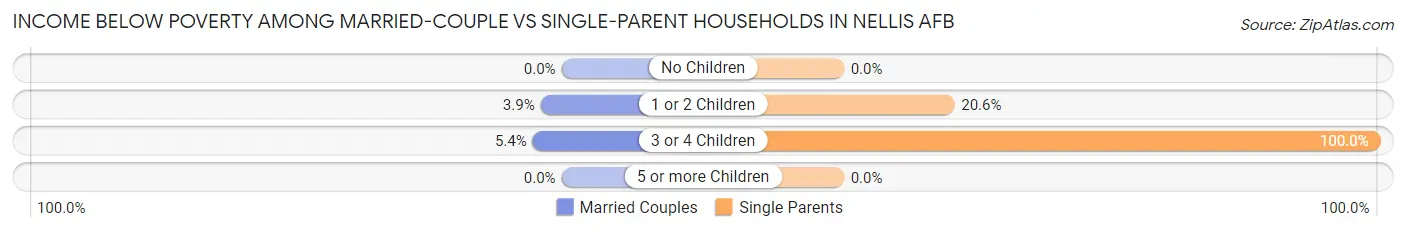
| Children | Married-Couple Families | Single-Parent Households |
| No Children | 0 (0.0%) | 0 (0.0%) |
| 1 or 2 Children | 14 (3.9%) | 27 (20.6%) |
| 3 or 4 Children | 13 (5.4%) | 23 (100.0%) |
| 5 or more Children | 0 (0.0%) | 0 (0.0%) |
| Total | 27 (3.5%) | 50 (32.5%) |
Race in Nellis AFB
The most populous races in Nellis AFB are White / Caucasian (2,556 | 59.8%), Two or more Races (944 | 22.1%), and Hispanic or Latino (926 | 21.6%).
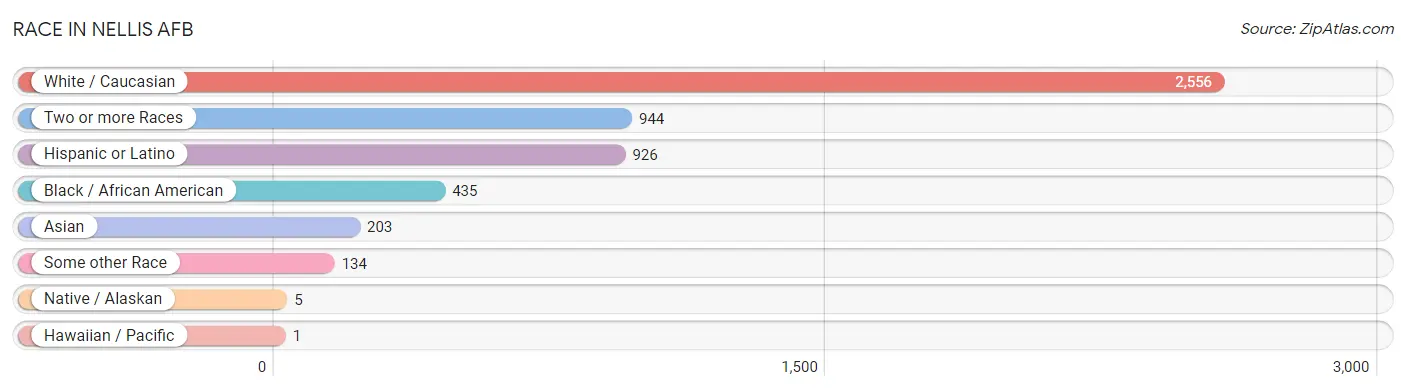
| Race | # Population | % Population |
| Asian | 203 | 4.8% |
| Black / African American | 435 | 10.2% |
| Hawaiian / Pacific | 1 | 0.0% |
| Hispanic or Latino | 926 | 21.6% |
| Native / Alaskan | 5 | 0.1% |
| White / Caucasian | 2,556 | 59.8% |
| Two or more Races | 944 | 22.1% |
| Some other Race | 134 | 3.1% |
| Total | 4,278 | 100.0% |
Ancestry in Nellis AFB
The most populous ancestries reported in Nellis AFB are Mexican (770 | 18.0%), Irish (612 | 14.3%), German (580 | 13.6%), Scottish (548 | 12.8%), and English (365 | 8.5%), together accounting for 67.2% of all Nellis AFB residents.
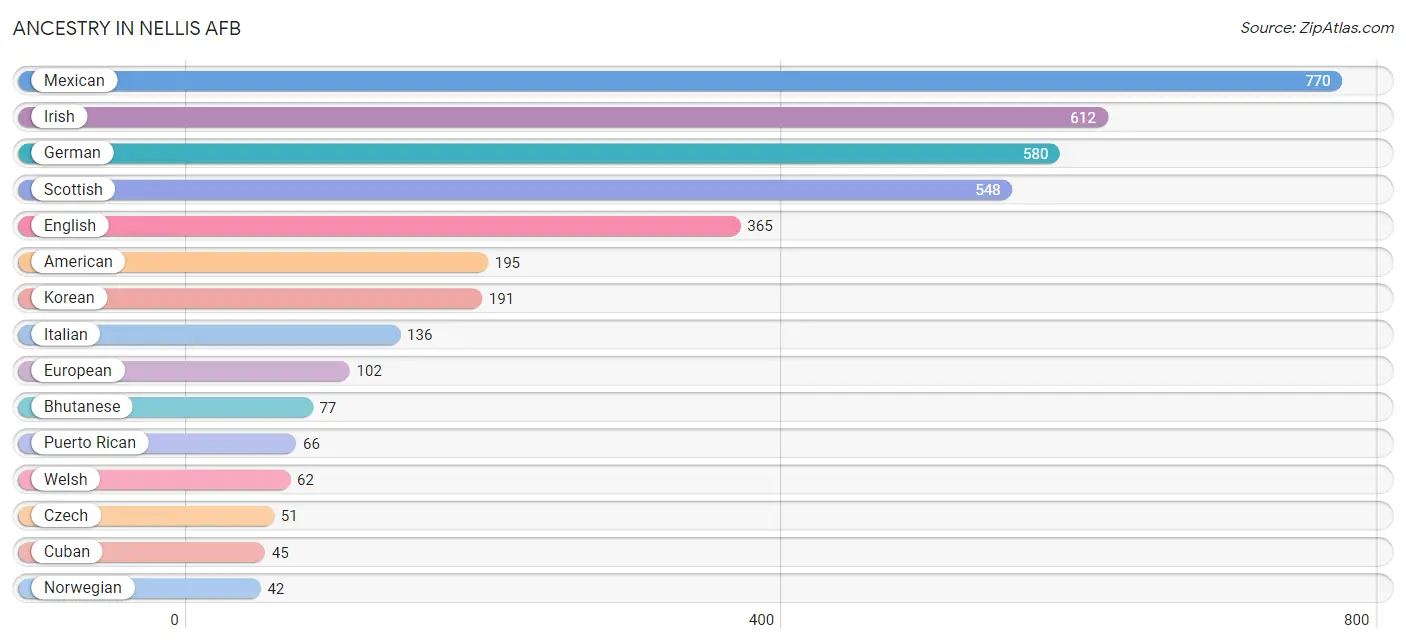
| Ancestry | # Population | % Population |
| African | 9 | 0.2% |
| American | 195 | 4.6% |
| Bhutanese | 77 | 1.8% |
| Brazilian | 3 | 0.1% |
| British | 10 | 0.2% |
| Burmese | 28 | 0.6% |
| Cajun | 4 | 0.1% |
| Central American | 31 | 0.7% |
| Choctaw | 10 | 0.2% |
| Costa Rican | 25 | 0.6% |
| Cuban | 45 | 1.1% |
| Czech | 51 | 1.2% |
| Czechoslovakian | 2 | 0.1% |
| Dominican | 2 | 0.1% |
| Ecuadorian | 1 | 0.0% |
| English | 365 | 8.5% |
| European | 102 | 2.4% |
| French | 9 | 0.2% |
| French Canadian | 2 | 0.1% |
| German | 580 | 13.6% |
| Haitian | 1 | 0.0% |
| Hungarian | 25 | 0.6% |
| Indian (Asian) | 25 | 0.6% |
| Iranian | 4 | 0.1% |
| Irish | 612 | 14.3% |
| Italian | 136 | 3.2% |
| Korean | 191 | 4.5% |
| Mexican | 770 | 18.0% |
| Mexican American Indian | 11 | 0.3% |
| Native Hawaiian | 17 | 0.4% |
| Northern European | 6 | 0.1% |
| Norwegian | 42 | 1.0% |
| Panamanian | 6 | 0.1% |
| Polish | 34 | 0.8% |
| Portuguese | 9 | 0.2% |
| Puerto Rican | 66 | 1.5% |
| Romanian | 8 | 0.2% |
| Russian | 1 | 0.0% |
| Scandinavian | 16 | 0.4% |
| Scottish | 548 | 12.8% |
| South American | 1 | 0.0% |
| Spaniard | 11 | 0.3% |
| Sri Lankan | 5 | 0.1% |
| Subsaharan African | 9 | 0.2% |
| Swedish | 19 | 0.4% |
| Ukrainian | 7 | 0.2% |
| Welsh | 62 | 1.5% |
| West Indian | 3 | 0.1% | View All 48 Rows |
Immigrants in Nellis AFB
The most numerous immigrant groups reported in Nellis AFB came from Asia (124 | 2.9%), Philippines (68 | 1.6%), South Eastern Asia (68 | 1.6%), Eastern Asia (56 | 1.3%), and Latin America (41 | 1.0%), together accounting for 8.4% of all Nellis AFB residents.
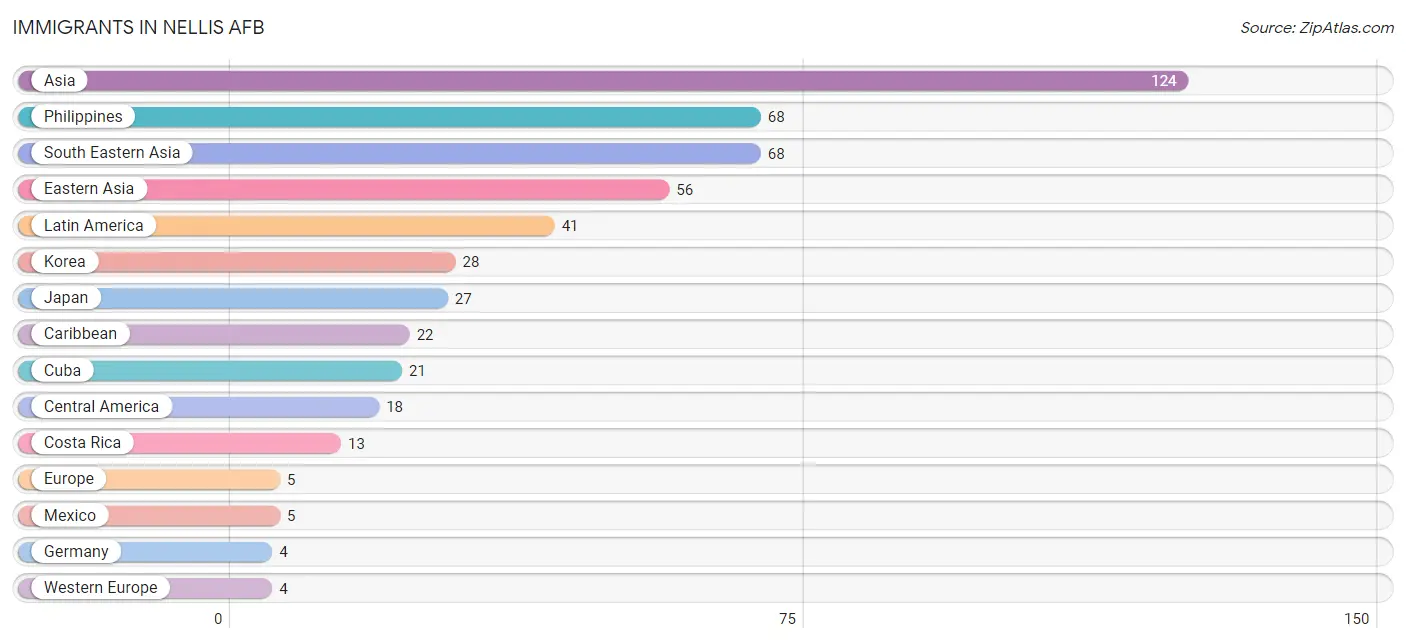
| Immigration Origin | # Population | % Population |
| Asia | 124 | 2.9% |
| Caribbean | 22 | 0.5% |
| Central America | 18 | 0.4% |
| China | 1 | 0.0% |
| Costa Rica | 13 | 0.3% |
| Cuba | 21 | 0.5% |
| Dominican Republic | 1 | 0.0% |
| Eastern Asia | 56 | 1.3% |
| Eastern Europe | 1 | 0.0% |
| Ecuador | 1 | 0.0% |
| Europe | 5 | 0.1% |
| Germany | 4 | 0.1% |
| Japan | 27 | 0.6% |
| Korea | 28 | 0.6% |
| Latin America | 41 | 1.0% |
| Mexico | 5 | 0.1% |
| Philippines | 68 | 1.6% |
| South America | 1 | 0.0% |
| South Eastern Asia | 68 | 1.6% |
| Ukraine | 1 | 0.0% |
| Western Europe | 4 | 0.1% | View All 21 Rows |
Sex and Age in Nellis AFB
Sex and Age in Nellis AFB
The most populous age groups in Nellis AFB are 5 to 9 Years (700 | 28.6%) for men and 25 to 29 Years (356 | 19.4%) for women.
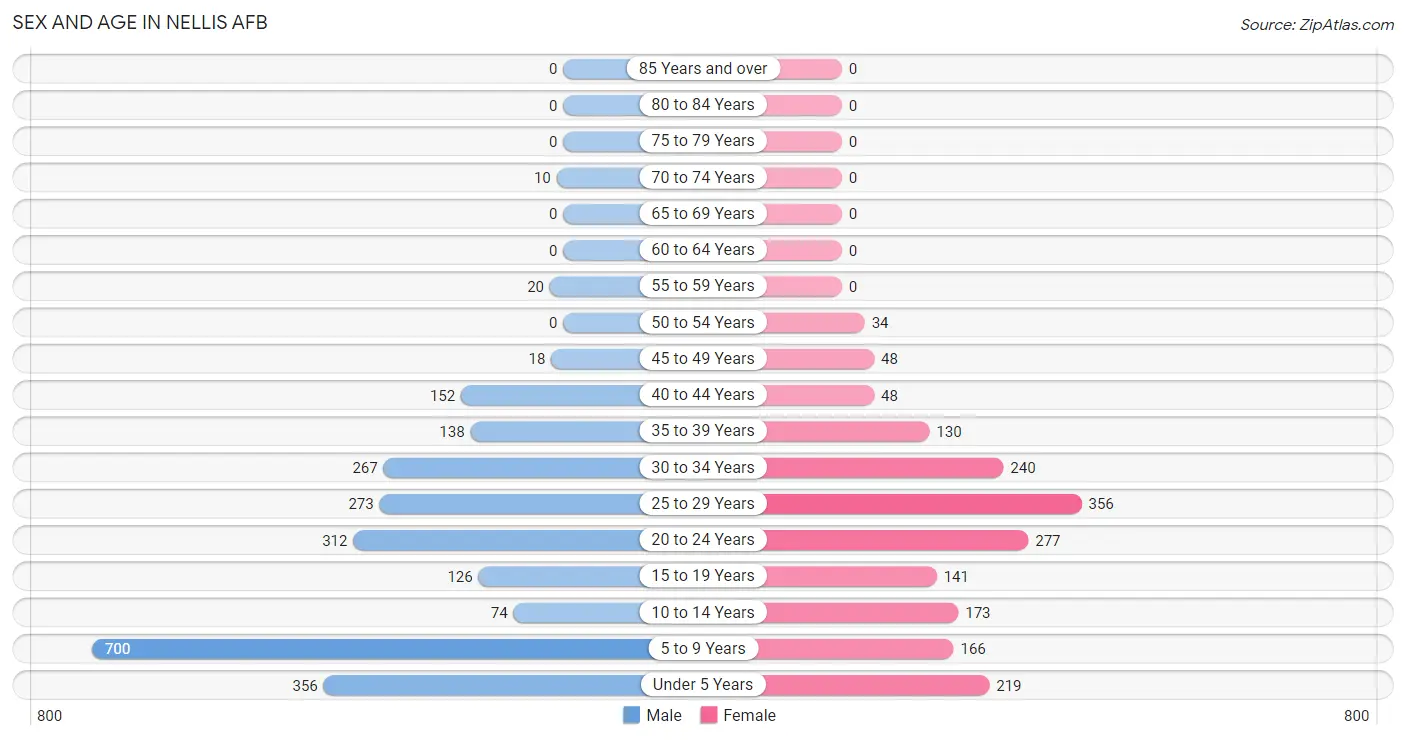
| Age Bracket | Male | Female |
| Under 5 Years | 356 (14.5%) | 219 (11.9%) |
| 5 to 9 Years | 700 (28.6%) | 166 (9.1%) |
| 10 to 14 Years | 74 (3.0%) | 173 (9.4%) |
| 15 to 19 Years | 126 (5.1%) | 141 (7.7%) |
| 20 to 24 Years | 312 (12.8%) | 277 (15.1%) |
| 25 to 29 Years | 273 (11.2%) | 356 (19.4%) |
| 30 to 34 Years | 267 (10.9%) | 240 (13.1%) |
| 35 to 39 Years | 138 (5.6%) | 130 (7.1%) |
| 40 to 44 Years | 152 (6.2%) | 48 (2.6%) |
| 45 to 49 Years | 18 (0.7%) | 48 (2.6%) |
| 50 to 54 Years | 0 (0.0%) | 34 (1.9%) |
| 55 to 59 Years | 20 (0.8%) | 0 (0.0%) |
| 60 to 64 Years | 0 (0.0%) | 0 (0.0%) |
| 65 to 69 Years | 0 (0.0%) | 0 (0.0%) |
| 70 to 74 Years | 10 (0.4%) | 0 (0.0%) |
| 75 to 79 Years | 0 (0.0%) | 0 (0.0%) |
| 80 to 84 Years | 0 (0.0%) | 0 (0.0%) |
| 85 Years and over | 0 (0.0%) | 0 (0.0%) |
| Total | 2,446 (100.0%) | 1,832 (100.0%) |
Families and Households in Nellis AFB
Median Family Size in Nellis AFB
The median family size in Nellis AFB is 3.96 persons per family, with married-couple families (776 | 83.4%) accounting for the largest median family size of 4.07 persons per family. On the other hand, single male/father families (29 | 3.1%) represent the smallest median family size with 2.93 persons per family.
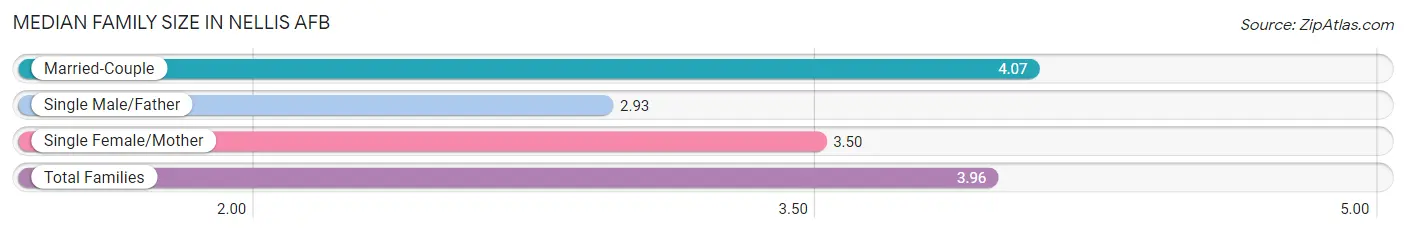
| Family Type | # Families | Family Size |
| Married-Couple | 776 (83.4%) | 4.07 |
| Single Male/Father | 29 (3.1%) | 2.93 |
| Single Female/Mother | 125 (13.4%) | 3.50 |
| Total Families | 930 (100.0%) | 3.96 |
Median Household Size in Nellis AFB
The median household size in Nellis AFB is 3.71 persons per household, with married-couple households (776 | 72.1%) accounting for the largest median household size of 4.07 persons per household. non-family households (146 | 13.6%) represent the smallest median household size with 1.61 persons per household.
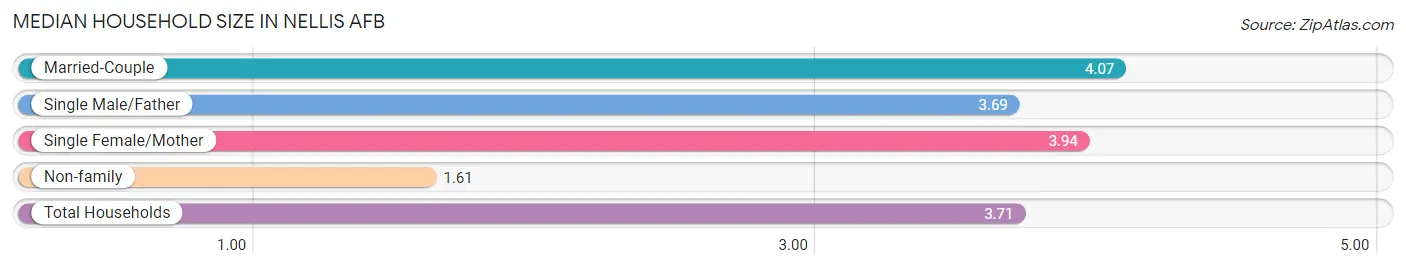
| Household Type | # Households | Household Size |
| Married-Couple | 776 (72.1%) | 4.07 |
| Single Male/Father | 29 (2.7%) | 3.69 |
| Single Female/Mother | 125 (11.6%) | 3.94 |
| Non-family | 146 (13.6%) | 1.61 |
| Total Households | 1,076 (100.0%) | 3.71 |
Household Size by Marriage Status in Nellis AFB
Out of a total of 1,076 households in Nellis AFB, 930 (86.4%) are family households, while 146 (13.6%) are nonfamily households. The most numerous type of family households are 4-person households, comprising 284, and the most common type of nonfamily households are 1-person households, comprising 92.
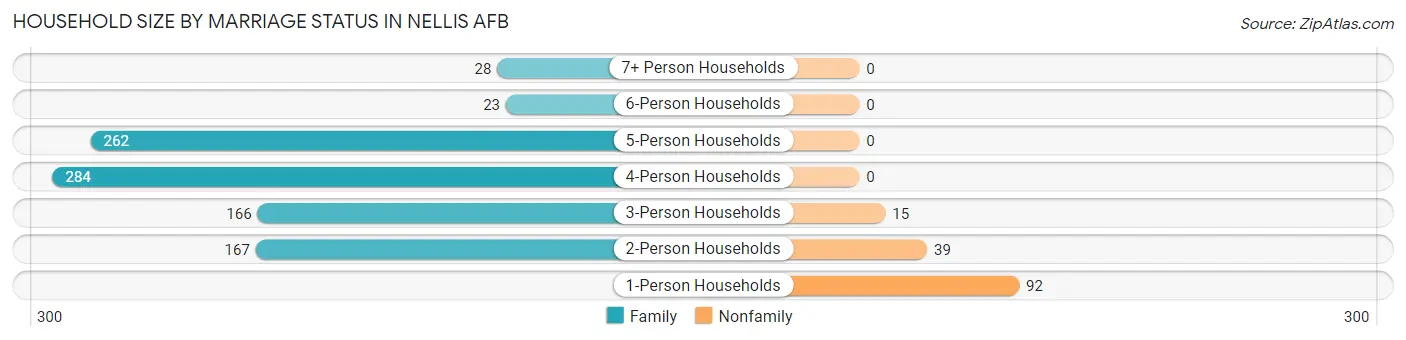
| Household Size | Family Households | Nonfamily Households |
| 1-Person Households | - | 92 (8.6%) |
| 2-Person Households | 167 (15.5%) | 39 (3.6%) |
| 3-Person Households | 166 (15.4%) | 15 (1.4%) |
| 4-Person Households | 284 (26.4%) | 0 (0.0%) |
| 5-Person Households | 262 (24.3%) | 0 (0.0%) |
| 6-Person Households | 23 (2.1%) | 0 (0.0%) |
| 7+ Person Households | 28 (2.6%) | 0 (0.0%) |
| Total | 930 (86.4%) | 146 (13.6%) |
Female Fertility in Nellis AFB
Fertility by Age in Nellis AFB
Average fertility rate in Nellis AFB is 53.0 births per 1,000 women. Women in the age bracket of 20 to 34 years have the highest fertility rate with 70.0 births per 1,000 women. Women in the age bracket of 20 to 34 years acount for 92.4% of all women with births.
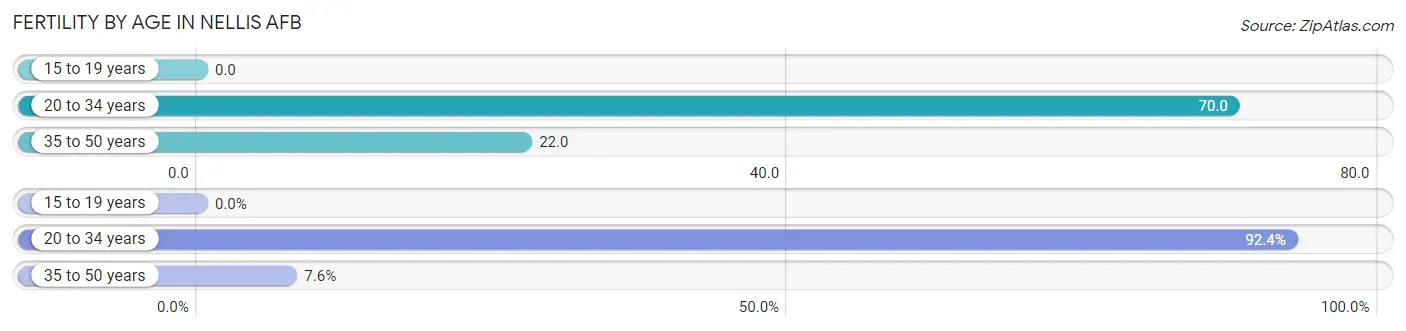
| Age Bracket | Women with Births | Births / 1,000 Women |
| 15 to 19 years | 0 (0.0%) | 0.0 |
| 20 to 34 years | 61 (92.4%) | 70.0 |
| 35 to 50 years | 5 (7.6%) | 22.0 |
| Total | 66 (100.0%) | 53.0 |
Fertility by Age by Marriage Status in Nellis AFB
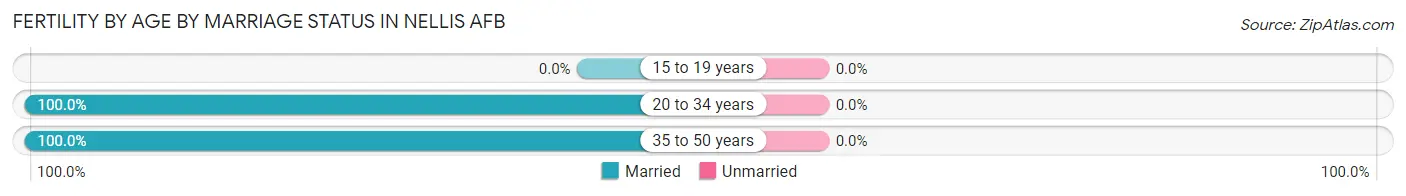
| Age Bracket | Married | Unmarried |
| 15 to 19 years | 0 (0.0%) | 0 (0.0%) |
| 20 to 34 years | 61 (100.0%) | 0 (0.0%) |
| 35 to 50 years | 5 (100.0%) | 0 (0.0%) |
| Total | 66 (100.0%) | 0 (0.0%) |
Fertility by Education in Nellis AFB
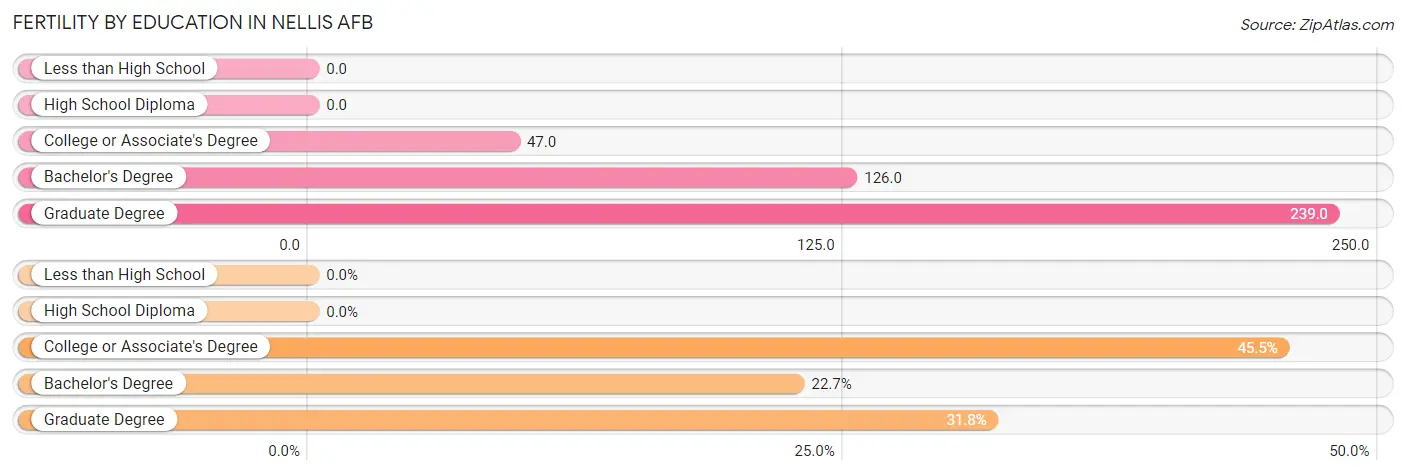
| Educational Attainment | Women with Births | Births / 1,000 Women |
| Less than High School | 0 (0.0%) | 0.0 |
| High School Diploma | 0 (0.0%) | 0.0 |
| College or Associate's Degree | 30 (45.5%) | 47.0 |
| Bachelor's Degree | 15 (22.7%) | 126.0 |
| Graduate Degree | 21 (31.8%) | 239.0 |
| Total | 66 (100.0%) | 53.0 |
Fertility by Education by Marriage Status in Nellis AFB
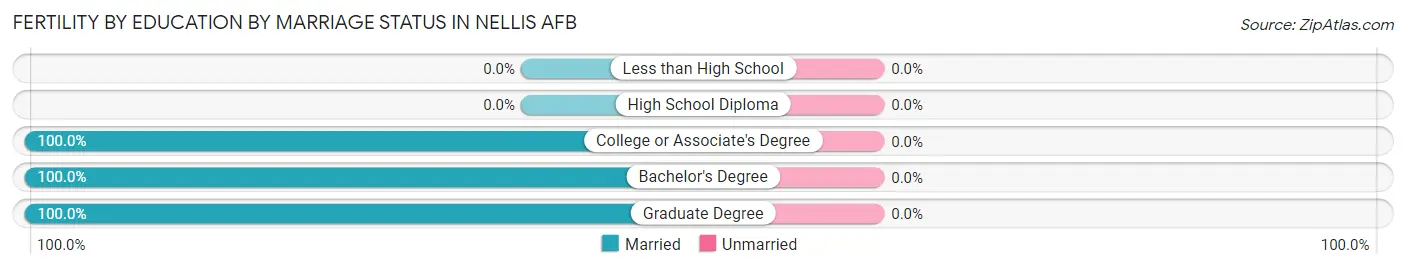
| Educational Attainment | Married | Unmarried |
| Less than High School | 0 (0.0%) | 0 (0.0%) |
| High School Diploma | 0 (0.0%) | 0 (0.0%) |
| College or Associate's Degree | 30 (100.0%) | 0 (0.0%) |
| Bachelor's Degree | 15 (100.0%) | 0 (0.0%) |
| Graduate Degree | 21 (100.0%) | 0 (0.0%) |
| Total | 66 (100.0%) | 0 (0.0%) |
Employment Characteristics in Nellis AFB
Employment by Class of Employer in Nellis AFB
Among the 1,760 employed individuals in Nellis AFB, federal government employees (1,203 | 68.3%), private company employees (421 | 23.9%), and self-employed (not incorporated) (54 | 3.1%) make up the most common classes of employment.
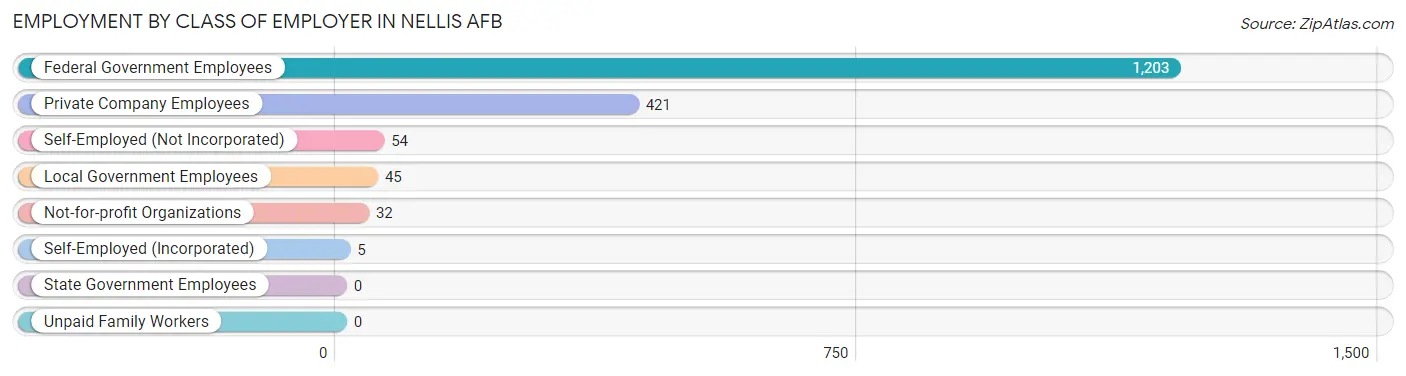
| Employer Class | # Employees | % Employees |
| Private Company Employees | 421 | 23.9% |
| Self-Employed (Incorporated) | 5 | 0.3% |
| Self-Employed (Not Incorporated) | 54 | 3.1% |
| Not-for-profit Organizations | 32 | 1.8% |
| Local Government Employees | 45 | 2.6% |
| State Government Employees | 0 | 0.0% |
| Federal Government Employees | 1,203 | 68.3% |
| Unpaid Family Workers | 0 | 0.0% |
| Total | 1,760 | 100.0% |
Employment Status by Age in Nellis AFB
According to the labor force statistics for Nellis AFB, out of the total population over 16 years of age (2,547), 77.5% or 1,974 individuals are in the labor force, with 22.4% or 442 of them unemployed. The age group with the highest labor force participation rate is 55 to 59 years, with 100.0% or 20 individuals in the labor force. Within the labor force, the 55 to 59 years age range has the highest percentage of unemployed individuals, with 55.0% or 11 of them being unemployed.
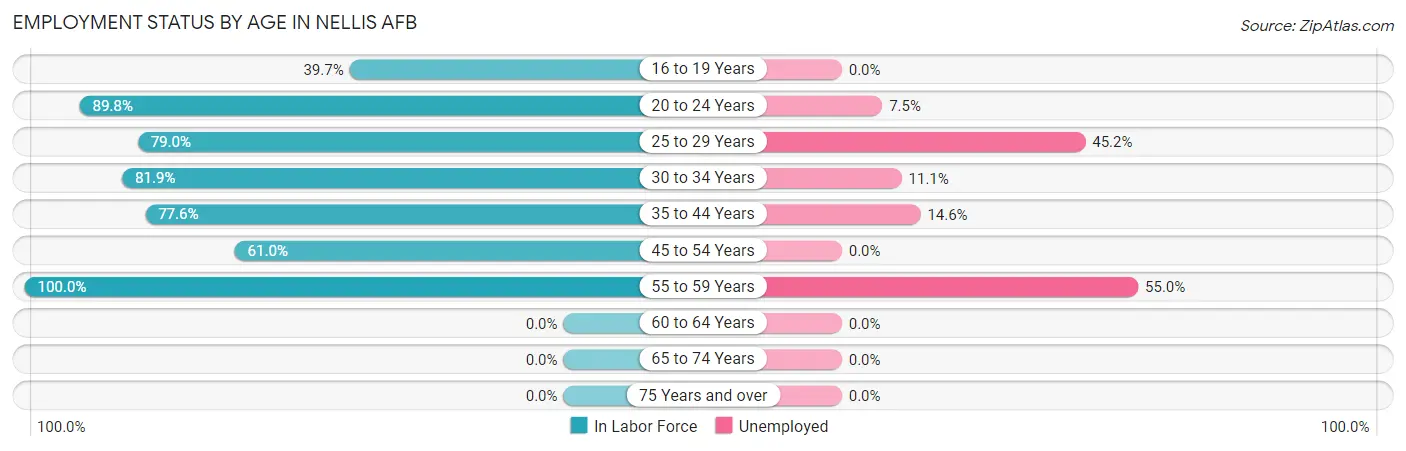
| Age Bracket | In Labor Force | Unemployed |
| 16 to 19 Years | 89 (39.7%) | 0 (0.0%) |
| 20 to 24 Years | 529 (89.8%) | 40 (7.5%) |
| 25 to 29 Years | 497 (79.0%) | 225 (45.2%) |
| 30 to 34 Years | 415 (81.9%) | 46 (11.1%) |
| 35 to 44 Years | 363 (77.6%) | 53 (14.6%) |
| 45 to 54 Years | 61 (61.0%) | 0 (0.0%) |
| 55 to 59 Years | 20 (100.0%) | 11 (55.0%) |
| 60 to 64 Years | 0 (0.0%) | 0 (0.0%) |
| 65 to 74 Years | 0 (0.0%) | 0 (0.0%) |
| 75 Years and over | 0 (0.0%) | 0 (0.0%) |
| Total | 1,974 (77.5%) | 442 (22.4%) |
Employment Status by Educational Attainment in Nellis AFB
According to labor force statistics for Nellis AFB, 78.7% of individuals (1,357) out of the total population between 25 and 64 years of age (1,724) are in the labor force, with 27.1% or 368 of them being unemployed. The group with the highest labor force participation rate are those with the educational attainment of college / associate degree, with 85.7% or 931 individuals in the labor force. Within the labor force, individuals with less than high school education have the highest percentage of unemployment, with 100.0% or 4 of them being unemployed.
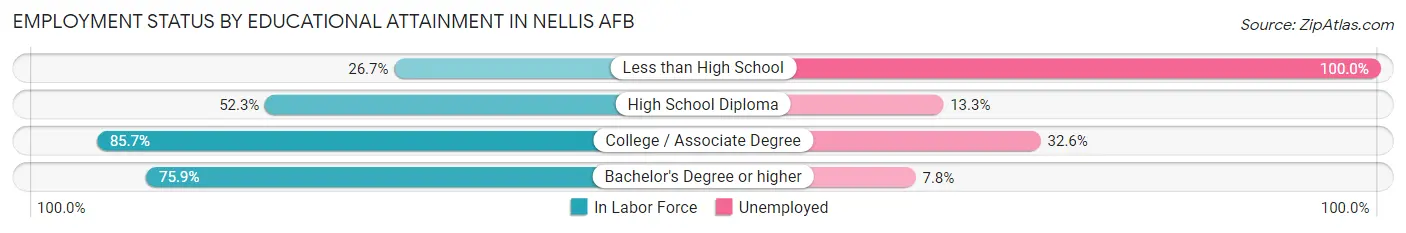
| Educational Attainment | In Labor Force | Unemployed |
| Less than High School | 4 (26.7%) | 15 (100.0%) |
| High School Diploma | 115 (52.3%) | 29 (13.3%) |
| College / Associate Degree | 931 (85.7%) | 354 (32.6%) |
| Bachelor's Degree or higher | 306 (75.9%) | 31 (7.8%) |
| Total | 1,357 (78.7%) | 467 (27.1%) |
Employment Occupations by Sex in Nellis AFB
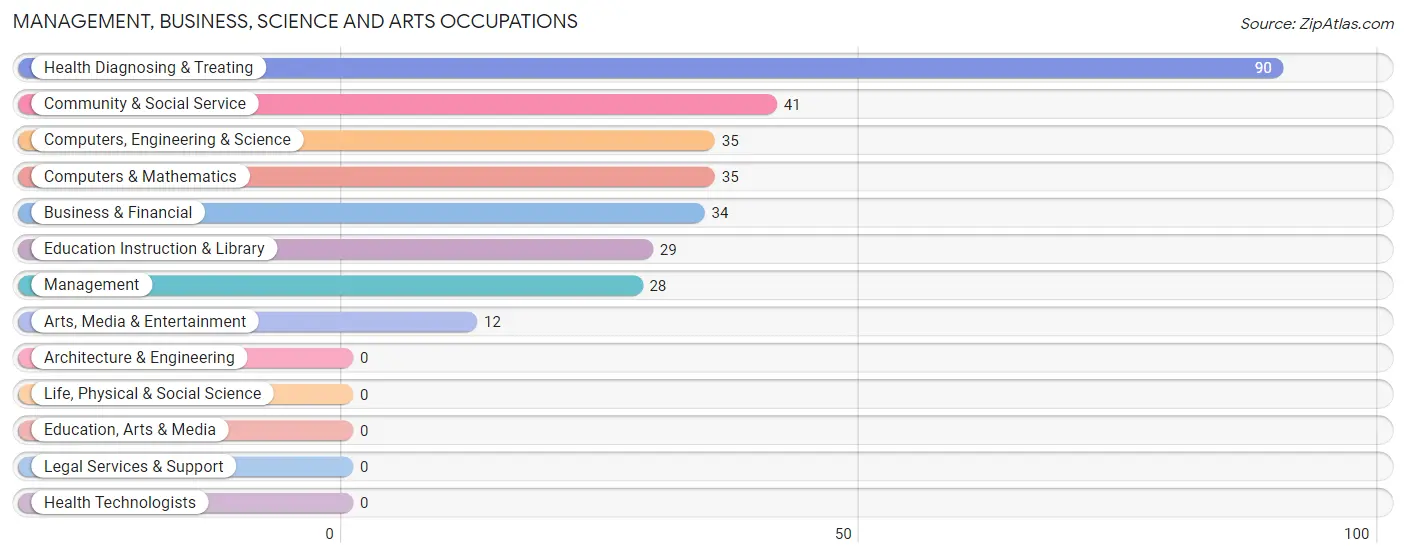
Management, Business, Science and Arts Occupations
The most common Management, Business, Science and Arts occupations in Nellis AFB are Health Diagnosing & Treating (90 | 13.0%), Community & Social Service (41 | 5.9%), Computers, Engineering & Science (35 | 5.0%), Computers & Mathematics (35 | 5.0%), and Business & Financial (34 | 4.9%).
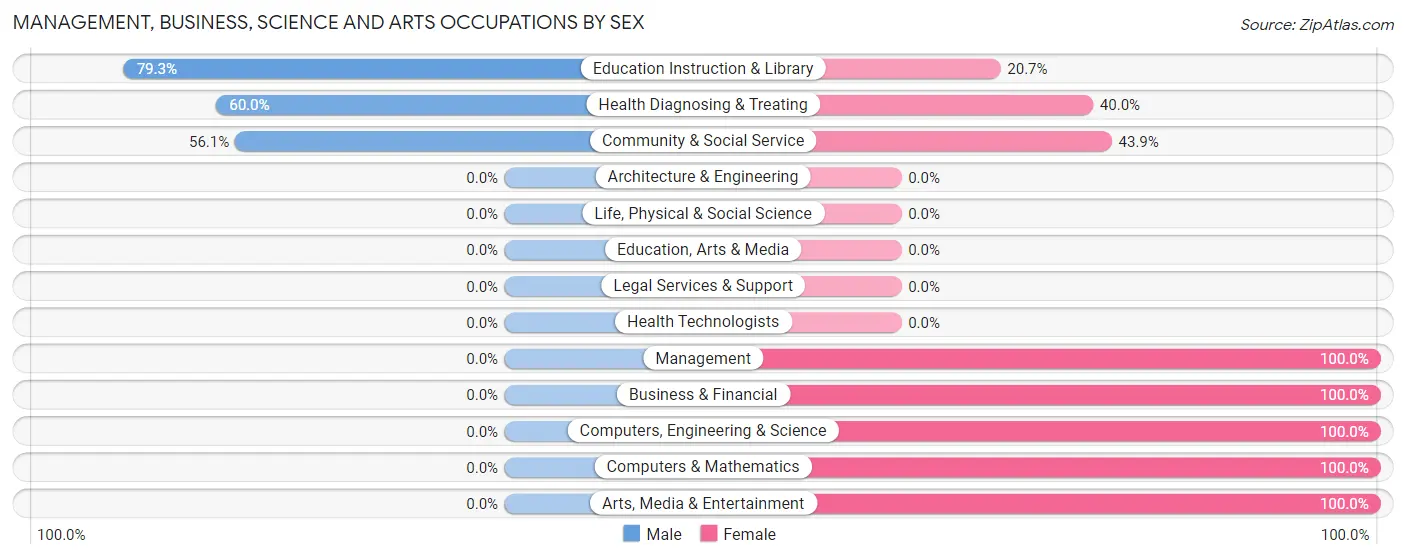
Management, Business, Science and Arts Occupations by Sex
Within the Management, Business, Science and Arts occupations in Nellis AFB, the most male-oriented occupations are Education Instruction & Library (79.3%), Health Diagnosing & Treating (60.0%), and Community & Social Service (56.1%), while the most female-oriented occupations are Management (100.0%), Business & Financial (100.0%), and Computers, Engineering & Science (100.0%).
| Occupation | Male | Female |
| Management | 0 (0.0%) | 28 (100.0%) |
| Business & Financial | 0 (0.0%) | 34 (100.0%) |
| Computers, Engineering & Science | 0 (0.0%) | 35 (100.0%) |
| Computers & Mathematics | 0 (0.0%) | 35 (100.0%) |
| Architecture & Engineering | 0 (0.0%) | 0 (0.0%) |
| Life, Physical & Social Science | 0 (0.0%) | 0 (0.0%) |
| Community & Social Service | 23 (56.1%) | 18 (43.9%) |
| Education, Arts & Media | 0 (0.0%) | 0 (0.0%) |
| Legal Services & Support | 0 (0.0%) | 0 (0.0%) |
| Education Instruction & Library | 23 (79.3%) | 6 (20.7%) |
| Arts, Media & Entertainment | 0 (0.0%) | 12 (100.0%) |
| Health Diagnosing & Treating | 54 (60.0%) | 36 (40.0%) |
| Health Technologists | 0 (0.0%) | 0 (0.0%) |
| Total (Category) | 77 (33.8%) | 151 (66.2%) |
| Total (Overall) | 240 (34.5%) | 455 (65.5%) |
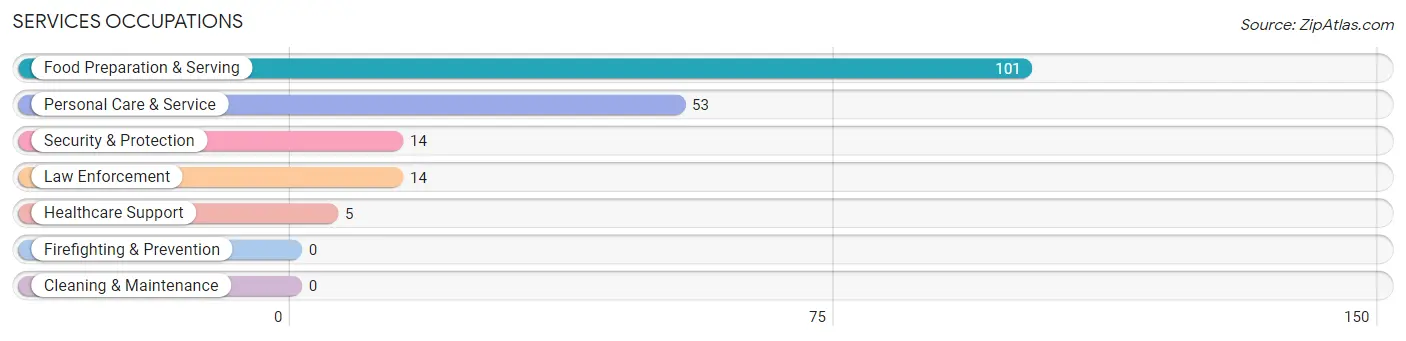
Services Occupations
The most common Services occupations in Nellis AFB are Food Preparation & Serving (101 | 14.5%), Personal Care & Service (53 | 7.6%), Security & Protection (14 | 2.0%), Law Enforcement (14 | 2.0%), and Healthcare Support (5 | 0.7%).
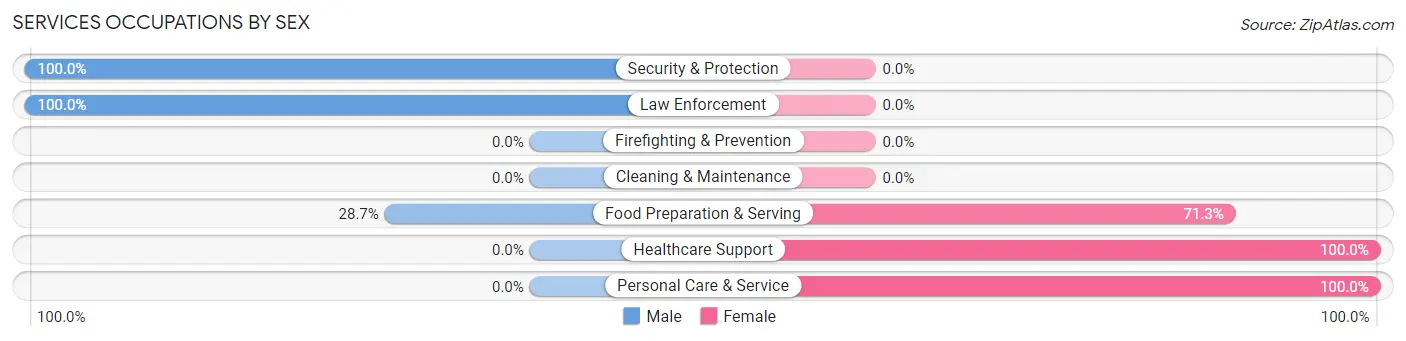
Services Occupations by Sex
Within the Services occupations in Nellis AFB, the most male-oriented occupations are Security & Protection (100.0%), Law Enforcement (100.0%), and Food Preparation & Serving (28.7%), while the most female-oriented occupations are Healthcare Support (100.0%), Personal Care & Service (100.0%), and Food Preparation & Serving (71.3%).
| Occupation | Male | Female |
| Healthcare Support | 0 (0.0%) | 5 (100.0%) |
| Security & Protection | 14 (100.0%) | 0 (0.0%) |
| Firefighting & Prevention | 0 (0.0%) | 0 (0.0%) |
| Law Enforcement | 14 (100.0%) | 0 (0.0%) |
| Food Preparation & Serving | 29 (28.7%) | 72 (71.3%) |
| Cleaning & Maintenance | 0 (0.0%) | 0 (0.0%) |
| Personal Care & Service | 0 (0.0%) | 53 (100.0%) |
| Total (Category) | 43 (24.9%) | 130 (75.1%) |
| Total (Overall) | 240 (34.5%) | 455 (65.5%) |
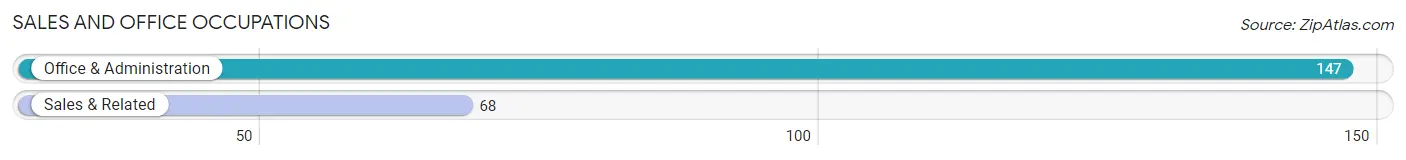
Sales and Office Occupations
The most common Sales and Office occupations in Nellis AFB are Office & Administration (147 | 21.1%), and Sales & Related (68 | 9.8%).
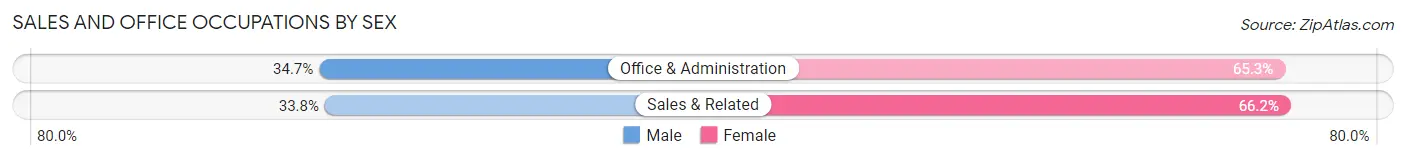
Sales and Office Occupations by Sex
| Occupation | Male | Female |
| Sales & Related | 23 (33.8%) | 45 (66.2%) |
| Office & Administration | 51 (34.7%) | 96 (65.3%) |
| Total (Category) | 74 (34.4%) | 141 (65.6%) |
| Total (Overall) | 240 (34.5%) | 455 (65.5%) |
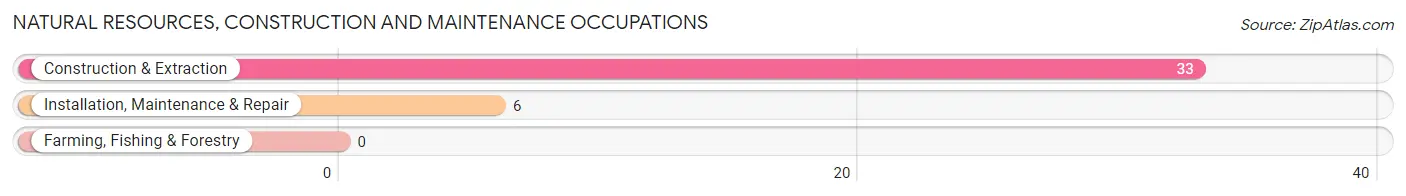
Natural Resources, Construction and Maintenance Occupations
The most common Natural Resources, Construction and Maintenance occupations in Nellis AFB are Construction & Extraction (33 | 4.8%), and Installation, Maintenance & Repair (6 | 0.9%).
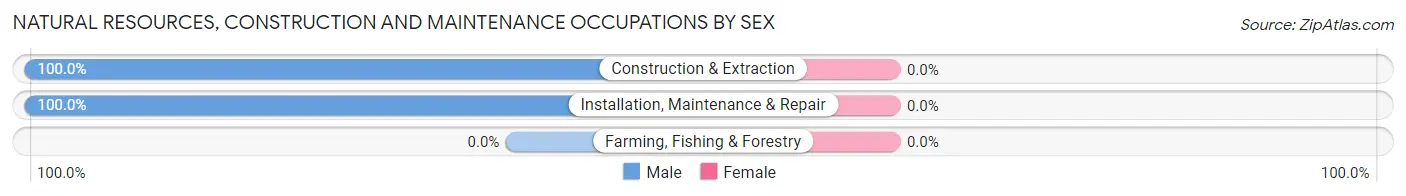
Natural Resources, Construction and Maintenance Occupations by Sex
| Occupation | Male | Female |
| Farming, Fishing & Forestry | 0 (0.0%) | 0 (0.0%) |
| Construction & Extraction | 33 (100.0%) | 0 (0.0%) |
| Installation, Maintenance & Repair | 6 (100.0%) | 0 (0.0%) |
| Total (Category) | 39 (100.0%) | 0 (0.0%) |
| Total (Overall) | 240 (34.5%) | 455 (65.5%) |
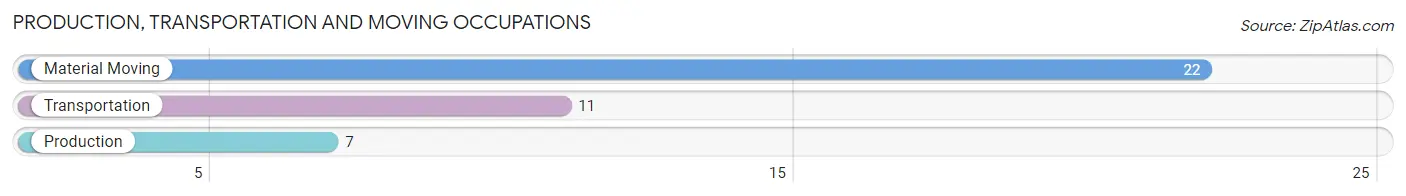
Production, Transportation and Moving Occupations
The most common Production, Transportation and Moving occupations in Nellis AFB are Material Moving (22 | 3.2%), Transportation (11 | 1.6%), and Production (7 | 1.0%).
Production, Transportation and Moving Occupations by Sex
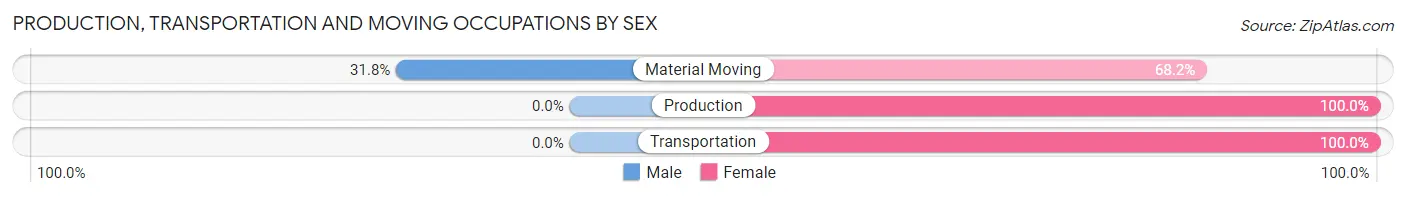
| Occupation | Male | Female |
| Production | 0 (0.0%) | 7 (100.0%) |
| Transportation | 0 (0.0%) | 11 (100.0%) |
| Material Moving | 7 (31.8%) | 15 (68.2%) |
| Total (Category) | 7 (17.5%) | 33 (82.5%) |
| Total (Overall) | 240 (34.5%) | 455 (65.5%) |
Employment Industries by Sex in Nellis AFB
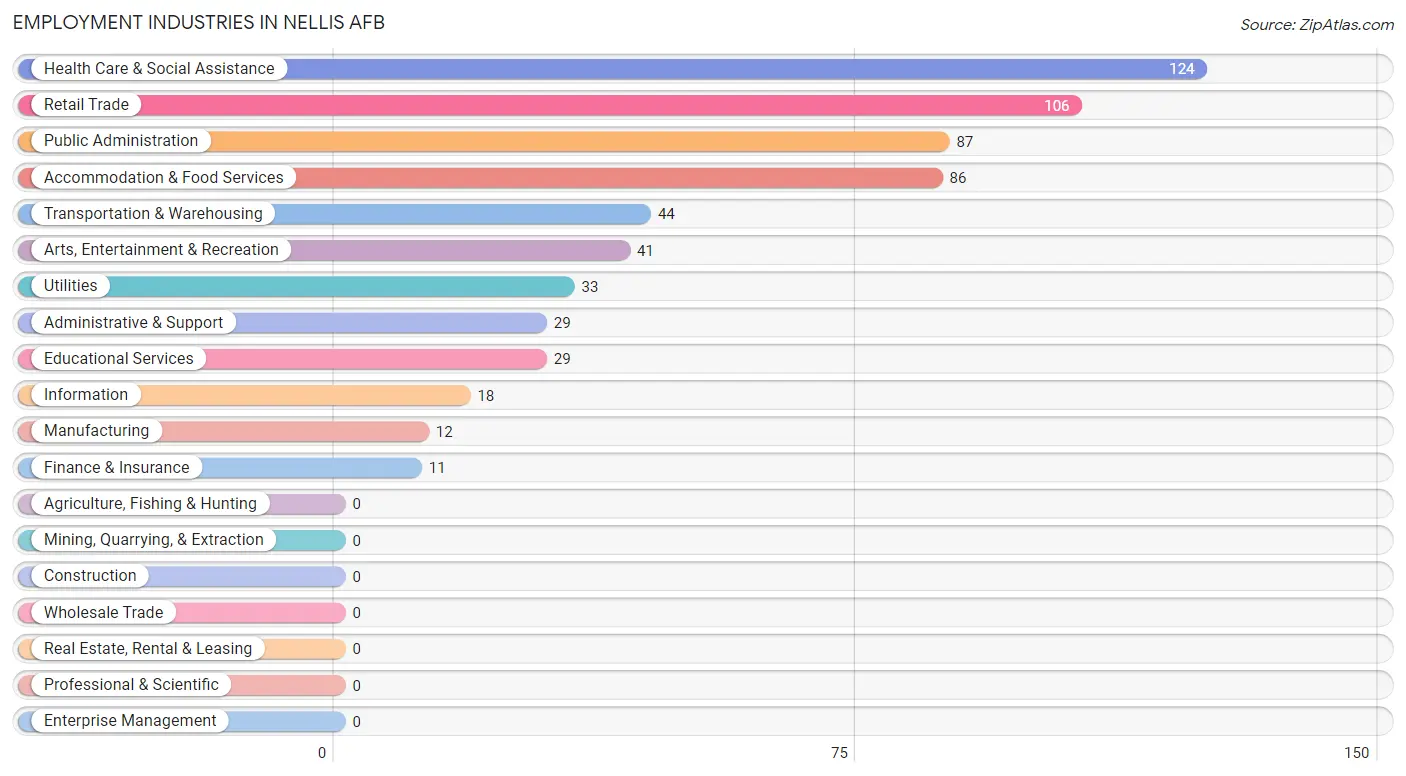
Employment Industries in Nellis AFB
The major employment industries in Nellis AFB include Health Care & Social Assistance (124 | 17.8%), Retail Trade (106 | 15.2%), Public Administration (87 | 12.5%), Accommodation & Food Services (86 | 12.4%), and Transportation & Warehousing (44 | 6.3%).
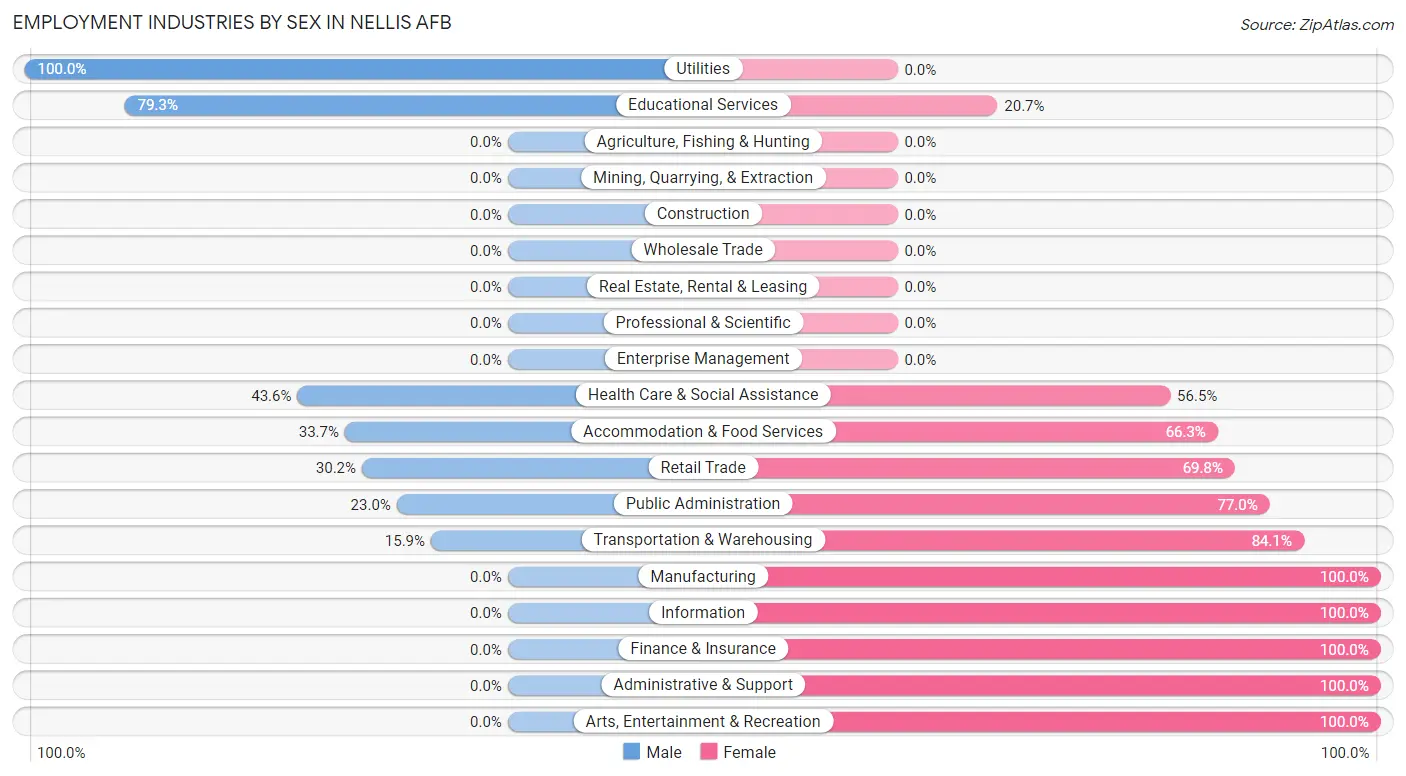
Employment Industries by Sex in Nellis AFB
The Nellis AFB industries that see more men than women are Utilities (100.0%), Educational Services (79.3%), and Health Care & Social Assistance (43.5%), whereas the industries that tend to have a higher number of women are Manufacturing (100.0%), Information (100.0%), and Finance & Insurance (100.0%).
| Industry | Male | Female |
| Agriculture, Fishing & Hunting | 0 (0.0%) | 0 (0.0%) |
| Mining, Quarrying, & Extraction | 0 (0.0%) | 0 (0.0%) |
| Construction | 0 (0.0%) | 0 (0.0%) |
| Manufacturing | 0 (0.0%) | 12 (100.0%) |
| Wholesale Trade | 0 (0.0%) | 0 (0.0%) |
| Retail Trade | 32 (30.2%) | 74 (69.8%) |
| Transportation & Warehousing | 7 (15.9%) | 37 (84.1%) |
| Utilities | 33 (100.0%) | 0 (0.0%) |
| Information | 0 (0.0%) | 18 (100.0%) |
| Finance & Insurance | 0 (0.0%) | 11 (100.0%) |
| Real Estate, Rental & Leasing | 0 (0.0%) | 0 (0.0%) |
| Professional & Scientific | 0 (0.0%) | 0 (0.0%) |
| Enterprise Management | 0 (0.0%) | 0 (0.0%) |
| Administrative & Support | 0 (0.0%) | 29 (100.0%) |
| Educational Services | 23 (79.3%) | 6 (20.7%) |
| Health Care & Social Assistance | 54 (43.5%) | 70 (56.5%) |
| Arts, Entertainment & Recreation | 0 (0.0%) | 41 (100.0%) |
| Accommodation & Food Services | 29 (33.7%) | 57 (66.3%) |
| Public Administration | 20 (23.0%) | 67 (77.0%) |
| Total | 240 (34.5%) | 455 (65.5%) |
Education in Nellis AFB
School Enrollment in Nellis AFB
The most common levels of schooling among the 1,875 students in Nellis AFB are elementary school (549 | 29.3%), college / undergraduate (422 | 22.5%), and kindergarten (242 | 12.9%).
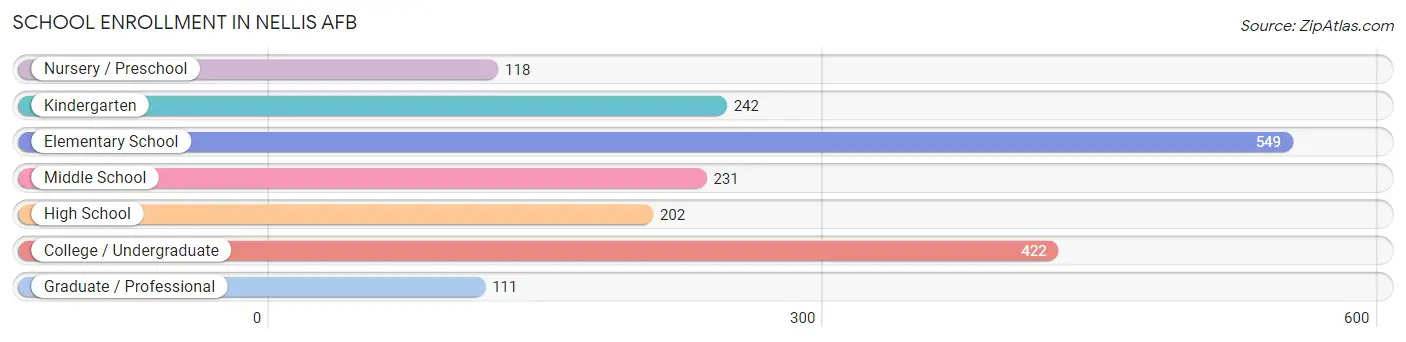
| School Level | # Students | % Students |
| Nursery / Preschool | 118 | 6.3% |
| Kindergarten | 242 | 12.9% |
| Elementary School | 549 | 29.3% |
| Middle School | 231 | 12.3% |
| High School | 202 | 10.8% |
| College / Undergraduate | 422 | 22.5% |
| Graduate / Professional | 111 | 5.9% |
| Total | 1,875 | 100.0% |
School Enrollment by Age by Funding Source in Nellis AFB
Out of a total of 1,875 students who are enrolled in schools in Nellis AFB, 622 (33.2%) attend a private institution, while the remaining 1,252 (66.8%) are enrolled in public schools. The age group of 35 years and over has the highest likelihood of being enrolled in private schools, with 14 (100.0% in the age bracket) enrolled. Conversely, the age group of 18 to 19 year olds has the lowest likelihood of being enrolled in a private school, with 1 (100.0% in the age bracket) attending a public institution.
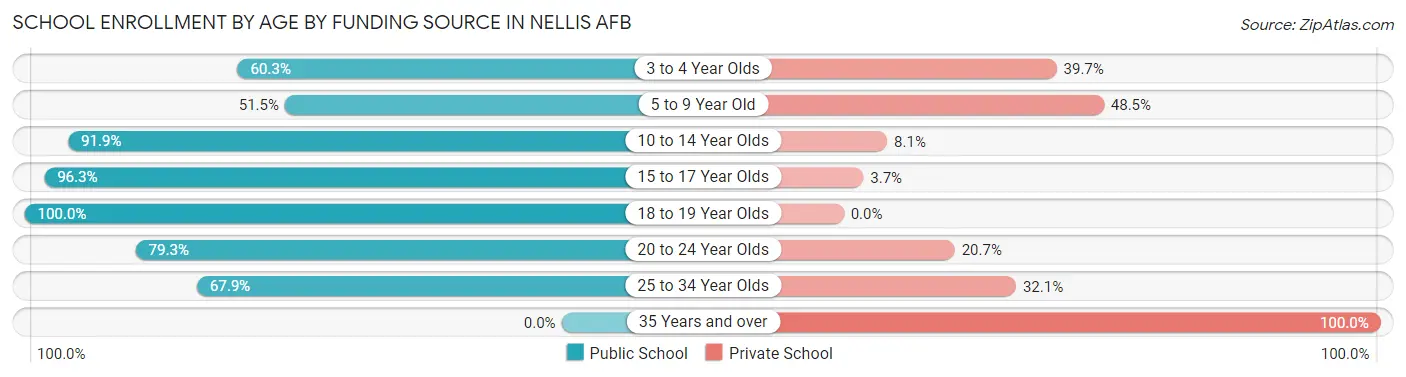
| Age Bracket | Public School | Private School |
| 3 to 4 Year Olds | 35 (60.3%) | 23 (39.7%) |
| 5 to 9 Year Old | 434 (51.5%) | 408 (48.5%) |
| 10 to 14 Year Olds | 227 (91.9%) | 20 (8.1%) |
| 15 to 17 Year Olds | 184 (96.3%) | 7 (3.7%) |
| 18 to 19 Year Olds | 1 (100.0%) | 0 (0.0%) |
| 20 to 24 Year Olds | 115 (79.3%) | 30 (20.7%) |
| 25 to 34 Year Olds | 256 (67.9%) | 121 (32.1%) |
| 35 Years and over | 0 (0.0%) | 14 (100.0%) |
| Total | 1,252 (66.8%) | 622 (33.2%) |
Educational Attainment by Field of Study in Nellis AFB
Social sciences (90 | 21.6%), arts & humanities (63 | 15.1%), psychology (61 | 14.6%), business (52 | 12.5%), and science & technology (35 | 8.4%) are the most common fields of study among 417 individuals in Nellis AFB who have obtained a bachelor's degree or higher.
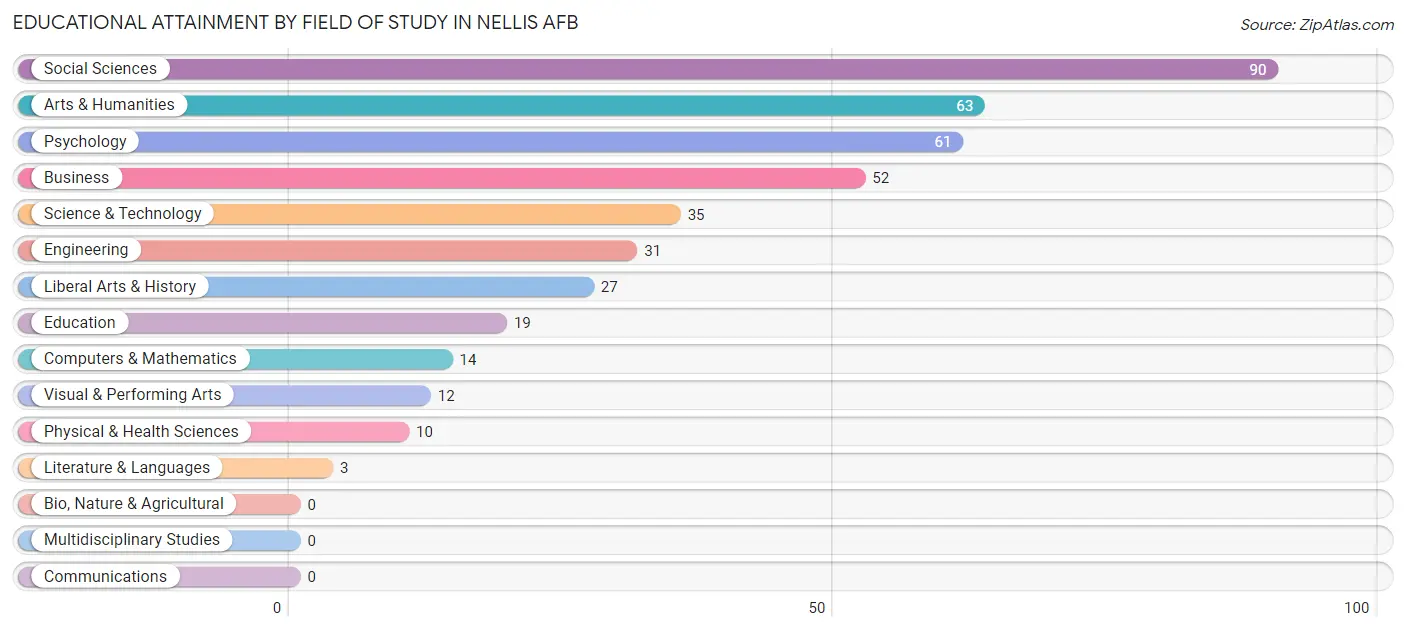
| Field of Study | # Graduates | % Graduates |
| Computers & Mathematics | 14 | 3.4% |
| Bio, Nature & Agricultural | 0 | 0.0% |
| Physical & Health Sciences | 10 | 2.4% |
| Psychology | 61 | 14.6% |
| Social Sciences | 90 | 21.6% |
| Engineering | 31 | 7.4% |
| Multidisciplinary Studies | 0 | 0.0% |
| Science & Technology | 35 | 8.4% |
| Business | 52 | 12.5% |
| Education | 19 | 4.6% |
| Literature & Languages | 3 | 0.7% |
| Liberal Arts & History | 27 | 6.5% |
| Visual & Performing Arts | 12 | 2.9% |
| Communications | 0 | 0.0% |
| Arts & Humanities | 63 | 15.1% |
| Total | 417 | 100.0% |
Transportation & Commute in Nellis AFB
Vehicle Availability by Sex in Nellis AFB
The most prevalent vehicle ownership categories in Nellis AFB are males with 2 vehicles (760, accounting for 82.8%) and females with 2 vehicles (331, making up 136.9%).
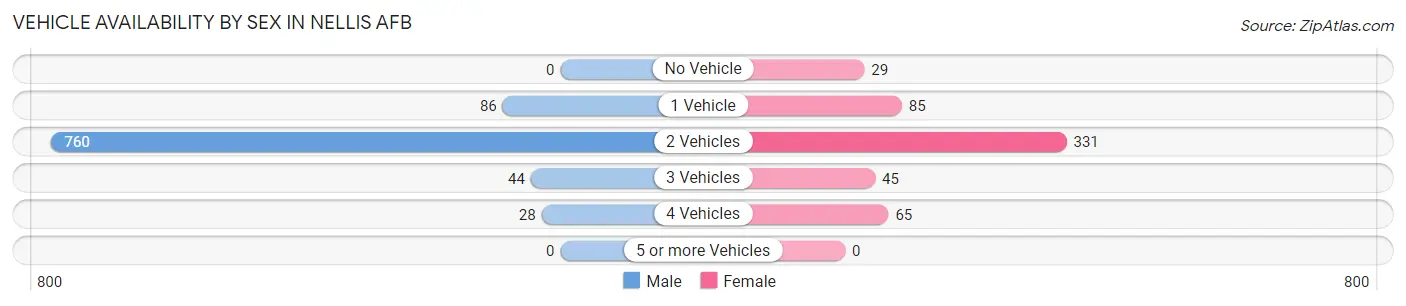
| Vehicles Available | Male | Female |
| No Vehicle | 0 (0.0%) | 29 (5.2%) |
| 1 Vehicle | 86 (9.4%) | 85 (15.3%) |
| 2 Vehicles | 760 (82.8%) | 331 (59.6%) |
| 3 Vehicles | 44 (4.8%) | 45 (8.1%) |
| 4 Vehicles | 28 (3.0%) | 65 (11.7%) |
| 5 or more Vehicles | 0 (0.0%) | 0 (0.0%) |
| Total | 918 (100.0%) | 555 (100.0%) |
Commute Time in Nellis AFB
The most frequently occuring commute durations in Nellis AFB are 5 to 9 minutes (495 commuters, 28.1%), 10 to 14 minutes (478 commuters, 27.2%), and 15 to 19 minutes (245 commuters, 13.9%).
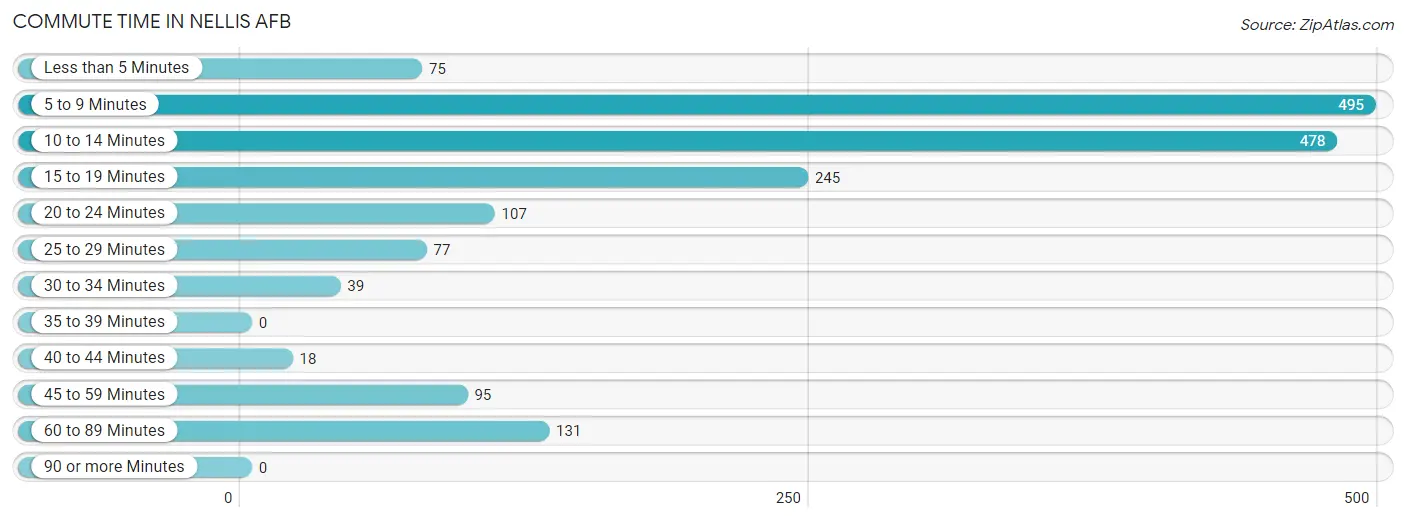
| Commute Time | # Commuters | % Commuters |
| Less than 5 Minutes | 75 | 4.3% |
| 5 to 9 Minutes | 495 | 28.1% |
| 10 to 14 Minutes | 478 | 27.2% |
| 15 to 19 Minutes | 245 | 13.9% |
| 20 to 24 Minutes | 107 | 6.1% |
| 25 to 29 Minutes | 77 | 4.4% |
| 30 to 34 Minutes | 39 | 2.2% |
| 35 to 39 Minutes | 0 | 0.0% |
| 40 to 44 Minutes | 18 | 1.0% |
| 45 to 59 Minutes | 95 | 5.4% |
| 60 to 89 Minutes | 131 | 7.4% |
| 90 or more Minutes | 0 | 0.0% |
Commute Time by Sex in Nellis AFB
The most common commute times in Nellis AFB are 10 to 14 minutes (382 commuters, 33.1%) for males and 5 to 9 minutes (160 commuters, 26.4%) for females.
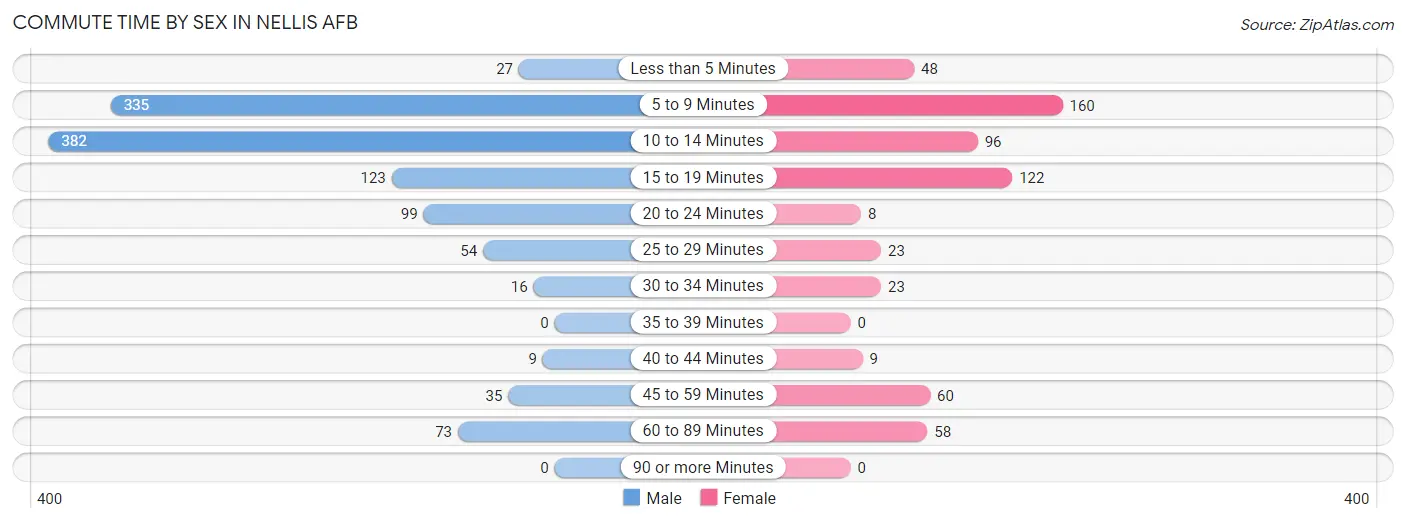
| Commute Time | Male | Female |
| Less than 5 Minutes | 27 (2.3%) | 48 (7.9%) |
| 5 to 9 Minutes | 335 (29.0%) | 160 (26.4%) |
| 10 to 14 Minutes | 382 (33.1%) | 96 (15.8%) |
| 15 to 19 Minutes | 123 (10.7%) | 122 (20.1%) |
| 20 to 24 Minutes | 99 (8.6%) | 8 (1.3%) |
| 25 to 29 Minutes | 54 (4.7%) | 23 (3.8%) |
| 30 to 34 Minutes | 16 (1.4%) | 23 (3.8%) |
| 35 to 39 Minutes | 0 (0.0%) | 0 (0.0%) |
| 40 to 44 Minutes | 9 (0.8%) | 9 (1.5%) |
| 45 to 59 Minutes | 35 (3.0%) | 60 (9.9%) |
| 60 to 89 Minutes | 73 (6.3%) | 58 (9.6%) |
| 90 or more Minutes | 0 (0.0%) | 0 (0.0%) |
Time of Departure to Work by Sex in Nellis AFB
The most frequent times of departure to work in Nellis AFB are 12:00 PM to 3:59 PM (300, 26.0%) for males and 7:00 AM to 7:29 AM (111, 18.3%) for females.
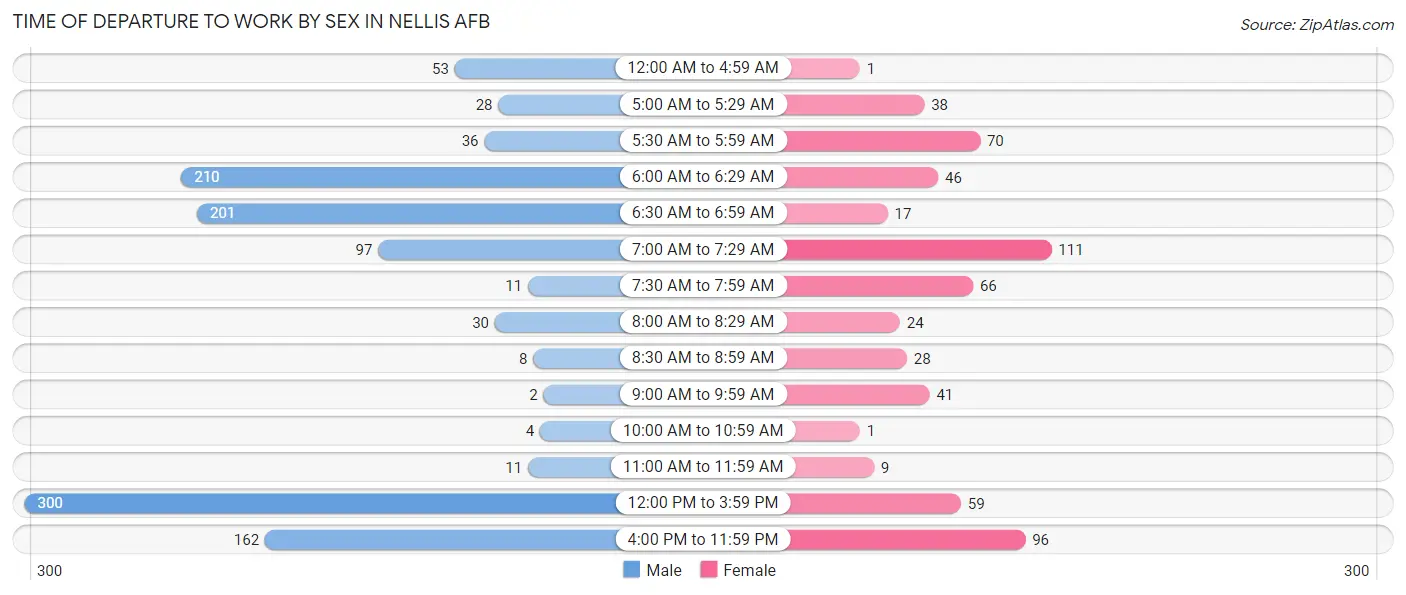
| Time of Departure | Male | Female |
| 12:00 AM to 4:59 AM | 53 (4.6%) | 1 (0.2%) |
| 5:00 AM to 5:29 AM | 28 (2.4%) | 38 (6.3%) |
| 5:30 AM to 5:59 AM | 36 (3.1%) | 70 (11.5%) |
| 6:00 AM to 6:29 AM | 210 (18.2%) | 46 (7.6%) |
| 6:30 AM to 6:59 AM | 201 (17.4%) | 17 (2.8%) |
| 7:00 AM to 7:29 AM | 97 (8.4%) | 111 (18.3%) |
| 7:30 AM to 7:59 AM | 11 (0.9%) | 66 (10.9%) |
| 8:00 AM to 8:29 AM | 30 (2.6%) | 24 (4.0%) |
| 8:30 AM to 8:59 AM | 8 (0.7%) | 28 (4.6%) |
| 9:00 AM to 9:59 AM | 2 (0.2%) | 41 (6.8%) |
| 10:00 AM to 10:59 AM | 4 (0.4%) | 1 (0.2%) |
| 11:00 AM to 11:59 AM | 11 (0.9%) | 9 (1.5%) |
| 12:00 PM to 3:59 PM | 300 (26.0%) | 59 (9.7%) |
| 4:00 PM to 11:59 PM | 162 (14.1%) | 96 (15.8%) |
| Total | 1,153 (100.0%) | 607 (100.0%) |
Housing Occupancy in Nellis AFB
Occupancy by Ownership in Nellis AFB
Of the total 1,076 dwellings in Nellis AFB, owner-occupied units account for 49 (4.5%), while renter-occupied units make up 1,027 (95.5%).
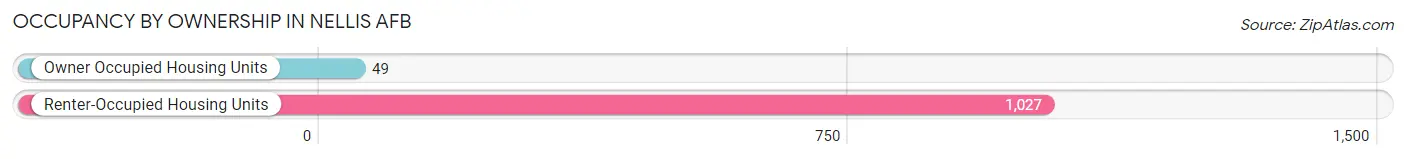
| Occupancy | # Housing Units | % Housing Units |
| Owner Occupied Housing Units | 49 | 4.5% |
| Renter-Occupied Housing Units | 1,027 | 95.5% |
| Total Occupied Housing Units | 1,076 | 100.0% |
Occupancy by Household Size in Nellis AFB
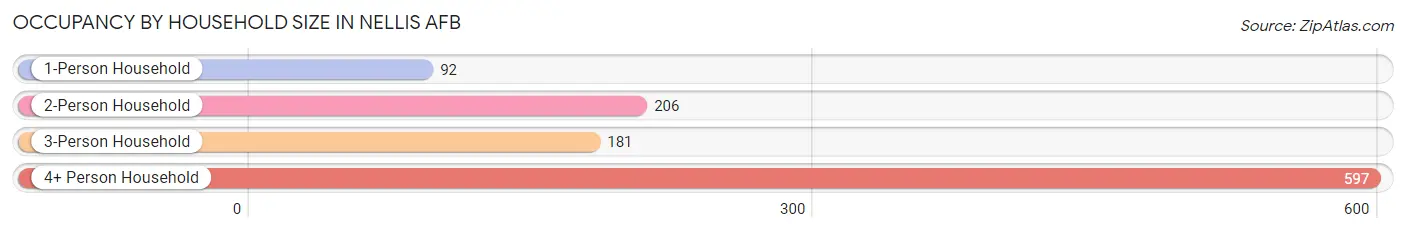
| Household Size | # Housing Units | % Housing Units |
| 1-Person Household | 92 | 8.6% |
| 2-Person Household | 206 | 19.1% |
| 3-Person Household | 181 | 16.8% |
| 4+ Person Household | 597 | 55.5% |
| Total Housing Units | 1,076 | 100.0% |
Occupancy by Ownership by Household Size in Nellis AFB
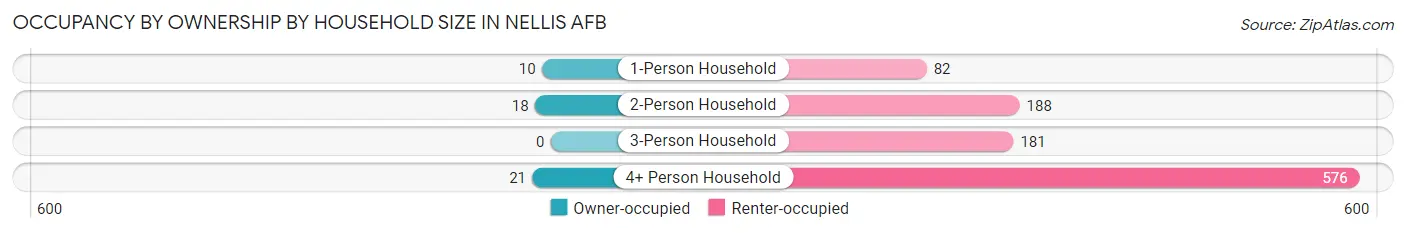
| Household Size | Owner-occupied | Renter-occupied |
| 1-Person Household | 10 (10.9%) | 82 (89.1%) |
| 2-Person Household | 18 (8.7%) | 188 (91.3%) |
| 3-Person Household | 0 (0.0%) | 181 (100.0%) |
| 4+ Person Household | 21 (3.5%) | 576 (96.5%) |
| Total Housing Units | 49 (4.5%) | 1,027 (95.5%) |
Occupancy by Educational Attainment in Nellis AFB
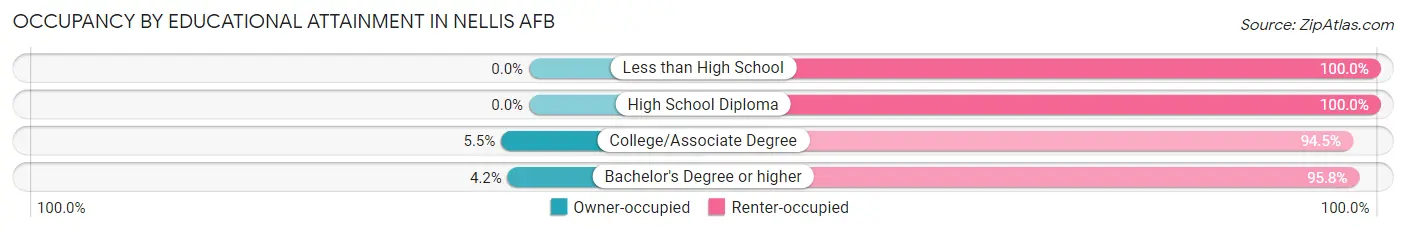
| Household Size | Owner-occupied | Renter-occupied |
| Less than High School | 0 (0.0%) | 19 (100.0%) |
| High School Diploma | 0 (0.0%) | 115 (100.0%) |
| College/Associate Degree | 39 (5.5%) | 667 (94.5%) |
| Bachelor's Degree or higher | 10 (4.2%) | 226 (95.8%) |
Occupancy by Age of Householder in Nellis AFB
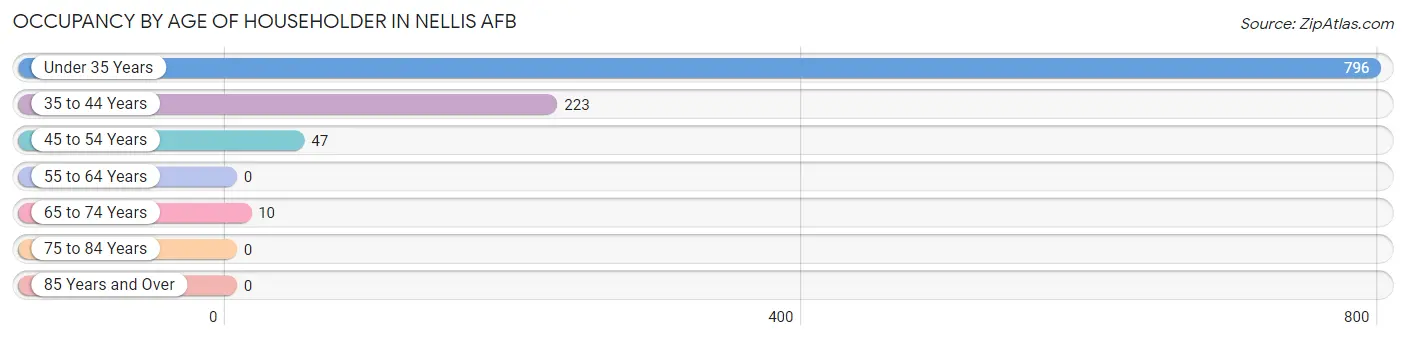
| Age Bracket | # Households | % Households |
| Under 35 Years | 796 | 74.0% |
| 35 to 44 Years | 223 | 20.7% |
| 45 to 54 Years | 47 | 4.4% |
| 55 to 64 Years | 0 | 0.0% |
| 65 to 74 Years | 10 | 0.9% |
| 75 to 84 Years | 0 | 0.0% |
| 85 Years and Over | 0 | 0.0% |
| Total | 1,076 | 100.0% |
Housing Finances in Nellis AFB
Median Income by Occupancy in Nellis AFB
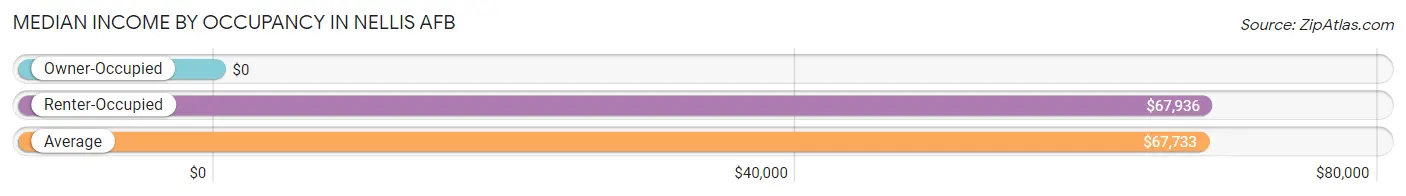
| Occupancy Type | # Households | Median Income |
| Owner-Occupied | 49 (4.5%) | $0 |
| Renter-Occupied | 1,027 (95.5%) | $67,936 |
| Average | 1,076 (100.0%) | $67,733 |
Occupancy by Householder Income Bracket in Nellis AFB
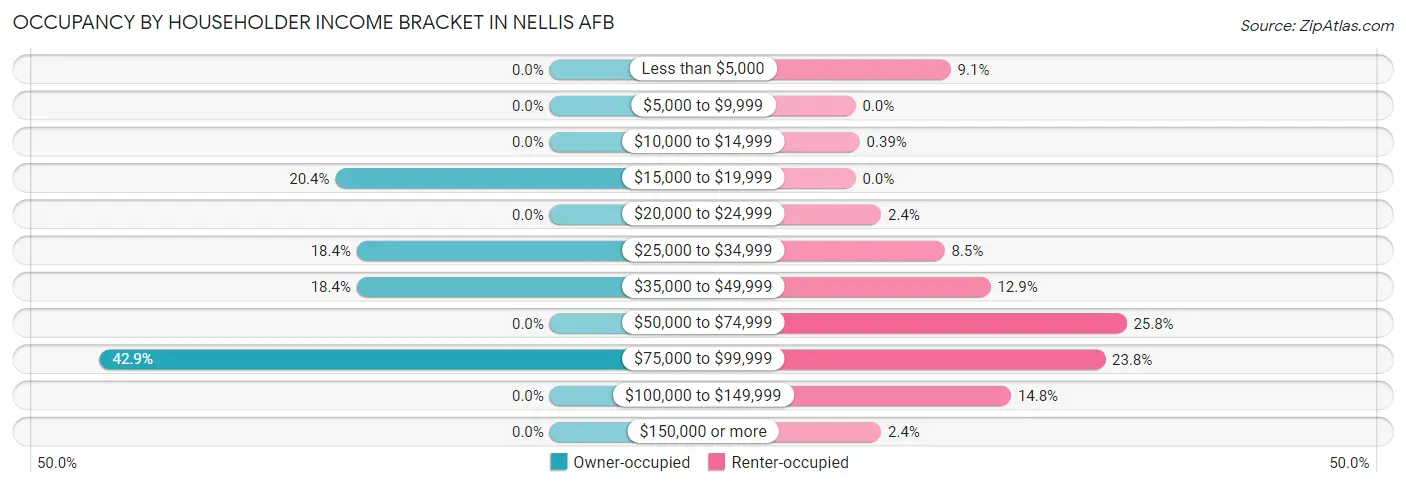
| Income Bracket | Owner-occupied | Renter-occupied |
| Less than $5,000 | 0 (0.0%) | 93 (9.1%) |
| $5,000 to $9,999 | 0 (0.0%) | 0 (0.0%) |
| $10,000 to $14,999 | 0 (0.0%) | 4 (0.4%) |
| $15,000 to $19,999 | 10 (20.4%) | 0 (0.0%) |
| $20,000 to $24,999 | 0 (0.0%) | 25 (2.4%) |
| $25,000 to $34,999 | 9 (18.4%) | 87 (8.5%) |
| $35,000 to $49,999 | 9 (18.4%) | 132 (12.9%) |
| $50,000 to $74,999 | 0 (0.0%) | 265 (25.8%) |
| $75,000 to $99,999 | 21 (42.9%) | 244 (23.8%) |
| $100,000 to $149,999 | 0 (0.0%) | 152 (14.8%) |
| $150,000 or more | 0 (0.0%) | 25 (2.4%) |
| Total | 49 (100.0%) | 1,027 (100.0%) |
Monthly Housing Cost Tiers in Nellis AFB
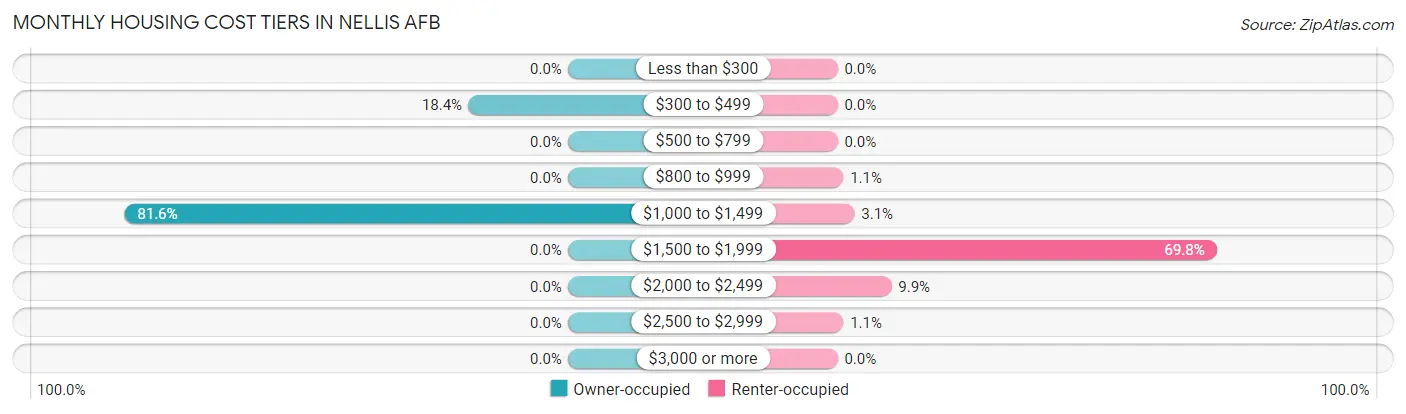
| Monthly Cost | Owner-occupied | Renter-occupied |
| Less than $300 | 0 (0.0%) | 0 (0.0%) |
| $300 to $499 | 9 (18.4%) | 0 (0.0%) |
| $500 to $799 | 0 (0.0%) | 0 (0.0%) |
| $800 to $999 | 0 (0.0%) | 11 (1.1%) |
| $1,000 to $1,499 | 40 (81.6%) | 32 (3.1%) |
| $1,500 to $1,999 | 0 (0.0%) | 717 (69.8%) |
| $2,000 to $2,499 | 0 (0.0%) | 102 (9.9%) |
| $2,500 to $2,999 | 0 (0.0%) | 11 (1.1%) |
| $3,000 or more | 0 (0.0%) | 0 (0.0%) |
| Total | 49 (100.0%) | 1,027 (100.0%) |
Physical Housing Characteristics in Nellis AFB
Housing Structures in Nellis AFB
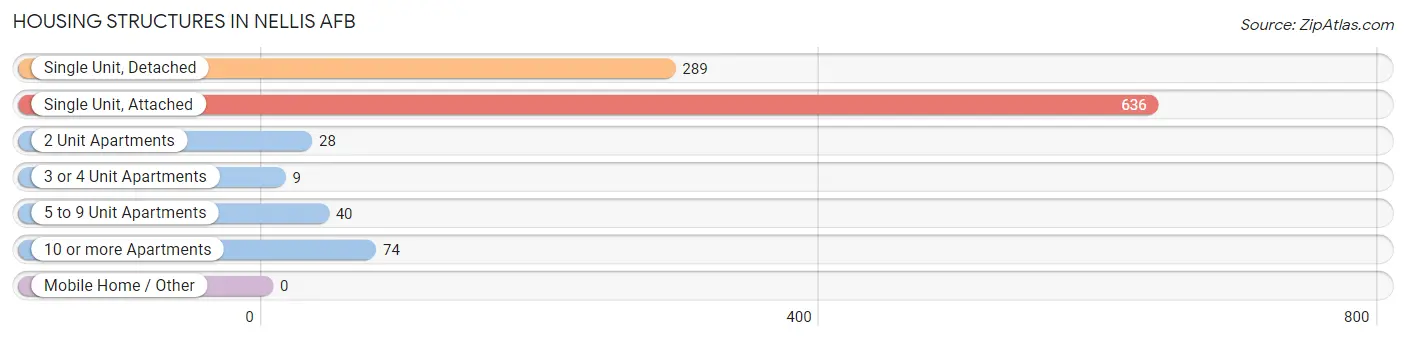
| Structure Type | # Housing Units | % Housing Units |
| Single Unit, Detached | 289 | 26.9% |
| Single Unit, Attached | 636 | 59.1% |
| 2 Unit Apartments | 28 | 2.6% |
| 3 or 4 Unit Apartments | 9 | 0.8% |
| 5 to 9 Unit Apartments | 40 | 3.7% |
| 10 or more Apartments | 74 | 6.9% |
| Mobile Home / Other | 0 | 0.0% |
| Total | 1,076 | 100.0% |
Housing Structures by Occupancy in Nellis AFB
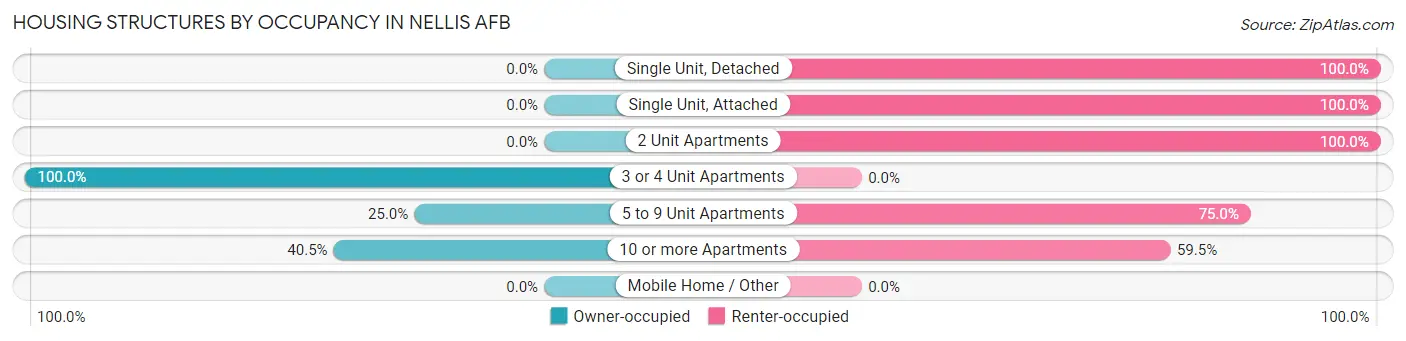
| Structure Type | Owner-occupied | Renter-occupied |
| Single Unit, Detached | 0 (0.0%) | 289 (100.0%) |
| Single Unit, Attached | 0 (0.0%) | 636 (100.0%) |
| 2 Unit Apartments | 0 (0.0%) | 28 (100.0%) |
| 3 or 4 Unit Apartments | 9 (100.0%) | 0 (0.0%) |
| 5 to 9 Unit Apartments | 10 (25.0%) | 30 (75.0%) |
| 10 or more Apartments | 30 (40.5%) | 44 (59.5%) |
| Mobile Home / Other | 0 (0.0%) | 0 (0.0%) |
| Total | 49 (4.5%) | 1,027 (95.5%) |
Housing Structures by Number of Rooms in Nellis AFB
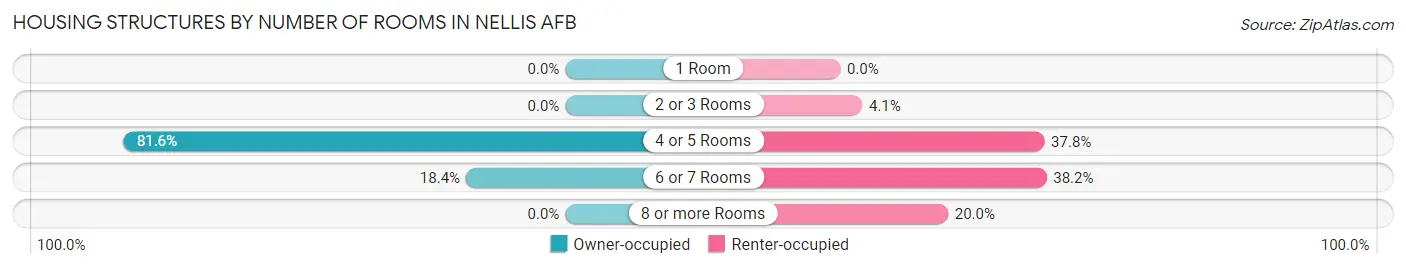
| Number of Rooms | Owner-occupied | Renter-occupied |
| 1 Room | 0 (0.0%) | 0 (0.0%) |
| 2 or 3 Rooms | 0 (0.0%) | 42 (4.1%) |
| 4 or 5 Rooms | 40 (81.6%) | 388 (37.8%) |
| 6 or 7 Rooms | 9 (18.4%) | 392 (38.2%) |
| 8 or more Rooms | 0 (0.0%) | 205 (20.0%) |
| Total | 49 (100.0%) | 1,027 (100.0%) |
Housing Structure by Heating Type in Nellis AFB
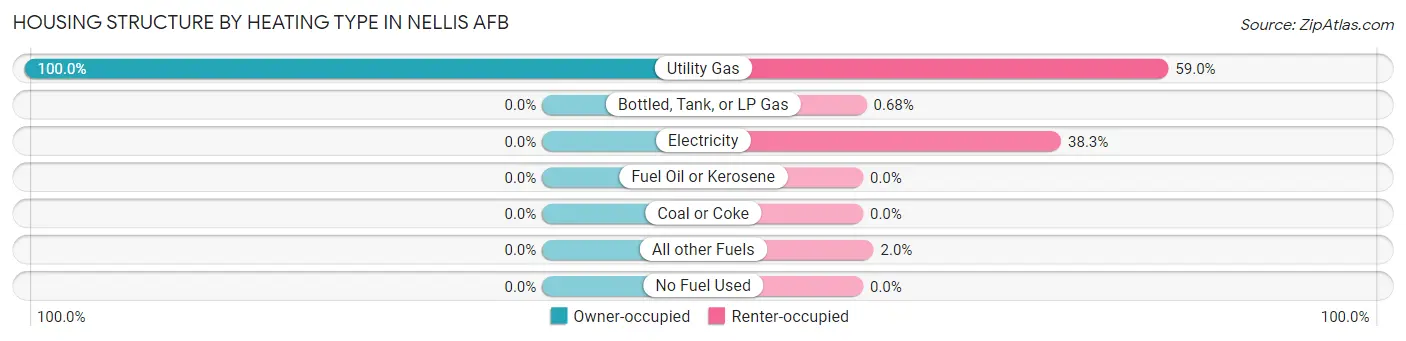
| Heating Type | Owner-occupied | Renter-occupied |
| Utility Gas | 49 (100.0%) | 606 (59.0%) |
| Bottled, Tank, or LP Gas | 0 (0.0%) | 7 (0.7%) |
| Electricity | 0 (0.0%) | 393 (38.3%) |
| Fuel Oil or Kerosene | 0 (0.0%) | 0 (0.0%) |
| Coal or Coke | 0 (0.0%) | 0 (0.0%) |
| All other Fuels | 0 (0.0%) | 21 (2.0%) |
| No Fuel Used | 0 (0.0%) | 0 (0.0%) |
| Total | 49 (100.0%) | 1,027 (100.0%) |
Household Vehicle Usage in Nellis AFB
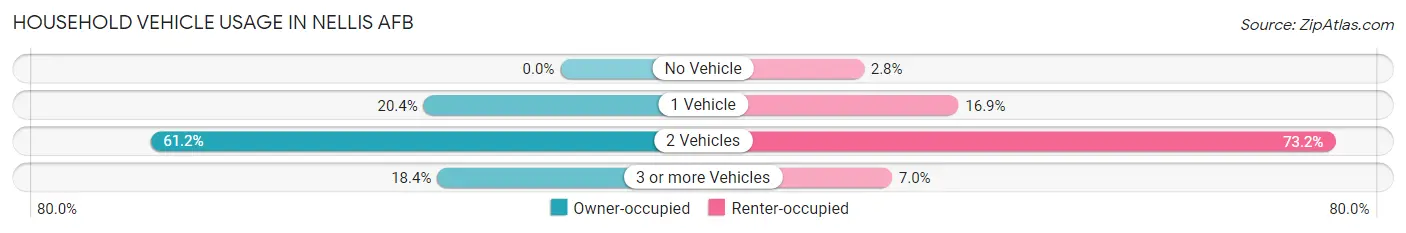
| Vehicles per Household | Owner-occupied | Renter-occupied |
| No Vehicle | 0 (0.0%) | 29 (2.8%) |
| 1 Vehicle | 10 (20.4%) | 174 (16.9%) |
| 2 Vehicles | 30 (61.2%) | 752 (73.2%) |
| 3 or more Vehicles | 9 (18.4%) | 72 (7.0%) |
| Total | 49 (100.0%) | 1,027 (100.0%) |
Real Estate & Mortgages in Nellis AFB
Real Estate and Mortgage Overview in Nellis AFB
| Characteristic | Without Mortgage | With Mortgage |
| Housing Units | 9 | 40 |
| Median Property Value | - | - |
| Median Household Income | - | - |
| Monthly Housing Costs | - | - |
| Real Estate Taxes | - | - |
Property Value by Mortgage Status in Nellis AFB
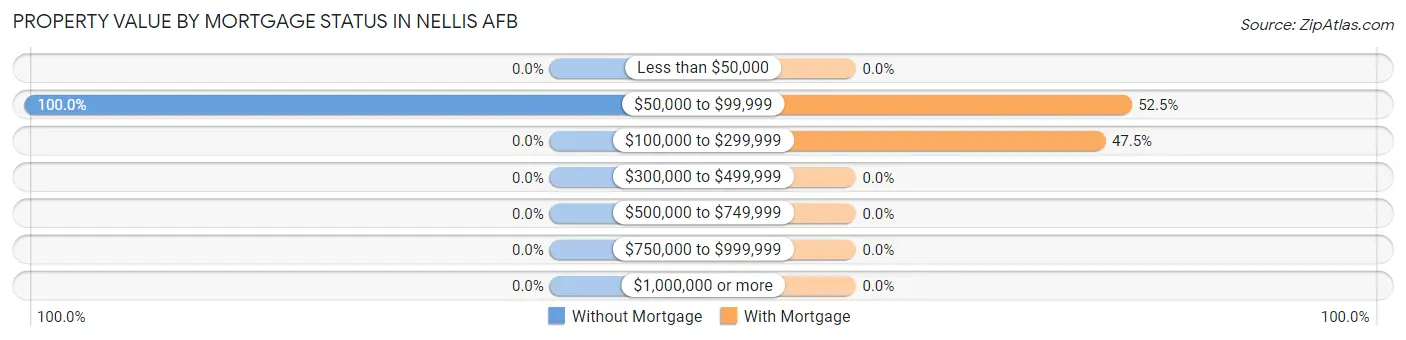
| Property Value | Without Mortgage | With Mortgage |
| Less than $50,000 | 0 (0.0%) | 0 (0.0%) |
| $50,000 to $99,999 | 9 (100.0%) | 21 (52.5%) |
| $100,000 to $299,999 | 0 (0.0%) | 19 (47.5%) |
| $300,000 to $499,999 | 0 (0.0%) | 0 (0.0%) |
| $500,000 to $749,999 | 0 (0.0%) | 0 (0.0%) |
| $750,000 to $999,999 | 0 (0.0%) | 0 (0.0%) |
| $1,000,000 or more | 0 (0.0%) | 0 (0.0%) |
| Total | 9 (100.0%) | 40 (100.0%) |
Household Income by Mortgage Status in Nellis AFB
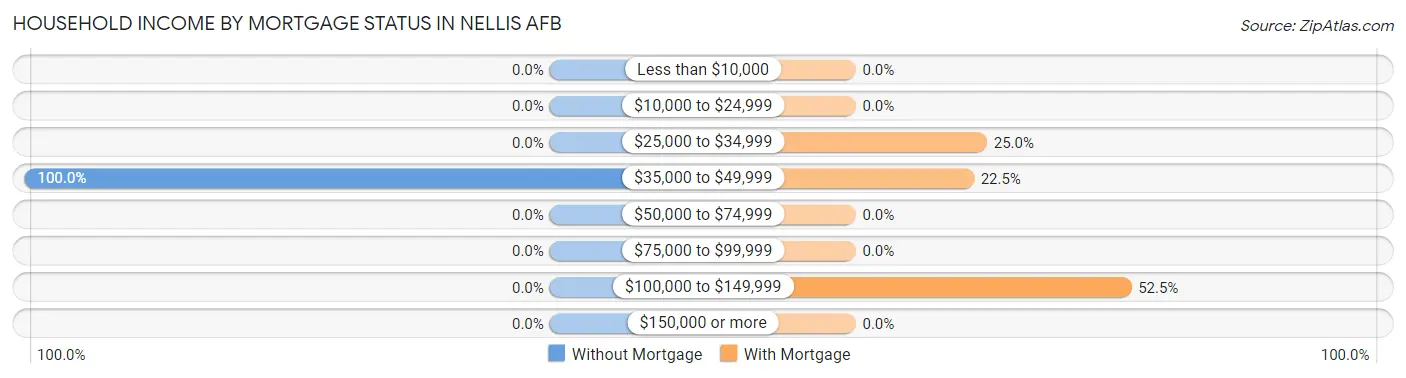
| Household Income | Without Mortgage | With Mortgage |
| Less than $10,000 | 0 (0.0%) | 0 (0.0%) |
| $10,000 to $24,999 | 0 (0.0%) | 0 (0.0%) |
| $25,000 to $34,999 | 0 (0.0%) | 10 (25.0%) |
| $35,000 to $49,999 | 9 (100.0%) | 9 (22.5%) |
| $50,000 to $74,999 | 0 (0.0%) | 0 (0.0%) |
| $75,000 to $99,999 | 0 (0.0%) | 0 (0.0%) |
| $100,000 to $149,999 | 0 (0.0%) | 21 (52.5%) |
| $150,000 or more | 0 (0.0%) | 0 (0.0%) |
| Total | 9 (100.0%) | 40 (100.0%) |
Property Value to Household Income Ratio in Nellis AFB
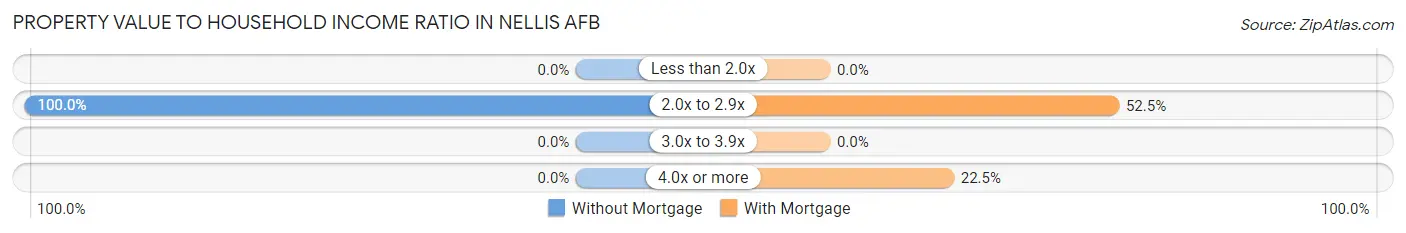
| Value-to-Income Ratio | Without Mortgage | With Mortgage |
| Less than 2.0x | 0 (0.0%) | 0 (0.0%) |
| 2.0x to 2.9x | 9 (100.0%) | 21 (52.5%) |
| 3.0x to 3.9x | 0 (0.0%) | 0 (0.0%) |
| 4.0x or more | 0 (0.0%) | 9 (22.5%) |
| Total | 9 (100.0%) | 40 (100.0%) |
Real Estate Taxes by Mortgage Status in Nellis AFB
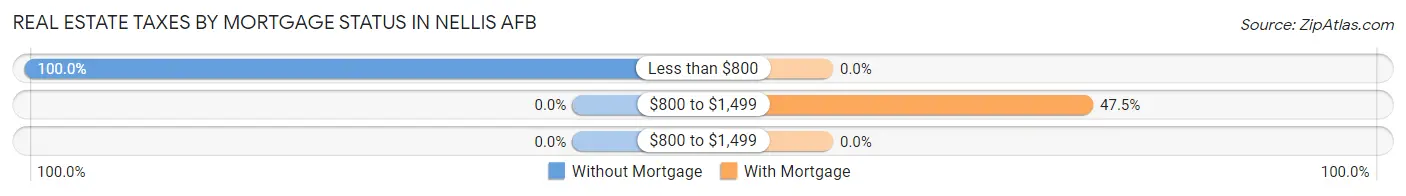
| Property Taxes | Without Mortgage | With Mortgage |
| Less than $800 | 9 (100.0%) | 0 (0.0%) |
| $800 to $1,499 | 0 (0.0%) | 19 (47.5%) |
| $800 to $1,499 | 0 (0.0%) | 0 (0.0%) |
| Total | 9 (100.0%) | 40 (100.0%) |
Health & Disability in Nellis AFB
Health Insurance Coverage by Age in Nellis AFB
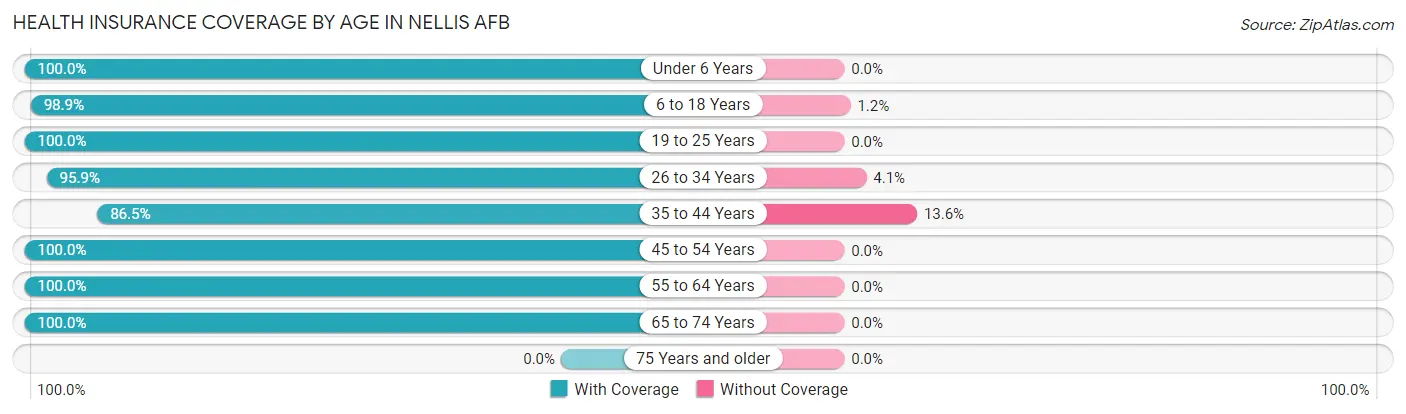
| Age Bracket | With Coverage | Without Coverage |
| Under 6 Years | 834 (100.0%) | 0 (0.0%) |
| 6 to 18 Years | 1,033 (98.9%) | 12 (1.1%) |
| 19 to 25 Years | 290 (100.0%) | 0 (0.0%) |
| 26 to 34 Years | 584 (95.9%) | 25 (4.1%) |
| 35 to 44 Years | 268 (86.5%) | 42 (13.6%) |
| 45 to 54 Years | 82 (100.0%) | 0 (0.0%) |
| 55 to 64 Years | 20 (100.0%) | 0 (0.0%) |
| 65 to 74 Years | 10 (100.0%) | 0 (0.0%) |
| 75 Years and older | 0 (0.0%) | 0 (0.0%) |
| Total | 3,121 (97.5%) | 79 (2.5%) |
Health Insurance Coverage by Citizenship Status in Nellis AFB
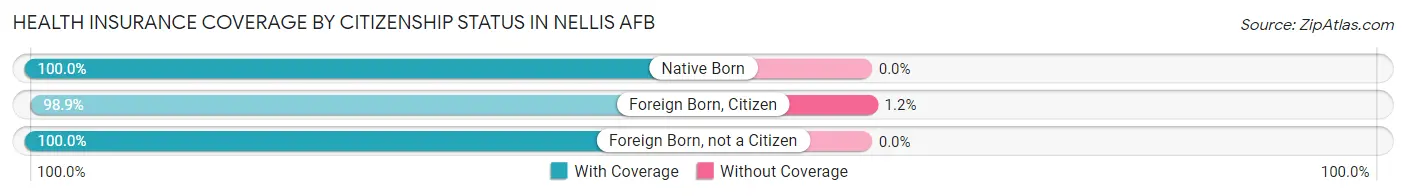
| Citizenship Status | With Coverage | Without Coverage |
| Native Born | 834 (100.0%) | 0 (0.0%) |
| Foreign Born, Citizen | 1,033 (98.9%) | 12 (1.1%) |
| Foreign Born, not a Citizen | 290 (100.0%) | 0 (0.0%) |
Health Insurance Coverage by Household Income in Nellis AFB
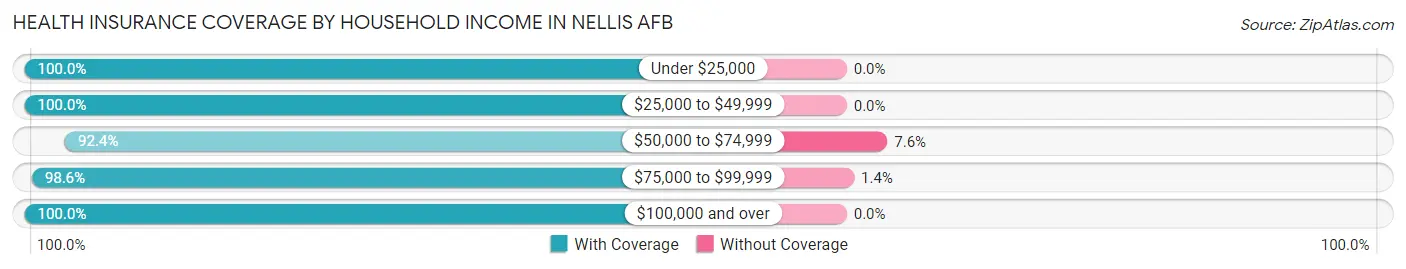
| Household Income | With Coverage | Without Coverage |
| Under $25,000 | 300 (100.0%) | 0 (0.0%) |
| $25,000 to $49,999 | 533 (100.0%) | 0 (0.0%) |
| $50,000 to $74,999 | 816 (92.4%) | 67 (7.6%) |
| $75,000 to $99,999 | 864 (98.6%) | 12 (1.4%) |
| $100,000 and over | 608 (100.0%) | 0 (0.0%) |
Public vs Private Health Insurance Coverage by Age in Nellis AFB
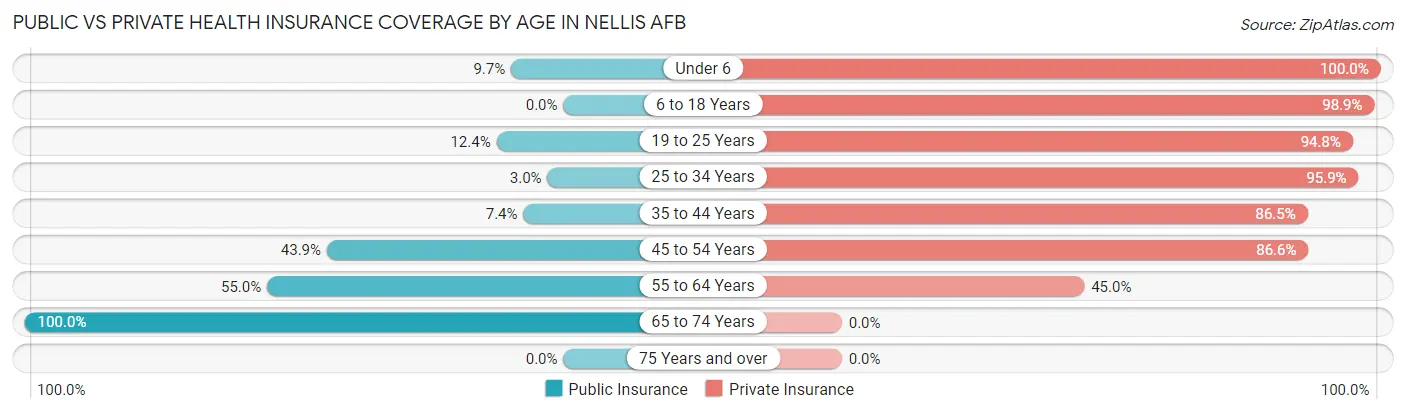
| Age Bracket | Public Insurance | Private Insurance |
| Under 6 | 81 (9.7%) | 834 (100.0%) |
| 6 to 18 Years | 0 (0.0%) | 1,033 (98.9%) |
| 19 to 25 Years | 36 (12.4%) | 275 (94.8%) |
| 25 to 34 Years | 18 (3.0%) | 584 (95.9%) |
| 35 to 44 Years | 23 (7.4%) | 268 (86.5%) |
| 45 to 54 Years | 36 (43.9%) | 71 (86.6%) |
| 55 to 64 Years | 11 (55.0%) | 9 (45.0%) |
| 65 to 74 Years | 10 (100.0%) | 0 (0.0%) |
| 75 Years and over | 0 (0.0%) | 0 (0.0%) |
| Total | 215 (6.7%) | 3,074 (96.1%) |
Disability Status by Sex by Age in Nellis AFB
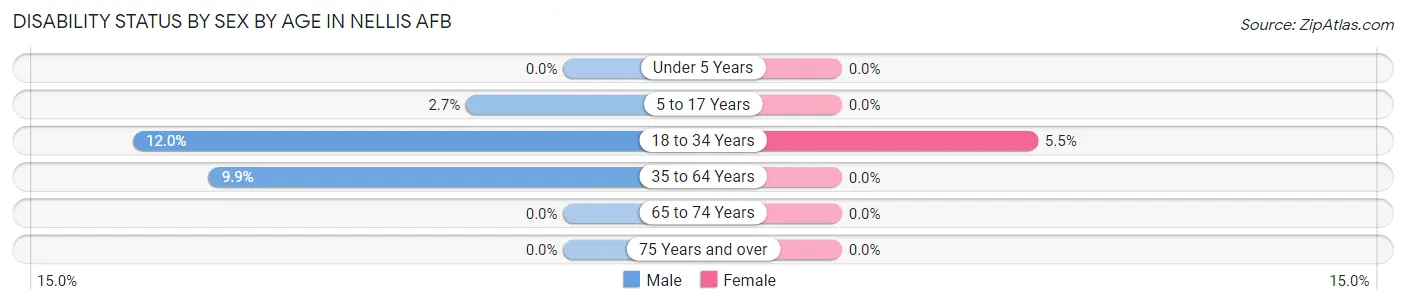
| Age Bracket | Male | Female |
| Under 5 Years | 0 (0.0%) | 0 (0.0%) |
| 5 to 17 Years | 23 (2.7%) | 0 (0.0%) |
| 18 to 34 Years | 20 (12.0%) | 40 (5.5%) |
| 35 to 64 Years | 15 (9.9%) | 0 (0.0%) |
| 65 to 74 Years | 0 (0.0%) | 0 (0.0%) |
| 75 Years and over | 0 (0.0%) | 0 (0.0%) |
Disability Class by Sex by Age in Nellis AFB
Disability Class: Hearing Difficulty
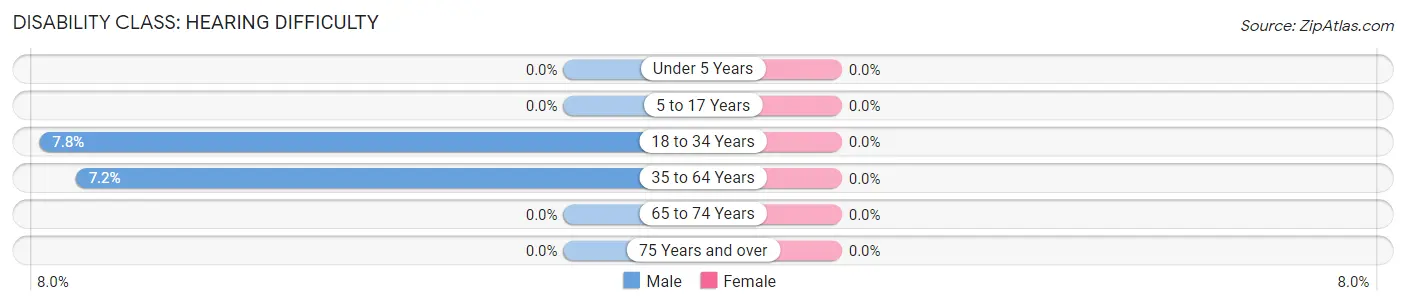
| Age Bracket | Male | Female |
| Under 5 Years | 0 (0.0%) | 0 (0.0%) |
| 5 to 17 Years | 0 (0.0%) | 0 (0.0%) |
| 18 to 34 Years | 13 (7.8%) | 0 (0.0%) |
| 35 to 64 Years | 11 (7.2%) | 0 (0.0%) |
| 65 to 74 Years | 0 (0.0%) | 0 (0.0%) |
| 75 Years and over | 0 (0.0%) | 0 (0.0%) |
Disability Class: Vision Difficulty
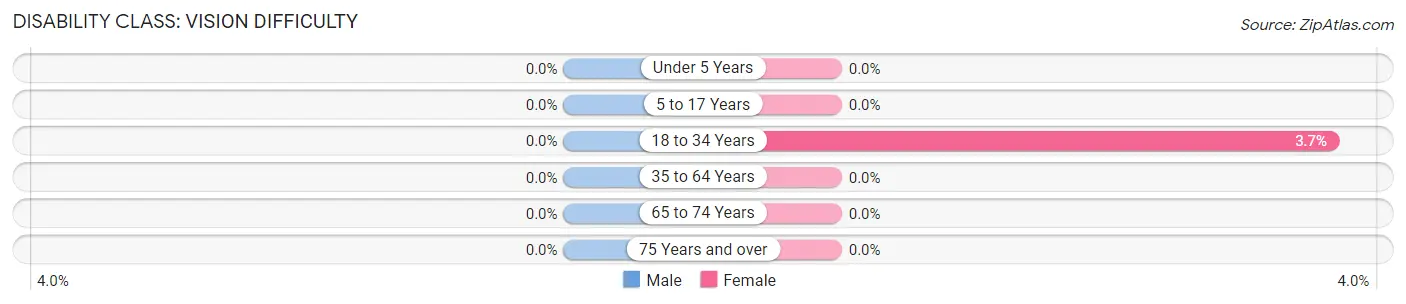
| Age Bracket | Male | Female |
| Under 5 Years | 0 (0.0%) | 0 (0.0%) |
| 5 to 17 Years | 0 (0.0%) | 0 (0.0%) |
| 18 to 34 Years | 0 (0.0%) | 27 (3.7%) |
| 35 to 64 Years | 0 (0.0%) | 0 (0.0%) |
| 65 to 74 Years | 0 (0.0%) | 0 (0.0%) |
| 75 Years and over | 0 (0.0%) | 0 (0.0%) |
Disability Class: Cognitive Difficulty
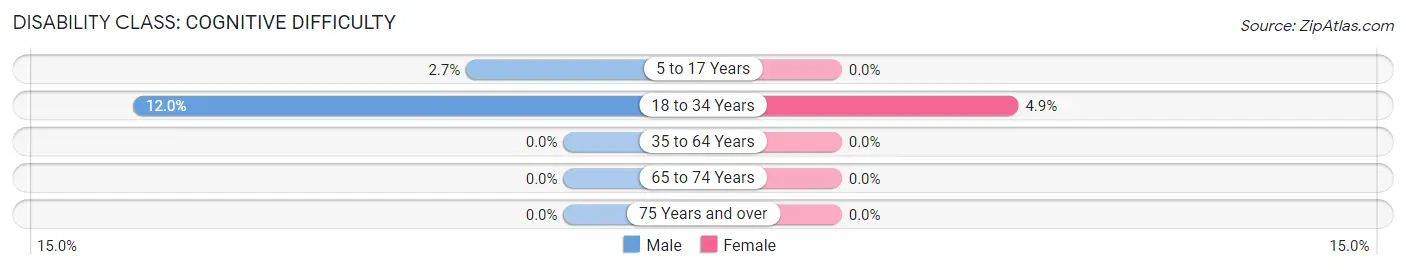
| Age Bracket | Male | Female |
| 5 to 17 Years | 23 (2.7%) | 0 (0.0%) |
| 18 to 34 Years | 20 (12.0%) | 36 (4.9%) |
| 35 to 64 Years | 0 (0.0%) | 0 (0.0%) |
| 65 to 74 Years | 0 (0.0%) | 0 (0.0%) |
| 75 Years and over | 0 (0.0%) | 0 (0.0%) |
Disability Class: Ambulatory Difficulty
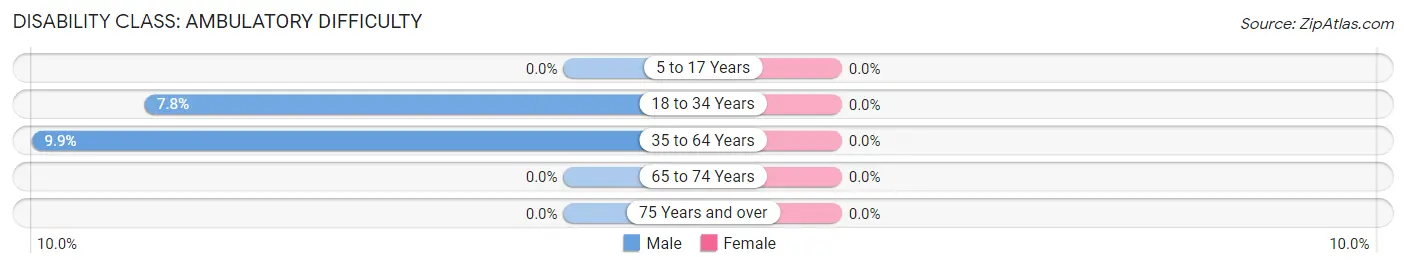
| Age Bracket | Male | Female |
| 5 to 17 Years | 0 (0.0%) | 0 (0.0%) |
| 18 to 34 Years | 13 (7.8%) | 0 (0.0%) |
| 35 to 64 Years | 15 (9.9%) | 0 (0.0%) |
| 65 to 74 Years | 0 (0.0%) | 0 (0.0%) |
| 75 Years and over | 0 (0.0%) | 0 (0.0%) |
Disability Class: Self-Care Difficulty
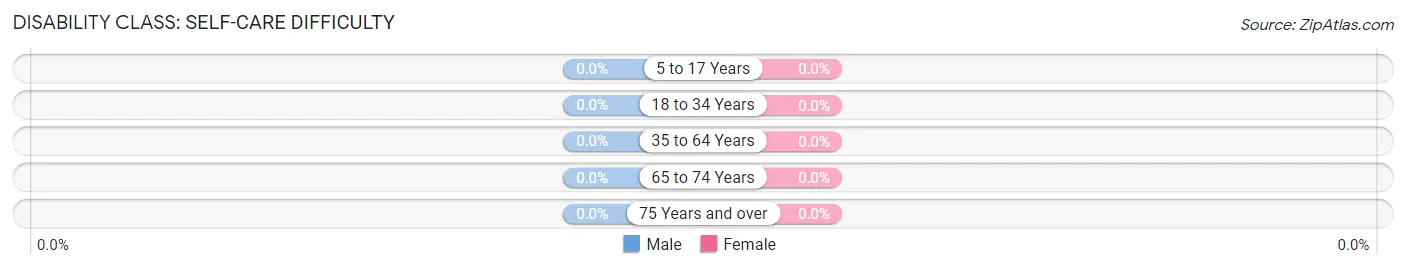
| Age Bracket | Male | Female |
| 5 to 17 Years | 0 (0.0%) | 0 (0.0%) |
| 18 to 34 Years | 0 (0.0%) | 0 (0.0%) |
| 35 to 64 Years | 0 (0.0%) | 0 (0.0%) |
| 65 to 74 Years | 0 (0.0%) | 0 (0.0%) |
| 75 Years and over | 0 (0.0%) | 0 (0.0%) |
Technology Access in Nellis AFB
Computing Device Access in Nellis AFB
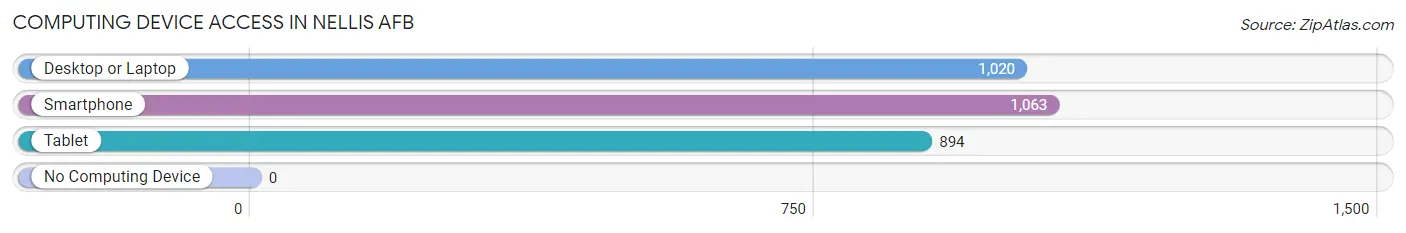
| Device Type | # Households | % Households |
| Desktop or Laptop | 1,020 | 94.8% |
| Smartphone | 1,063 | 98.8% |
| Tablet | 894 | 83.1% |
| No Computing Device | 0 | 0.0% |
| Total | 1,076 | 100.0% |
Internet Access in Nellis AFB
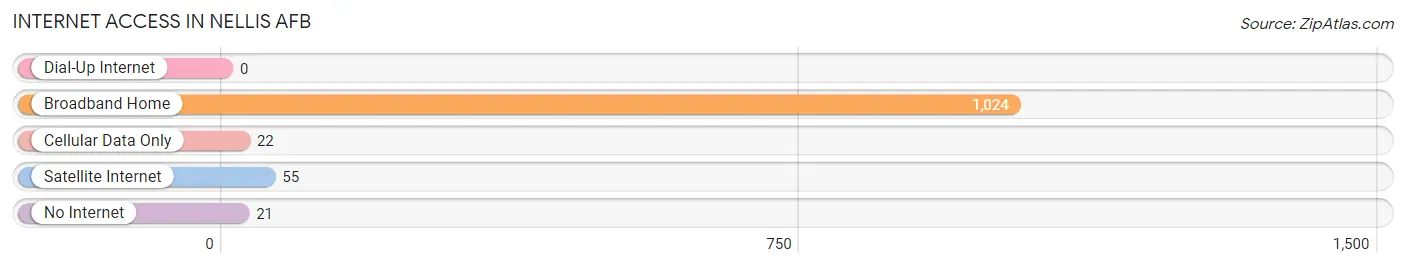
| Internet Type | # Households | % Households |
| Dial-Up Internet | 0 | 0.0% |
| Broadband Home | 1,024 | 95.2% |
| Cellular Data Only | 22 | 2.0% |
| Satellite Internet | 55 | 5.1% |
| No Internet | 21 | 1.9% |
| Total | 1,076 | 100.0% |
Nellis AFB Summary
Nellis Air Force Base (AFB) is located in the Las Vegas Valley, Nevada, and is home to the United States Air Force Warfare Center. It is the largest and most diverse training facility in the world, and is home to the USAF Thunderbirds, the Air Force’s premier aerial demonstration team. Nellis AFB is also home to the Nevada Test and Training Range (NTTR), the largest contiguous air and ground space available for peacetime military operations in the free world.
History
Nellis AFB was established in 1941 as a training facility for the Army Air Corps. It was named after William Harrell Nellis, a World War I flying ace who was killed in action in France in 1918. During World War II, Nellis AFB was used as a training base for B-17 and B-24 bomber crews. After the war, the base was used as a training facility for the Strategic Air Command (SAC). In the 1950s, Nellis AFB was used as a test site for the development of the first atomic bombs.
In the 1960s, Nellis AFB was used as a training base for the Vietnam War. During this time, the base was home to the Tactical Air Command (TAC) and the Air Defense Command (ADC). In the 1970s, Nellis AFB was used as a training base for the F-4 Phantom II fighter jet. In the 1980s, Nellis AFB was used as a training base for the F-16 Fighting Falcon fighter jet.
In the 1990s, Nellis AFB was used as a training base for the F-15 Eagle fighter jet. In the 2000s, Nellis AFB was used as a training base for the F-22 Raptor fighter jet. In the 2010s, Nellis AFB was used as a training base for the F-35 Lightning II fighter jet.
Geography
Nellis AFB is located in the Las Vegas Valley, Nevada, and is situated in the Mojave Desert. The base is located approximately 15 miles northeast of downtown Las Vegas. The base covers an area of approximately 4,000 acres and is bordered by the Las Vegas Motor Speedway to the north, the Las Vegas Wash to the east, and the Nellis Range to the south.
The base is located at an elevation of 2,000 feet above sea level and has a semi-arid climate with hot summers and mild winters. The average annual temperature is 68°F and the average annual precipitation is 4.5 inches.
Economy
Nellis AFB is a major economic driver for the Las Vegas Valley. The base has an estimated economic impact of $2.5 billion annually and is home to more than 20,000 military personnel and civilian employees. The base is also home to more than 100 tenant units, including the USAF Thunderbirds, the Air Force’s premier aerial demonstration team.
The base is home to a variety of businesses, including restaurants, retail stores, and hotels. The base also hosts a variety of events, including air shows, concerts, and sporting events.
Demographics
As of the 2010 census, the population of Nellis AFB was 8,845. The racial makeup of the base was 73.3% White, 11.2% African American, 8.2% Hispanic or Latino, 4.2% Asian, and 3.1% other. The median household income was $50,945 and the median family income was $60,945.
Conclusion
Nellis Air Force Base is a major economic driver for the Las Vegas Valley and is home to more than 20,000 military personnel and civilian employees. The base is also home to the USAF Thunderbirds, the Air Force’s premier aerial demonstration team, and is used as a training base for a variety of fighter jets. The base has an estimated economic impact of $2.5 billion annually and is home to a variety of businesses, including restaurants, retail stores, and hotels. The population of Nellis AFB is 8,845 and the racial makeup of the base is 73.3% White, 11.2% African American, 8.2% Hispanic or Latino, 4.2% Asian, and 3.1% other.
Common Questions
What is Per Capita Income in Nellis AFB?
Per Capita income in Nellis AFB is $18,557.
What is the Median Family Income in Nellis AFB?
Median Family Income in Nellis AFB is $64,100.
What is the Median Household income in Nellis AFB?
Median Household Income in Nellis AFB is $67,733.
What is Income or Wage Gap in Nellis AFB?
Income or Wage Gap in Nellis AFB is 56.7%.
Women in Nellis AFB earn 43.3 cents for every dollar earned by a man.
What is Inequality or Gini Index in Nellis AFB?
Inequality or Gini Index in Nellis AFB is 0.33.
What is the Total Population of Nellis AFB?
Total Population of Nellis AFB is 4,278.
What is the Total Male Population of Nellis AFB?
Total Male Population of Nellis AFB is 2,446.
What is the Total Female Population of Nellis AFB?
Total Female Population of Nellis AFB is 1,832.
What is the Ratio of Males per 100 Females in Nellis AFB?
There are 133.52 Males per 100 Females in Nellis AFB.
What is the Ratio of Females per 100 Males in Nellis AFB?
There are 74.90 Females per 100 Males in Nellis AFB.
What is the Median Population Age in Nellis AFB?
Median Population Age in Nellis AFB is 21.4 Years.
What is the Average Family Size in Nellis AFB
Average Family Size in Nellis AFB is 4.0 People.
What is the Average Household Size in Nellis AFB
Average Household Size in Nellis AFB is 3.7 People.
How Large is the Labor Force in Nellis AFB?
There are 1,974 People in the Labor Forcein in Nellis AFB.
What is the Percentage of People in the Labor Force in Nellis AFB?
77.5% of People are in the Labor Force in Nellis AFB.
What is the Unemployment Rate in Nellis AFB?
Unemployment Rate in Nellis AFB is 22.4%.