Zip Codes with the Highest Percentage of Households with Income Below $10,000 in Sparks, NV
RELATED REPORTS & OPTIONS
Household Income | $0-10k
Sparks
Compare Zip Codes
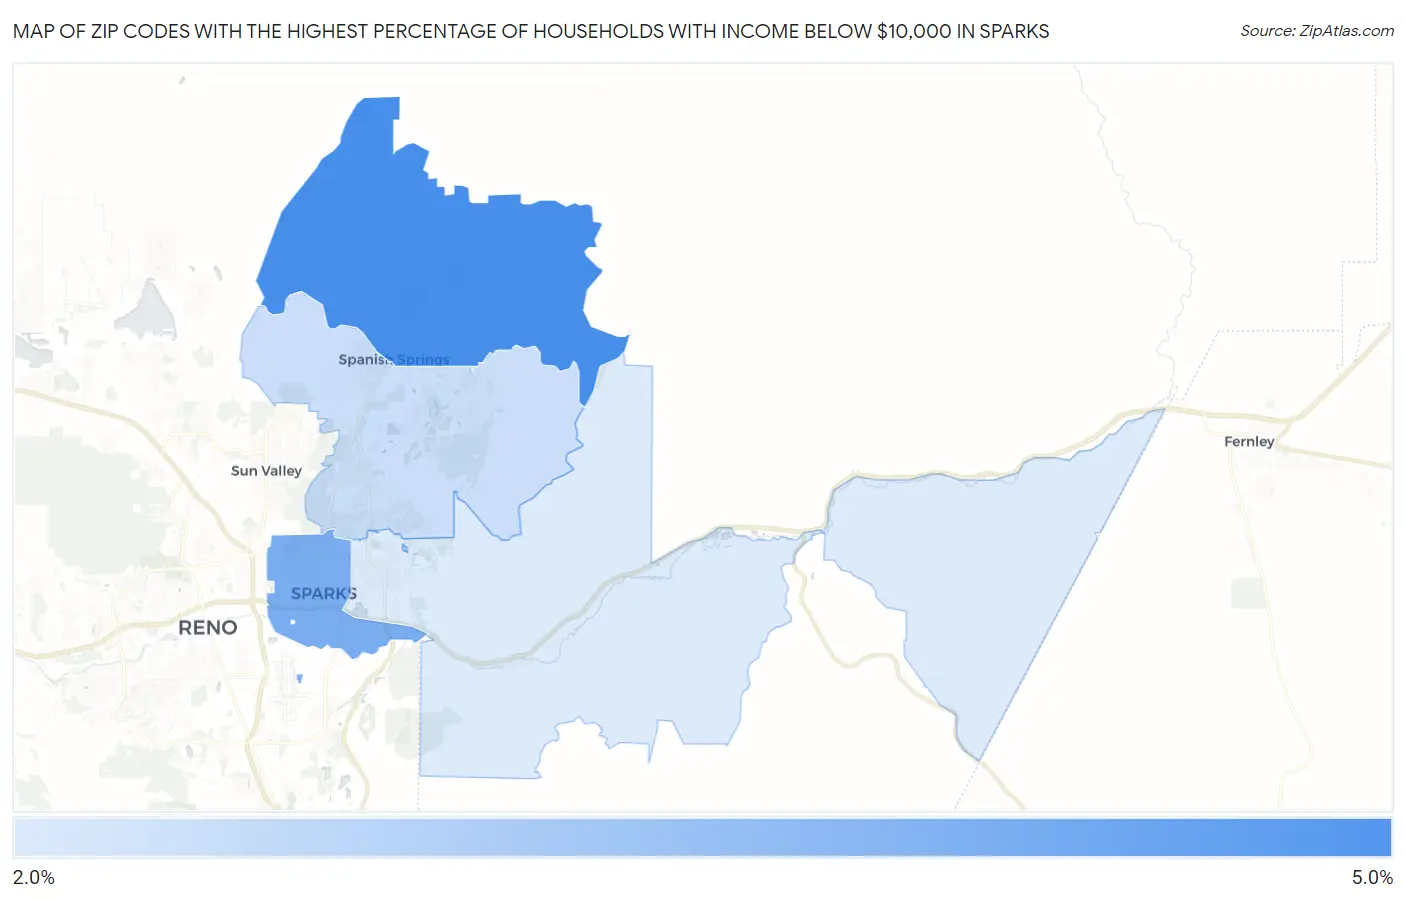
Map of Zip Codes with the Highest Percentage of Households with Income Below $10,000 in Sparks
2.2%
4.6%
Zip Codes with the Highest Percentage of Households with Income Below $10,000 in Sparks, NV
| Zip Code | Households with Income < $10k | vs State | vs National | |
| 1. | 89441 | 4.6% | 5.4%(-0.800)#74 | 4.9%(-0.300)#13,090 |
| 2. | 89431 | 3.8% | 5.4%(-1.60)#90 | 4.9%(-1.10)#15,987 |
| 3. | 89436 | 2.5% | 5.4%(-2.90)#122 | 4.9%(-2.40)#21,541 |
| 4. | 89434 | 2.2% | 5.4%(-3.20)#128 | 4.9%(-2.70)#22,876 |
1
Common Questions
What are the Top 3 Zip Codes with the Highest Percentage of Households with Income Below $10,000 in Sparks, NV?
Top 3 Zip Codes with the Highest Percentage of Households with Income Below $10,000 in Sparks, NV are:
What zip code has the Highest Percentage of Households with Income Below $10,000 in Sparks, NV?
89441 has the Highest Percentage of Households with Income Below $10,000 in Sparks, NV with 4.6%.
What is the Percentage of Households with Income Below $10,000 in Sparks, NV?
Percentage of Households with Income Below $10,000 in Sparks is 2.9%.
What is the Percentage of Households with Income Below $10,000 in Nevada?
Percentage of Households with Income Below $10,000 in Nevada is 5.4%.
What is the Percentage of Households with Income Below $10,000 in the United States?
Percentage of Households with Income Below $10,000 in the United States is 4.9%.