Elko, NV Map & Demographics
Elko Map
Elko Overview
$39,299
PER CAPITA INCOME
$98,720
AVG FAMILY INCOME
$85,000
AVG HOUSEHOLD INCOME
42.9%
WAGE / INCOME GAP [ % ]
57.1¢/ $1
WAGE / INCOME GAP [ $ ]
$9,408
FAMILY INCOME DEFICIT
0.41
INEQUALITY / GINI INDEX
20,513
TOTAL POPULATION
11,119
MALE POPULATION
9,394
FEMALE POPULATION
118.36
MALES / 100 FEMALES
84.49
FEMALES / 100 MALES
33.5
MEDIAN AGE
3.3
AVG FAMILY SIZE
2.6
AVG HOUSEHOLD SIZE
10,978
LABOR FORCE [ PEOPLE ]
68.4%
PERCENT IN LABOR FORCE
4.5%
UNEMPLOYMENT RATE
Elko Zip Codes
Elko Area Codes
Income in Elko
Income Overview in Elko
Per Capita Income in Elko is $39,299, while median incomes of families and households are $98,720 and $85,000 respectively.
| Characteristic | Number | Measure |
| Per Capita Income | 20,513 | $39,299 |
| Median Family Income | 4,809 | $98,720 |
| Mean Family Income | 4,809 | $110,613 |
| Median Household Income | 7,802 | $85,000 |
| Mean Household Income | 7,802 | $97,801 |
| Income Deficit | 4,809 | $9,408 |
| Wage / Income Gap (%) | 20,513 | 42.92% |
| Wage / Income Gap ($) | 20,513 | 57.08¢ per $1 |
| Gini / Inequality Index | 20,513 | 0.41 |
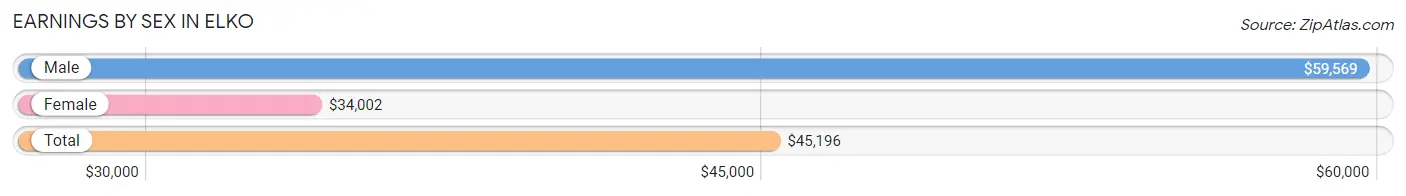
Earnings by Sex in Elko
Average Earnings in Elko are $45,196, $59,569 for men and $34,002 for women, a difference of 42.9%.
| Sex | Number | Average Earnings |
| Male | 6,718 (58.0%) | $59,569 |
| Female | 4,871 (42.0%) | $34,002 |
| Total | 11,589 (100.0%) | $45,196 |
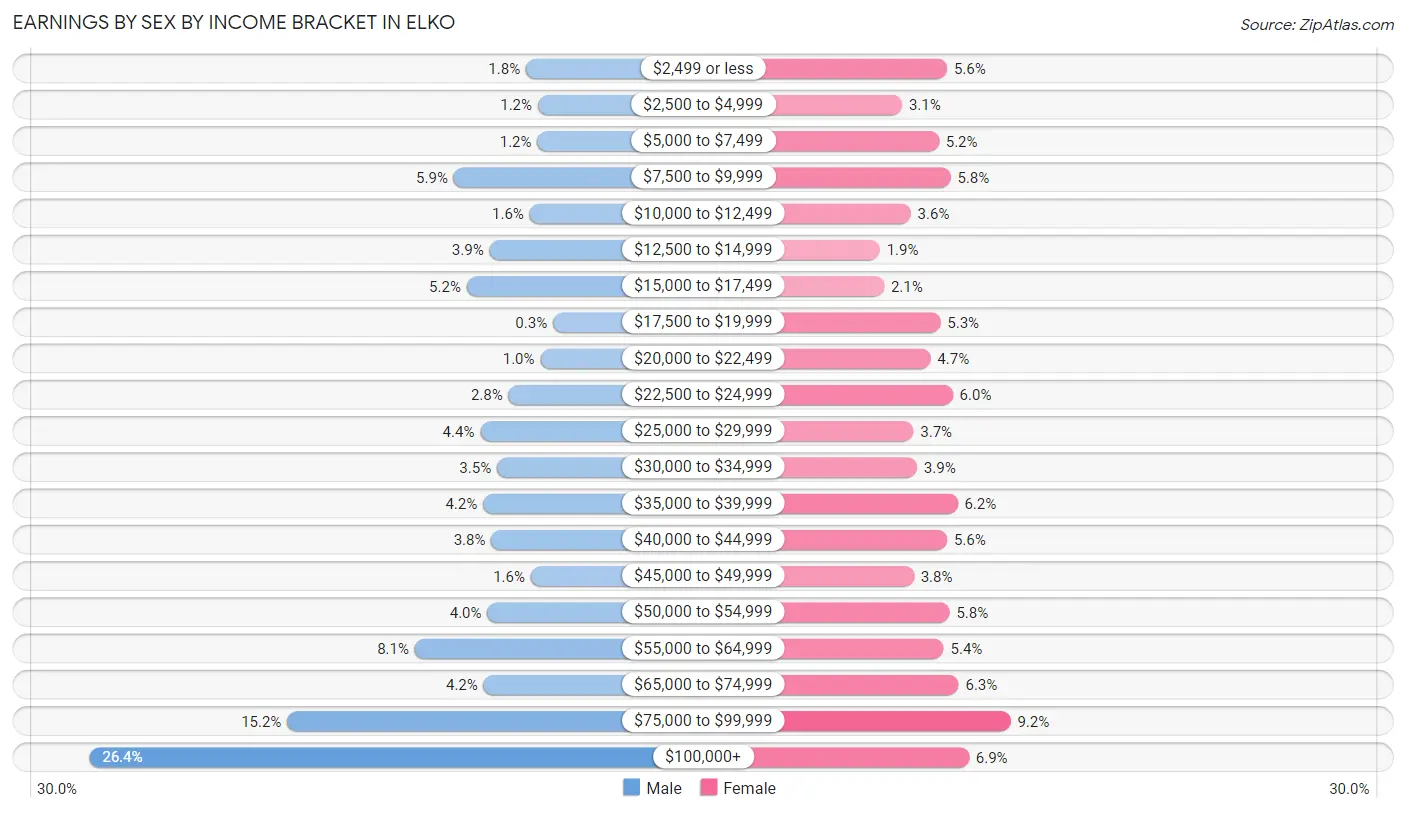
Earnings by Sex by Income Bracket in Elko
The most common earnings brackets in Elko are $100,000+ for men (1,771 | 26.4%) and $75,000 to $99,999 for women (448 | 9.2%).
| Income | Male | Female |
| $2,499 or less | 122 (1.8%) | 274 (5.6%) |
| $2,500 to $4,999 | 77 (1.1%) | 151 (3.1%) |
| $5,000 to $7,499 | 79 (1.2%) | 252 (5.2%) |
| $7,500 to $9,999 | 395 (5.9%) | 284 (5.8%) |
| $10,000 to $12,499 | 108 (1.6%) | 175 (3.6%) |
| $12,500 to $14,999 | 260 (3.9%) | 90 (1.8%) |
| $15,000 to $17,499 | 346 (5.1%) | 102 (2.1%) |
| $17,500 to $19,999 | 20 (0.3%) | 256 (5.3%) |
| $20,000 to $22,499 | 68 (1.0%) | 229 (4.7%) |
| $22,500 to $24,999 | 188 (2.8%) | 290 (5.9%) |
| $25,000 to $29,999 | 295 (4.4%) | 182 (3.7%) |
| $30,000 to $34,999 | 232 (3.5%) | 192 (3.9%) |
| $35,000 to $39,999 | 284 (4.2%) | 303 (6.2%) |
| $40,000 to $44,999 | 253 (3.8%) | 274 (5.6%) |
| $45,000 to $49,999 | 104 (1.5%) | 183 (3.8%) |
| $50,000 to $54,999 | 268 (4.0%) | 281 (5.8%) |
| $55,000 to $64,999 | 542 (8.1%) | 265 (5.4%) |
| $65,000 to $74,999 | 282 (4.2%) | 306 (6.3%) |
| $75,000 to $99,999 | 1,024 (15.2%) | 448 (9.2%) |
| $100,000+ | 1,771 (26.4%) | 334 (6.9%) |
| Total | 6,718 (100.0%) | 4,871 (100.0%) |
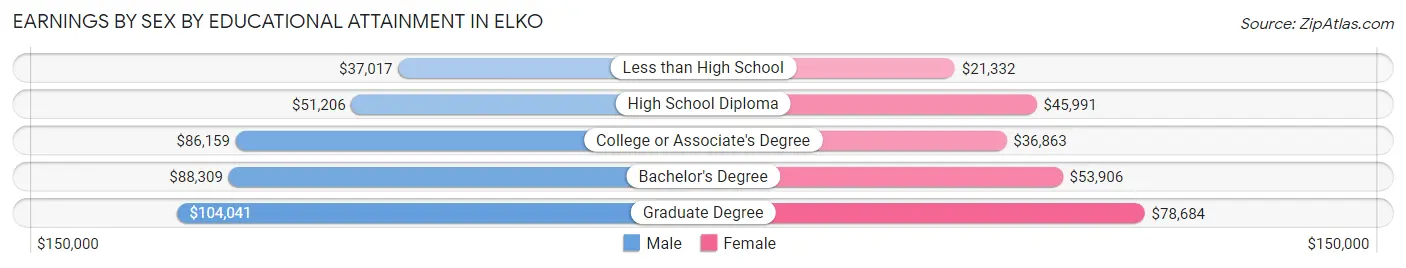
Earnings by Sex by Educational Attainment in Elko
Average earnings in Elko are $72,328 for men and $40,267 for women, a difference of 44.3%. Men with an educational attainment of graduate degree enjoy the highest average annual earnings of $104,041, while those with less than high school education earn the least with $37,017. Women with an educational attainment of graduate degree earn the most with the average annual earnings of $78,684, while those with less than high school education have the smallest earnings of $21,332.
| Educational Attainment | Male Income | Female Income |
| Less than High School | $37,017 | $21,332 |
| High School Diploma | $51,206 | $45,991 |
| College or Associate's Degree | $86,159 | $36,863 |
| Bachelor's Degree | $88,309 | $53,906 |
| Graduate Degree | $104,041 | $78,684 |
| Total | $72,328 | $40,267 |
Family Income in Elko
Family Income Brackets in Elko
According to the Elko family income data, there are 1,260 families falling into the $100,000 to $149,999 income range, which is the most common income bracket and makes up 26.2% of all families. Conversely, the $10,000 to $14,999 income bracket is the least frequent group with only 48 families (1.0%) belonging to this category.
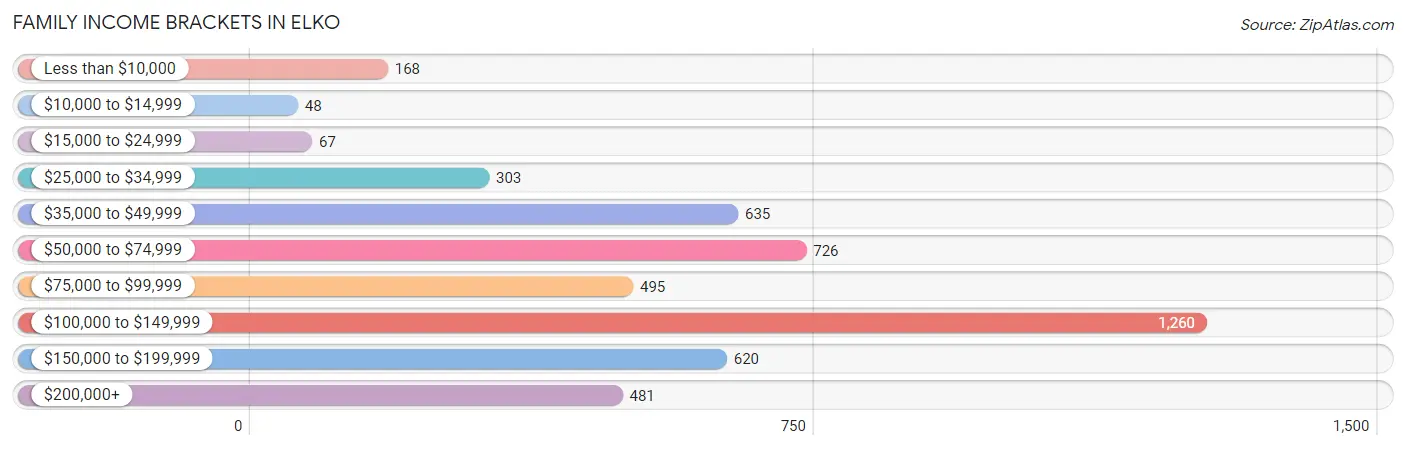
| Income Bracket | # Families | % Families |
| Less than $10,000 | 168 | 3.5% |
| $10,000 to $14,999 | 48 | 1.0% |
| $15,000 to $24,999 | 67 | 1.4% |
| $25,000 to $34,999 | 303 | 6.3% |
| $35,000 to $49,999 | 635 | 13.2% |
| $50,000 to $74,999 | 726 | 15.1% |
| $75,000 to $99,999 | 495 | 10.3% |
| $100,000 to $149,999 | 1,260 | 26.2% |
| $150,000 to $199,999 | 620 | 12.9% |
| $200,000+ | 481 | 10.0% |
Family Income by Famaliy Size in Elko
6-person families (78 | 1.6%) account for the highest median family income in Elko with $127,667 per family, while 2-person families (2,177 | 45.3%) have the highest median income of $44,354 per family member.
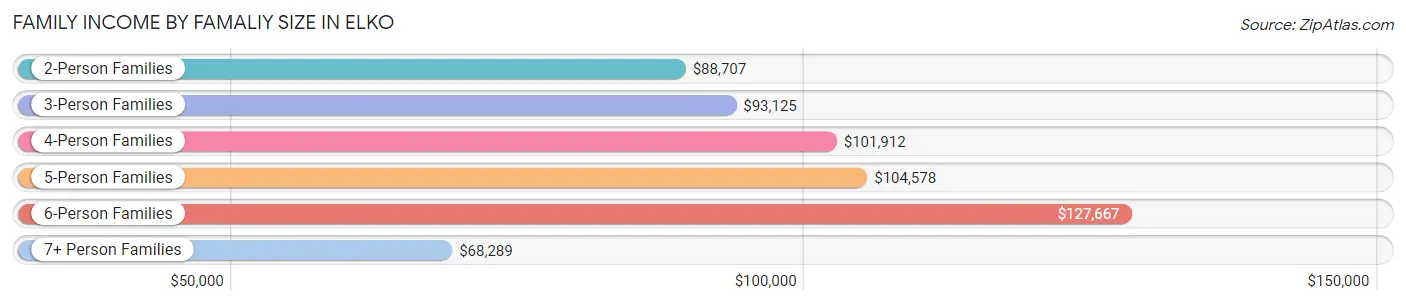
| Income Bracket | # Families | Median Income |
| 2-Person Families | 2,177 (45.3%) | $88,707 |
| 3-Person Families | 1,044 (21.7%) | $93,125 |
| 4-Person Families | 934 (19.4%) | $101,912 |
| 5-Person Families | 512 (10.6%) | $104,578 |
| 6-Person Families | 78 (1.6%) | $127,667 |
| 7+ Person Families | 64 (1.3%) | $68,289 |
| Total | 4,809 (100.0%) | $98,720 |
Family Income by Number of Earners in Elko
The median family income in Elko is $98,720, with families comprising 3+ earners (319) having the highest median family income of $165,389, while families with no earners (459) have the lowest median family income of $55,317, accounting for 6.6% and 9.5% of families, respectively.
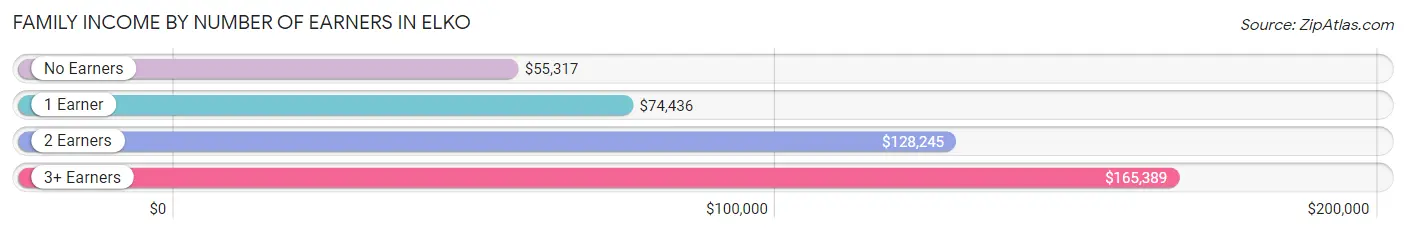
| Number of Earners | # Families | Median Income |
| No Earners | 459 (9.5%) | $55,317 |
| 1 Earner | 1,697 (35.3%) | $74,436 |
| 2 Earners | 2,334 (48.5%) | $128,245 |
| 3+ Earners | 319 (6.6%) | $165,389 |
| Total | 4,809 (100.0%) | $98,720 |
Household Income in Elko
Household Income Brackets in Elko
With 1,958 households falling in the category, the $100,000 to $149,999 income range is the most frequent in Elko, accounting for 25.1% of all households. In contrast, only 281 households (3.6%) fall into the less than $10,000 income bracket, making it the least populous group.
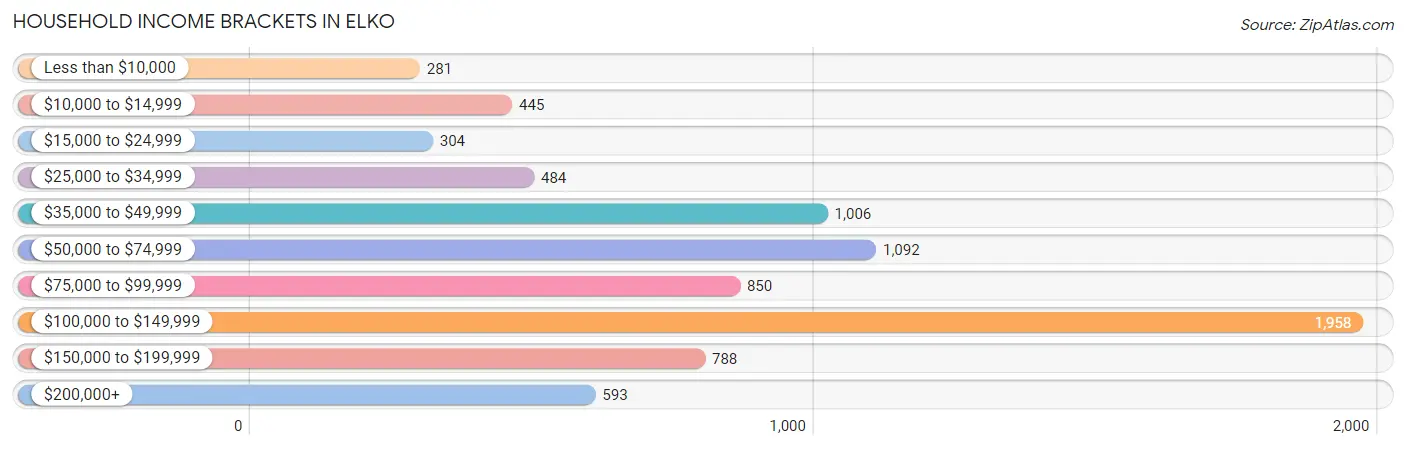
| Income Bracket | # Households | % Households |
| Less than $10,000 | 281 | 3.6% |
| $10,000 to $14,999 | 445 | 5.7% |
| $15,000 to $24,999 | 304 | 3.9% |
| $25,000 to $34,999 | 484 | 6.2% |
| $35,000 to $49,999 | 1,006 | 12.9% |
| $50,000 to $74,999 | 1,092 | 14.0% |
| $75,000 to $99,999 | 850 | 10.9% |
| $100,000 to $149,999 | 1,958 | 25.1% |
| $150,000 to $199,999 | 788 | 10.1% |
| $200,000+ | 593 | 7.6% |
Household Income by Householder Age in Elko
The median household income in Elko is $85,000, with the highest median household income of $94,358 found in the 25 to 44 years age bracket for the primary householder. A total of 3,191 households (40.9%) fall into this category. Meanwhile, the 65+ years age bracket for the primary householder has the lowest median household income of $50,980, with 1,432 households (18.3%) in this group.
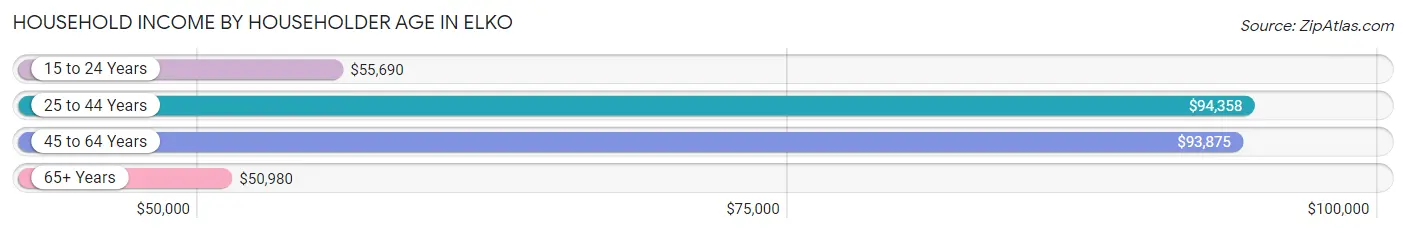
| Income Bracket | # Households | Median Income |
| 15 to 24 Years | 600 (7.7%) | $55,690 |
| 25 to 44 Years | 3,191 (40.9%) | $94,358 |
| 45 to 64 Years | 2,579 (33.1%) | $93,875 |
| 65+ Years | 1,432 (18.3%) | $50,980 |
| Total | 7,802 (100.0%) | $85,000 |
Poverty in Elko
Income Below Poverty by Sex and Age in Elko
With 10.3% poverty level for males and 12.8% for females among the residents of Elko, under 5 year old males and 75 year old and over females are the most vulnerable to poverty, with 150 males (21.4%) and 118 females (31.0%) in their respective age groups living below the poverty level.
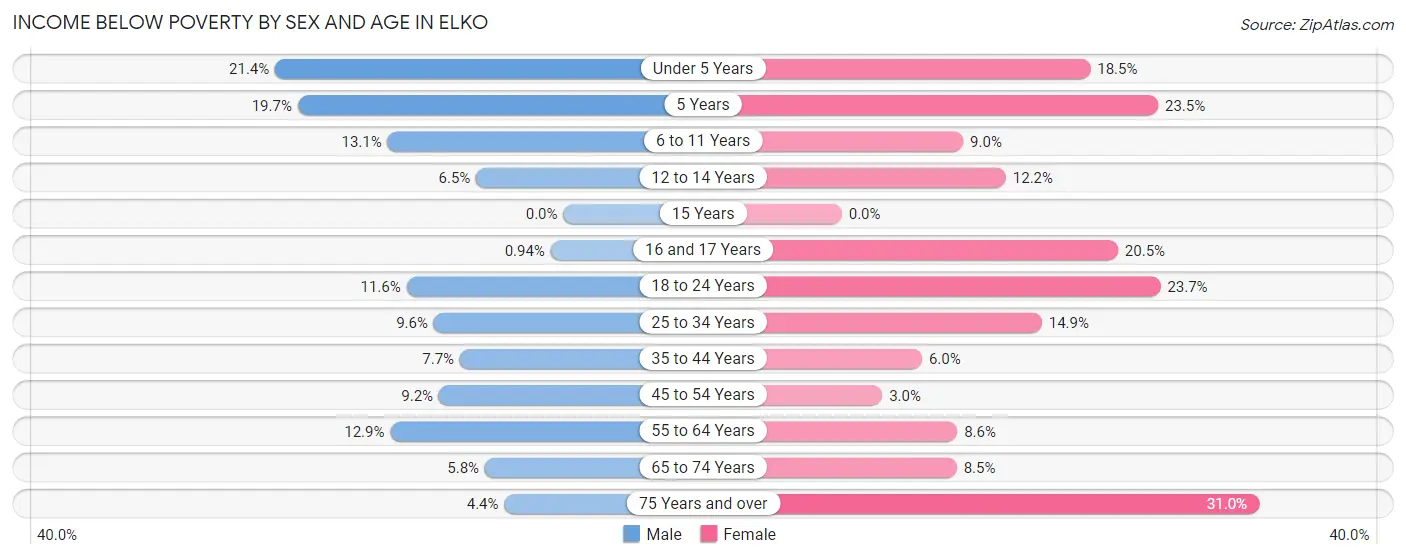
| Age Bracket | Male | Female |
| Under 5 Years | 150 (21.4%) | 145 (18.4%) |
| 5 Years | 43 (19.7%) | 27 (23.5%) |
| 6 to 11 Years | 140 (13.1%) | 48 (9.0%) |
| 12 to 14 Years | 26 (6.5%) | 58 (12.2%) |
| 15 Years | 0 (0.0%) | 0 (0.0%) |
| 16 and 17 Years | 2 (0.9%) | 33 (20.5%) |
| 18 to 24 Years | 128 (11.6%) | 265 (23.7%) |
| 25 to 34 Years | 187 (9.6%) | 213 (14.8%) |
| 35 to 44 Years | 120 (7.7%) | 75 (5.9%) |
| 45 to 54 Years | 104 (9.2%) | 30 (3.0%) |
| 55 to 64 Years | 153 (12.9%) | 86 (8.6%) |
| 65 to 74 Years | 49 (5.8%) | 75 (8.5%) |
| 75 Years and over | 17 (4.4%) | 118 (31.0%) |
| Total | 1,119 (10.3%) | 1,173 (12.8%) |
Income Above Poverty by Sex and Age in Elko
According to the poverty statistics in Elko, males aged 15 years and females aged 15 years are the age groups that are most secure financially, with 100.0% of males and 100.0% of females in these age groups living above the poverty line.
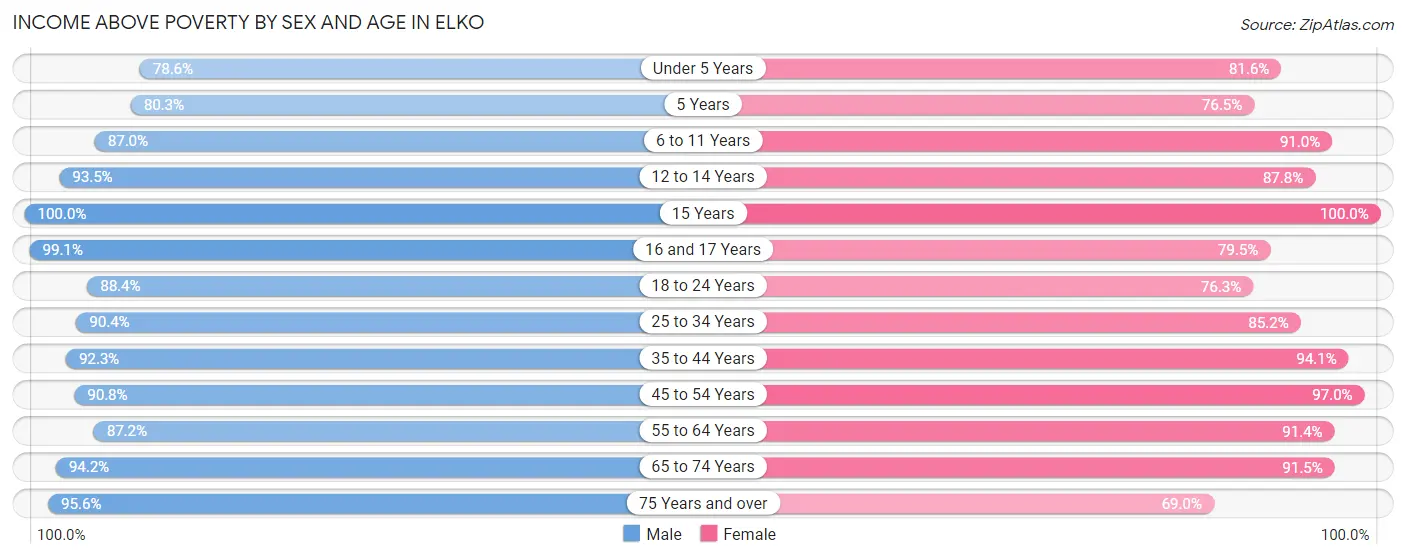
| Age Bracket | Male | Female |
| Under 5 Years | 551 (78.6%) | 641 (81.6%) |
| 5 Years | 175 (80.3%) | 88 (76.5%) |
| 6 to 11 Years | 933 (87.0%) | 485 (91.0%) |
| 12 to 14 Years | 376 (93.5%) | 418 (87.8%) |
| 15 Years | 93 (100.0%) | 39 (100.0%) |
| 16 and 17 Years | 210 (99.1%) | 128 (79.5%) |
| 18 to 24 Years | 972 (88.4%) | 855 (76.3%) |
| 25 to 34 Years | 1,757 (90.4%) | 1,221 (85.2%) |
| 35 to 44 Years | 1,443 (92.3%) | 1,185 (94.1%) |
| 45 to 54 Years | 1,021 (90.8%) | 971 (97.0%) |
| 55 to 64 Years | 1,038 (87.2%) | 918 (91.4%) |
| 65 to 74 Years | 793 (94.2%) | 804 (91.5%) |
| 75 Years and over | 371 (95.6%) | 263 (69.0%) |
| Total | 9,733 (89.7%) | 8,016 (87.2%) |
Income Below Poverty Among Married-Couple Families in Elko
The poverty statistics for married-couple families in Elko show that 2.9% or 109 of the total 3,726 families live below the poverty line. Families with 5 or more children have the highest poverty rate of 17.8%, comprising of 8 families. On the other hand, families with no children have the lowest poverty rate of 1.0%, which includes 19 families.
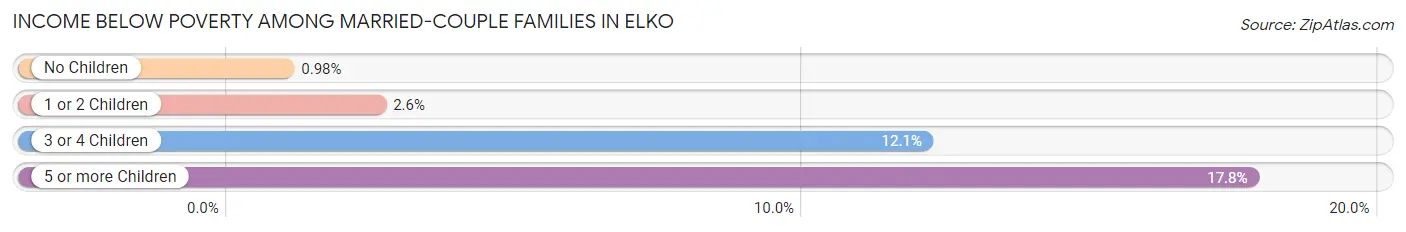
| Children | Above Poverty | Below Poverty |
| No Children | 1,917 (99.0%) | 19 (1.0%) |
| 1 or 2 Children | 1,322 (97.4%) | 35 (2.6%) |
| 3 or 4 Children | 341 (87.9%) | 47 (12.1%) |
| 5 or more Children | 37 (82.2%) | 8 (17.8%) |
| Total | 3,617 (97.1%) | 109 (2.9%) |
Income Below Poverty Among Single-Parent Households in Elko
According to the poverty data in Elko, 22.9% or 91 single-father households and 27.8% or 191 single-mother households are living below the poverty line. Among single-father households, those with 1 or 2 children have the highest poverty rate, with 78 households (30.5%) experiencing poverty. Likewise, among single-mother households, those with 3 or 4 children have the highest poverty rate, with 76 households (73.8%) falling below the poverty line.
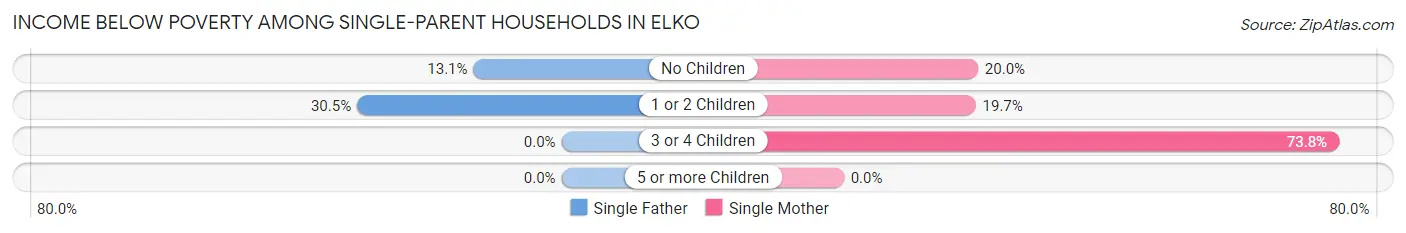
| Children | Single Father | Single Mother |
| No Children | 13 (13.1%) | 22 (20.0%) |
| 1 or 2 Children | 78 (30.5%) | 93 (19.7%) |
| 3 or 4 Children | 0 (0.0%) | 76 (73.8%) |
| 5 or more Children | 0 (0.0%) | 0 (0.0%) |
| Total | 91 (22.9%) | 191 (27.8%) |
Income Below Poverty Among Married-Couple vs Single-Parent Households in Elko
The poverty data for Elko shows that 109 of the married-couple family households (2.9%) and 282 of the single-parent households (26.0%) are living below the poverty level. Within the married-couple family households, those with 5 or more children have the highest poverty rate, with 8 households (17.8%) falling below the poverty line. Among the single-parent households, those with 3 or 4 children have the highest poverty rate, with 76 household (60.3%) living below poverty.
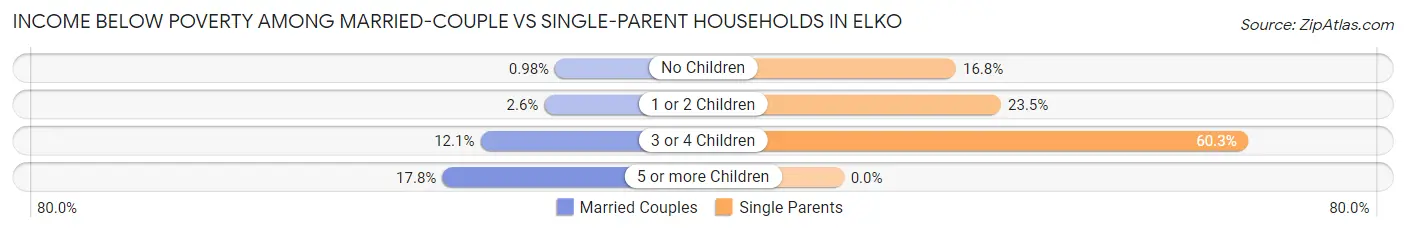
| Children | Married-Couple Families | Single-Parent Households |
| No Children | 19 (1.0%) | 35 (16.8%) |
| 1 or 2 Children | 35 (2.6%) | 171 (23.5%) |
| 3 or 4 Children | 47 (12.1%) | 76 (60.3%) |
| 5 or more Children | 8 (17.8%) | 0 (0.0%) |
| Total | 109 (2.9%) | 282 (26.0%) |
Race in Elko
The most populous races in Elko are White / Caucasian (14,708 | 71.7%), Hispanic or Latino (5,960 | 29.0%), and Two or more Races (2,511 | 12.2%).
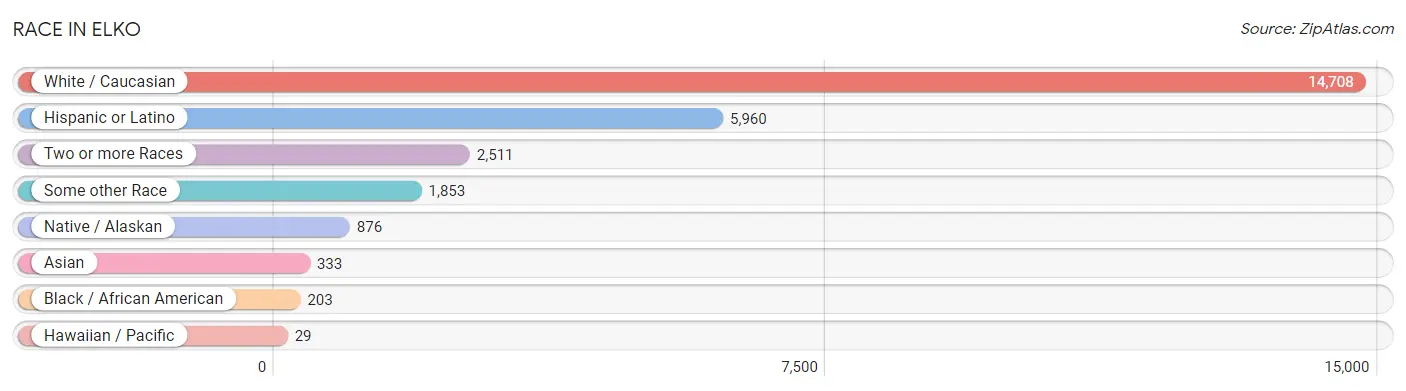
| Race | # Population | % Population |
| Asian | 333 | 1.6% |
| Black / African American | 203 | 1.0% |
| Hawaiian / Pacific | 29 | 0.1% |
| Hispanic or Latino | 5,960 | 29.0% |
| Native / Alaskan | 876 | 4.3% |
| White / Caucasian | 14,708 | 71.7% |
| Two or more Races | 2,511 | 12.2% |
| Some other Race | 1,853 | 9.0% |
| Total | 20,513 | 100.0% |
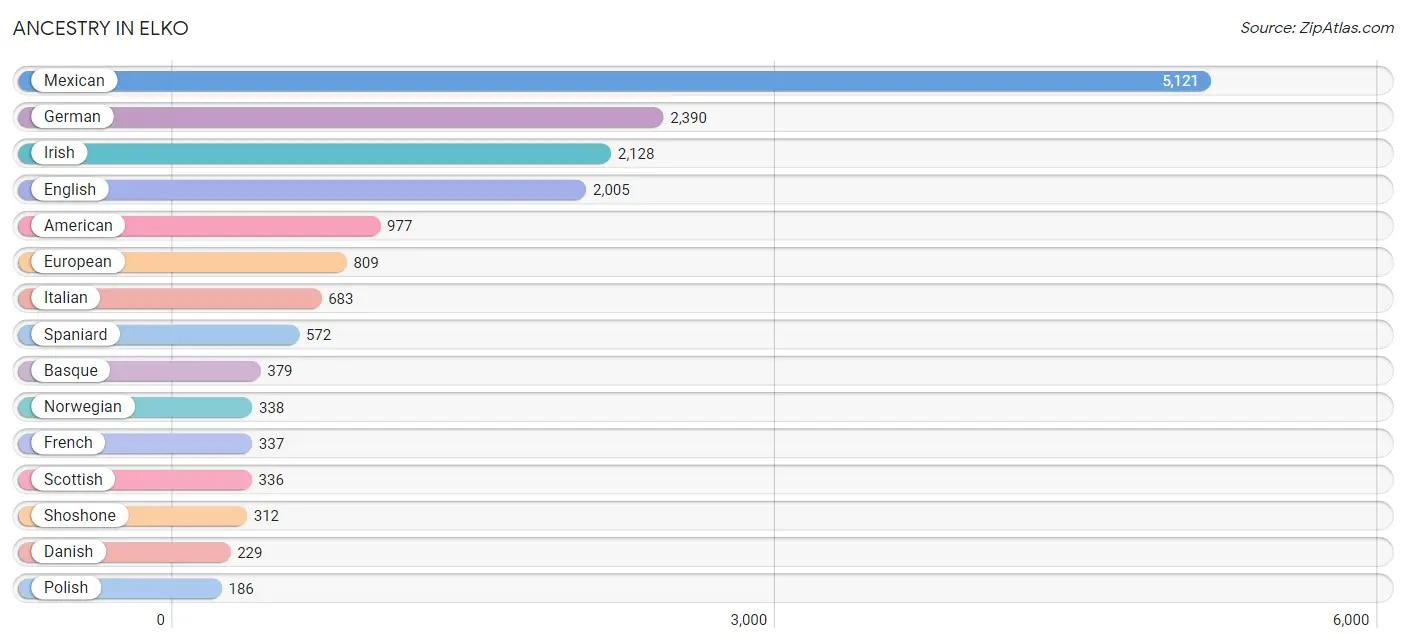
Ancestry in Elko
The most populous ancestries reported in Elko are Mexican (5,121 | 25.0%), German (2,390 | 11.7%), Irish (2,128 | 10.4%), English (2,005 | 9.8%), and American (977 | 4.8%), together accounting for 61.5% of all Elko residents.
| Ancestry | # Population | % Population |
| African | 29 | 0.1% |
| American | 977 | 4.8% |
| Austrian | 82 | 0.4% |
| Basque | 379 | 1.8% |
| Bhutanese | 79 | 0.4% |
| Blackfeet | 8 | 0.0% |
| British | 104 | 0.5% |
| Burmese | 35 | 0.2% |
| Canadian | 47 | 0.2% |
| Central American | 1 | 0.0% |
| Cherokee | 16 | 0.1% |
| Chippewa | 9 | 0.0% |
| Choctaw | 47 | 0.2% |
| Colombian | 6 | 0.0% |
| Comanche | 6 | 0.0% |
| Croatian | 4 | 0.0% |
| Czech | 74 | 0.4% |
| Danish | 229 | 1.1% |
| Dutch | 132 | 0.6% |
| Eastern European | 32 | 0.2% |
| English | 2,005 | 9.8% |
| European | 809 | 3.9% |
| Finnish | 21 | 0.1% |
| French | 337 | 1.6% |
| French American Indian | 13 | 0.1% |
| French Canadian | 33 | 0.2% |
| German | 2,390 | 11.7% |
| Ghanaian | 20 | 0.1% |
| Greek | 148 | 0.7% |
| Guatemalan | 1 | 0.0% |
| Hopi | 26 | 0.1% |
| Hungarian | 83 | 0.4% |
| Indian (Asian) | 87 | 0.4% |
| Inupiat | 6 | 0.0% |
| Iranian | 19 | 0.1% |
| Irish | 2,128 | 10.4% |
| Italian | 683 | 3.3% |
| Korean | 84 | 0.4% |
| Lithuanian | 7 | 0.0% |
| Mexican | 5,121 | 25.0% |
| Mexican American Indian | 14 | 0.1% |
| Native Hawaiian | 21 | 0.1% |
| Navajo | 49 | 0.2% |
| Nigerian | 1 | 0.0% |
| Northern European | 7 | 0.0% |
| Norwegian | 338 | 1.7% |
| Paiute | 33 | 0.2% |
| Polish | 186 | 0.9% |
| Portuguese | 11 | 0.1% |
| Pueblo | 3 | 0.0% |
| Puerto Rican | 28 | 0.1% |
| Russian | 24 | 0.1% |
| Samoan | 33 | 0.2% |
| Scandinavian | 76 | 0.4% |
| Scotch-Irish | 139 | 0.7% |
| Scottish | 336 | 1.6% |
| Shoshone | 312 | 1.5% |
| Sioux | 3 | 0.0% |
| Slovak | 173 | 0.8% |
| Slovene | 106 | 0.5% |
| South American | 6 | 0.0% |
| Spaniard | 572 | 2.8% |
| Spanish | 186 | 0.9% |
| Sri Lankan | 90 | 0.4% |
| Subsaharan African | 59 | 0.3% |
| Swedish | 157 | 0.8% |
| Swiss | 14 | 0.1% |
| Thai | 42 | 0.2% |
| Ukrainian | 17 | 0.1% |
| Ute | 54 | 0.3% |
| Welsh | 154 | 0.7% |
| Yaqui | 47 | 0.2% |
| Yugoslavian | 4 | 0.0% | View All 73 Rows |
Immigrants in Elko
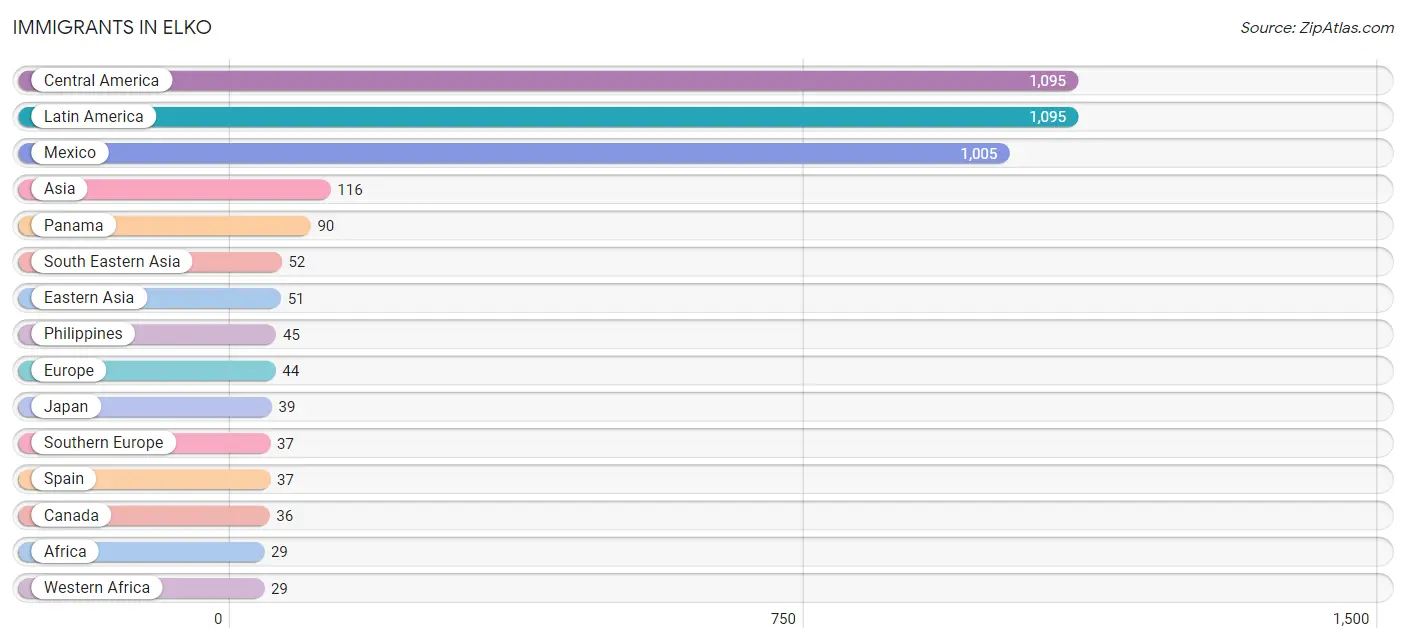
The most numerous immigrant groups reported in Elko came from Central America (1,095 | 5.3%), Latin America (1,095 | 5.3%), Mexico (1,005 | 4.9%), Asia (116 | 0.6%), and Panama (90 | 0.4%), together accounting for 16.6% of all Elko residents.
| Immigration Origin | # Population | % Population |
| Africa | 29 | 0.1% |
| Asia | 116 | 0.6% |
| Australia | 23 | 0.1% |
| Canada | 36 | 0.2% |
| Central America | 1,095 | 5.3% |
| China | 5 | 0.0% |
| Eastern Asia | 51 | 0.3% |
| Eastern Europe | 7 | 0.0% |
| Europe | 44 | 0.2% |
| Ghana | 20 | 0.1% |
| India | 13 | 0.1% |
| Japan | 39 | 0.2% |
| Korea | 7 | 0.0% |
| Latin America | 1,095 | 5.3% |
| Mexico | 1,005 | 4.9% |
| Oceania | 23 | 0.1% |
| Panama | 90 | 0.4% |
| Philippines | 45 | 0.2% |
| Russia | 7 | 0.0% |
| South Central Asia | 13 | 0.1% |
| South Eastern Asia | 52 | 0.3% |
| Southern Europe | 37 | 0.2% |
| Spain | 37 | 0.2% |
| Vietnam | 7 | 0.0% |
| Western Africa | 29 | 0.1% | View All 25 Rows |
Sex and Age in Elko
Sex and Age in Elko
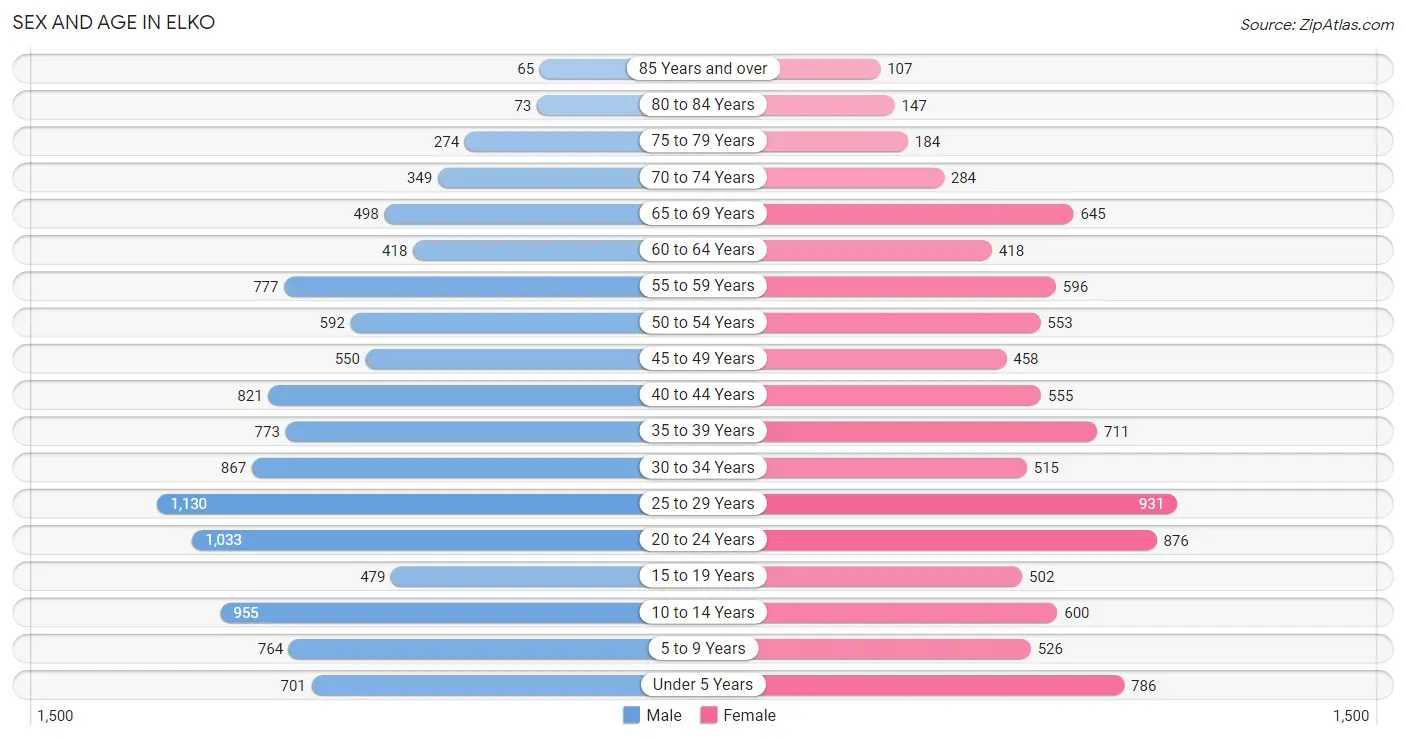
The most populous age groups in Elko are 25 to 29 Years (1,130 | 10.2%) for men and 25 to 29 Years (931 | 9.9%) for women.
| Age Bracket | Male | Female |
| Under 5 Years | 701 (6.3%) | 786 (8.4%) |
| 5 to 9 Years | 764 (6.9%) | 526 (5.6%) |
| 10 to 14 Years | 955 (8.6%) | 600 (6.4%) |
| 15 to 19 Years | 479 (4.3%) | 502 (5.3%) |
| 20 to 24 Years | 1,033 (9.3%) | 876 (9.3%) |
| 25 to 29 Years | 1,130 (10.2%) | 931 (9.9%) |
| 30 to 34 Years | 867 (7.8%) | 515 (5.5%) |
| 35 to 39 Years | 773 (7.0%) | 711 (7.6%) |
| 40 to 44 Years | 821 (7.4%) | 555 (5.9%) |
| 45 to 49 Years | 550 (5.0%) | 458 (4.9%) |
| 50 to 54 Years | 592 (5.3%) | 553 (5.9%) |
| 55 to 59 Years | 777 (7.0%) | 596 (6.3%) |
| 60 to 64 Years | 418 (3.8%) | 418 (4.4%) |
| 65 to 69 Years | 498 (4.5%) | 645 (6.9%) |
| 70 to 74 Years | 349 (3.1%) | 284 (3.0%) |
| 75 to 79 Years | 274 (2.5%) | 184 (2.0%) |
| 80 to 84 Years | 73 (0.7%) | 147 (1.6%) |
| 85 Years and over | 65 (0.6%) | 107 (1.1%) |
| Total | 11,119 (100.0%) | 9,394 (100.0%) |
Families and Households in Elko
Median Family Size in Elko
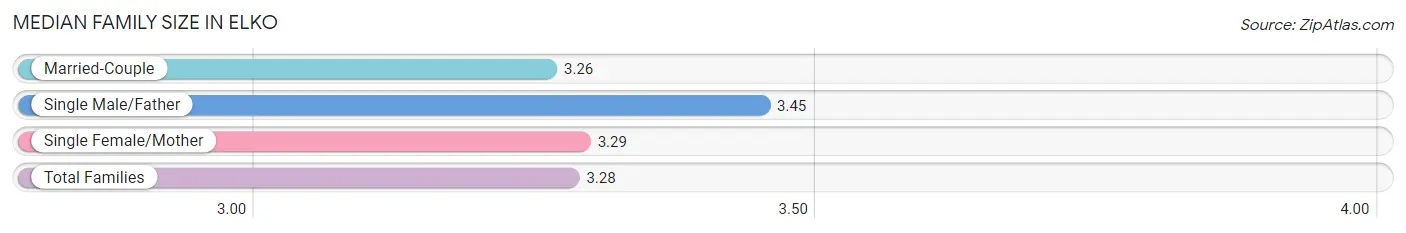
The median family size in Elko is 3.28 persons per family, with single male/father families (397 | 8.3%) accounting for the largest median family size of 3.45 persons per family. On the other hand, married-couple families (3,726 | 77.5%) represent the smallest median family size with 3.26 persons per family.
| Family Type | # Families | Family Size |
| Married-Couple | 3,726 (77.5%) | 3.26 |
| Single Male/Father | 397 (8.3%) | 3.45 |
| Single Female/Mother | 686 (14.3%) | 3.29 |
| Total Families | 4,809 (100.0%) | 3.28 |
Median Household Size in Elko
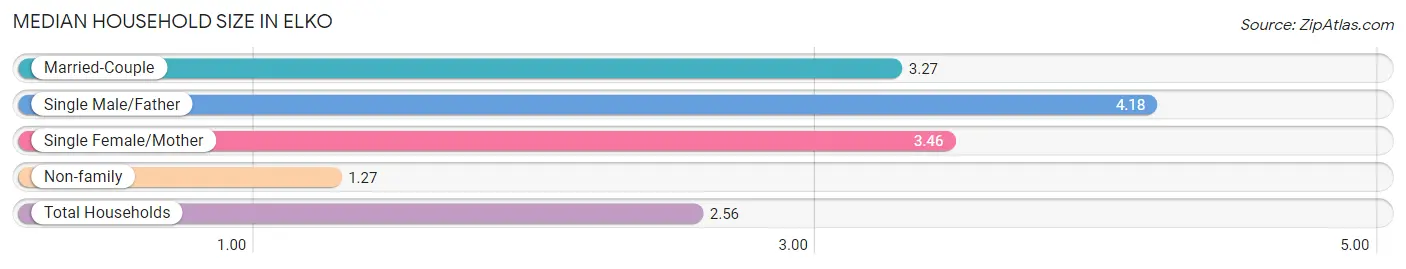
The median household size in Elko is 2.56 persons per household, with single male/father households (397 | 5.1%) accounting for the largest median household size of 4.18 persons per household. non-family households (2,993 | 38.4%) represent the smallest median household size with 1.27 persons per household.
| Household Type | # Households | Household Size |
| Married-Couple | 3,726 (47.8%) | 3.27 |
| Single Male/Father | 397 (5.1%) | 4.18 |
| Single Female/Mother | 686 (8.8%) | 3.46 |
| Non-family | 2,993 (38.4%) | 1.27 |
| Total Households | 7,802 (100.0%) | 2.56 |
Household Size by Marriage Status in Elko
Out of a total of 7,802 households in Elko, 4,809 (61.6%) are family households, while 2,993 (38.4%) are nonfamily households. The most numerous type of family households are 2-person households, comprising 2,012, and the most common type of nonfamily households are 1-person households, comprising 2,454.
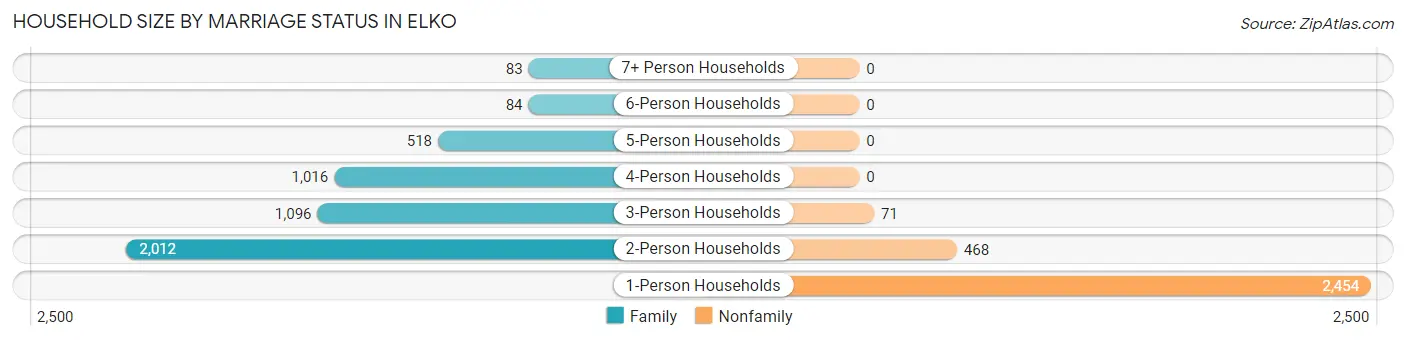
| Household Size | Family Households | Nonfamily Households |
| 1-Person Households | - | 2,454 (31.5%) |
| 2-Person Households | 2,012 (25.8%) | 468 (6.0%) |
| 3-Person Households | 1,096 (14.1%) | 71 (0.9%) |
| 4-Person Households | 1,016 (13.0%) | 0 (0.0%) |
| 5-Person Households | 518 (6.6%) | 0 (0.0%) |
| 6-Person Households | 84 (1.1%) | 0 (0.0%) |
| 7+ Person Households | 83 (1.1%) | 0 (0.0%) |
| Total | 4,809 (61.6%) | 2,993 (38.4%) |
Female Fertility in Elko
Fertility by Age in Elko
Average fertility rate in Elko is 56.0 births per 1,000 women. Women in the age bracket of 20 to 34 years have the highest fertility rate with 96.0 births per 1,000 women. Women in the age bracket of 20 to 34 years acount for 85.7% of all women with births.
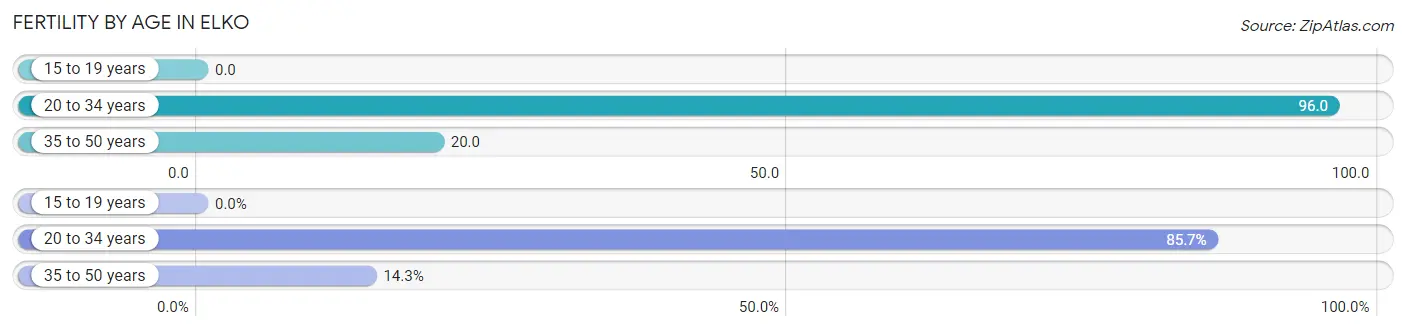
| Age Bracket | Women with Births | Births / 1,000 Women |
| 15 to 19 years | 0 (0.0%) | 0.0 |
| 20 to 34 years | 222 (85.7%) | 96.0 |
| 35 to 50 years | 37 (14.3%) | 20.0 |
| Total | 259 (100.0%) | 56.0 |
Fertility by Age by Marriage Status in Elko
77.2% of women with births (259) in Elko are married. The highest percentage of unmarried women with births falls into 35 to 50 years age bracket with 43.2% of them unmarried at the time of birth, while the lowest percentage of unmarried women with births belong to 20 to 34 years age bracket with 19.4% of them unmarried.
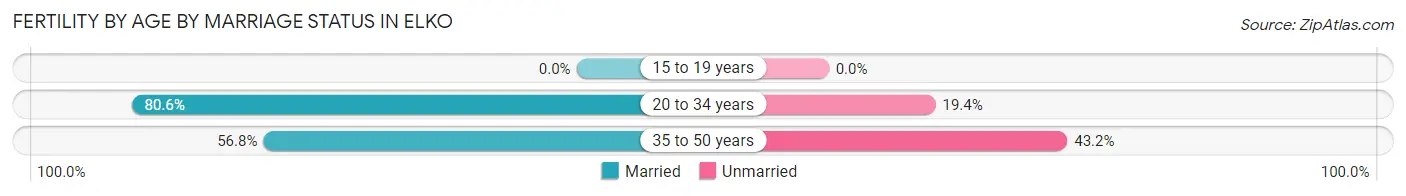
| Age Bracket | Married | Unmarried |
| 15 to 19 years | 0 (0.0%) | 0 (0.0%) |
| 20 to 34 years | 179 (80.6%) | 43 (19.4%) |
| 35 to 50 years | 21 (56.8%) | 16 (43.2%) |
| Total | 200 (77.2%) | 59 (22.8%) |
Fertility by Education in Elko
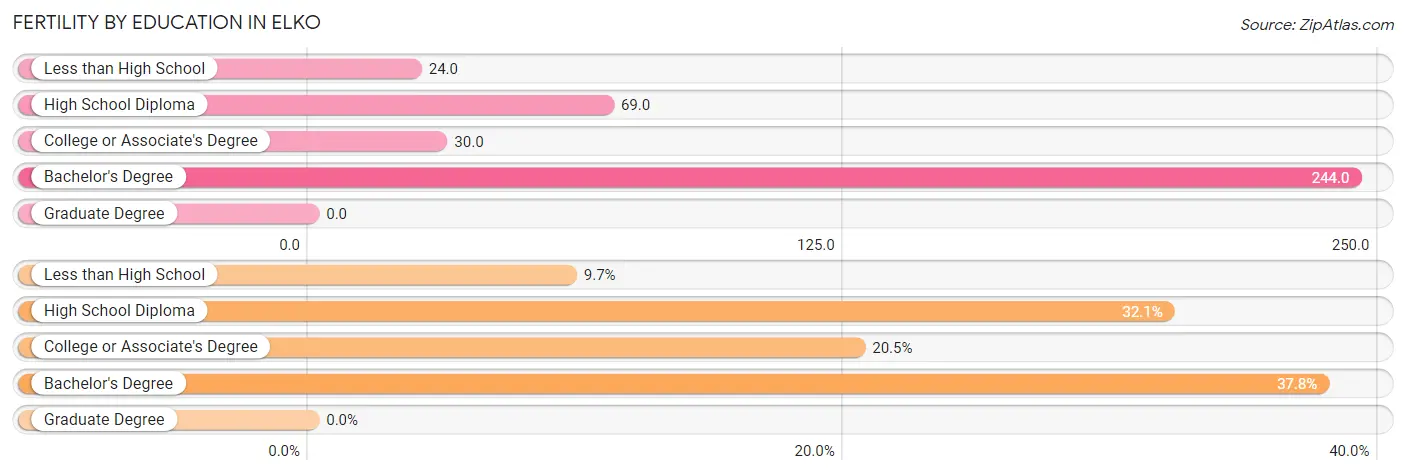
| Educational Attainment | Women with Births | Births / 1,000 Women |
| Less than High School | 25 (9.7%) | 24.0 |
| High School Diploma | 83 (32.1%) | 69.0 |
| College or Associate's Degree | 53 (20.5%) | 30.0 |
| Bachelor's Degree | 98 (37.8%) | 244.0 |
| Graduate Degree | 0 (0.0%) | 0.0 |
| Total | 259 (100.0%) | 56.0 |
Fertility by Education by Marriage Status in Elko
22.8% of women with births in Elko are unmarried. Women with the educational attainment of bachelor's degree are most likely to be married with 93.9% of them married at childbirth, while women with the educational attainment of high school diploma are least likely to be married with 41.0% of them unmarried at childbirth.
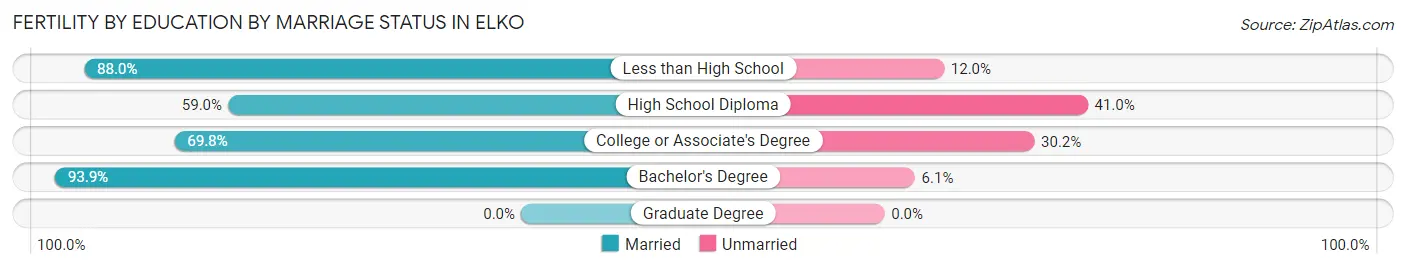
| Educational Attainment | Married | Unmarried |
| Less than High School | 22 (88.0%) | 3 (12.0%) |
| High School Diploma | 49 (59.0%) | 34 (41.0%) |
| College or Associate's Degree | 37 (69.8%) | 16 (30.2%) |
| Bachelor's Degree | 92 (93.9%) | 6 (6.1%) |
| Graduate Degree | 0 (0.0%) | 0 (0.0%) |
| Total | 200 (77.2%) | 59 (22.8%) |
Employment Characteristics in Elko
Employment by Class of Employer in Elko
Among the 10,301 employed individuals in Elko, private company employees (7,864 | 76.3%), local government employees (857 | 8.3%), and not-for-profit organizations (363 | 3.5%) make up the most common classes of employment.
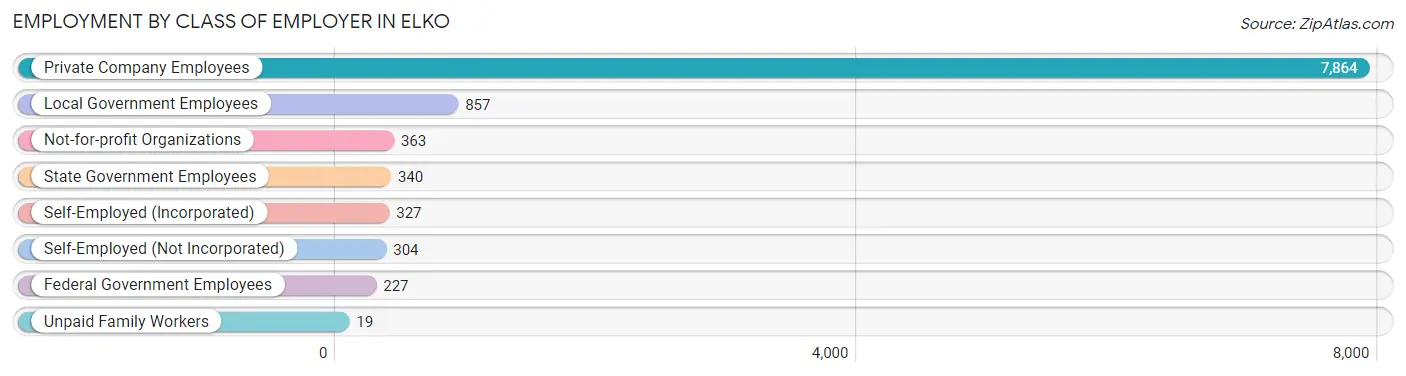
| Employer Class | # Employees | % Employees |
| Private Company Employees | 7,864 | 76.3% |
| Self-Employed (Incorporated) | 327 | 3.2% |
| Self-Employed (Not Incorporated) | 304 | 2.9% |
| Not-for-profit Organizations | 363 | 3.5% |
| Local Government Employees | 857 | 8.3% |
| State Government Employees | 340 | 3.3% |
| Federal Government Employees | 227 | 2.2% |
| Unpaid Family Workers | 19 | 0.2% |
| Total | 10,301 | 100.0% |
Employment Status by Age in Elko
According to the labor force statistics for Elko, out of the total population over 16 years of age (16,049), 68.4% or 10,978 individuals are in the labor force, with 4.5% or 494 of them unemployed. The age group with the highest labor force participation rate is 45 to 54 years, with 84.5% or 1,819 individuals in the labor force. Within the labor force, the 30 to 34 years age range has the highest percentage of unemployed individuals, with 8.8% or 99 of them being unemployed.
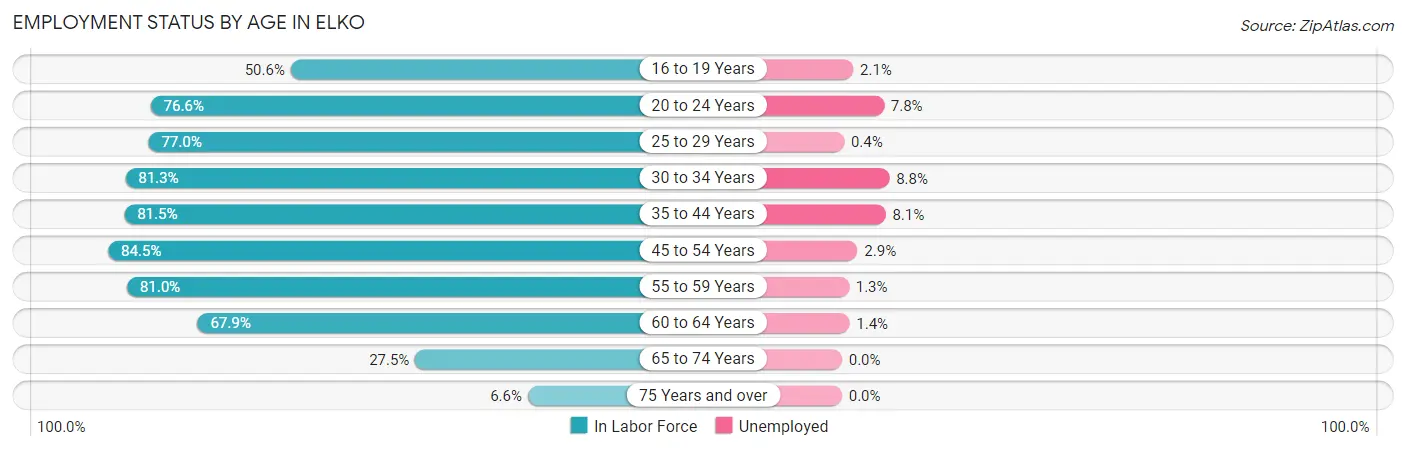
| Age Bracket | In Labor Force | Unemployed |
| 16 to 19 Years | 430 (50.6%) | 9 (2.1%) |
| 20 to 24 Years | 1,462 (76.6%) | 114 (7.8%) |
| 25 to 29 Years | 1,587 (77.0%) | 6 (0.4%) |
| 30 to 34 Years | 1,124 (81.3%) | 99 (8.8%) |
| 35 to 44 Years | 2,331 (81.5%) | 189 (8.1%) |
| 45 to 54 Years | 1,819 (84.5%) | 53 (2.9%) |
| 55 to 59 Years | 1,112 (81.0%) | 14 (1.3%) |
| 60 to 64 Years | 568 (67.9%) | 8 (1.4%) |
| 65 to 74 Years | 488 (27.5%) | 0 (0.0%) |
| 75 Years and over | 56 (6.6%) | 0 (0.0%) |
| Total | 10,978 (68.4%) | 494 (4.5%) |
Employment Status by Educational Attainment in Elko
According to labor force statistics for Elko, 80.1% of individuals (8,543) out of the total population between 25 and 64 years of age (10,665) are in the labor force, with 4.3% or 367 of them being unemployed. The group with the highest labor force participation rate are those with the educational attainment of bachelor's degree or higher, with 94.4% or 1,869 individuals in the labor force. Within the labor force, individuals with high school diploma education have the highest percentage of unemployment, with 6.3% or 151 of them being unemployed.
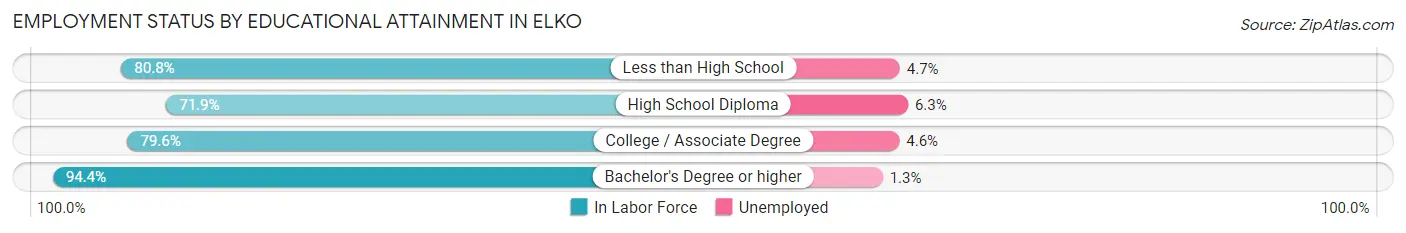
| Educational Attainment | In Labor Force | Unemployed |
| Less than High School | 966 (80.8%) | 56 (4.7%) |
| High School Diploma | 2,398 (71.9%) | 210 (6.3%) |
| College / Associate Degree | 3,307 (79.6%) | 191 (4.6%) |
| Bachelor's Degree or higher | 1,869 (94.4%) | 26 (1.3%) |
| Total | 8,543 (80.1%) | 459 (4.3%) |
Employment Occupations by Sex in Elko
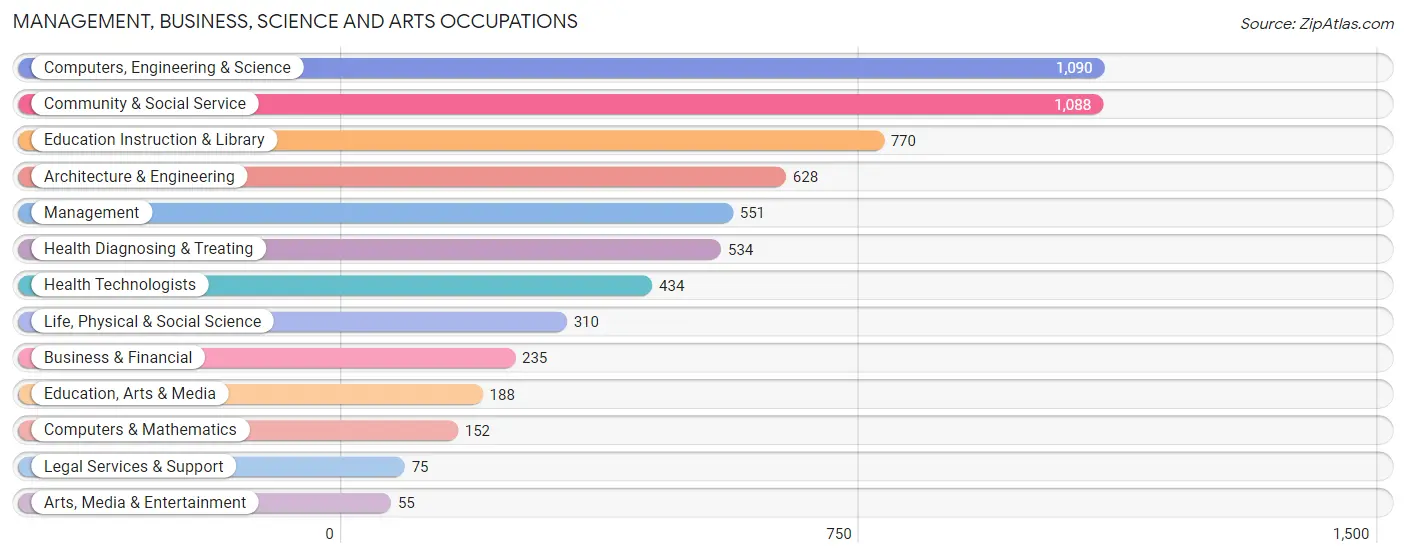
Management, Business, Science and Arts Occupations
The most common Management, Business, Science and Arts occupations in Elko are Computers, Engineering & Science (1,090 | 10.4%), Community & Social Service (1,088 | 10.4%), Education Instruction & Library (770 | 7.4%), Architecture & Engineering (628 | 6.0%), and Management (551 | 5.3%).
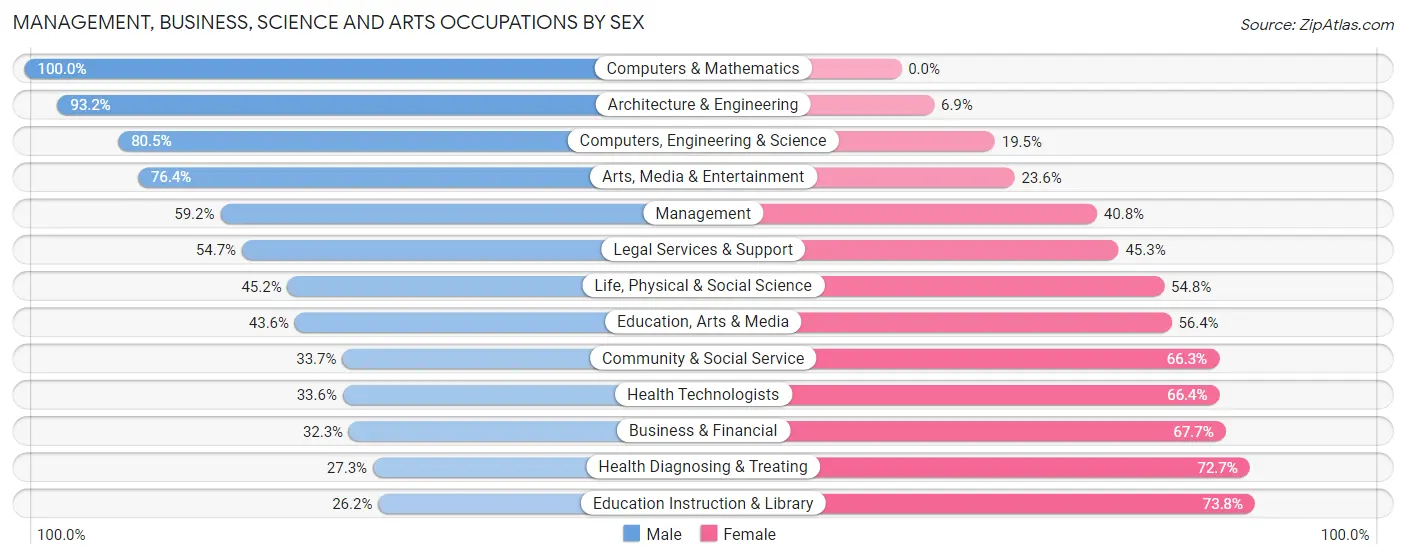
Management, Business, Science and Arts Occupations by Sex
Within the Management, Business, Science and Arts occupations in Elko, the most male-oriented occupations are Computers & Mathematics (100.0%), Architecture & Engineering (93.1%), and Computers, Engineering & Science (80.5%), while the most female-oriented occupations are Education Instruction & Library (73.8%), Health Diagnosing & Treating (72.7%), and Business & Financial (67.7%).
| Occupation | Male | Female |
| Management | 326 (59.2%) | 225 (40.8%) |
| Business & Financial | 76 (32.3%) | 159 (67.7%) |
| Computers, Engineering & Science | 877 (80.5%) | 213 (19.5%) |
| Computers & Mathematics | 152 (100.0%) | 0 (0.0%) |
| Architecture & Engineering | 585 (93.1%) | 43 (6.9%) |
| Life, Physical & Social Science | 140 (45.2%) | 170 (54.8%) |
| Community & Social Service | 367 (33.7%) | 721 (66.3%) |
| Education, Arts & Media | 82 (43.6%) | 106 (56.4%) |
| Legal Services & Support | 41 (54.7%) | 34 (45.3%) |
| Education Instruction & Library | 202 (26.2%) | 568 (73.8%) |
| Arts, Media & Entertainment | 42 (76.4%) | 13 (23.6%) |
| Health Diagnosing & Treating | 146 (27.3%) | 388 (72.7%) |
| Health Technologists | 146 (33.6%) | 288 (66.4%) |
| Total (Category) | 1,792 (51.2%) | 1,706 (48.8%) |
| Total (Overall) | 6,224 (59.5%) | 4,233 (40.5%) |
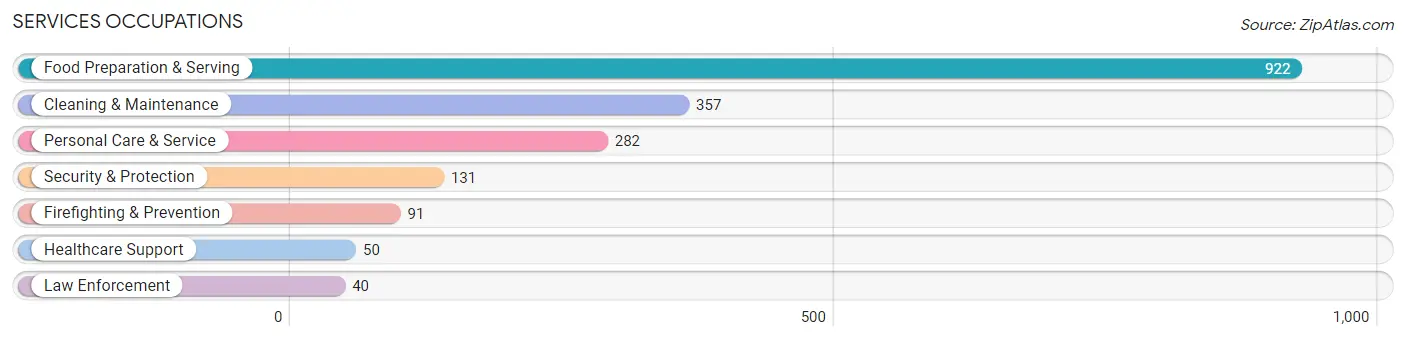
Services Occupations
The most common Services occupations in Elko are Food Preparation & Serving (922 | 8.8%), Cleaning & Maintenance (357 | 3.4%), Personal Care & Service (282 | 2.7%), Security & Protection (131 | 1.3%), and Firefighting & Prevention (91 | 0.9%).
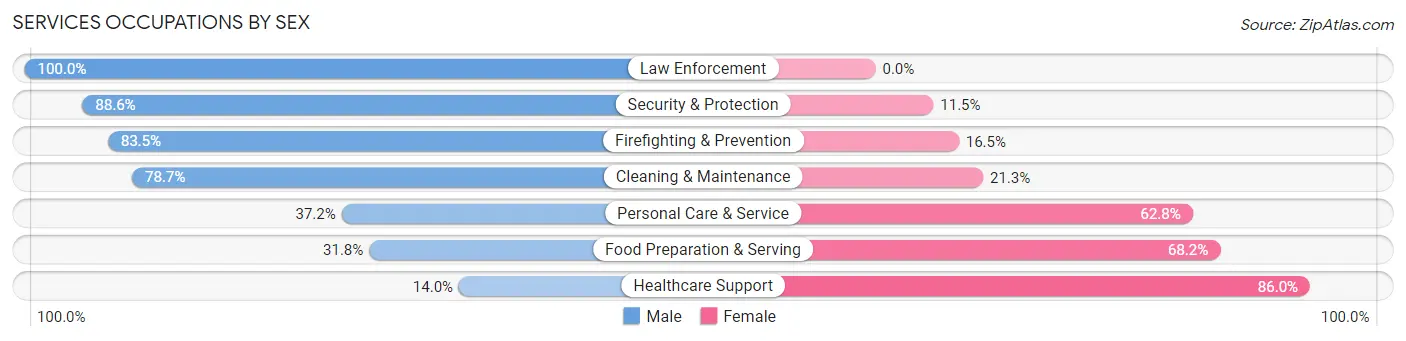
Services Occupations by Sex
Within the Services occupations in Elko, the most male-oriented occupations are Law Enforcement (100.0%), Security & Protection (88.5%), and Firefighting & Prevention (83.5%), while the most female-oriented occupations are Healthcare Support (86.0%), Food Preparation & Serving (68.2%), and Personal Care & Service (62.8%).
| Occupation | Male | Female |
| Healthcare Support | 7 (14.0%) | 43 (86.0%) |
| Security & Protection | 116 (88.5%) | 15 (11.5%) |
| Firefighting & Prevention | 76 (83.5%) | 15 (16.5%) |
| Law Enforcement | 40 (100.0%) | 0 (0.0%) |
| Food Preparation & Serving | 293 (31.8%) | 629 (68.2%) |
| Cleaning & Maintenance | 281 (78.7%) | 76 (21.3%) |
| Personal Care & Service | 105 (37.2%) | 177 (62.8%) |
| Total (Category) | 802 (46.0%) | 940 (54.0%) |
| Total (Overall) | 6,224 (59.5%) | 4,233 (40.5%) |
Sales and Office Occupations
The most common Sales and Office occupations in Elko are Office & Administration (1,061 | 10.2%), and Sales & Related (745 | 7.1%).

Sales and Office Occupations by Sex

| Occupation | Male | Female |
| Sales & Related | 262 (35.2%) | 483 (64.8%) |
| Office & Administration | 137 (12.9%) | 924 (87.1%) |
| Total (Category) | 399 (22.1%) | 1,407 (77.9%) |
| Total (Overall) | 6,224 (59.5%) | 4,233 (40.5%) |
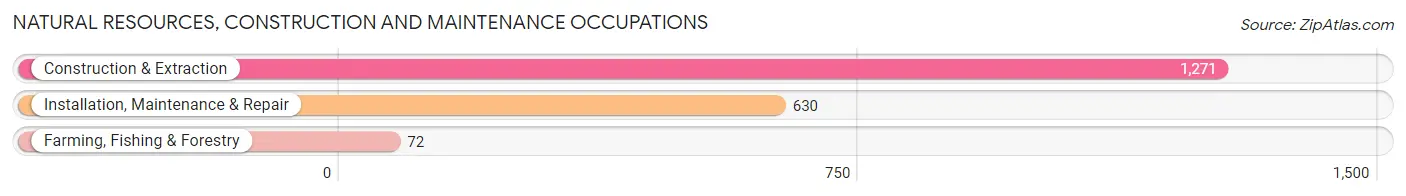
Natural Resources, Construction and Maintenance Occupations
The most common Natural Resources, Construction and Maintenance occupations in Elko are Construction & Extraction (1,271 | 12.1%), Installation, Maintenance & Repair (630 | 6.0%), and Farming, Fishing & Forestry (72 | 0.7%).
Natural Resources, Construction and Maintenance Occupations by Sex
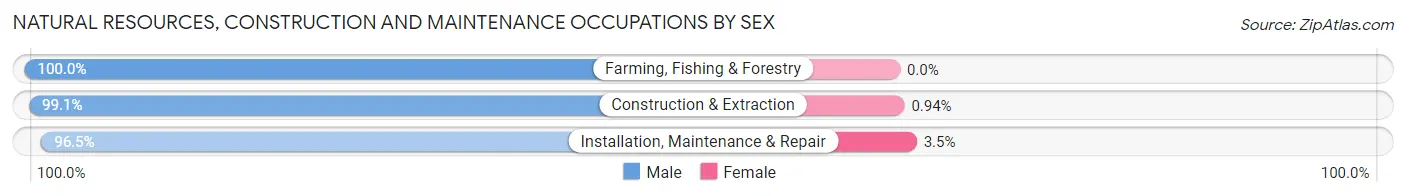
| Occupation | Male | Female |
| Farming, Fishing & Forestry | 72 (100.0%) | 0 (0.0%) |
| Construction & Extraction | 1,259 (99.1%) | 12 (0.9%) |
| Installation, Maintenance & Repair | 608 (96.5%) | 22 (3.5%) |
| Total (Category) | 1,939 (98.3%) | 34 (1.7%) |
| Total (Overall) | 6,224 (59.5%) | 4,233 (40.5%) |
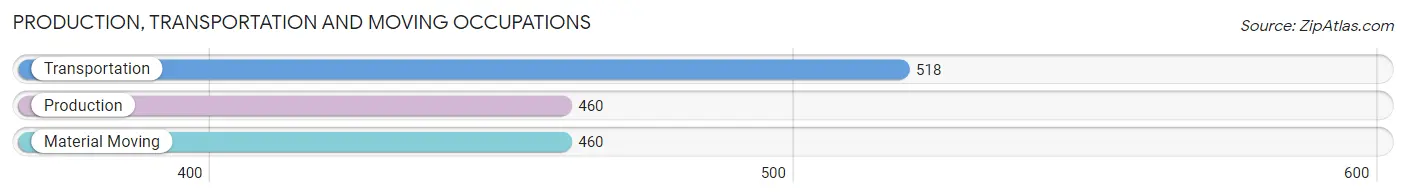
Production, Transportation and Moving Occupations
The most common Production, Transportation and Moving occupations in Elko are Transportation (518 | 5.0%), Production (460 | 4.4%), and Material Moving (460 | 4.4%).
Production, Transportation and Moving Occupations by Sex
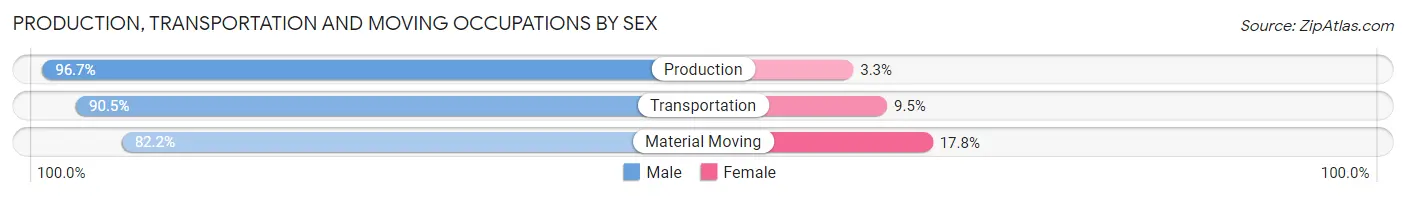
| Occupation | Male | Female |
| Production | 445 (96.7%) | 15 (3.3%) |
| Transportation | 469 (90.5%) | 49 (9.5%) |
| Material Moving | 378 (82.2%) | 82 (17.8%) |
| Total (Category) | 1,292 (89.8%) | 146 (10.2%) |
| Total (Overall) | 6,224 (59.5%) | 4,233 (40.5%) |
Employment Industries by Sex in Elko
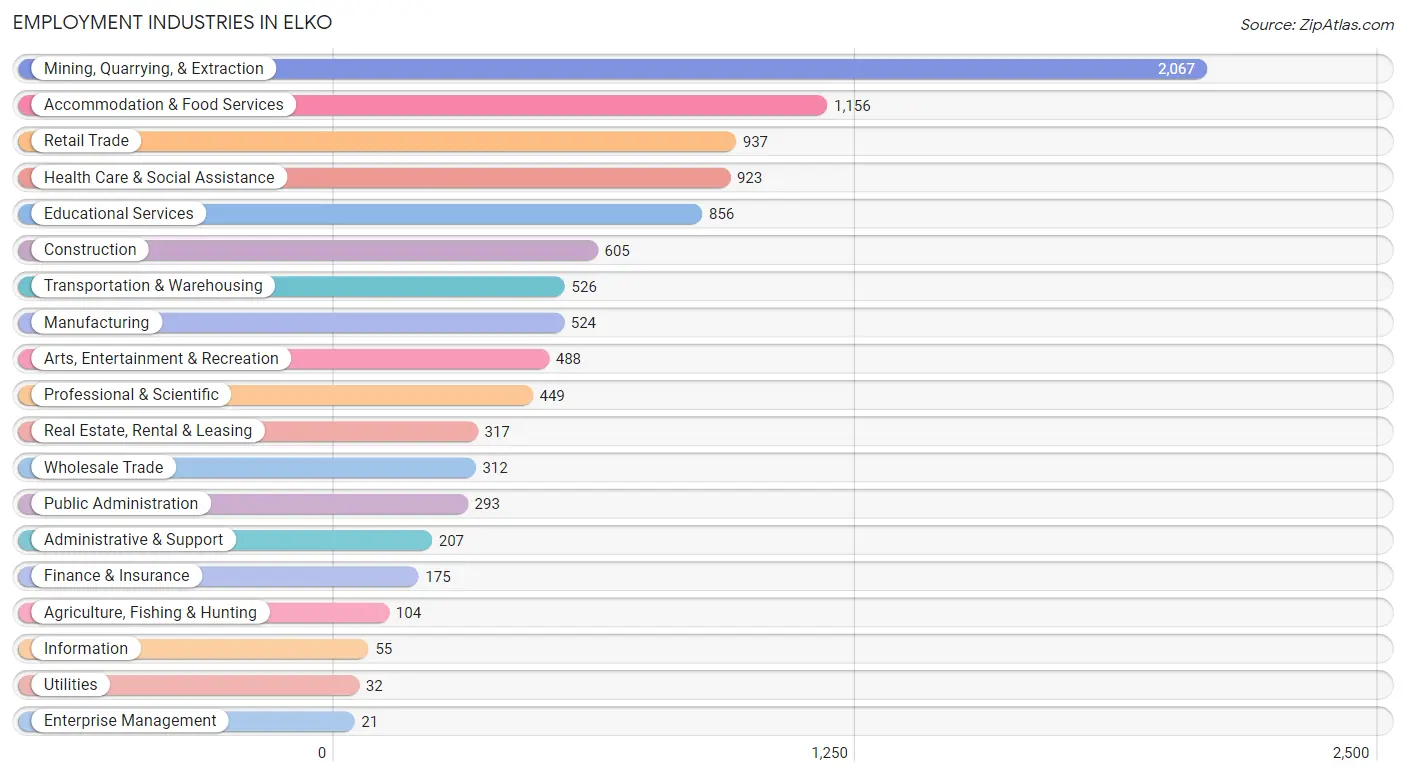
Employment Industries in Elko
The major employment industries in Elko include Mining, Quarrying, & Extraction (2,067 | 19.8%), Accommodation & Food Services (1,156 | 11.1%), Retail Trade (937 | 9.0%), Health Care & Social Assistance (923 | 8.8%), and Educational Services (856 | 8.2%).
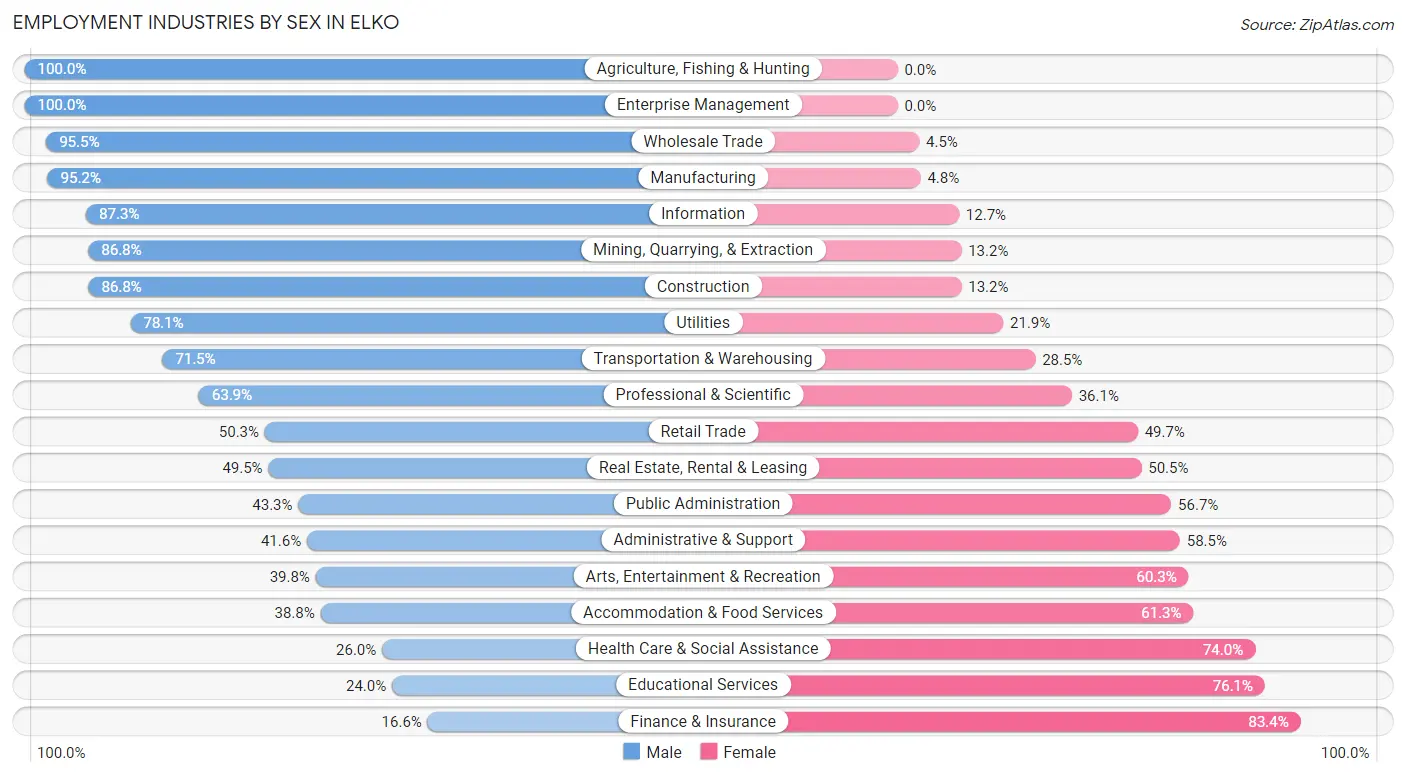
Employment Industries by Sex in Elko
The Elko industries that see more men than women are Agriculture, Fishing & Hunting (100.0%), Enterprise Management (100.0%), and Wholesale Trade (95.5%), whereas the industries that tend to have a higher number of women are Finance & Insurance (83.4%), Educational Services (76.0%), and Health Care & Social Assistance (74.0%).
| Industry | Male | Female |
| Agriculture, Fishing & Hunting | 104 (100.0%) | 0 (0.0%) |
| Mining, Quarrying, & Extraction | 1,794 (86.8%) | 273 (13.2%) |
| Construction | 525 (86.8%) | 80 (13.2%) |
| Manufacturing | 499 (95.2%) | 25 (4.8%) |
| Wholesale Trade | 298 (95.5%) | 14 (4.5%) |
| Retail Trade | 471 (50.3%) | 466 (49.7%) |
| Transportation & Warehousing | 376 (71.5%) | 150 (28.5%) |
| Utilities | 25 (78.1%) | 7 (21.9%) |
| Information | 48 (87.3%) | 7 (12.7%) |
| Finance & Insurance | 29 (16.6%) | 146 (83.4%) |
| Real Estate, Rental & Leasing | 157 (49.5%) | 160 (50.5%) |
| Professional & Scientific | 287 (63.9%) | 162 (36.1%) |
| Enterprise Management | 21 (100.0%) | 0 (0.0%) |
| Administrative & Support | 86 (41.5%) | 121 (58.5%) |
| Educational Services | 205 (23.9%) | 651 (76.0%) |
| Health Care & Social Assistance | 240 (26.0%) | 683 (74.0%) |
| Arts, Entertainment & Recreation | 194 (39.8%) | 294 (60.3%) |
| Accommodation & Food Services | 448 (38.8%) | 708 (61.3%) |
| Public Administration | 127 (43.3%) | 166 (56.7%) |
| Total | 6,224 (59.5%) | 4,233 (40.5%) |
Education in Elko
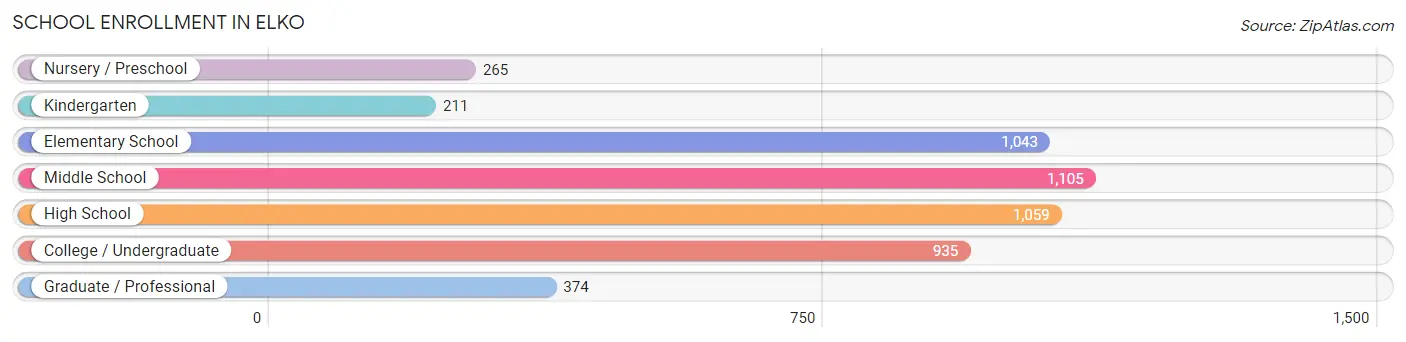
School Enrollment in Elko
The most common levels of schooling among the 4,992 students in Elko are middle school (1,105 | 22.1%), high school (1,059 | 21.2%), and elementary school (1,043 | 20.9%).
| School Level | # Students | % Students |
| Nursery / Preschool | 265 | 5.3% |
| Kindergarten | 211 | 4.2% |
| Elementary School | 1,043 | 20.9% |
| Middle School | 1,105 | 22.1% |
| High School | 1,059 | 21.2% |
| College / Undergraduate | 935 | 18.7% |
| Graduate / Professional | 374 | 7.5% |
| Total | 4,992 | 100.0% |
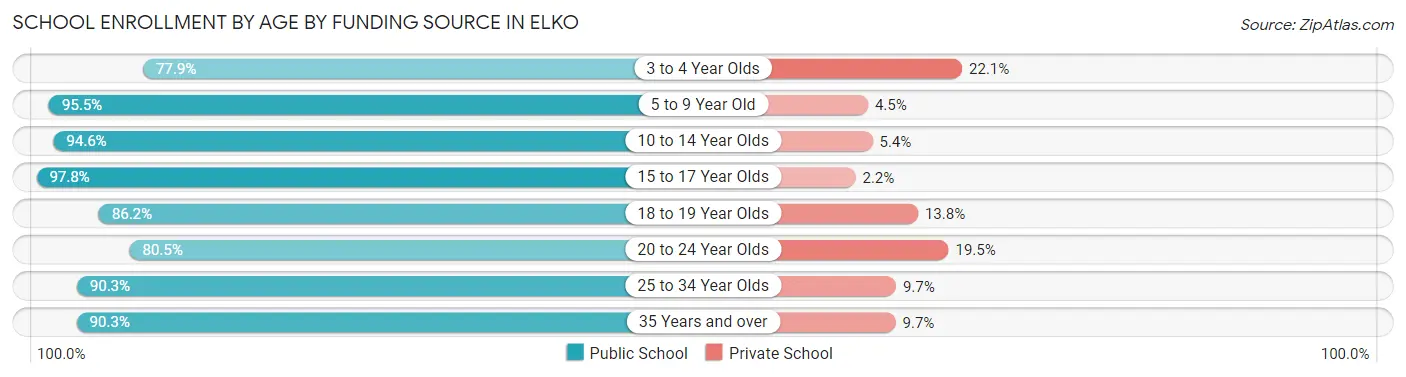
School Enrollment by Age by Funding Source in Elko
Out of a total of 4,992 students who are enrolled in schools in Elko, 404 (8.1%) attend a private institution, while the remaining 4,588 (91.9%) are enrolled in public schools. The age group of 3 to 4 year olds has the highest likelihood of being enrolled in private schools, with 30 (22.1% in the age bracket) enrolled. Conversely, the age group of 15 to 17 year olds has the lowest likelihood of being enrolled in a private school, with 486 (97.8% in the age bracket) attending a public institution.
| Age Bracket | Public School | Private School |
| 3 to 4 Year Olds | 106 (77.9%) | 30 (22.1%) |
| 5 to 9 Year Old | 1,139 (95.5%) | 54 (4.5%) |
| 10 to 14 Year Olds | 1,340 (94.6%) | 76 (5.4%) |
| 15 to 17 Year Olds | 486 (97.8%) | 11 (2.2%) |
| 18 to 19 Year Olds | 330 (86.2%) | 53 (13.8%) |
| 20 to 24 Year Olds | 387 (80.5%) | 94 (19.5%) |
| 25 to 34 Year Olds | 389 (90.3%) | 42 (9.7%) |
| 35 Years and over | 411 (90.3%) | 44 (9.7%) |
| Total | 4,588 (91.9%) | 404 (8.1%) |
Educational Attainment by Field of Study in Elko
Education (480 | 18.7%), business (375 | 14.6%), bio, nature & agricultural (272 | 10.6%), science & technology (268 | 10.4%), and physical & health sciences (244 | 9.5%) are the most common fields of study among 2,566 individuals in Elko who have obtained a bachelor's degree or higher.
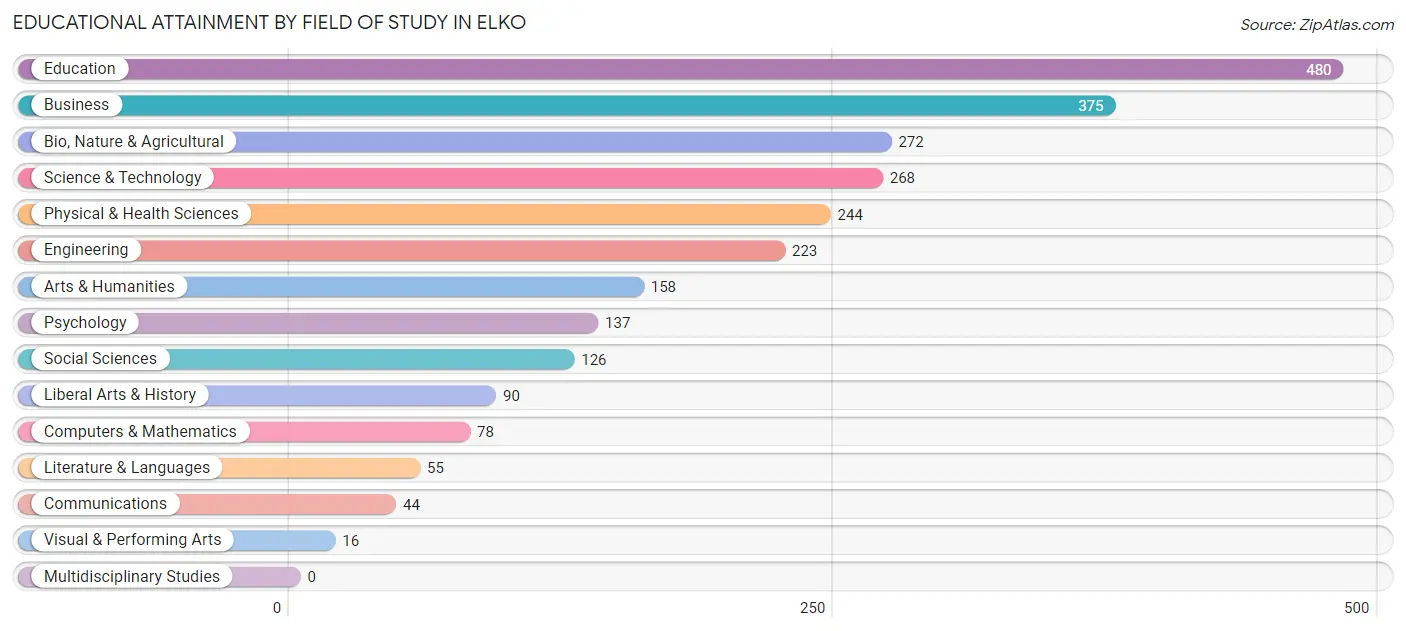
| Field of Study | # Graduates | % Graduates |
| Computers & Mathematics | 78 | 3.0% |
| Bio, Nature & Agricultural | 272 | 10.6% |
| Physical & Health Sciences | 244 | 9.5% |
| Psychology | 137 | 5.3% |
| Social Sciences | 126 | 4.9% |
| Engineering | 223 | 8.7% |
| Multidisciplinary Studies | 0 | 0.0% |
| Science & Technology | 268 | 10.4% |
| Business | 375 | 14.6% |
| Education | 480 | 18.7% |
| Literature & Languages | 55 | 2.1% |
| Liberal Arts & History | 90 | 3.5% |
| Visual & Performing Arts | 16 | 0.6% |
| Communications | 44 | 1.7% |
| Arts & Humanities | 158 | 6.2% |
| Total | 2,566 | 100.0% |
Transportation & Commute in Elko
Vehicle Availability by Sex in Elko
The most prevalent vehicle ownership categories in Elko are males with 2 vehicles (2,176, accounting for 35.5%) and females with 2 vehicles (1,535, making up 52.6%).
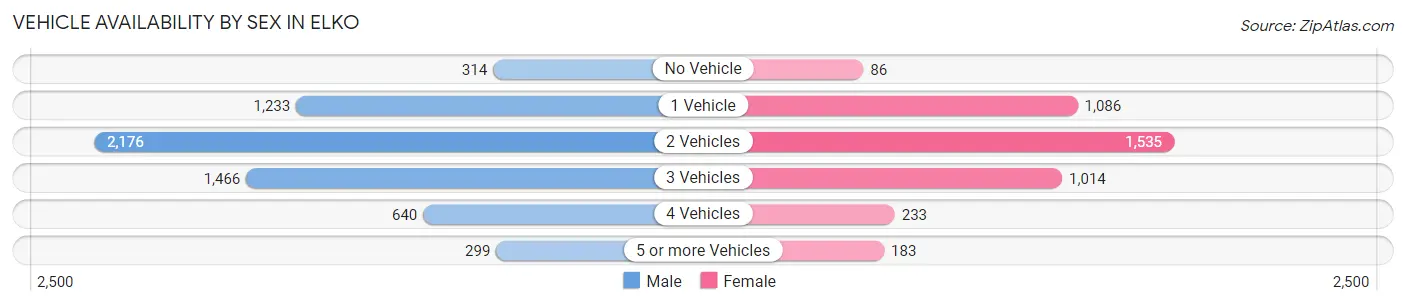
| Vehicles Available | Male | Female |
| No Vehicle | 314 (5.1%) | 86 (2.1%) |
| 1 Vehicle | 1,233 (20.1%) | 1,086 (26.3%) |
| 2 Vehicles | 2,176 (35.5%) | 1,535 (37.1%) |
| 3 Vehicles | 1,466 (23.9%) | 1,014 (24.5%) |
| 4 Vehicles | 640 (10.4%) | 233 (5.6%) |
| 5 or more Vehicles | 299 (4.9%) | 183 (4.4%) |
| Total | 6,128 (100.0%) | 4,137 (100.0%) |
Commute Time in Elko
The most frequently occuring commute durations in Elko are 5 to 9 minutes (2,832 commuters, 28.2%), 10 to 14 minutes (2,195 commuters, 21.8%), and 60 to 89 minutes (1,283 commuters, 12.8%).
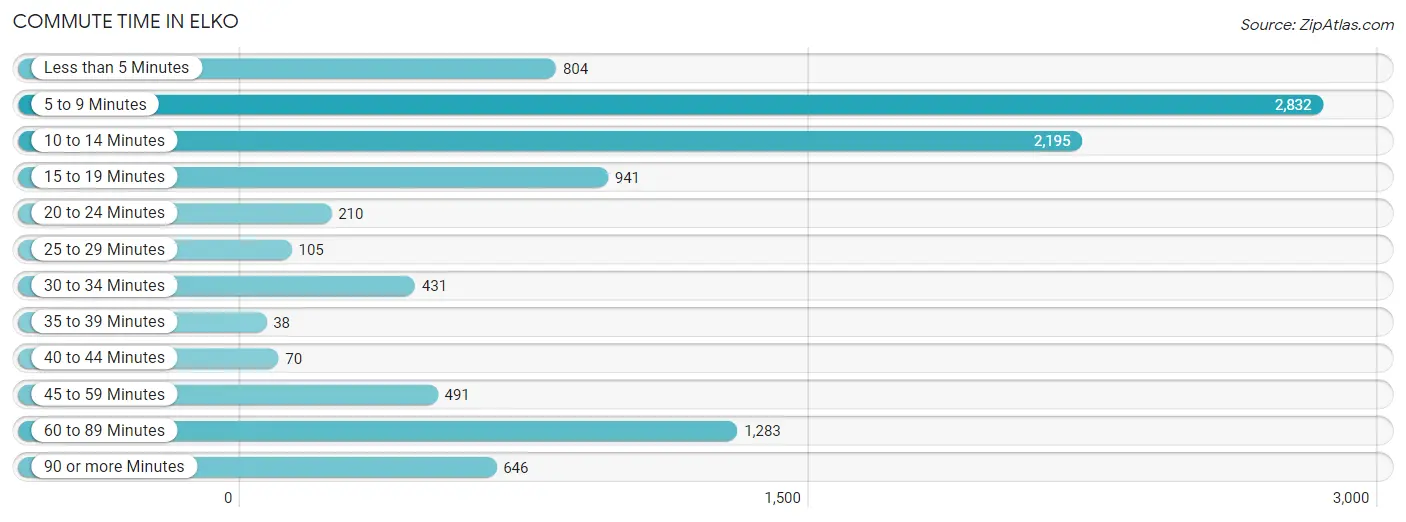
| Commute Time | # Commuters | % Commuters |
| Less than 5 Minutes | 804 | 8.0% |
| 5 to 9 Minutes | 2,832 | 28.2% |
| 10 to 14 Minutes | 2,195 | 21.8% |
| 15 to 19 Minutes | 941 | 9.4% |
| 20 to 24 Minutes | 210 | 2.1% |
| 25 to 29 Minutes | 105 | 1.1% |
| 30 to 34 Minutes | 431 | 4.3% |
| 35 to 39 Minutes | 38 | 0.4% |
| 40 to 44 Minutes | 70 | 0.7% |
| 45 to 59 Minutes | 491 | 4.9% |
| 60 to 89 Minutes | 1,283 | 12.8% |
| 90 or more Minutes | 646 | 6.4% |
Commute Time by Sex in Elko
The most common commute times in Elko are 5 to 9 minutes (1,405 commuters, 23.4%) for males and 5 to 9 minutes (1,427 commuters, 35.2%) for females.
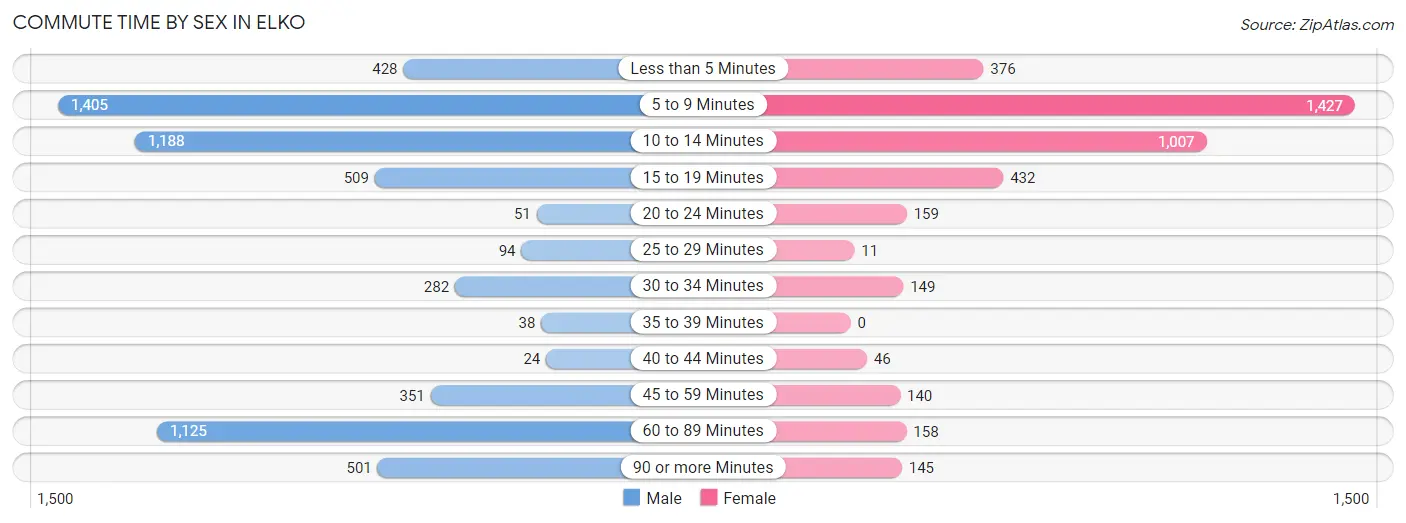
| Commute Time | Male | Female |
| Less than 5 Minutes | 428 (7.1%) | 376 (9.3%) |
| 5 to 9 Minutes | 1,405 (23.4%) | 1,427 (35.2%) |
| 10 to 14 Minutes | 1,188 (19.8%) | 1,007 (24.9%) |
| 15 to 19 Minutes | 509 (8.5%) | 432 (10.7%) |
| 20 to 24 Minutes | 51 (0.9%) | 159 (3.9%) |
| 25 to 29 Minutes | 94 (1.6%) | 11 (0.3%) |
| 30 to 34 Minutes | 282 (4.7%) | 149 (3.7%) |
| 35 to 39 Minutes | 38 (0.6%) | 0 (0.0%) |
| 40 to 44 Minutes | 24 (0.4%) | 46 (1.1%) |
| 45 to 59 Minutes | 351 (5.9%) | 140 (3.5%) |
| 60 to 89 Minutes | 1,125 (18.8%) | 158 (3.9%) |
| 90 or more Minutes | 501 (8.4%) | 145 (3.6%) |
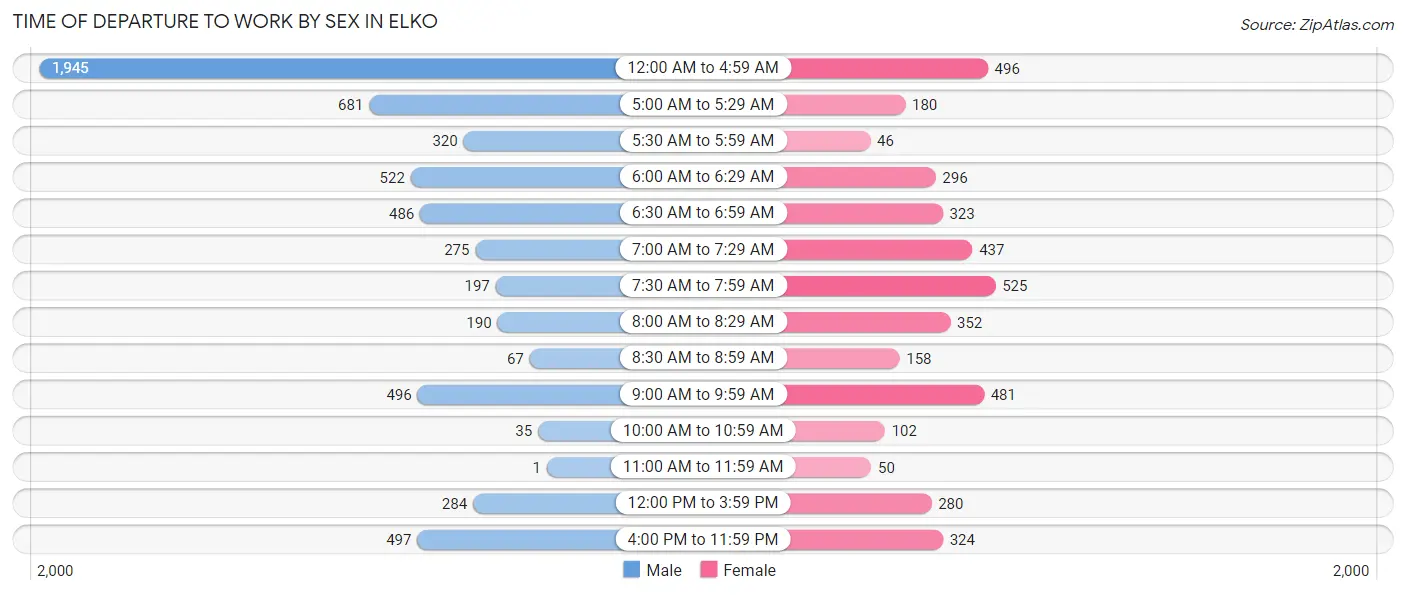
Time of Departure to Work by Sex in Elko
The most frequent times of departure to work in Elko are 12:00 AM to 4:59 AM (1,945, 32.4%) for males and 7:30 AM to 7:59 AM (525, 13.0%) for females.
| Time of Departure | Male | Female |
| 12:00 AM to 4:59 AM | 1,945 (32.4%) | 496 (12.2%) |
| 5:00 AM to 5:29 AM | 681 (11.4%) | 180 (4.4%) |
| 5:30 AM to 5:59 AM | 320 (5.3%) | 46 (1.1%) |
| 6:00 AM to 6:29 AM | 522 (8.7%) | 296 (7.3%) |
| 6:30 AM to 6:59 AM | 486 (8.1%) | 323 (8.0%) |
| 7:00 AM to 7:29 AM | 275 (4.6%) | 437 (10.8%) |
| 7:30 AM to 7:59 AM | 197 (3.3%) | 525 (13.0%) |
| 8:00 AM to 8:29 AM | 190 (3.2%) | 352 (8.7%) |
| 8:30 AM to 8:59 AM | 67 (1.1%) | 158 (3.9%) |
| 9:00 AM to 9:59 AM | 496 (8.3%) | 481 (11.9%) |
| 10:00 AM to 10:59 AM | 35 (0.6%) | 102 (2.5%) |
| 11:00 AM to 11:59 AM | 1 (0.0%) | 50 (1.2%) |
| 12:00 PM to 3:59 PM | 284 (4.7%) | 280 (6.9%) |
| 4:00 PM to 11:59 PM | 497 (8.3%) | 324 (8.0%) |
| Total | 5,996 (100.0%) | 4,050 (100.0%) |
Housing Occupancy in Elko
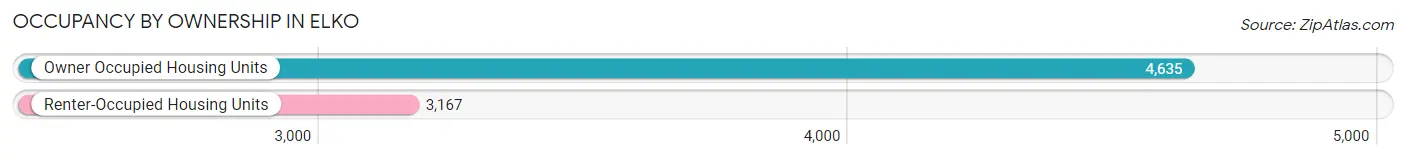
Occupancy by Ownership in Elko
Of the total 7,802 dwellings in Elko, owner-occupied units account for 4,635 (59.4%), while renter-occupied units make up 3,167 (40.6%).
| Occupancy | # Housing Units | % Housing Units |
| Owner Occupied Housing Units | 4,635 | 59.4% |
| Renter-Occupied Housing Units | 3,167 | 40.6% |
| Total Occupied Housing Units | 7,802 | 100.0% |
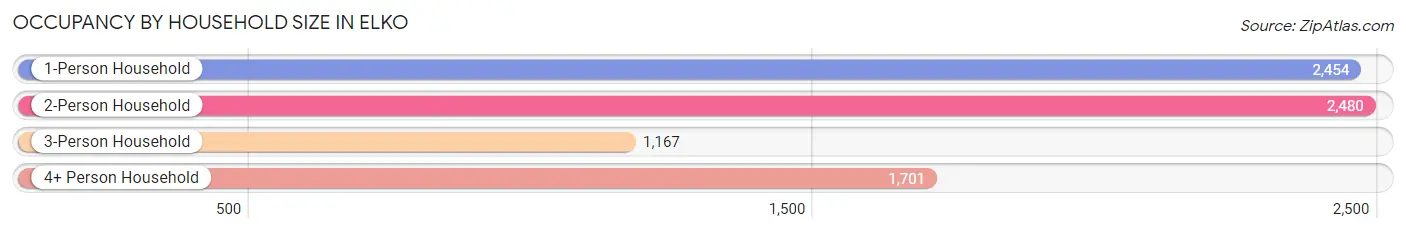
Occupancy by Household Size in Elko
| Household Size | # Housing Units | % Housing Units |
| 1-Person Household | 2,454 | 31.5% |
| 2-Person Household | 2,480 | 31.8% |
| 3-Person Household | 1,167 | 15.0% |
| 4+ Person Household | 1,701 | 21.8% |
| Total Housing Units | 7,802 | 100.0% |
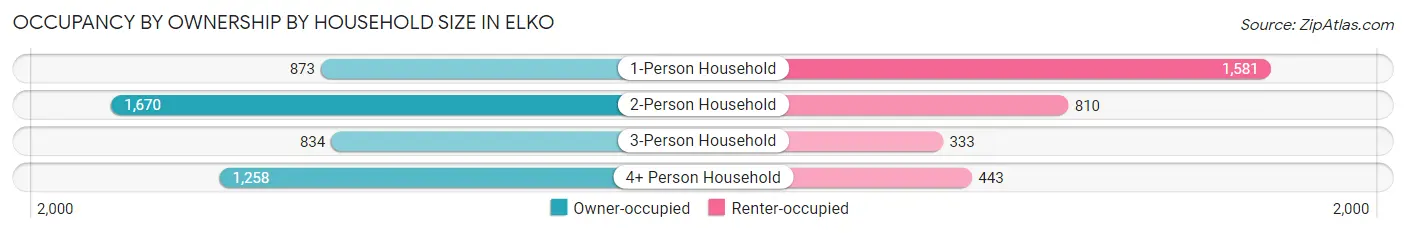
Occupancy by Ownership by Household Size in Elko
| Household Size | Owner-occupied | Renter-occupied |
| 1-Person Household | 873 (35.6%) | 1,581 (64.4%) |
| 2-Person Household | 1,670 (67.3%) | 810 (32.7%) |
| 3-Person Household | 834 (71.5%) | 333 (28.5%) |
| 4+ Person Household | 1,258 (74.0%) | 443 (26.0%) |
| Total Housing Units | 4,635 (59.4%) | 3,167 (40.6%) |
Occupancy by Educational Attainment in Elko
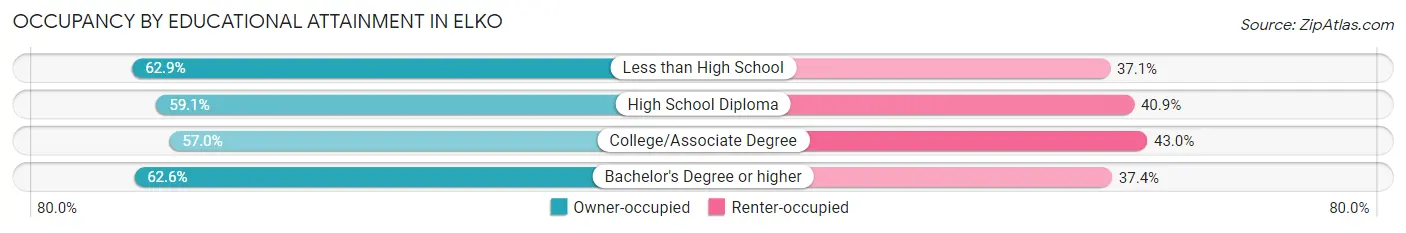
| Household Size | Owner-occupied | Renter-occupied |
| Less than High School | 526 (62.9%) | 310 (37.1%) |
| High School Diploma | 1,262 (59.1%) | 873 (40.9%) |
| College/Associate Degree | 1,814 (57.0%) | 1,367 (43.0%) |
| Bachelor's Degree or higher | 1,033 (62.6%) | 617 (37.4%) |
Occupancy by Age of Householder in Elko
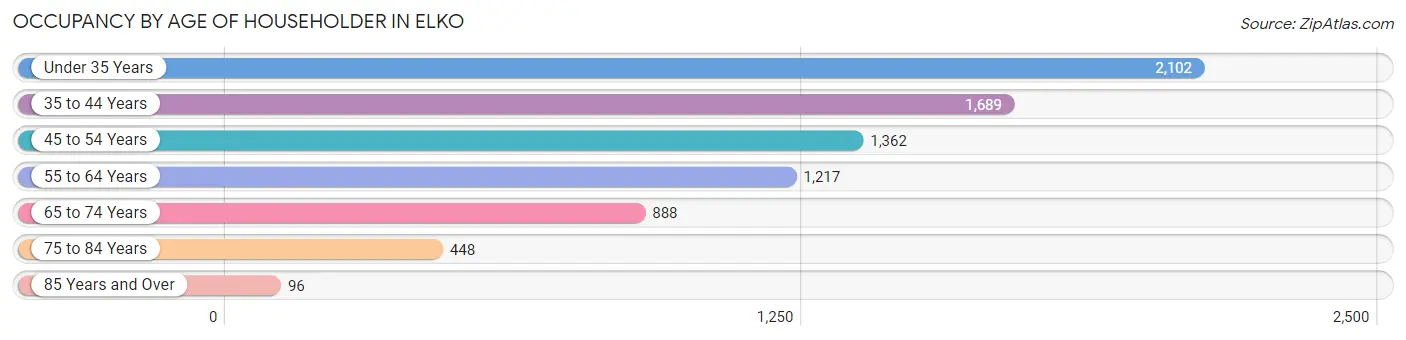
| Age Bracket | # Households | % Households |
| Under 35 Years | 2,102 | 26.9% |
| 35 to 44 Years | 1,689 | 21.6% |
| 45 to 54 Years | 1,362 | 17.5% |
| 55 to 64 Years | 1,217 | 15.6% |
| 65 to 74 Years | 888 | 11.4% |
| 75 to 84 Years | 448 | 5.7% |
| 85 Years and Over | 96 | 1.2% |
| Total | 7,802 | 100.0% |
Housing Finances in Elko
Median Income by Occupancy in Elko
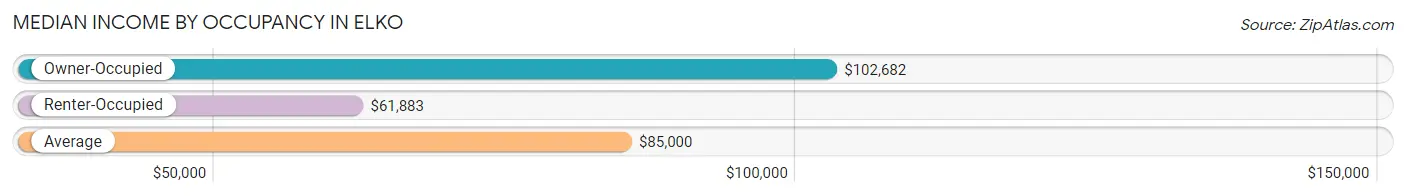
| Occupancy Type | # Households | Median Income |
| Owner-Occupied | 4,635 (59.4%) | $102,682 |
| Renter-Occupied | 3,167 (40.6%) | $61,883 |
| Average | 7,802 (100.0%) | $85,000 |
Occupancy by Householder Income Bracket in Elko
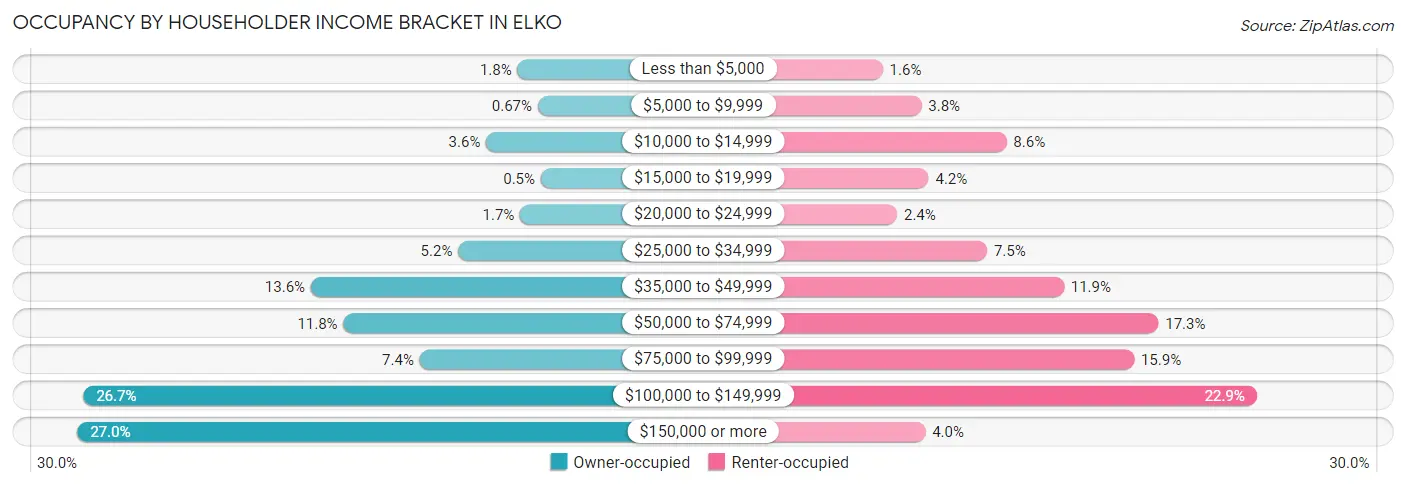
| Income Bracket | Owner-occupied | Renter-occupied |
| Less than $5,000 | 85 (1.8%) | 49 (1.5%) |
| $5,000 to $9,999 | 31 (0.7%) | 119 (3.8%) |
| $10,000 to $14,999 | 168 (3.6%) | 273 (8.6%) |
| $15,000 to $19,999 | 23 (0.5%) | 132 (4.2%) |
| $20,000 to $24,999 | 78 (1.7%) | 75 (2.4%) |
| $25,000 to $34,999 | 242 (5.2%) | 238 (7.5%) |
| $35,000 to $49,999 | 632 (13.6%) | 377 (11.9%) |
| $50,000 to $74,999 | 546 (11.8%) | 548 (17.3%) |
| $75,000 to $99,999 | 344 (7.4%) | 504 (15.9%) |
| $100,000 to $149,999 | 1,235 (26.7%) | 726 (22.9%) |
| $150,000 or more | 1,251 (27.0%) | 126 (4.0%) |
| Total | 4,635 (100.0%) | 3,167 (100.0%) |
Monthly Housing Cost Tiers in Elko
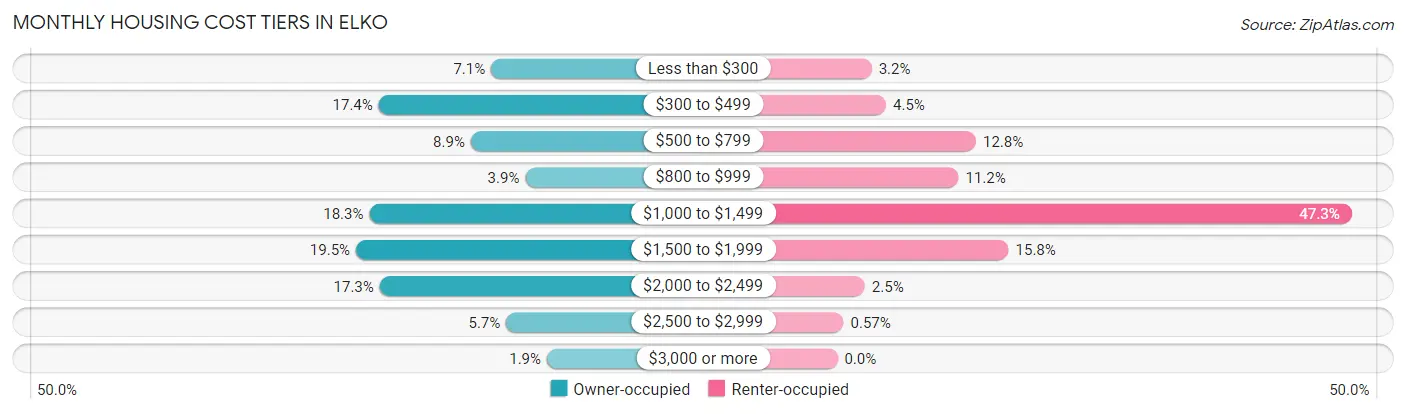
| Monthly Cost | Owner-occupied | Renter-occupied |
| Less than $300 | 327 (7.1%) | 100 (3.2%) |
| $300 to $499 | 807 (17.4%) | 142 (4.5%) |
| $500 to $799 | 414 (8.9%) | 404 (12.8%) |
| $800 to $999 | 181 (3.9%) | 353 (11.2%) |
| $1,000 to $1,499 | 847 (18.3%) | 1,499 (47.3%) |
| $1,500 to $1,999 | 904 (19.5%) | 499 (15.8%) |
| $2,000 to $2,499 | 803 (17.3%) | 80 (2.5%) |
| $2,500 to $2,999 | 263 (5.7%) | 18 (0.6%) |
| $3,000 or more | 89 (1.9%) | 0 (0.0%) |
| Total | 4,635 (100.0%) | 3,167 (100.0%) |
Physical Housing Characteristics in Elko
Housing Structures in Elko
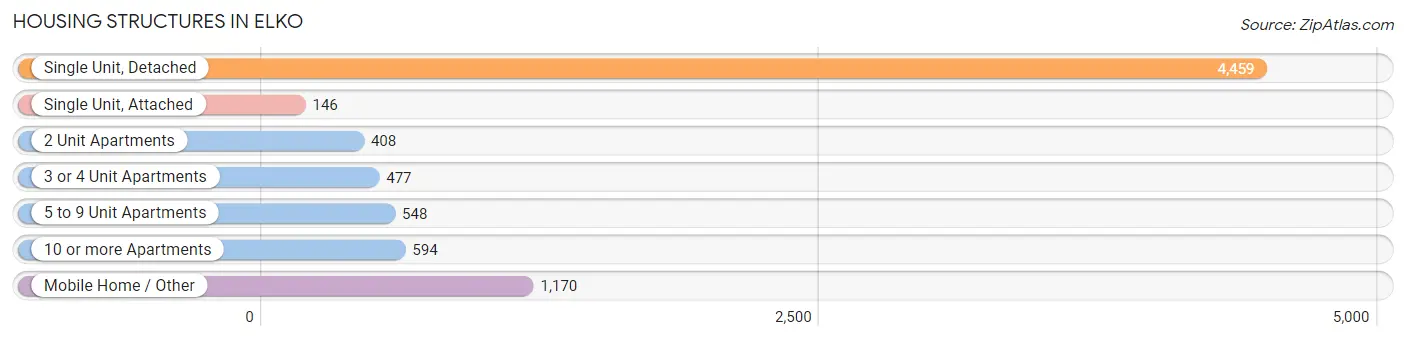
| Structure Type | # Housing Units | % Housing Units |
| Single Unit, Detached | 4,459 | 57.2% |
| Single Unit, Attached | 146 | 1.9% |
| 2 Unit Apartments | 408 | 5.2% |
| 3 or 4 Unit Apartments | 477 | 6.1% |
| 5 to 9 Unit Apartments | 548 | 7.0% |
| 10 or more Apartments | 594 | 7.6% |
| Mobile Home / Other | 1,170 | 15.0% |
| Total | 7,802 | 100.0% |
Housing Structures by Occupancy in Elko
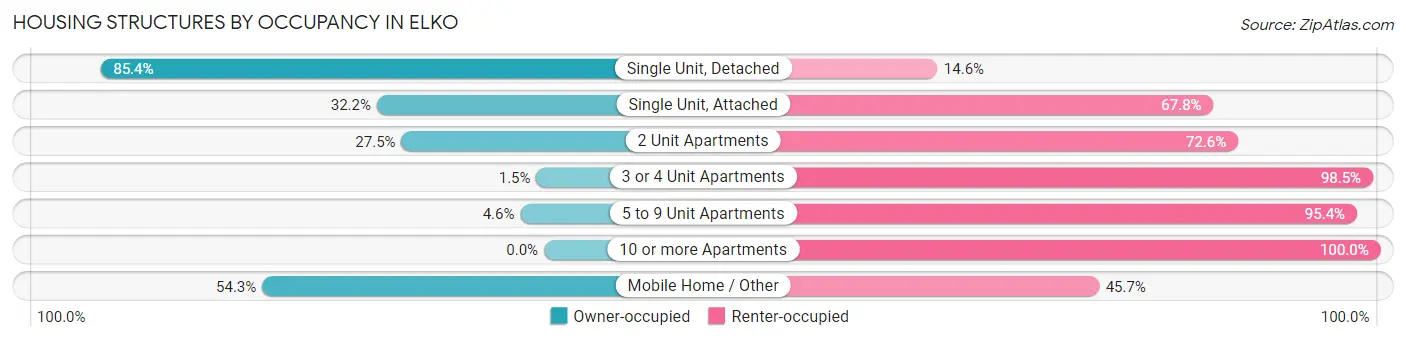
| Structure Type | Owner-occupied | Renter-occupied |
| Single Unit, Detached | 3,809 (85.4%) | 650 (14.6%) |
| Single Unit, Attached | 47 (32.2%) | 99 (67.8%) |
| 2 Unit Apartments | 112 (27.5%) | 296 (72.6%) |
| 3 or 4 Unit Apartments | 7 (1.5%) | 470 (98.5%) |
| 5 to 9 Unit Apartments | 25 (4.6%) | 523 (95.4%) |
| 10 or more Apartments | 0 (0.0%) | 594 (100.0%) |
| Mobile Home / Other | 635 (54.3%) | 535 (45.7%) |
| Total | 4,635 (59.4%) | 3,167 (40.6%) |
Housing Structures by Number of Rooms in Elko
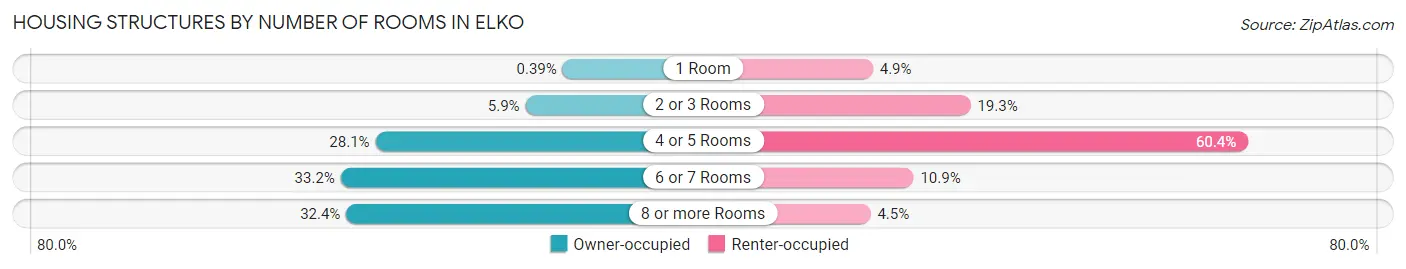
| Number of Rooms | Owner-occupied | Renter-occupied |
| 1 Room | 18 (0.4%) | 154 (4.9%) |
| 2 or 3 Rooms | 273 (5.9%) | 612 (19.3%) |
| 4 or 5 Rooms | 1,302 (28.1%) | 1,913 (60.4%) |
| 6 or 7 Rooms | 1,540 (33.2%) | 345 (10.9%) |
| 8 or more Rooms | 1,502 (32.4%) | 143 (4.5%) |
| Total | 4,635 (100.0%) | 3,167 (100.0%) |
Housing Structure by Heating Type in Elko
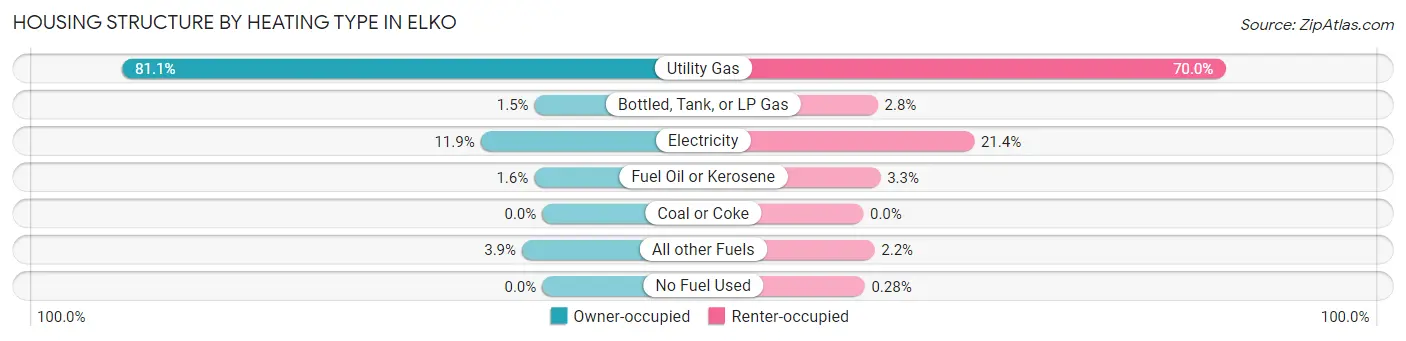
| Heating Type | Owner-occupied | Renter-occupied |
| Utility Gas | 3,761 (81.1%) | 2,216 (70.0%) |
| Bottled, Tank, or LP Gas | 69 (1.5%) | 89 (2.8%) |
| Electricity | 552 (11.9%) | 679 (21.4%) |
| Fuel Oil or Kerosene | 72 (1.5%) | 105 (3.3%) |
| Coal or Coke | 0 (0.0%) | 0 (0.0%) |
| All other Fuels | 181 (3.9%) | 69 (2.2%) |
| No Fuel Used | 0 (0.0%) | 9 (0.3%) |
| Total | 4,635 (100.0%) | 3,167 (100.0%) |
Household Vehicle Usage in Elko
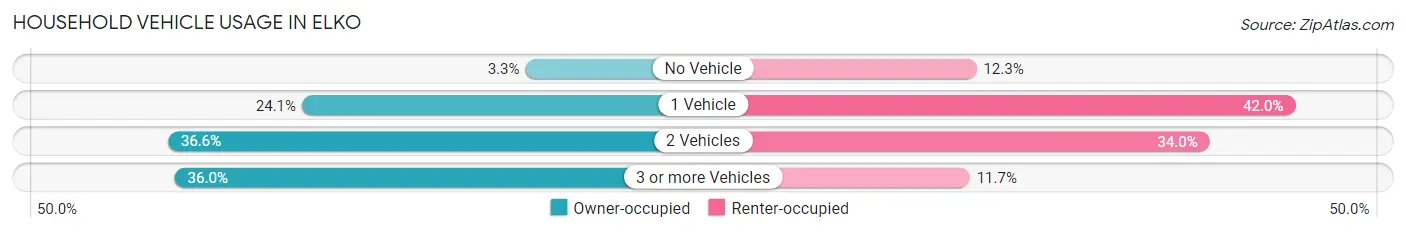
| Vehicles per Household | Owner-occupied | Renter-occupied |
| No Vehicle | 151 (3.3%) | 389 (12.3%) |
| 1 Vehicle | 1,118 (24.1%) | 1,331 (42.0%) |
| 2 Vehicles | 1,698 (36.6%) | 1,078 (34.0%) |
| 3 or more Vehicles | 1,668 (36.0%) | 369 (11.7%) |
| Total | 4,635 (100.0%) | 3,167 (100.0%) |
Real Estate & Mortgages in Elko
Real Estate and Mortgage Overview in Elko
| Characteristic | Without Mortgage | With Mortgage |
| Housing Units | 1,740 | 2,895 |
| Median Property Value | $209,000 | $300,400 |
| Median Household Income | $55,455 | $914 |
| Monthly Housing Costs | $457 | $89 |
| Real Estate Taxes | $1,050 | $187 |
Property Value by Mortgage Status in Elko
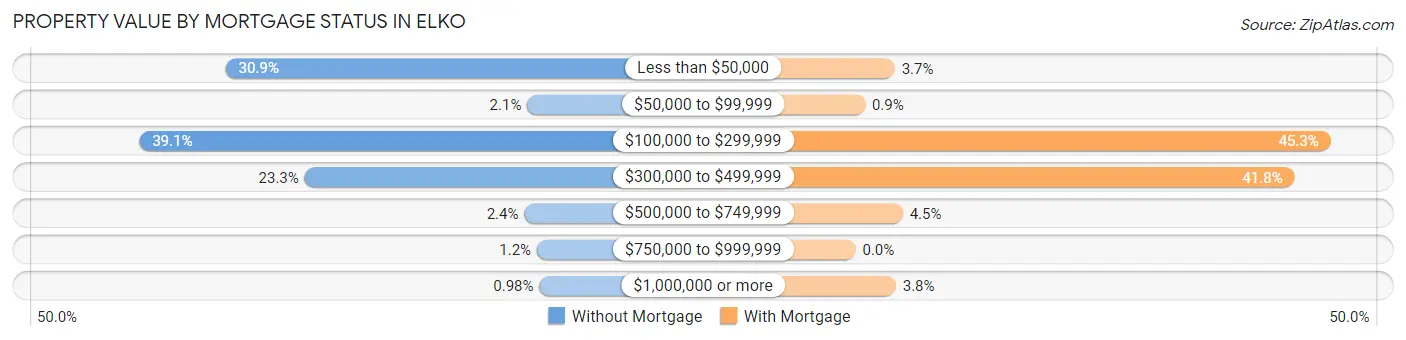
| Property Value | Without Mortgage | With Mortgage |
| Less than $50,000 | 537 (30.9%) | 108 (3.7%) |
| $50,000 to $99,999 | 37 (2.1%) | 26 (0.9%) |
| $100,000 to $299,999 | 680 (39.1%) | 1,310 (45.3%) |
| $300,000 to $499,999 | 406 (23.3%) | 1,210 (41.8%) |
| $500,000 to $749,999 | 42 (2.4%) | 130 (4.5%) |
| $750,000 to $999,999 | 21 (1.2%) | 0 (0.0%) |
| $1,000,000 or more | 17 (1.0%) | 111 (3.8%) |
| Total | 1,740 (100.0%) | 2,895 (100.0%) |
Household Income by Mortgage Status in Elko
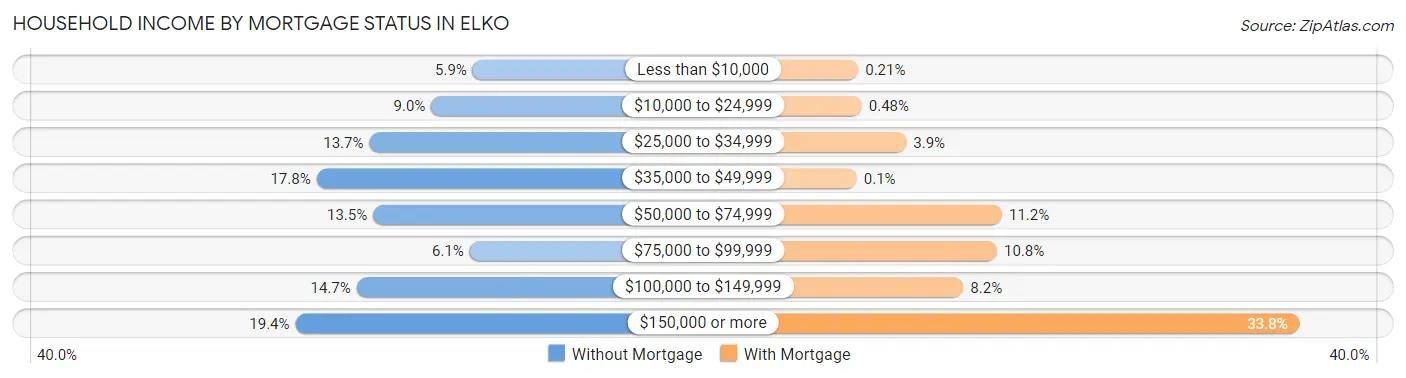
| Household Income | Without Mortgage | With Mortgage |
| Less than $10,000 | 102 (5.9%) | 6 (0.2%) |
| $10,000 to $24,999 | 157 (9.0%) | 14 (0.5%) |
| $25,000 to $34,999 | 239 (13.7%) | 112 (3.9%) |
| $35,000 to $49,999 | 309 (17.8%) | 3 (0.1%) |
| $50,000 to $74,999 | 234 (13.5%) | 323 (11.2%) |
| $75,000 to $99,999 | 106 (6.1%) | 312 (10.8%) |
| $100,000 to $149,999 | 256 (14.7%) | 238 (8.2%) |
| $150,000 or more | 337 (19.4%) | 979 (33.8%) |
| Total | 1,740 (100.0%) | 2,895 (100.0%) |
Property Value to Household Income Ratio in Elko
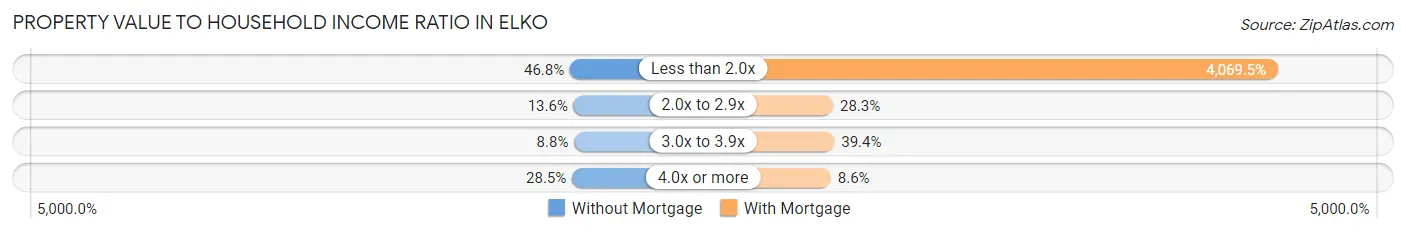
| Value-to-Income Ratio | Without Mortgage | With Mortgage |
| Less than 2.0x | 815 (46.8%) | 117,813 (4,069.5%) |
| 2.0x to 2.9x | 236 (13.6%) | 818 (28.3%) |
| 3.0x to 3.9x | 153 (8.8%) | 1,140 (39.4%) |
| 4.0x or more | 496 (28.5%) | 250 (8.6%) |
| Total | 1,740 (100.0%) | 2,895 (100.0%) |
Real Estate Taxes by Mortgage Status in Elko
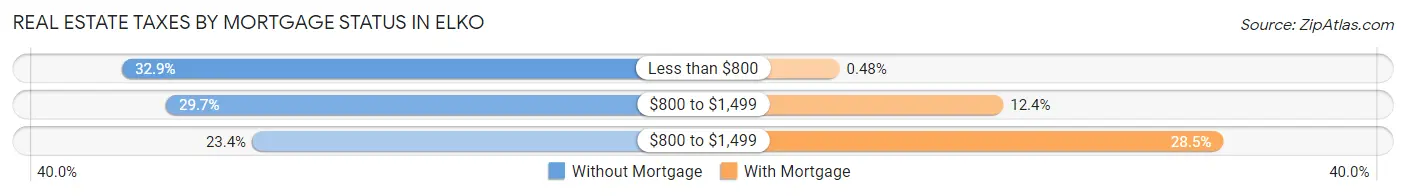
| Property Taxes | Without Mortgage | With Mortgage |
| Less than $800 | 572 (32.9%) | 14 (0.5%) |
| $800 to $1,499 | 516 (29.7%) | 360 (12.4%) |
| $800 to $1,499 | 407 (23.4%) | 825 (28.5%) |
| Total | 1,740 (100.0%) | 2,895 (100.0%) |
Health & Disability in Elko
Health Insurance Coverage by Age in Elko
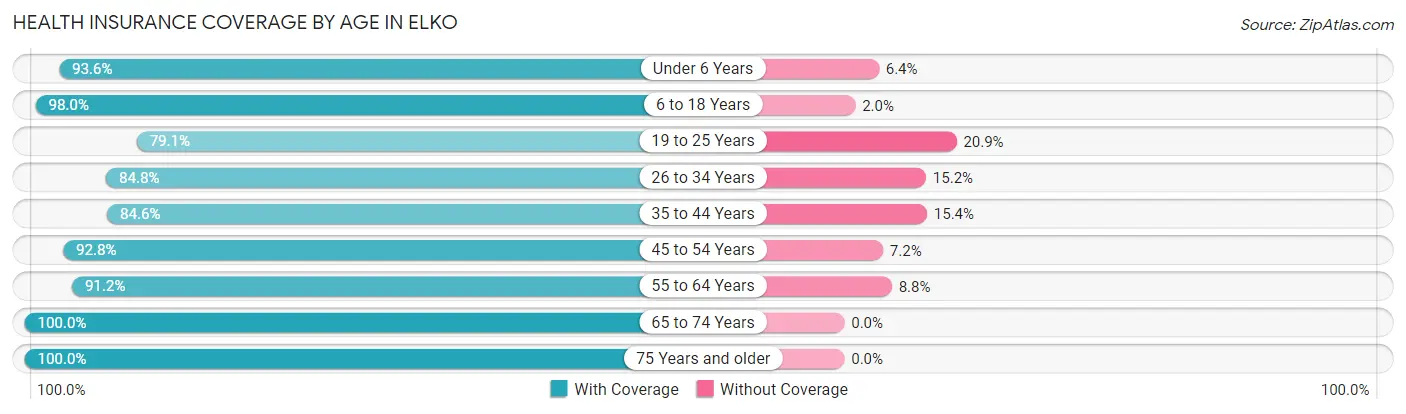
| Age Bracket | With Coverage | Without Coverage |
| Under 6 Years | 1,703 (93.6%) | 117 (6.4%) |
| 6 to 18 Years | 3,272 (98.0%) | 68 (2.0%) |
| 19 to 25 Years | 1,914 (79.1%) | 506 (20.9%) |
| 26 to 34 Years | 2,502 (84.8%) | 449 (15.2%) |
| 35 to 44 Years | 2,389 (84.6%) | 435 (15.4%) |
| 45 to 54 Years | 1,973 (92.8%) | 153 (7.2%) |
| 55 to 64 Years | 2,001 (91.2%) | 194 (8.8%) |
| 65 to 74 Years | 1,721 (100.0%) | 0 (0.0%) |
| 75 Years and older | 769 (100.0%) | 0 (0.0%) |
| Total | 18,244 (90.5%) | 1,922 (9.5%) |
Health Insurance Coverage by Citizenship Status in Elko

| Citizenship Status | With Coverage | Without Coverage |
| Native Born | 1,703 (93.6%) | 117 (6.4%) |
| Foreign Born, Citizen | 3,272 (98.0%) | 68 (2.0%) |
| Foreign Born, not a Citizen | 1,914 (79.1%) | 506 (20.9%) |
Health Insurance Coverage by Household Income in Elko
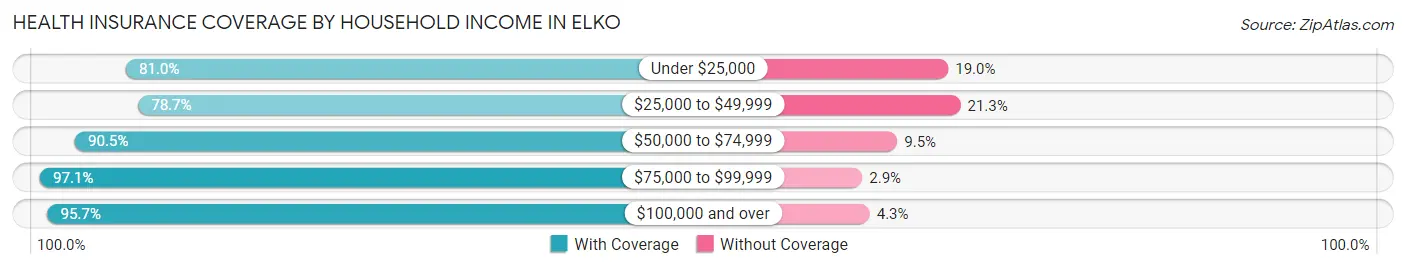
| Household Income | With Coverage | Without Coverage |
| Under $25,000 | 1,274 (81.0%) | 299 (19.0%) |
| $25,000 to $49,999 | 3,201 (78.7%) | 867 (21.3%) |
| $50,000 to $74,999 | 2,188 (90.5%) | 229 (9.5%) |
| $75,000 to $99,999 | 1,504 (97.1%) | 45 (2.9%) |
| $100,000 and over | 9,929 (95.7%) | 447 (4.3%) |
Public vs Private Health Insurance Coverage by Age in Elko
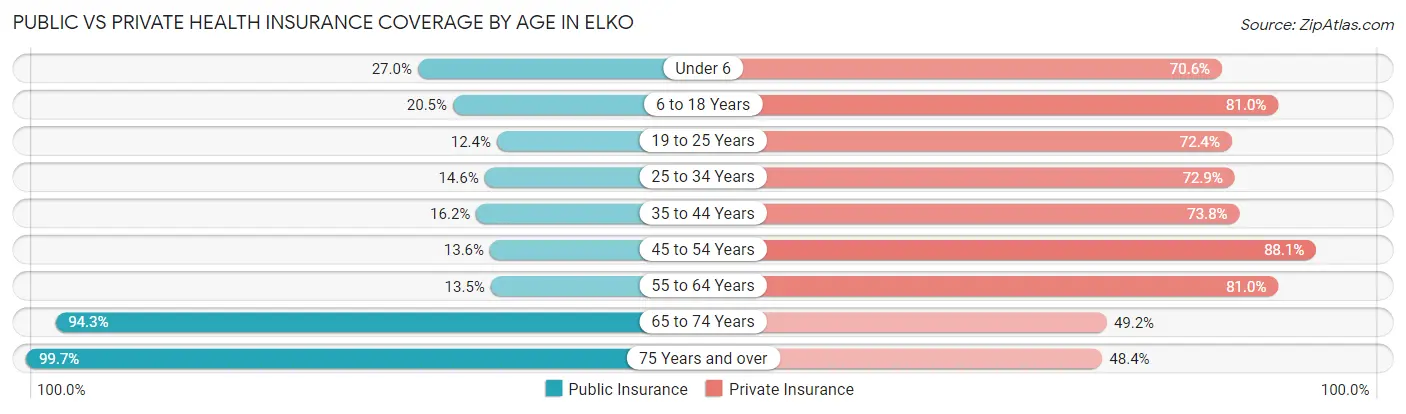
| Age Bracket | Public Insurance | Private Insurance |
| Under 6 | 492 (27.0%) | 1,284 (70.6%) |
| 6 to 18 Years | 685 (20.5%) | 2,705 (81.0%) |
| 19 to 25 Years | 299 (12.4%) | 1,752 (72.4%) |
| 25 to 34 Years | 432 (14.6%) | 2,152 (72.9%) |
| 35 to 44 Years | 457 (16.2%) | 2,084 (73.8%) |
| 45 to 54 Years | 290 (13.6%) | 1,872 (88.0%) |
| 55 to 64 Years | 296 (13.5%) | 1,778 (81.0%) |
| 65 to 74 Years | 1,623 (94.3%) | 847 (49.2%) |
| 75 Years and over | 767 (99.7%) | 372 (48.4%) |
| Total | 5,341 (26.5%) | 14,846 (73.6%) |
Disability Status by Sex by Age in Elko
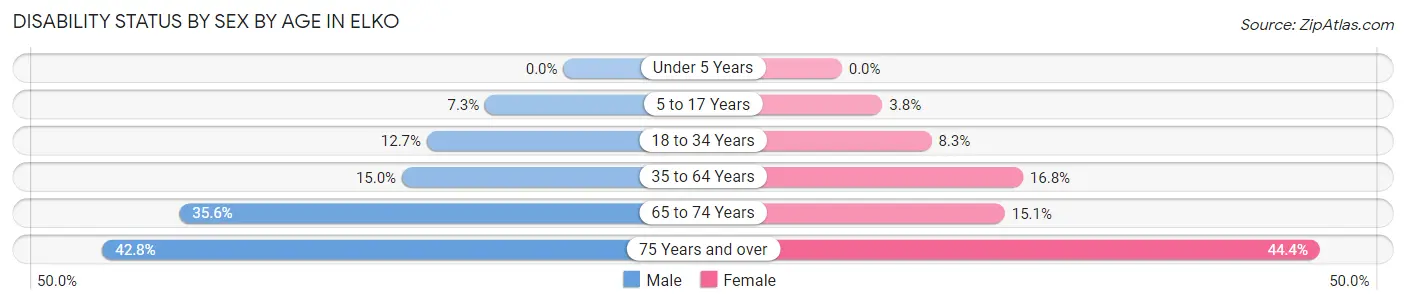
| Age Bracket | Male | Female |
| Under 5 Years | 0 (0.0%) | 0 (0.0%) |
| 5 to 17 Years | 147 (7.3%) | 50 (3.8%) |
| 18 to 34 Years | 394 (12.7%) | 215 (8.3%) |
| 35 to 64 Years | 581 (15.0%) | 549 (16.8%) |
| 65 to 74 Years | 300 (35.6%) | 133 (15.1%) |
| 75 Years and over | 166 (42.8%) | 169 (44.4%) |
Disability Class by Sex by Age in Elko
Disability Class: Hearing Difficulty
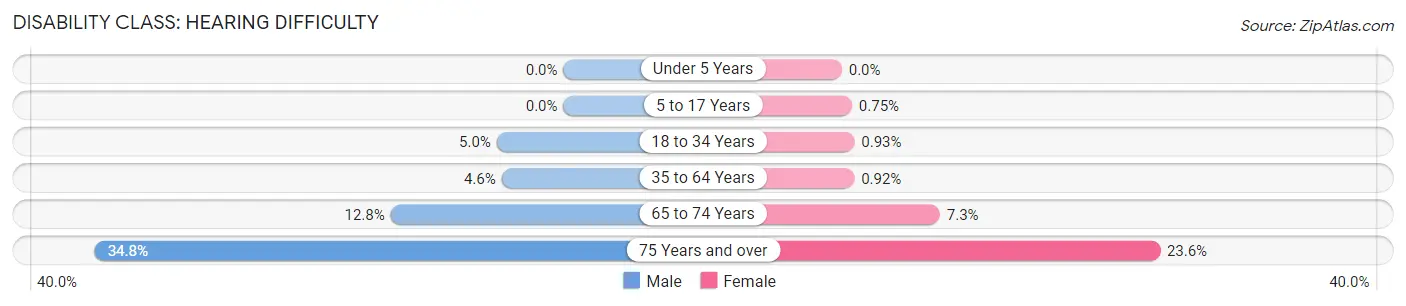
| Age Bracket | Male | Female |
| Under 5 Years | 0 (0.0%) | 0 (0.0%) |
| 5 to 17 Years | 0 (0.0%) | 10 (0.7%) |
| 18 to 34 Years | 154 (5.0%) | 24 (0.9%) |
| 35 to 64 Years | 178 (4.6%) | 30 (0.9%) |
| 65 to 74 Years | 108 (12.8%) | 64 (7.3%) |
| 75 Years and over | 135 (34.8%) | 90 (23.6%) |
Disability Class: Vision Difficulty
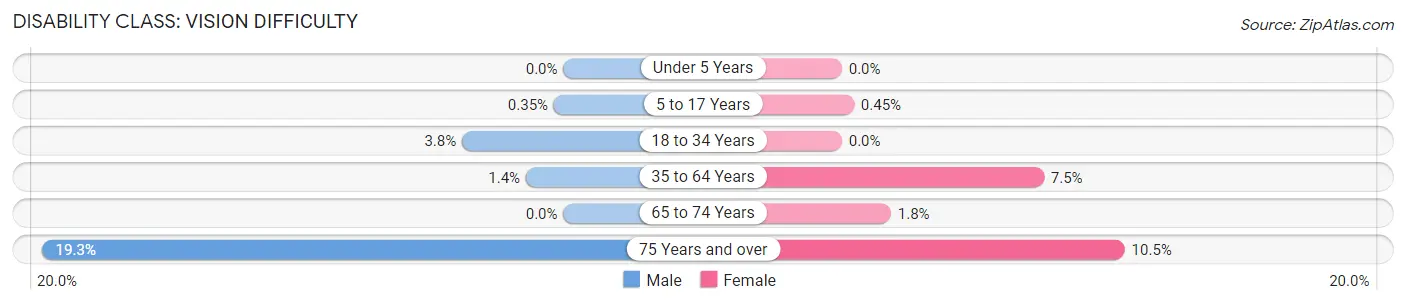
| Age Bracket | Male | Female |
| Under 5 Years | 0 (0.0%) | 0 (0.0%) |
| 5 to 17 Years | 7 (0.4%) | 6 (0.4%) |
| 18 to 34 Years | 117 (3.8%) | 0 (0.0%) |
| 35 to 64 Years | 54 (1.4%) | 245 (7.5%) |
| 65 to 74 Years | 0 (0.0%) | 16 (1.8%) |
| 75 Years and over | 75 (19.3%) | 40 (10.5%) |
Disability Class: Cognitive Difficulty
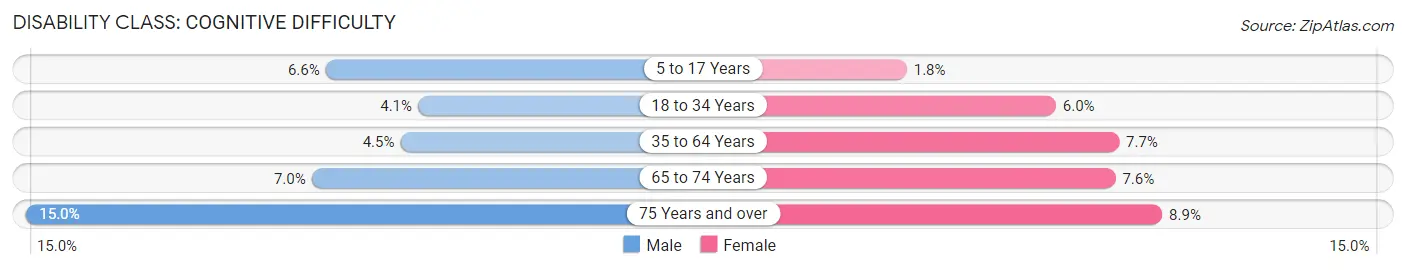
| Age Bracket | Male | Female |
| 5 to 17 Years | 134 (6.6%) | 24 (1.8%) |
| 18 to 34 Years | 126 (4.1%) | 154 (6.0%) |
| 35 to 64 Years | 176 (4.5%) | 252 (7.7%) |
| 65 to 74 Years | 59 (7.0%) | 67 (7.6%) |
| 75 Years and over | 58 (14.9%) | 34 (8.9%) |
Disability Class: Ambulatory Difficulty
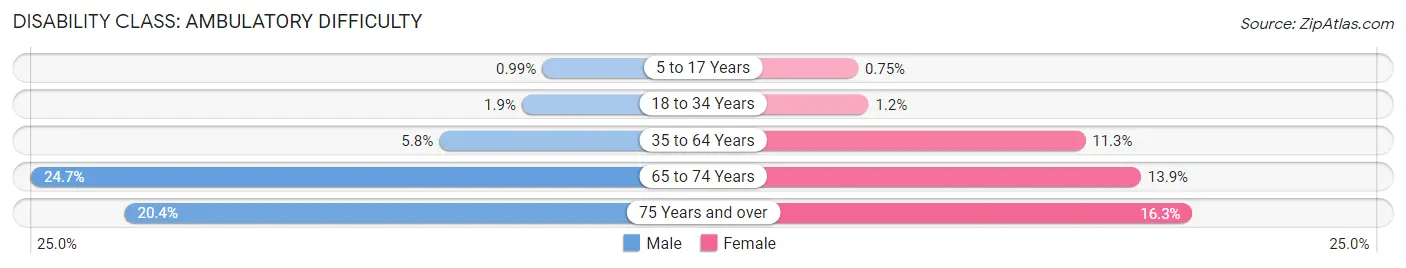
| Age Bracket | Male | Female |
| 5 to 17 Years | 20 (1.0%) | 10 (0.7%) |
| 18 to 34 Years | 60 (1.9%) | 32 (1.2%) |
| 35 to 64 Years | 224 (5.8%) | 369 (11.3%) |
| 65 to 74 Years | 208 (24.7%) | 122 (13.9%) |
| 75 Years and over | 79 (20.4%) | 62 (16.3%) |
Disability Class: Self-Care Difficulty
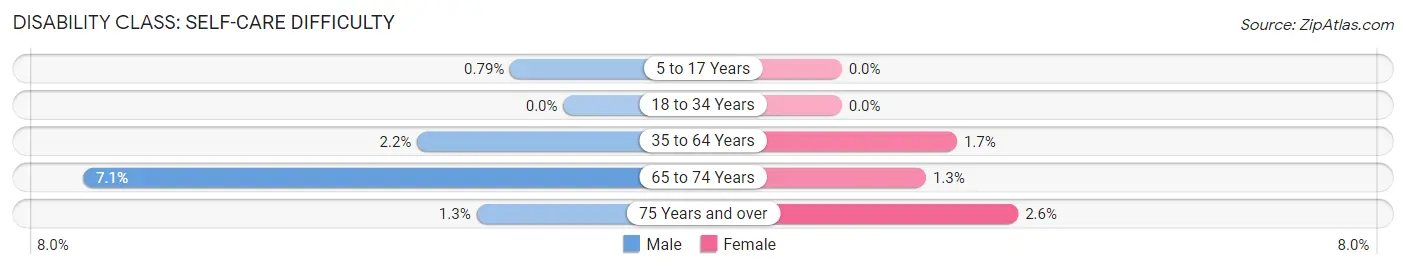
| Age Bracket | Male | Female |
| 5 to 17 Years | 16 (0.8%) | 0 (0.0%) |
| 18 to 34 Years | 0 (0.0%) | 0 (0.0%) |
| 35 to 64 Years | 84 (2.2%) | 56 (1.7%) |
| 65 to 74 Years | 60 (7.1%) | 11 (1.3%) |
| 75 Years and over | 5 (1.3%) | 10 (2.6%) |
Technology Access in Elko
Computing Device Access in Elko
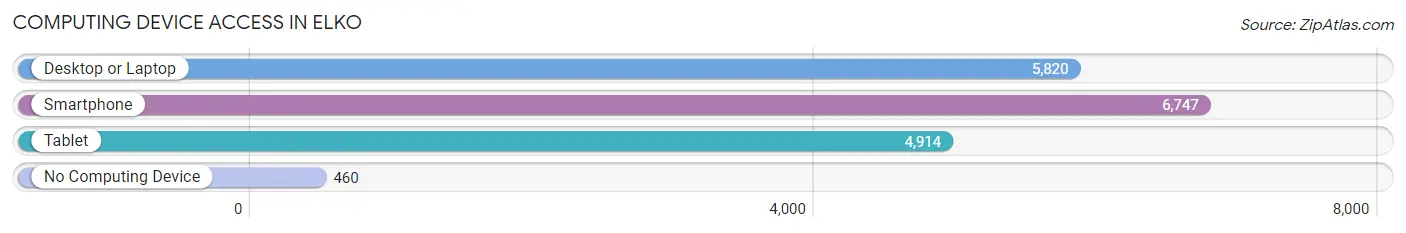
| Device Type | # Households | % Households |
| Desktop or Laptop | 5,820 | 74.6% |
| Smartphone | 6,747 | 86.5% |
| Tablet | 4,914 | 63.0% |
| No Computing Device | 460 | 5.9% |
| Total | 7,802 | 100.0% |
Internet Access in Elko
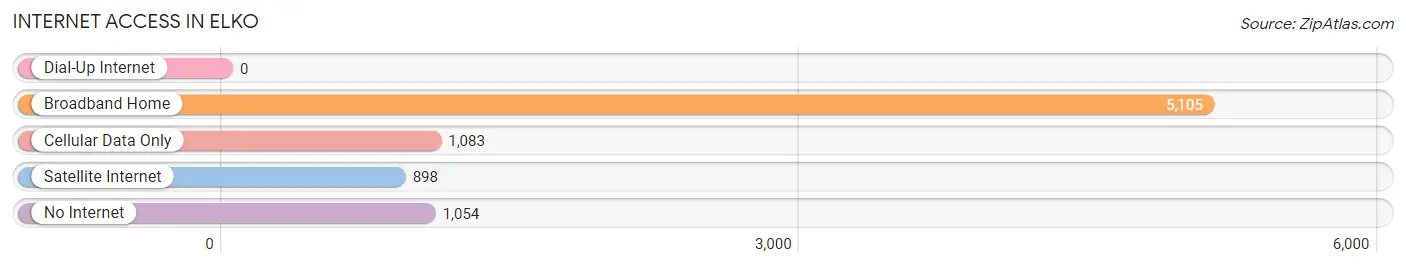
| Internet Type | # Households | % Households |
| Dial-Up Internet | 0 | 0.0% |
| Broadband Home | 5,105 | 65.4% |
| Cellular Data Only | 1,083 | 13.9% |
| Satellite Internet | 898 | 11.5% |
| No Internet | 1,054 | 13.5% |
| Total | 7,802 | 100.0% |
Elko Summary
Elko, Nevada is a city located in the northeastern corner of the state, near the Idaho border. It is the county seat of Elko County and the largest city in the county. The city is situated in the high desert of the Great Basin, at an elevation of 5,060 feet (1,539 m). As of the 2010 census, the population of Elko was 18,297.
History
The area around Elko was first inhabited by the Western Shoshone people. The first European settlers arrived in the area in the late 1840s, and the city was officially founded in 1868. The city was named after the Elko Indian tribe, which had a settlement in the area.
In the late 19th century, Elko became a major stop on the Central Pacific Railroad, which connected the city to the rest of the country. The railroad brought in a large number of miners and ranchers, and the city quickly grew. By the early 20th century, Elko had become a major hub for the mining and ranching industries.
Geography
Elko is located in the northeastern corner of Nevada, near the Idaho border. It is situated in the high desert of the Great Basin, at an elevation of 5,060 feet (1,539 m). The city is surrounded by mountains, including the Ruby Mountains to the east and the Jarbidge Mountains to the west. The Humboldt River runs through the city, and the nearby Ruby Lake National Wildlife Refuge is a popular destination for birdwatchers.
Economy
Elko is the economic center of Elko County, and the city’s economy is largely based on mining and ranching. The city is home to several large gold mines, and the nearby Ruby Mountains are rich in minerals. The city is also home to several large ranches, and the nearby Ruby Lake National Wildlife Refuge is a popular destination for birdwatchers.
The city is also home to several large manufacturing companies, including a large food processing plant and a large trucking company. The city is also home to several large retail stores, including Walmart and Home Depot.
Demographics
As of the 2010 census, the population of Elko was 18,297. The racial makeup of the city was 79.2% White, 0.7% African American, 1.2% Native American, 0.7% Asian, 0.1% Pacific Islander, 15.2% from other races, and 3.0% from two or more races. Hispanic or Latino of any race were 28.2% of the population.
The median income for a household in Elko was $41,945, and the median income for a family was $50,945. The per capita income for the city was $20,945. About 14.2% of families and 17.7% of the population were below the poverty line, including 22.3% of those under age 18 and 8.2% of those age 65 or over.
Elko is served by the Elko County School District, which includes four elementary schools, two middle schools, and one high school. The city is also home to Great Basin College, a two-year college that offers associate degrees and certificates.
Common Questions
What is Per Capita Income in Elko?
Per Capita income in Elko is $39,299.
What is the Median Family Income in Elko?
Median Family Income in Elko is $98,720.
What is the Median Household income in Elko?
Median Household Income in Elko is $85,000.
What is Income or Wage Gap in Elko?
Income or Wage Gap in Elko is 42.9%.
Women in Elko earn 57.1 cents for every dollar earned by a man.
What is Family Income Deficit in Elko?
Family Income Deficit in Elko is $9,408.
Families that are below poverty line in Elko earn $9,408 less on average than the poverty threshold level.
What is Inequality or Gini Index in Elko?
Inequality or Gini Index in Elko is 0.41.
What is the Total Population of Elko?
Total Population of Elko is 20,513.
What is the Total Male Population of Elko?
Total Male Population of Elko is 11,119.
What is the Total Female Population of Elko?
Total Female Population of Elko is 9,394.
What is the Ratio of Males per 100 Females in Elko?
There are 118.36 Males per 100 Females in Elko.
What is the Ratio of Females per 100 Males in Elko?
There are 84.49 Females per 100 Males in Elko.
What is the Median Population Age in Elko?
Median Population Age in Elko is 33.5 Years.
What is the Average Family Size in Elko
Average Family Size in Elko is 3.3 People.
What is the Average Household Size in Elko
Average Household Size in Elko is 2.6 People.
How Large is the Labor Force in Elko?
There are 10,978 People in the Labor Forcein in Elko.
What is the Percentage of People in the Labor Force in Elko?
68.4% of People are in the Labor Force in Elko.
What is the Unemployment Rate in Elko?
Unemployment Rate in Elko is 4.5%.