Pahrump, NV Map & Demographics
Pahrump Map
Pahrump Overview
$30,801
PER CAPITA INCOME
$65,032
AVG FAMILY INCOME
$54,988
AVG HOUSEHOLD INCOME
25.5%
WAGE / INCOME GAP [ % ]
74.5¢/ $1
WAGE / INCOME GAP [ $ ]
0.44
INEQUALITY / GINI INDEX
44,711
TOTAL POPULATION
22,623
MALE POPULATION
22,088
FEMALE POPULATION
102.42
MALES / 100 FEMALES
97.64
FEMALES / 100 MALES
53.7
MEDIAN AGE
2.8
AVG FAMILY SIZE
2.4
AVG HOUSEHOLD SIZE
15,354
LABOR FORCE [ PEOPLE ]
40.2%
PERCENT IN LABOR FORCE
10.2%
UNEMPLOYMENT RATE
Income in Pahrump
Income Overview in Pahrump
Per Capita Income in Pahrump is $30,801, while median incomes of families and households are $65,032 and $54,988 respectively.
| Characteristic | Number | Measure |
| Per Capita Income | 44,711 | $30,801 |
| Median Family Income | 11,851 | $65,032 |
| Mean Family Income | 11,851 | $83,161 |
| Median Household Income | 18,598 | $54,988 |
| Mean Household Income | 18,598 | $72,936 |
| Income Deficit | 11,851 | $0 |
| Wage / Income Gap (%) | 44,711 | 25.52% |
| Wage / Income Gap ($) | 44,711 | 74.48¢ per $1 |
| Gini / Inequality Index | 44,711 | 0.44 |
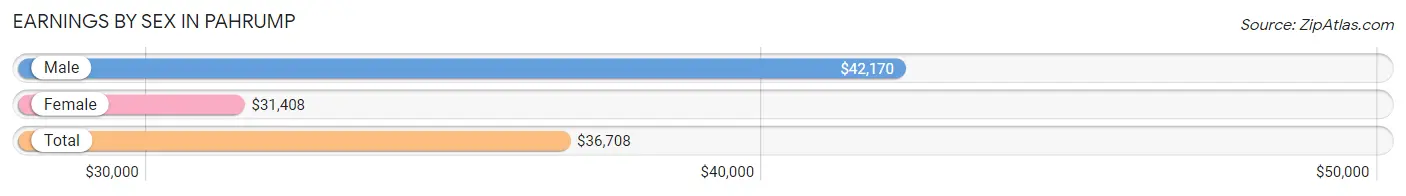
Earnings by Sex in Pahrump
Average Earnings in Pahrump are $36,708, $42,170 for men and $31,408 for women, a difference of 25.5%.
| Sex | Number | Average Earnings |
| Male | 9,187 (58.5%) | $42,170 |
| Female | 6,508 (41.5%) | $31,408 |
| Total | 15,695 (100.0%) | $36,708 |
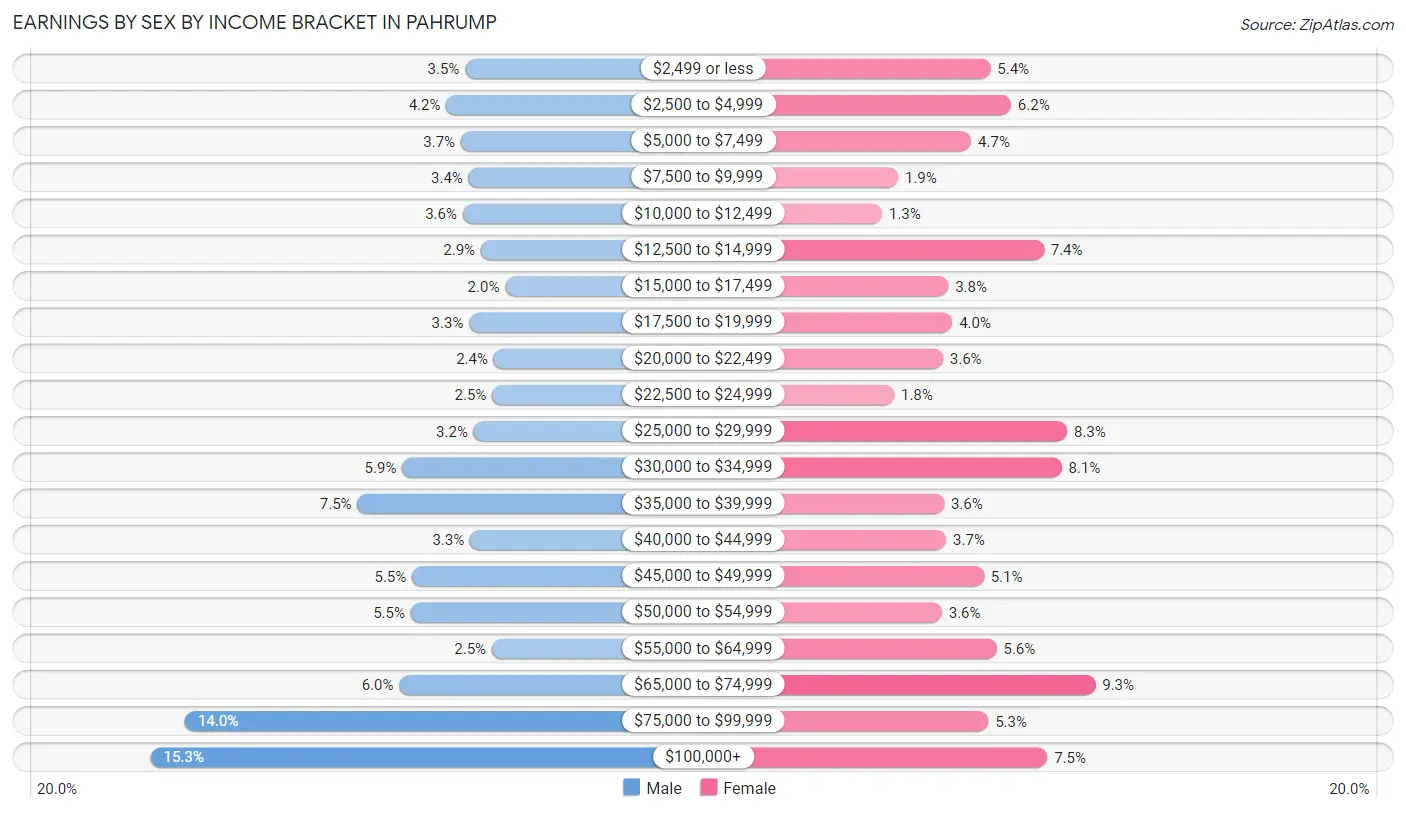
Earnings by Sex by Income Bracket in Pahrump
The most common earnings brackets in Pahrump are $100,000+ for men (1,404 | 15.3%) and $65,000 to $74,999 for women (606 | 9.3%).
| Income | Male | Female |
| $2,499 or less | 321 (3.5%) | 350 (5.4%) |
| $2,500 to $4,999 | 386 (4.2%) | 400 (6.1%) |
| $5,000 to $7,499 | 335 (3.6%) | 303 (4.7%) |
| $7,500 to $9,999 | 309 (3.4%) | 125 (1.9%) |
| $10,000 to $12,499 | 329 (3.6%) | 86 (1.3%) |
| $12,500 to $14,999 | 266 (2.9%) | 480 (7.4%) |
| $15,000 to $17,499 | 183 (2.0%) | 247 (3.8%) |
| $17,500 to $19,999 | 307 (3.3%) | 257 (4.0%) |
| $20,000 to $22,499 | 222 (2.4%) | 234 (3.6%) |
| $22,500 to $24,999 | 228 (2.5%) | 115 (1.8%) |
| $25,000 to $29,999 | 291 (3.2%) | 537 (8.3%) |
| $30,000 to $34,999 | 537 (5.9%) | 524 (8.1%) |
| $35,000 to $39,999 | 692 (7.5%) | 237 (3.6%) |
| $40,000 to $44,999 | 304 (3.3%) | 242 (3.7%) |
| $45,000 to $49,999 | 503 (5.5%) | 334 (5.1%) |
| $50,000 to $54,999 | 508 (5.5%) | 232 (3.6%) |
| $55,000 to $64,999 | 229 (2.5%) | 365 (5.6%) |
| $65,000 to $74,999 | 548 (6.0%) | 606 (9.3%) |
| $75,000 to $99,999 | 1,285 (14.0%) | 345 (5.3%) |
| $100,000+ | 1,404 (15.3%) | 489 (7.5%) |
| Total | 9,187 (100.0%) | 6,508 (100.0%) |
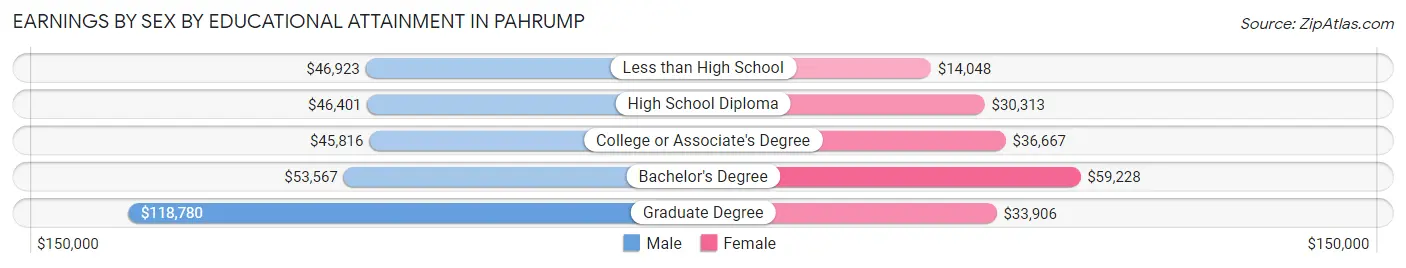
Earnings by Sex by Educational Attainment in Pahrump
Average earnings in Pahrump are $47,062 for men and $33,514 for women, a difference of 28.8%. Men with an educational attainment of graduate degree enjoy the highest average annual earnings of $118,780, while those with college or associate's degree education earn the least with $45,816. Women with an educational attainment of bachelor's degree earn the most with the average annual earnings of $59,228, while those with less than high school education have the smallest earnings of $14,048.
| Educational Attainment | Male Income | Female Income |
| Less than High School | $46,923 | $14,048 |
| High School Diploma | $46,401 | $30,313 |
| College or Associate's Degree | $45,816 | $36,667 |
| Bachelor's Degree | $53,567 | $59,228 |
| Graduate Degree | $118,780 | $33,906 |
| Total | $47,062 | $33,514 |
Family Income in Pahrump
Family Income Brackets in Pahrump
According to the Pahrump family income data, there are 2,394 families falling into the $50,000 to $74,999 income range, which is the most common income bracket and makes up 20.2% of all families. Conversely, the less than $10,000 income bracket is the least frequent group with only 367 families (3.1%) belonging to this category.
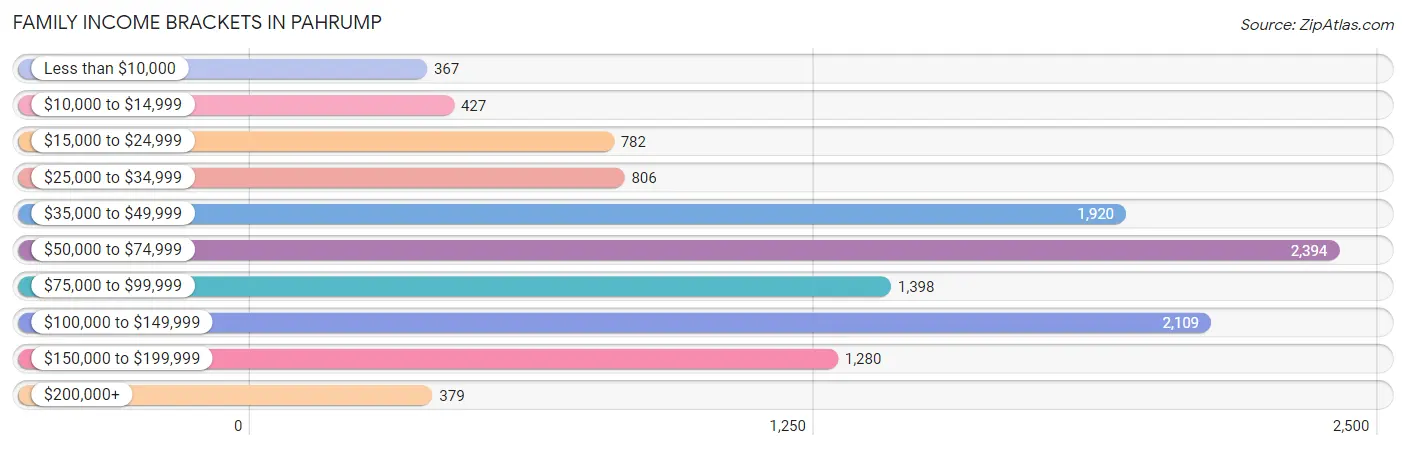
| Income Bracket | # Families | % Families |
| Less than $10,000 | 367 | 3.1% |
| $10,000 to $14,999 | 427 | 3.6% |
| $15,000 to $24,999 | 782 | 6.6% |
| $25,000 to $34,999 | 806 | 6.8% |
| $35,000 to $49,999 | 1,920 | 16.2% |
| $50,000 to $74,999 | 2,394 | 20.2% |
| $75,000 to $99,999 | 1,398 | 11.8% |
| $100,000 to $149,999 | 2,109 | 17.8% |
| $150,000 to $199,999 | 1,280 | 10.8% |
| $200,000+ | 379 | 3.2% |
Family Income by Famaliy Size in Pahrump
7+ person families (163 | 1.4%) account for the highest median family income in Pahrump with $151,563 per family, while 3-person families (2,665 | 22.5%) have the highest median income of $30,295 per family member.
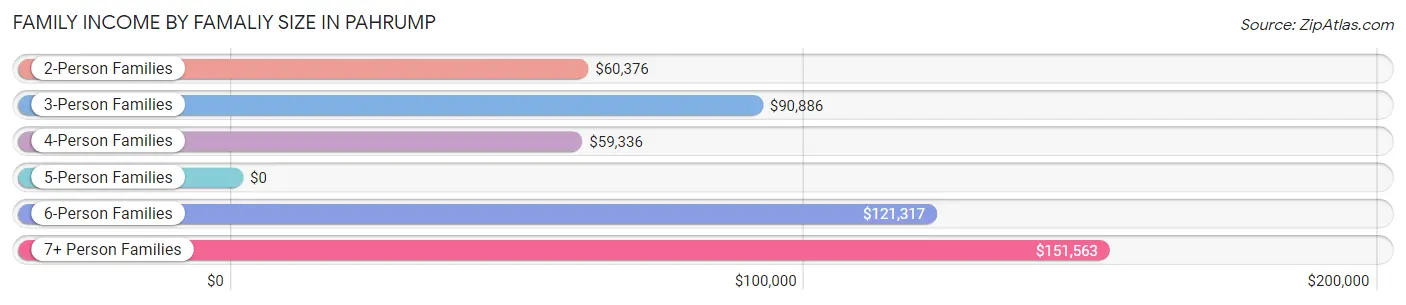
| Income Bracket | # Families | Median Income |
| 2-Person Families | 7,318 (61.8%) | $60,376 |
| 3-Person Families | 2,665 (22.5%) | $90,886 |
| 4-Person Families | 777 (6.6%) | $59,336 |
| 5-Person Families | 677 (5.7%) | $0 |
| 6-Person Families | 251 (2.1%) | $121,317 |
| 7+ Person Families | 163 (1.4%) | $151,563 |
| Total | 11,851 (100.0%) | $65,032 |
Family Income by Number of Earners in Pahrump
The median family income in Pahrump is $65,032, with families comprising 3+ earners (491) having the highest median family income of $157,138, while families with no earners (4,716) have the lowest median family income of $45,700, accounting for 4.1% and 39.8% of families, respectively.
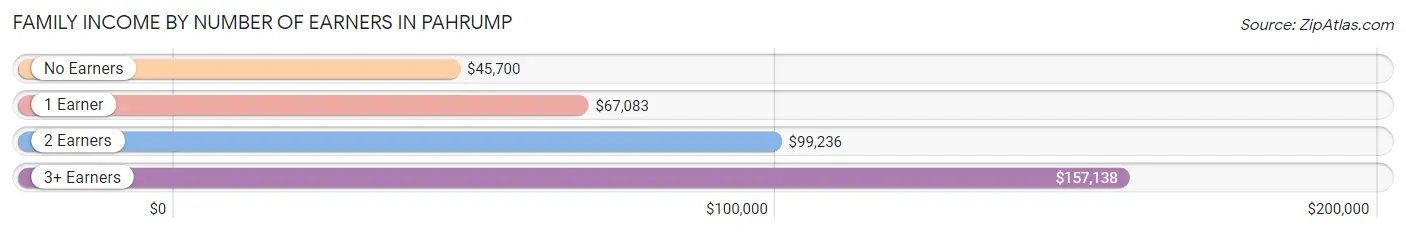
| Number of Earners | # Families | Median Income |
| No Earners | 4,716 (39.8%) | $45,700 |
| 1 Earner | 4,051 (34.2%) | $67,083 |
| 2 Earners | 2,593 (21.9%) | $99,236 |
| 3+ Earners | 491 (4.1%) | $157,138 |
| Total | 11,851 (100.0%) | $65,032 |
Household Income in Pahrump
Household Income Brackets in Pahrump
With 3,385 households falling in the category, the $50,000 to $74,999 income range is the most frequent in Pahrump, accounting for 18.2% of all households. In contrast, only 744 households (4.0%) fall into the $10,000 to $14,999 income bracket, making it the least populous group.
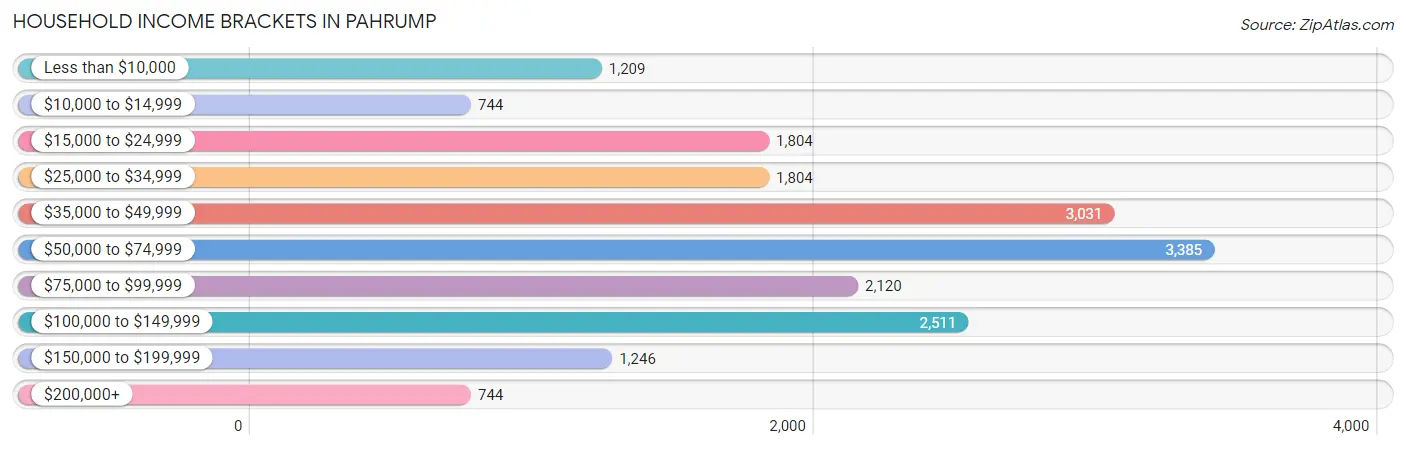
| Income Bracket | # Households | % Households |
| Less than $10,000 | 1,209 | 6.5% |
| $10,000 to $14,999 | 744 | 4.0% |
| $15,000 to $24,999 | 1,804 | 9.7% |
| $25,000 to $34,999 | 1,804 | 9.7% |
| $35,000 to $49,999 | 3,031 | 16.3% |
| $50,000 to $74,999 | 3,385 | 18.2% |
| $75,000 to $99,999 | 2,120 | 11.4% |
| $100,000 to $149,999 | 2,511 | 13.5% |
| $150,000 to $199,999 | 1,246 | 6.7% |
| $200,000+ | 744 | 4.0% |
Household Income by Householder Age in Pahrump
The median household income in Pahrump is $54,988, with the highest median household income of $70,841 found in the 25 to 44 years age bracket for the primary householder. A total of 3,246 households (17.4%) fall into this category. Meanwhile, the 15 to 24 years age bracket for the primary householder has the lowest median household income of $26,522, with 391 households (2.1%) in this group.
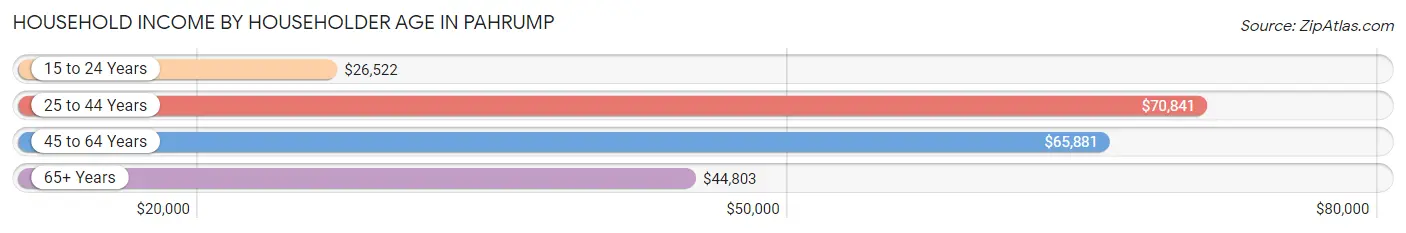
| Income Bracket | # Households | Median Income |
| 15 to 24 Years | 391 (2.1%) | $26,522 |
| 25 to 44 Years | 3,246 (17.4%) | $70,841 |
| 45 to 64 Years | 6,716 (36.1%) | $65,881 |
| 65+ Years | 8,245 (44.3%) | $44,803 |
| Total | 18,598 (100.0%) | $54,988 |
Poverty in Pahrump
Income Below Poverty by Sex and Age in Pahrump
With 14.1% poverty level for males and 15.8% for females among the residents of Pahrump, 15 year old males and 12 to 14 year old females are the most vulnerable to poverty, with 92 males (29.0%) and 193 females (35.5%) in their respective age groups living below the poverty level.
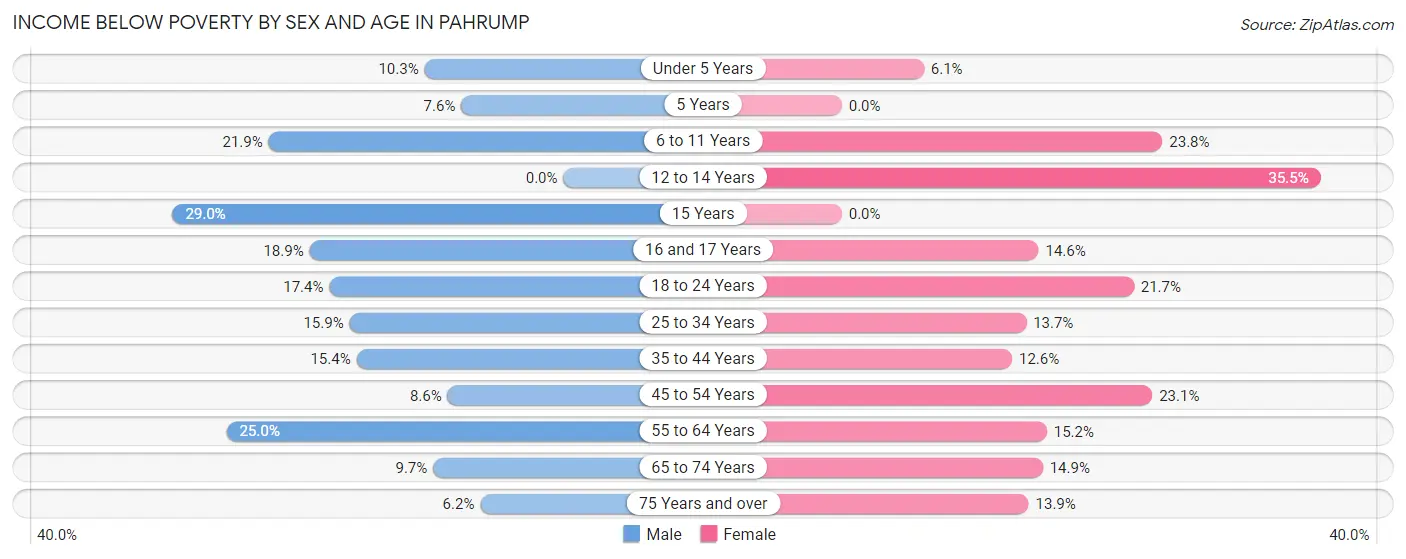
| Age Bracket | Male | Female |
| Under 5 Years | 69 (10.3%) | 68 (6.1%) |
| 5 Years | 10 (7.6%) | 0 (0.0%) |
| 6 to 11 Years | 303 (21.9%) | 244 (23.8%) |
| 12 to 14 Years | 0 (0.0%) | 193 (35.5%) |
| 15 Years | 92 (29.0%) | 0 (0.0%) |
| 16 and 17 Years | 85 (18.9%) | 89 (14.6%) |
| 18 to 24 Years | 196 (17.4%) | 165 (21.7%) |
| 25 to 34 Years | 375 (15.9%) | 288 (13.7%) |
| 35 to 44 Years | 323 (15.4%) | 231 (12.6%) |
| 45 to 54 Years | 205 (8.6%) | 549 (23.1%) |
| 55 to 64 Years | 891 (25.0%) | 595 (15.2%) |
| 65 to 74 Years | 402 (9.7%) | 645 (14.9%) |
| 75 Years and over | 188 (6.2%) | 370 (13.9%) |
| Total | 3,139 (14.1%) | 3,437 (15.8%) |
Income Above Poverty by Sex and Age in Pahrump
According to the poverty statistics in Pahrump, males aged 12 to 14 years and females aged 5 years are the age groups that are most secure financially, with 100.0% of males and 100.0% of females in these age groups living above the poverty line.
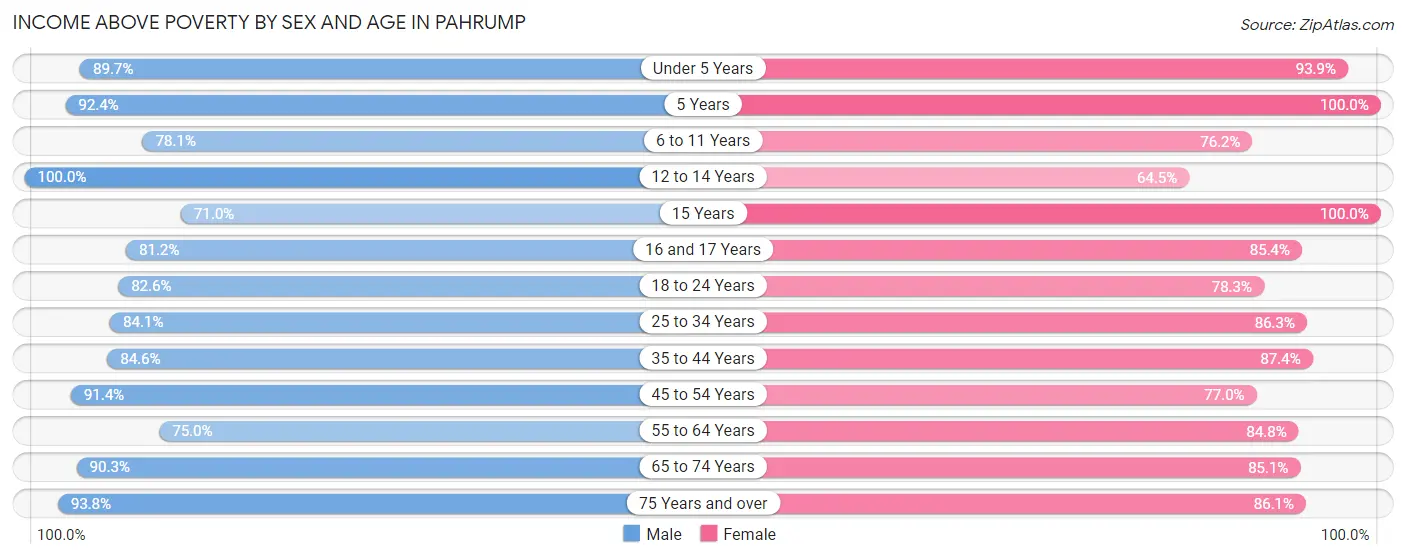
| Age Bracket | Male | Female |
| Under 5 Years | 600 (89.7%) | 1,048 (93.9%) |
| 5 Years | 122 (92.4%) | 310 (100.0%) |
| 6 to 11 Years | 1,081 (78.1%) | 781 (76.2%) |
| 12 to 14 Years | 498 (100.0%) | 350 (64.5%) |
| 15 Years | 225 (71.0%) | 120 (100.0%) |
| 16 and 17 Years | 366 (81.1%) | 520 (85.4%) |
| 18 to 24 Years | 932 (82.6%) | 596 (78.3%) |
| 25 to 34 Years | 1,987 (84.1%) | 1,816 (86.3%) |
| 35 to 44 Years | 1,780 (84.6%) | 1,596 (87.4%) |
| 45 to 54 Years | 2,180 (91.4%) | 1,833 (76.9%) |
| 55 to 64 Years | 2,672 (75.0%) | 3,314 (84.8%) |
| 65 to 74 Years | 3,756 (90.3%) | 3,677 (85.1%) |
| 75 Years and over | 2,859 (93.8%) | 2,298 (86.1%) |
| Total | 19,058 (85.9%) | 18,259 (84.2%) |
Income Below Poverty Among Married-Couple Families in Pahrump
The poverty statistics for married-couple families in Pahrump show that 8.3% or 765 of the total 9,233 families live below the poverty line. Families with 5 or more children have the highest poverty rate of 45.8%, comprising of 11 families. On the other hand, families with 1 or 2 children have the lowest poverty rate of 6.1%, which includes 99 families.
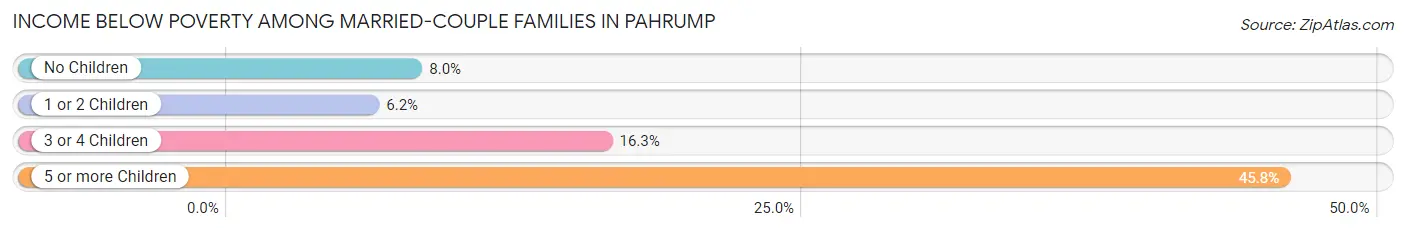
| Children | Above Poverty | Below Poverty |
| No Children | 6,483 (92.0%) | 565 (8.0%) |
| 1 or 2 Children | 1,510 (93.9%) | 99 (6.1%) |
| 3 or 4 Children | 462 (83.7%) | 90 (16.3%) |
| 5 or more Children | 13 (54.2%) | 11 (45.8%) |
| Total | 8,468 (91.7%) | 765 (8.3%) |
Income Below Poverty Among Single-Parent Households in Pahrump
According to the poverty data in Pahrump, 5.9% or 67 single-father households and 23.9% or 355 single-mother households are living below the poverty line. Among single-father households, those with 1 or 2 children have the highest poverty rate, with 36 households (8.1%) experiencing poverty. Likewise, among single-mother households, those with 1 or 2 children have the highest poverty rate, with 293 households (38.2%) falling below the poverty line.
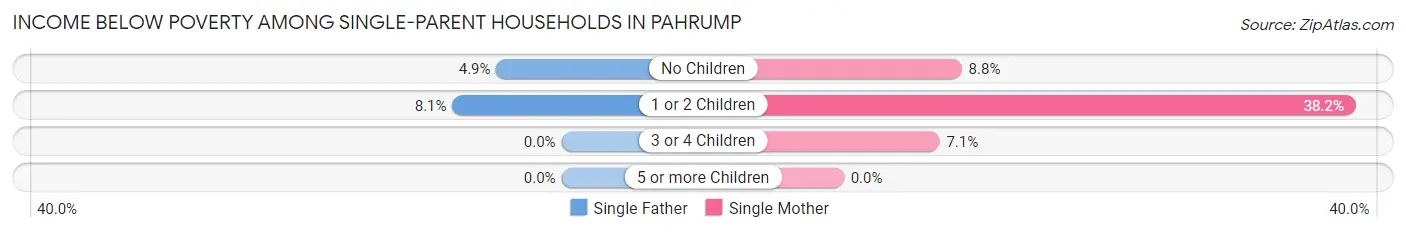
| Children | Single Father | Single Mother |
| No Children | 31 (4.9%) | 58 (8.8%) |
| 1 or 2 Children | 36 (8.1%) | 293 (38.2%) |
| 3 or 4 Children | 0 (0.0%) | 4 (7.1%) |
| 5 or more Children | 0 (0.0%) | 0 (0.0%) |
| Total | 67 (5.9%) | 355 (23.9%) |
Income Below Poverty Among Married-Couple vs Single-Parent Households in Pahrump
The poverty data for Pahrump shows that 765 of the married-couple family households (8.3%) and 422 of the single-parent households (16.1%) are living below the poverty level. Within the married-couple family households, those with 5 or more children have the highest poverty rate, with 11 households (45.8%) falling below the poverty line. Among the single-parent households, those with 1 or 2 children have the highest poverty rate, with 329 household (27.2%) living below poverty.
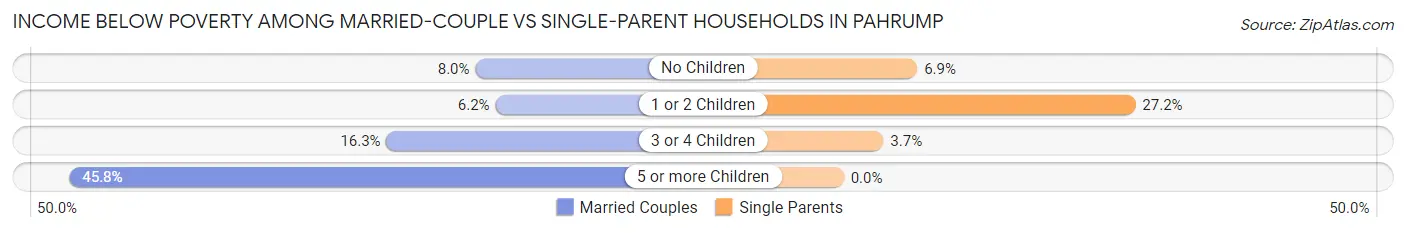
| Children | Married-Couple Families | Single-Parent Households |
| No Children | 565 (8.0%) | 89 (6.9%) |
| 1 or 2 Children | 99 (6.1%) | 329 (27.2%) |
| 3 or 4 Children | 90 (16.3%) | 4 (3.7%) |
| 5 or more Children | 11 (45.8%) | 0 (0.0%) |
| Total | 765 (8.3%) | 422 (16.1%) |
Race in Pahrump
The most populous races in Pahrump are White / Caucasian (33,976 | 76.0%), Hispanic or Latino (7,077 | 15.8%), and Two or more Races (4,580 | 10.2%).
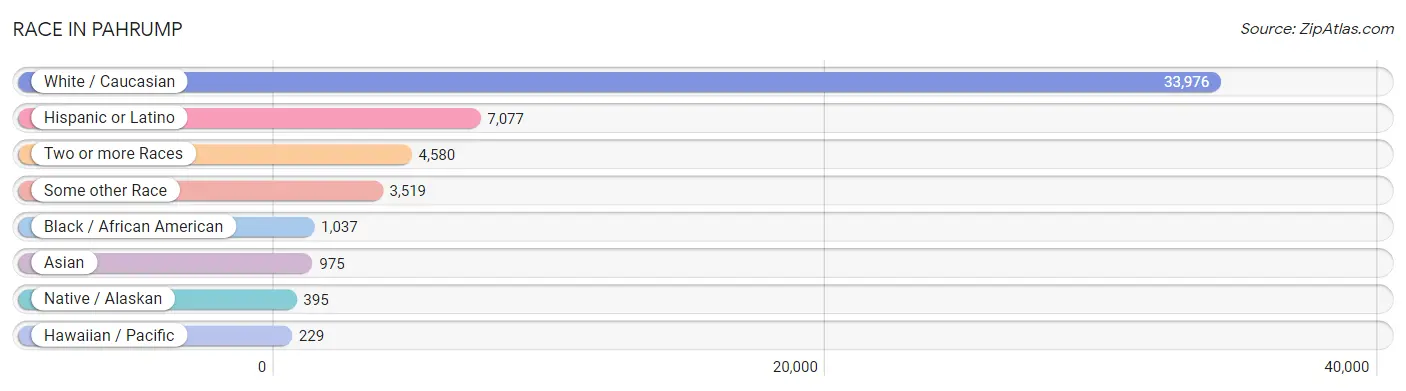
| Race | # Population | % Population |
| Asian | 975 | 2.2% |
| Black / African American | 1,037 | 2.3% |
| Hawaiian / Pacific | 229 | 0.5% |
| Hispanic or Latino | 7,077 | 15.8% |
| Native / Alaskan | 395 | 0.9% |
| White / Caucasian | 33,976 | 76.0% |
| Two or more Races | 4,580 | 10.2% |
| Some other Race | 3,519 | 7.9% |
| Total | 44,711 | 100.0% |
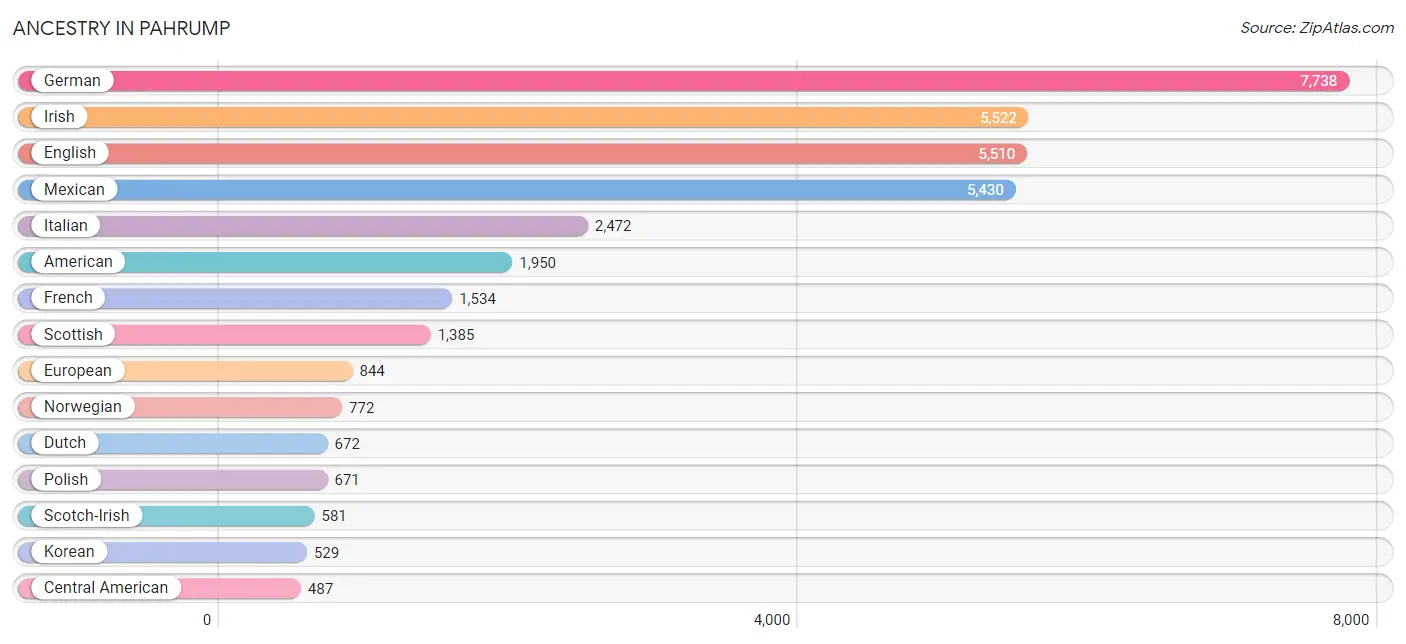
Ancestry in Pahrump
The most populous ancestries reported in Pahrump are German (7,738 | 17.3%), Irish (5,522 | 12.3%), English (5,510 | 12.3%), Mexican (5,430 | 12.1%), and Italian (2,472 | 5.5%), together accounting for 59.6% of all Pahrump residents.
| Ancestry | # Population | % Population |
| African | 269 | 0.6% |
| Alaska Native | 14 | 0.0% |
| American | 1,950 | 4.4% |
| Arab | 45 | 0.1% |
| Argentinean | 60 | 0.1% |
| Austrian | 30 | 0.1% |
| Basque | 33 | 0.1% |
| Belgian | 14 | 0.0% |
| Bhutanese | 174 | 0.4% |
| Bolivian | 65 | 0.2% |
| British | 83 | 0.2% |
| Burmese | 150 | 0.3% |
| Canadian | 89 | 0.2% |
| Central American | 487 | 1.1% |
| Cherokee | 404 | 0.9% |
| Chippewa | 18 | 0.0% |
| Choctaw | 19 | 0.0% |
| Costa Rican | 31 | 0.1% |
| Croatian | 13 | 0.0% |
| Cuban | 169 | 0.4% |
| Czech | 165 | 0.4% |
| Czechoslovakian | 27 | 0.1% |
| Danish | 156 | 0.4% |
| Dutch | 672 | 1.5% |
| Eastern European | 69 | 0.2% |
| Ecuadorian | 14 | 0.0% |
| English | 5,510 | 12.3% |
| European | 844 | 1.9% |
| Filipino | 28 | 0.1% |
| Finnish | 39 | 0.1% |
| French | 1,534 | 3.4% |
| French Canadian | 108 | 0.2% |
| German | 7,738 | 17.3% |
| Greek | 46 | 0.1% |
| Guamanian / Chamorro | 74 | 0.2% |
| Guatemalan | 98 | 0.2% |
| Honduran | 14 | 0.0% |
| Hungarian | 265 | 0.6% |
| Indian (Asian) | 226 | 0.5% |
| Iraqi | 11 | 0.0% |
| Irish | 5,522 | 12.3% |
| Iroquois | 10 | 0.0% |
| Italian | 2,472 | 5.5% |
| Jamaican | 10 | 0.0% |
| Japanese | 286 | 0.6% |
| Korean | 529 | 1.2% |
| Lebanese | 45 | 0.1% |
| Lithuanian | 38 | 0.1% |
| Luxembourger | 18 | 0.0% |
| Maltese | 41 | 0.1% |
| Mexican | 5,430 | 12.1% |
| Native Hawaiian | 387 | 0.9% |
| Navajo | 9 | 0.0% |
| Nigerian | 138 | 0.3% |
| Northern European | 50 | 0.1% |
| Norwegian | 772 | 1.7% |
| Osage | 7 | 0.0% |
| Paiute | 72 | 0.2% |
| Pakistani | 40 | 0.1% |
| Polish | 671 | 1.5% |
| Portuguese | 231 | 0.5% |
| Puerto Rican | 155 | 0.4% |
| Romanian | 30 | 0.1% |
| Russian | 328 | 0.7% |
| Salvadoran | 344 | 0.8% |
| Scandinavian | 382 | 0.9% |
| Scotch-Irish | 581 | 1.3% |
| Scottish | 1,385 | 3.1% |
| Serbian | 55 | 0.1% |
| Shoshone | 9 | 0.0% |
| Sioux | 10 | 0.0% |
| Slovak | 33 | 0.1% |
| South American | 181 | 0.4% |
| Spaniard | 339 | 0.8% |
| Spanish | 198 | 0.4% |
| Sri Lankan | 41 | 0.1% |
| Subsaharan African | 407 | 0.9% |
| Swedish | 452 | 1.0% |
| Swiss | 151 | 0.3% |
| Thai | 51 | 0.1% |
| Ukrainian | 41 | 0.1% |
| Welsh | 260 | 0.6% |
| Yugoslavian | 82 | 0.2% | View All 83 Rows |
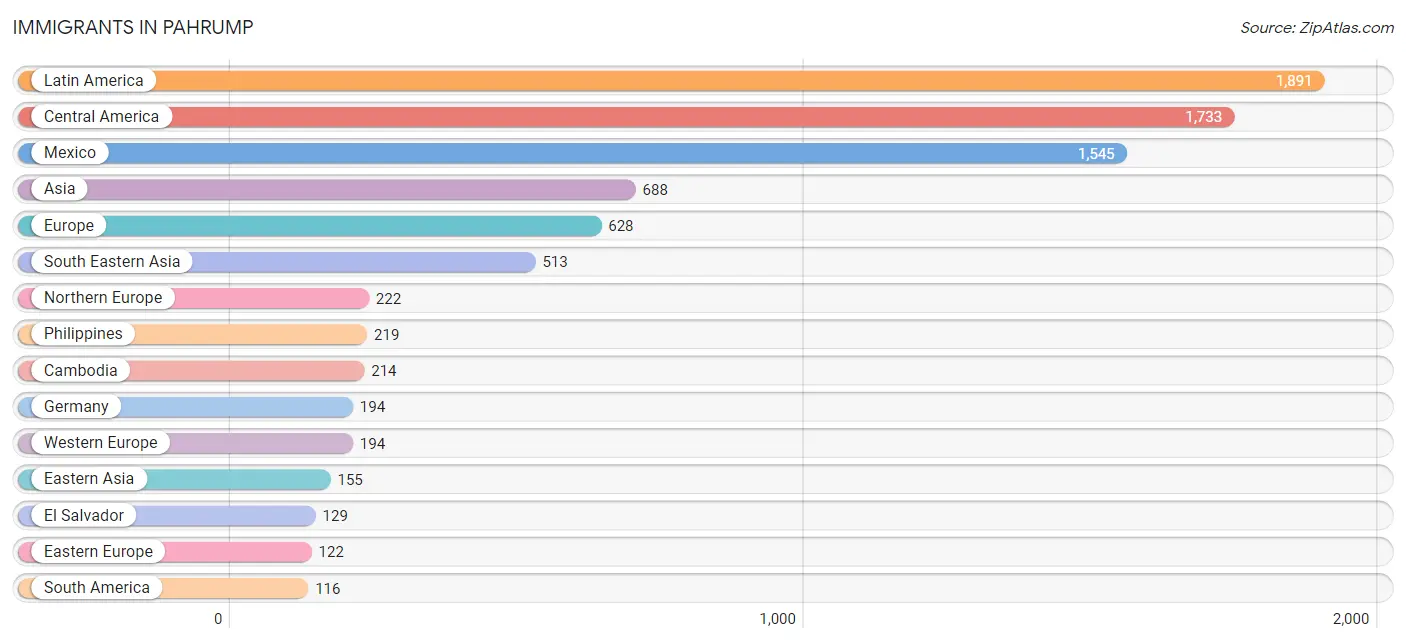
Immigrants in Pahrump
The most numerous immigrant groups reported in Pahrump came from Latin America (1,891 | 4.2%), Central America (1,733 | 3.9%), Mexico (1,545 | 3.5%), Asia (688 | 1.5%), and Europe (628 | 1.4%), together accounting for 14.5% of all Pahrump residents.
| Immigration Origin | # Population | % Population |
| Argentina | 60 | 0.1% |
| Asia | 688 | 1.5% |
| Australia | 17 | 0.0% |
| Belize | 14 | 0.0% |
| Cambodia | 214 | 0.5% |
| Canada | 115 | 0.3% |
| Caribbean | 42 | 0.1% |
| Central America | 1,733 | 3.9% |
| China | 45 | 0.1% |
| Costa Rica | 31 | 0.1% |
| Cuba | 27 | 0.1% |
| Czechoslovakia | 55 | 0.1% |
| Denmark | 51 | 0.1% |
| Eastern Asia | 155 | 0.4% |
| Eastern Europe | 122 | 0.3% |
| Ecuador | 14 | 0.0% |
| El Salvador | 129 | 0.3% |
| England | 101 | 0.2% |
| Europe | 628 | 1.4% |
| Germany | 194 | 0.4% |
| Honduras | 14 | 0.0% |
| India | 4 | 0.0% |
| Indonesia | 47 | 0.1% |
| Ireland | 13 | 0.0% |
| Italy | 49 | 0.1% |
| Jamaica | 15 | 0.0% |
| Korea | 110 | 0.3% |
| Latin America | 1,891 | 4.2% |
| Lebanon | 11 | 0.0% |
| Mexico | 1,545 | 3.5% |
| Northern Europe | 222 | 0.5% |
| Oceania | 17 | 0.0% |
| Pakistan | 5 | 0.0% |
| Philippines | 219 | 0.5% |
| Poland | 25 | 0.1% |
| Romania | 12 | 0.0% |
| Russia | 18 | 0.0% |
| Scotland | 22 | 0.1% |
| South America | 116 | 0.3% |
| South Central Asia | 9 | 0.0% |
| South Eastern Asia | 513 | 1.1% |
| Southern Europe | 90 | 0.2% |
| Sweden | 17 | 0.0% |
| Taiwan | 20 | 0.0% |
| Thailand | 33 | 0.1% |
| Ukraine | 12 | 0.0% |
| Western Asia | 11 | 0.0% |
| Western Europe | 194 | 0.4% | View All 48 Rows |
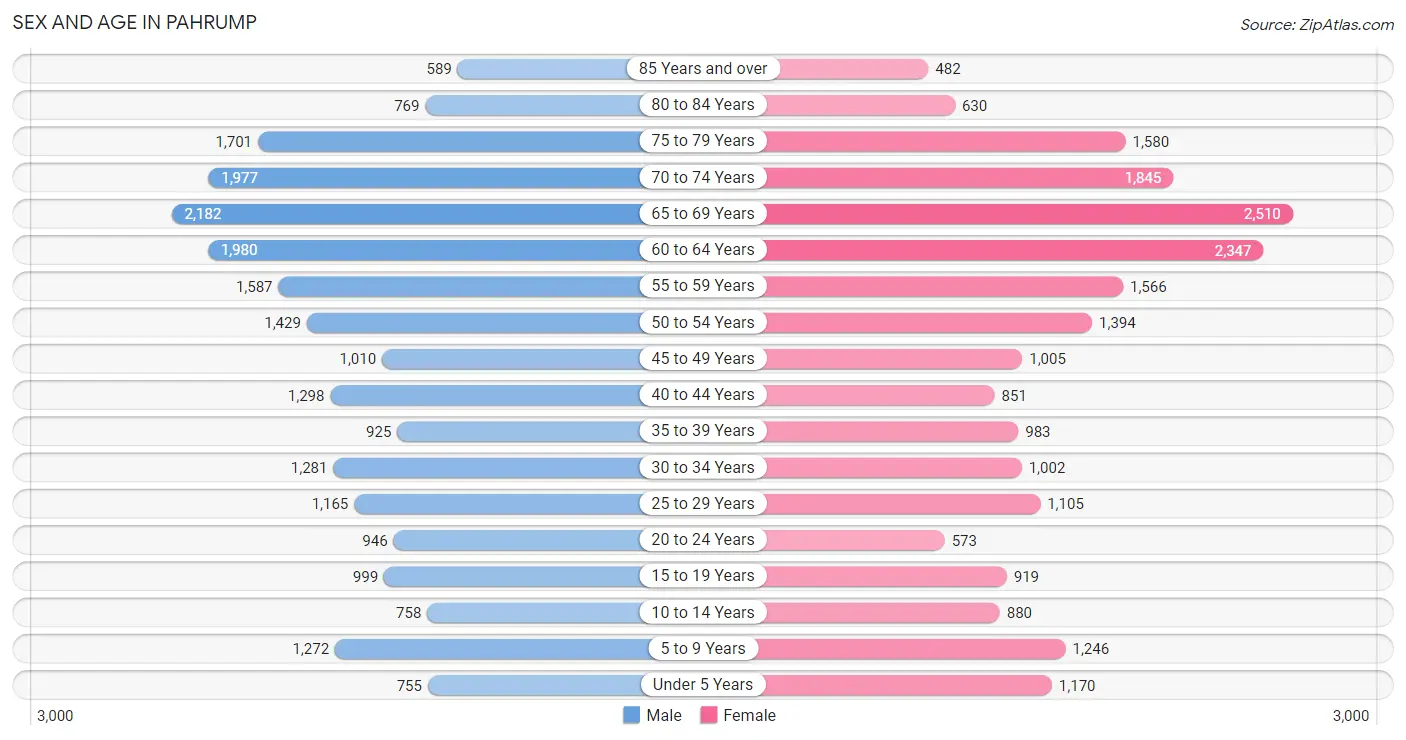
Sex and Age in Pahrump
Sex and Age in Pahrump
The most populous age groups in Pahrump are 65 to 69 Years (2,182 | 9.7%) for men and 65 to 69 Years (2,510 | 11.4%) for women.
| Age Bracket | Male | Female |
| Under 5 Years | 755 (3.3%) | 1,170 (5.3%) |
| 5 to 9 Years | 1,272 (5.6%) | 1,246 (5.6%) |
| 10 to 14 Years | 758 (3.4%) | 880 (4.0%) |
| 15 to 19 Years | 999 (4.4%) | 919 (4.2%) |
| 20 to 24 Years | 946 (4.2%) | 573 (2.6%) |
| 25 to 29 Years | 1,165 (5.1%) | 1,105 (5.0%) |
| 30 to 34 Years | 1,281 (5.7%) | 1,002 (4.5%) |
| 35 to 39 Years | 925 (4.1%) | 983 (4.4%) |
| 40 to 44 Years | 1,298 (5.7%) | 851 (3.8%) |
| 45 to 49 Years | 1,010 (4.5%) | 1,005 (4.5%) |
| 50 to 54 Years | 1,429 (6.3%) | 1,394 (6.3%) |
| 55 to 59 Years | 1,587 (7.0%) | 1,566 (7.1%) |
| 60 to 64 Years | 1,980 (8.7%) | 2,347 (10.6%) |
| 65 to 69 Years | 2,182 (9.7%) | 2,510 (11.4%) |
| 70 to 74 Years | 1,977 (8.7%) | 1,845 (8.4%) |
| 75 to 79 Years | 1,701 (7.5%) | 1,580 (7.1%) |
| 80 to 84 Years | 769 (3.4%) | 630 (2.9%) |
| 85 Years and over | 589 (2.6%) | 482 (2.2%) |
| Total | 22,623 (100.0%) | 22,088 (100.0%) |
Families and Households in Pahrump
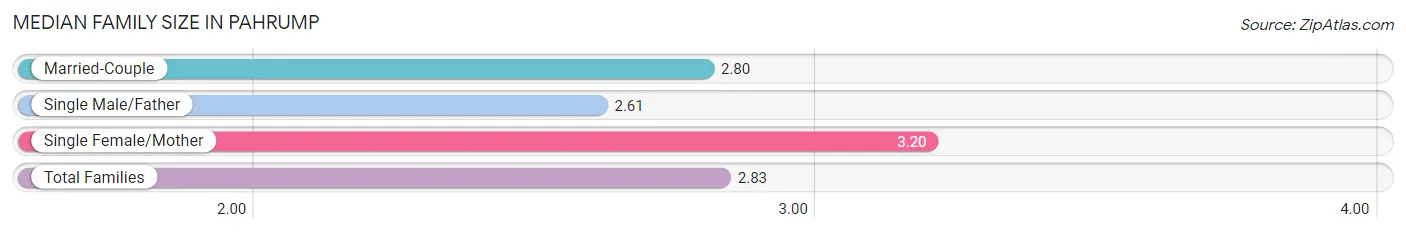
Median Family Size in Pahrump
The median family size in Pahrump is 2.83 persons per family, with single female/mother families (1,484 | 12.5%) accounting for the largest median family size of 3.2 persons per family. On the other hand, single male/father families (1,134 | 9.6%) represent the smallest median family size with 2.61 persons per family.
| Family Type | # Families | Family Size |
| Married-Couple | 9,233 (77.9%) | 2.80 |
| Single Male/Father | 1,134 (9.6%) | 2.61 |
| Single Female/Mother | 1,484 (12.5%) | 3.20 |
| Total Families | 11,851 (100.0%) | 2.83 |
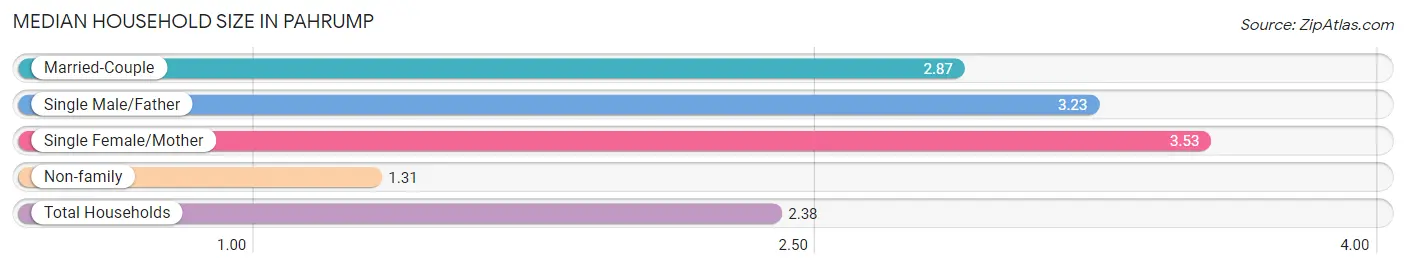
Median Household Size in Pahrump
The median household size in Pahrump is 2.38 persons per household, with single female/mother households (1,484 | 8.0%) accounting for the largest median household size of 3.53 persons per household. non-family households (6,747 | 36.3%) represent the smallest median household size with 1.31 persons per household.
| Household Type | # Households | Household Size |
| Married-Couple | 9,233 (49.6%) | 2.87 |
| Single Male/Father | 1,134 (6.1%) | 3.23 |
| Single Female/Mother | 1,484 (8.0%) | 3.53 |
| Non-family | 6,747 (36.3%) | 1.31 |
| Total Households | 18,598 (100.0%) | 2.38 |
Household Size by Marriage Status in Pahrump
Out of a total of 18,598 households in Pahrump, 11,851 (63.7%) are family households, while 6,747 (36.3%) are nonfamily households. The most numerous type of family households are 2-person households, comprising 6,745, and the most common type of nonfamily households are 1-person households, comprising 5,059.
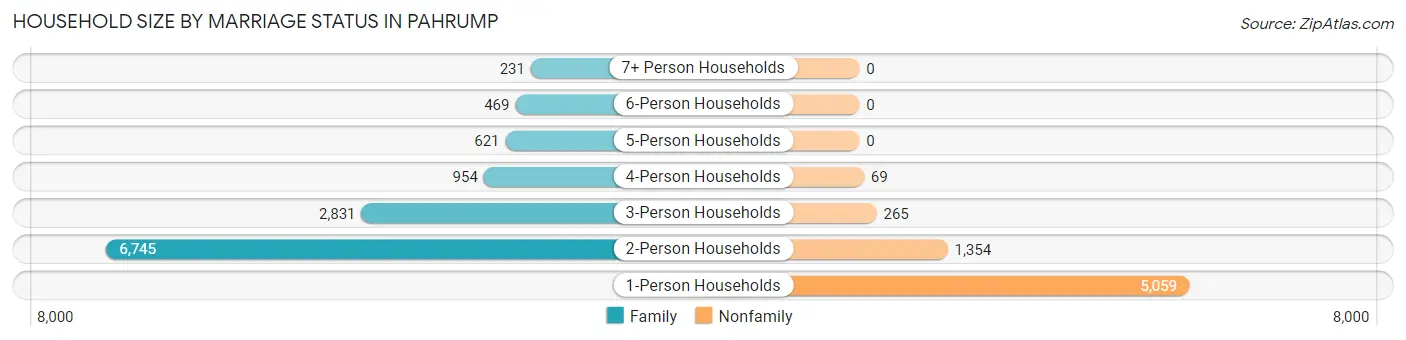
| Household Size | Family Households | Nonfamily Households |
| 1-Person Households | - | 5,059 (27.2%) |
| 2-Person Households | 6,745 (36.3%) | 1,354 (7.3%) |
| 3-Person Households | 2,831 (15.2%) | 265 (1.4%) |
| 4-Person Households | 954 (5.1%) | 69 (0.4%) |
| 5-Person Households | 621 (3.3%) | 0 (0.0%) |
| 6-Person Households | 469 (2.5%) | 0 (0.0%) |
| 7+ Person Households | 231 (1.2%) | 0 (0.0%) |
| Total | 11,851 (63.7%) | 6,747 (36.3%) |
Female Fertility in Pahrump
Fertility by Age in Pahrump
Average fertility rate in Pahrump is 51.0 births per 1,000 women. Women in the age bracket of 20 to 34 years have the highest fertility rate with 95.0 births per 1,000 women. Women in the age bracket of 20 to 34 years acount for 74.1% of all women with births.
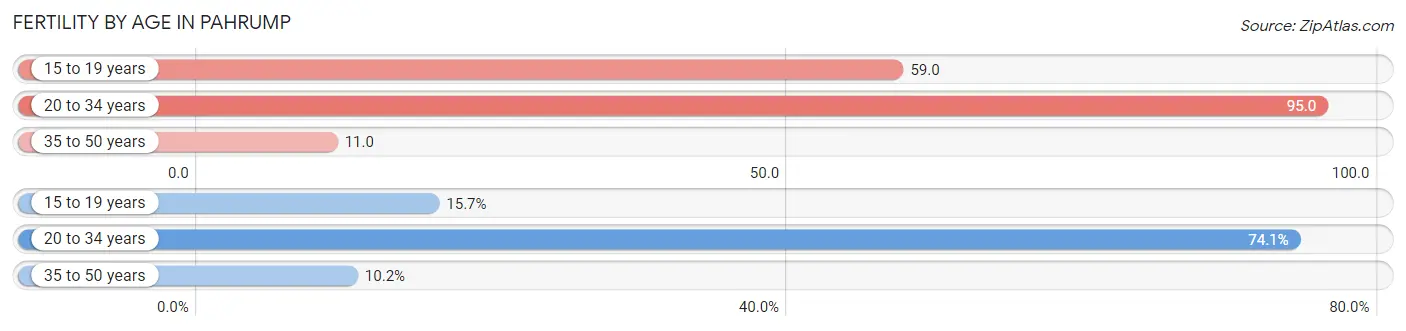
| Age Bracket | Women with Births | Births / 1,000 Women |
| 15 to 19 years | 54 (15.7%) | 59.0 |
| 20 to 34 years | 255 (74.1%) | 95.0 |
| 35 to 50 years | 35 (10.2%) | 11.0 |
| Total | 344 (100.0%) | 51.0 |
Fertility by Age by Marriage Status in Pahrump
71.5% of women with births (344) in Pahrump are married. The highest percentage of unmarried women with births falls into 15 to 19 years age bracket with 100.0% of them unmarried at the time of birth, while the lowest percentage of unmarried women with births belong to 35 to 50 years age bracket with 0.0% of them unmarried.
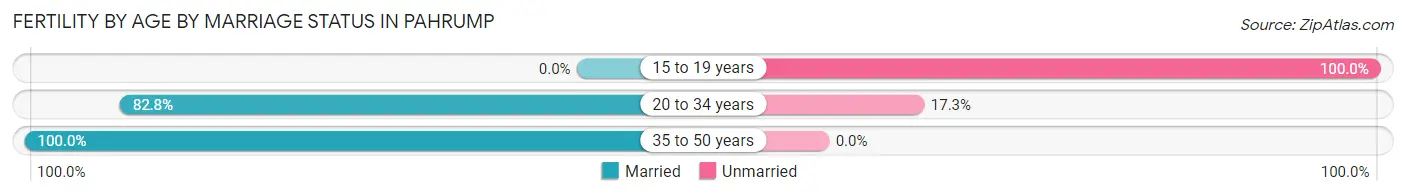
| Age Bracket | Married | Unmarried |
| 15 to 19 years | 0 (0.0%) | 54 (100.0%) |
| 20 to 34 years | 211 (82.8%) | 44 (17.2%) |
| 35 to 50 years | 35 (100.0%) | 0 (0.0%) |
| Total | 246 (71.5%) | 98 (28.5%) |
Fertility by Education in Pahrump
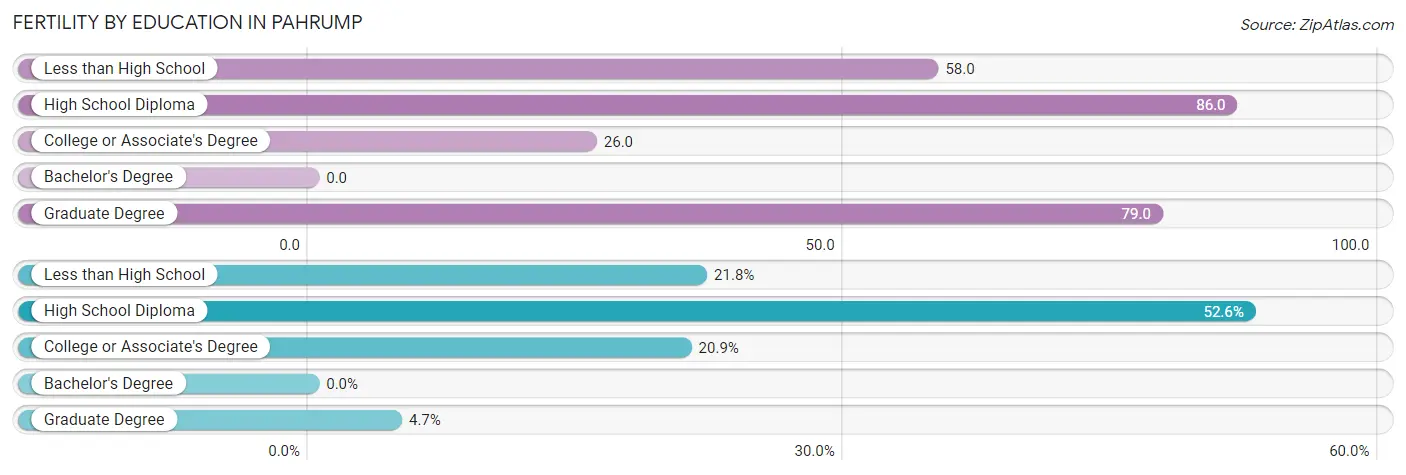
| Educational Attainment | Women with Births | Births / 1,000 Women |
| Less than High School | 75 (21.8%) | 58.0 |
| High School Diploma | 181 (52.6%) | 86.0 |
| College or Associate's Degree | 72 (20.9%) | 26.0 |
| Bachelor's Degree | 0 (0.0%) | 0.0 |
| Graduate Degree | 16 (4.6%) | 79.0 |
| Total | 344 (100.0%) | 51.0 |
Fertility by Education by Marriage Status in Pahrump
28.5% of women with births in Pahrump are unmarried. Women with the educational attainment of graduate degree are most likely to be married with 100.0% of them married at childbirth, while women with the educational attainment of less than high school are least likely to be married with 32.0% of them unmarried at childbirth.
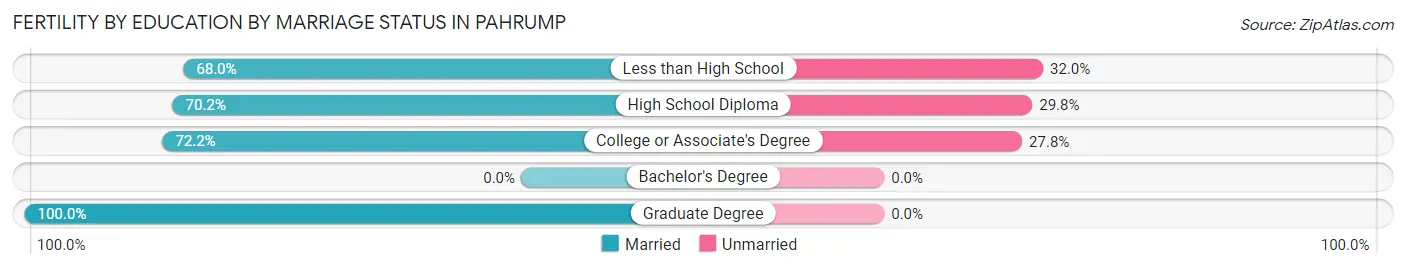
| Educational Attainment | Married | Unmarried |
| Less than High School | 51 (68.0%) | 24 (32.0%) |
| High School Diploma | 127 (70.2%) | 54 (29.8%) |
| College or Associate's Degree | 52 (72.2%) | 20 (27.8%) |
| Bachelor's Degree | 0 (0.0%) | 0 (0.0%) |
| Graduate Degree | 16 (100.0%) | 0 (0.0%) |
| Total | 246 (71.5%) | 98 (28.5%) |
Employment Characteristics in Pahrump
Employment by Class of Employer in Pahrump
Among the 13,563 employed individuals in Pahrump, private company employees (9,260 | 68.3%), local government employees (1,200 | 8.8%), and self-employed (not incorporated) (819 | 6.0%) make up the most common classes of employment.
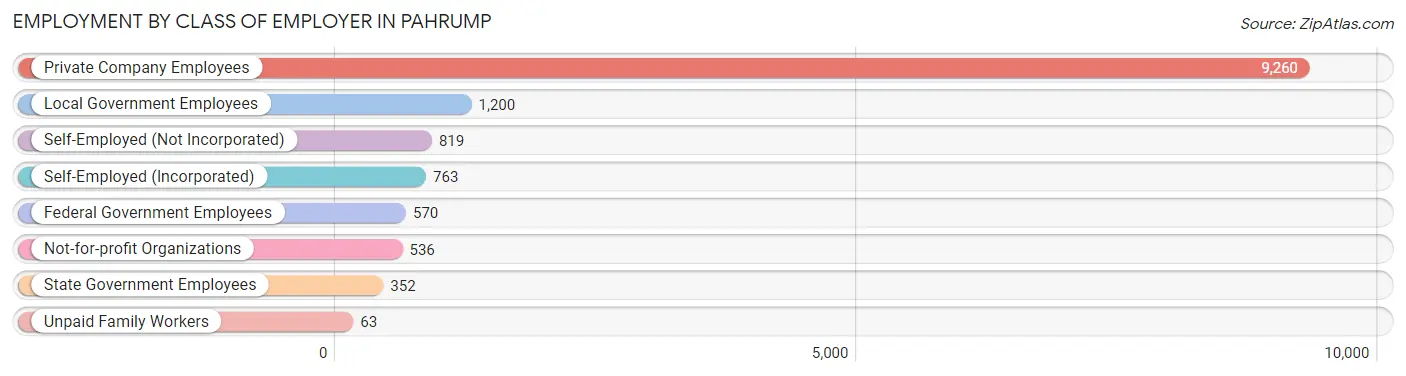
| Employer Class | # Employees | % Employees |
| Private Company Employees | 9,260 | 68.3% |
| Self-Employed (Incorporated) | 763 | 5.6% |
| Self-Employed (Not Incorporated) | 819 | 6.0% |
| Not-for-profit Organizations | 536 | 4.0% |
| Local Government Employees | 1,200 | 8.8% |
| State Government Employees | 352 | 2.6% |
| Federal Government Employees | 570 | 4.2% |
| Unpaid Family Workers | 63 | 0.5% |
| Total | 13,563 | 100.0% |
Employment Status by Age in Pahrump
According to the labor force statistics for Pahrump, out of the total population over 16 years of age (38,193), 40.2% or 15,354 individuals are in the labor force, with 10.2% or 1,566 of them unemployed. The age group with the highest labor force participation rate is 25 to 29 years, with 77.0% or 1,748 individuals in the labor force. Within the labor force, the 25 to 29 years age range has the highest percentage of unemployed individuals, with 21.8% or 381 of them being unemployed.
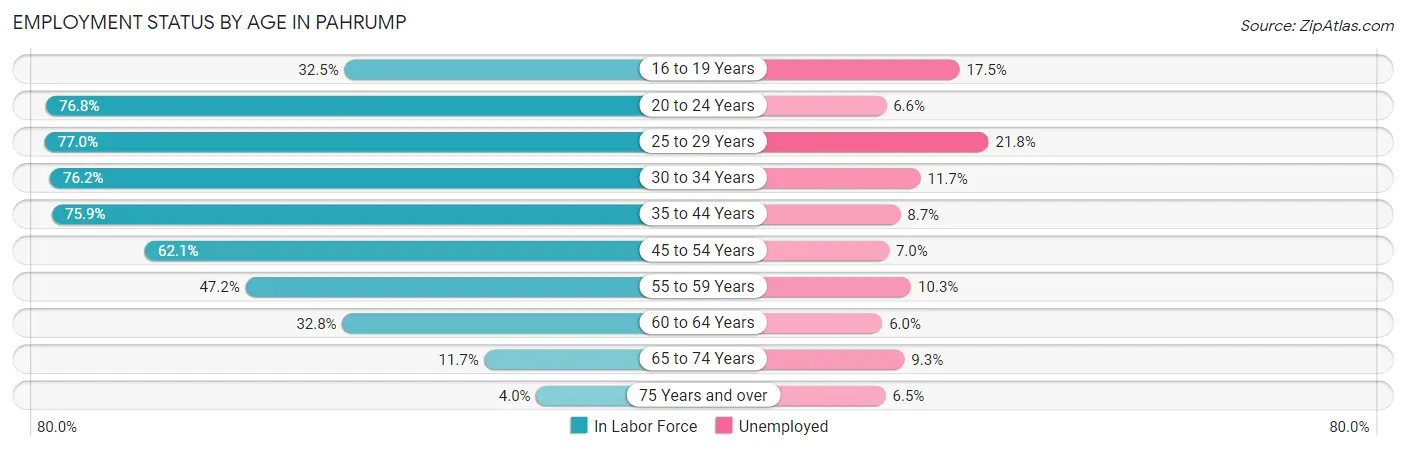
| Age Bracket | In Labor Force | Unemployed |
| 16 to 19 Years | 481 (32.5%) | 84 (17.5%) |
| 20 to 24 Years | 1,167 (76.8%) | 77 (6.6%) |
| 25 to 29 Years | 1,748 (77.0%) | 381 (21.8%) |
| 30 to 34 Years | 1,740 (76.2%) | 204 (11.7%) |
| 35 to 44 Years | 3,079 (75.9%) | 268 (8.7%) |
| 45 to 54 Years | 3,004 (62.1%) | 210 (7.0%) |
| 55 to 59 Years | 1,488 (47.2%) | 153 (10.3%) |
| 60 to 64 Years | 1,419 (32.8%) | 85 (6.0%) |
| 65 to 74 Years | 996 (11.7%) | 93 (9.3%) |
| 75 Years and over | 230 (4.0%) | 15 (6.5%) |
| Total | 15,354 (40.2%) | 1,566 (10.2%) |
Employment Status by Educational Attainment in Pahrump
According to labor force statistics for Pahrump, 59.6% of individuals (12,473) out of the total population between 25 and 64 years of age (20,928) are in the labor force, with 10.4% or 1,297 of them being unemployed. The group with the highest labor force participation rate are those with the educational attainment of bachelor's degree or higher, with 74.2% or 1,578 individuals in the labor force. Within the labor force, individuals with college / associate degree education have the highest percentage of unemployment, with 12.2% or 618 of them being unemployed.
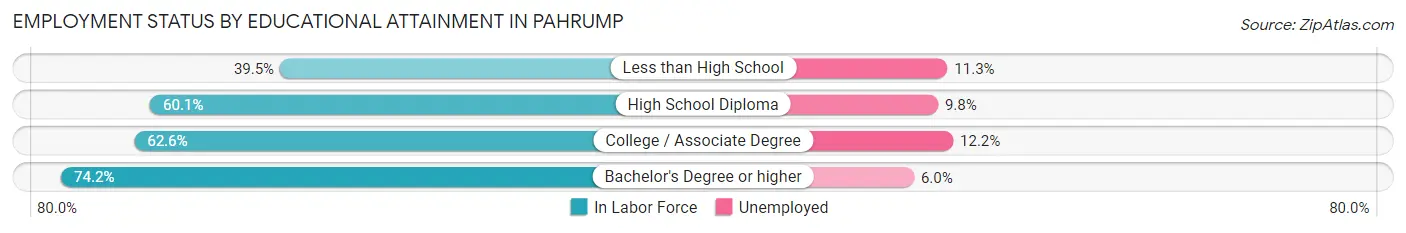
| Educational Attainment | In Labor Force | Unemployed |
| Less than High School | 1,159 (39.5%) | 332 (11.3%) |
| High School Diploma | 4,670 (60.1%) | 762 (9.8%) |
| College / Associate Degree | 5,068 (62.6%) | 988 (12.2%) |
| Bachelor's Degree or higher | 1,578 (74.2%) | 128 (6.0%) |
| Total | 12,473 (59.6%) | 2,177 (10.4%) |
Employment Occupations by Sex in Pahrump
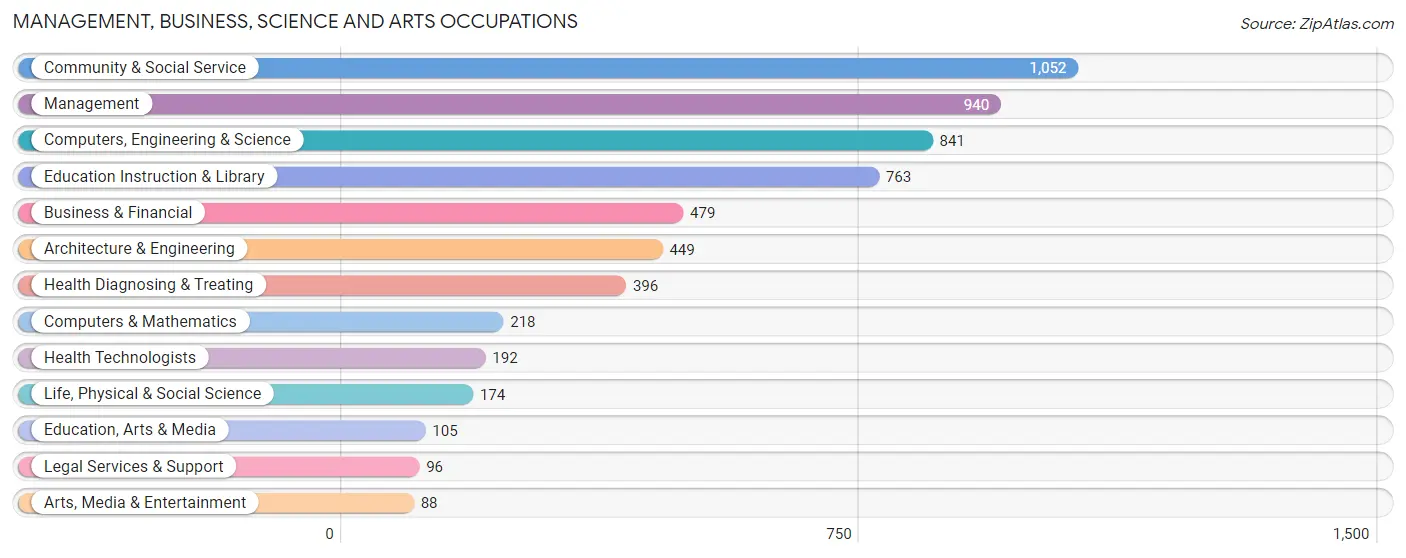
Management, Business, Science and Arts Occupations
The most common Management, Business, Science and Arts occupations in Pahrump are Community & Social Service (1,052 | 7.6%), Management (940 | 6.8%), Computers, Engineering & Science (841 | 6.1%), Education Instruction & Library (763 | 5.5%), and Business & Financial (479 | 3.5%).
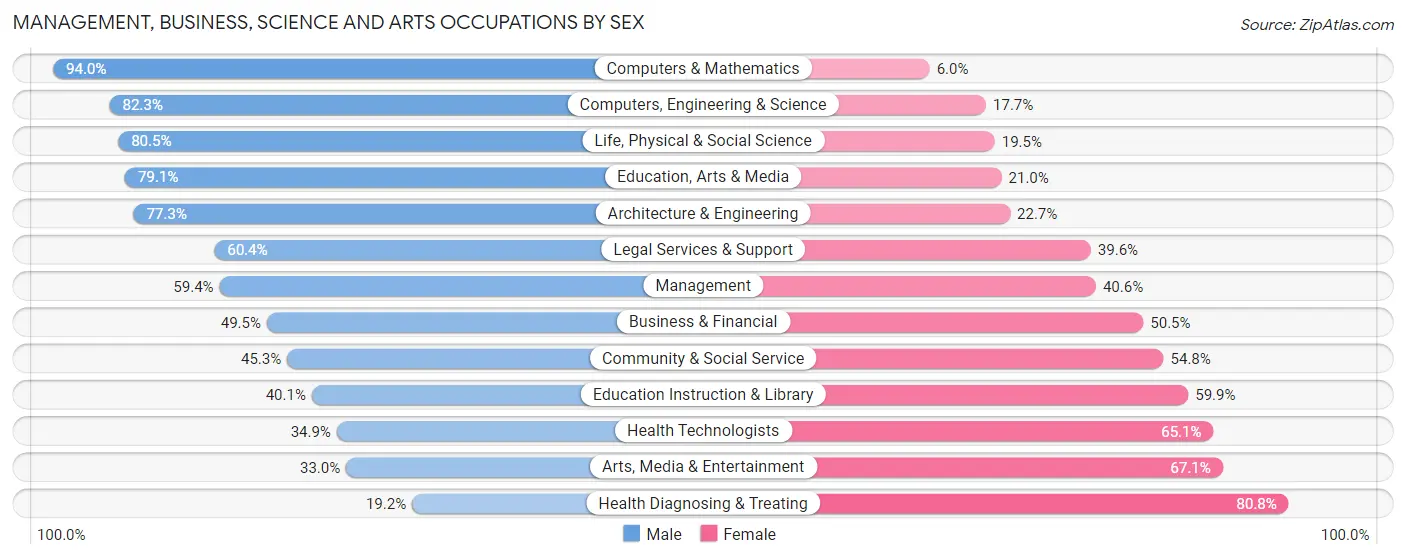
Management, Business, Science and Arts Occupations by Sex
Within the Management, Business, Science and Arts occupations in Pahrump, the most male-oriented occupations are Computers & Mathematics (94.0%), Computers, Engineering & Science (82.3%), and Life, Physical & Social Science (80.5%), while the most female-oriented occupations are Health Diagnosing & Treating (80.8%), Arts, Media & Entertainment (67.0%), and Health Technologists (65.1%).
| Occupation | Male | Female |
| Management | 558 (59.4%) | 382 (40.6%) |
| Business & Financial | 237 (49.5%) | 242 (50.5%) |
| Computers, Engineering & Science | 692 (82.3%) | 149 (17.7%) |
| Computers & Mathematics | 205 (94.0%) | 13 (6.0%) |
| Architecture & Engineering | 347 (77.3%) | 102 (22.7%) |
| Life, Physical & Social Science | 140 (80.5%) | 34 (19.5%) |
| Community & Social Service | 476 (45.3%) | 576 (54.7%) |
| Education, Arts & Media | 83 (79.0%) | 22 (20.9%) |
| Legal Services & Support | 58 (60.4%) | 38 (39.6%) |
| Education Instruction & Library | 306 (40.1%) | 457 (59.9%) |
| Arts, Media & Entertainment | 29 (33.0%) | 59 (67.0%) |
| Health Diagnosing & Treating | 76 (19.2%) | 320 (80.8%) |
| Health Technologists | 67 (34.9%) | 125 (65.1%) |
| Total (Category) | 2,039 (55.0%) | 1,669 (45.0%) |
| Total (Overall) | 8,219 (59.6%) | 5,563 (40.4%) |
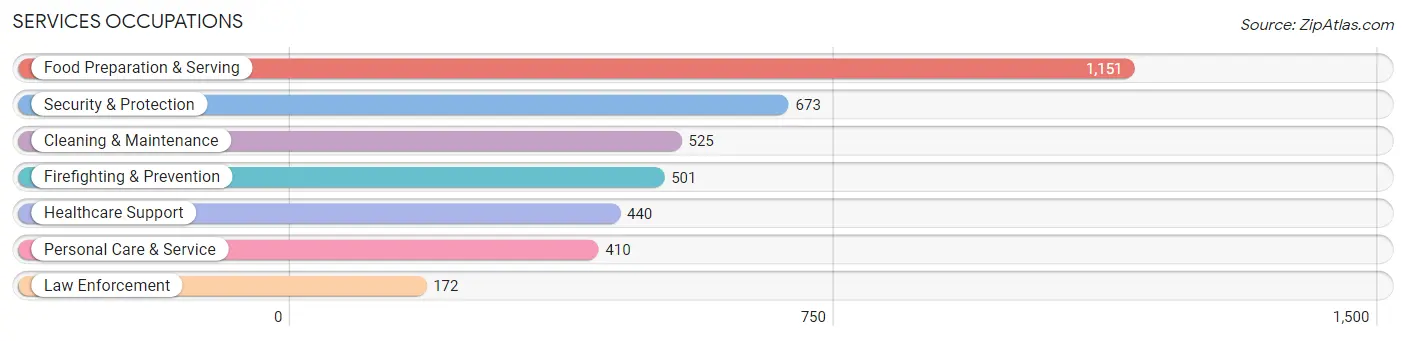
Services Occupations
The most common Services occupations in Pahrump are Food Preparation & Serving (1,151 | 8.4%), Security & Protection (673 | 4.9%), Cleaning & Maintenance (525 | 3.8%), Firefighting & Prevention (501 | 3.6%), and Healthcare Support (440 | 3.2%).
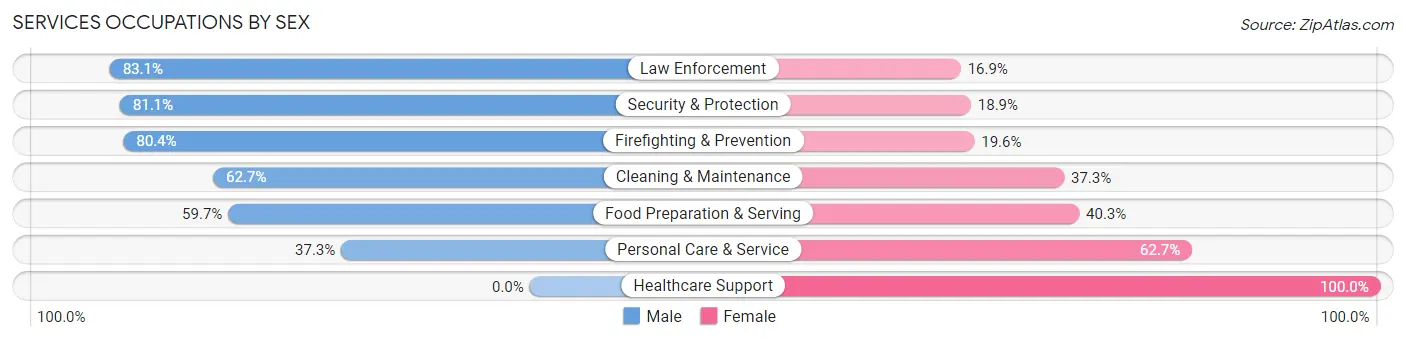
Services Occupations by Sex
Within the Services occupations in Pahrump, the most male-oriented occupations are Law Enforcement (83.1%), Security & Protection (81.1%), and Firefighting & Prevention (80.4%), while the most female-oriented occupations are Healthcare Support (100.0%), Personal Care & Service (62.7%), and Food Preparation & Serving (40.3%).
| Occupation | Male | Female |
| Healthcare Support | 0 (0.0%) | 440 (100.0%) |
| Security & Protection | 546 (81.1%) | 127 (18.9%) |
| Firefighting & Prevention | 403 (80.4%) | 98 (19.6%) |
| Law Enforcement | 143 (83.1%) | 29 (16.9%) |
| Food Preparation & Serving | 687 (59.7%) | 464 (40.3%) |
| Cleaning & Maintenance | 329 (62.7%) | 196 (37.3%) |
| Personal Care & Service | 153 (37.3%) | 257 (62.7%) |
| Total (Category) | 1,715 (53.6%) | 1,484 (46.4%) |
| Total (Overall) | 8,219 (59.6%) | 5,563 (40.4%) |
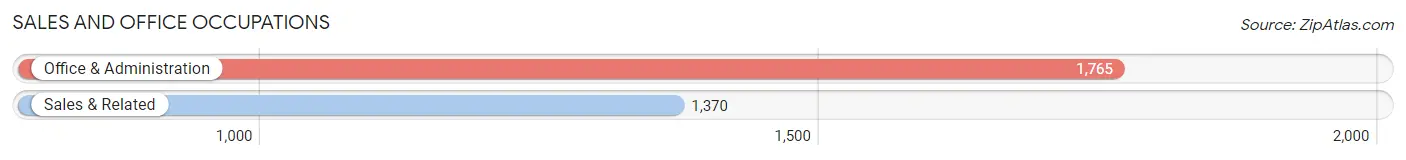
Sales and Office Occupations
The most common Sales and Office occupations in Pahrump are Office & Administration (1,765 | 12.8%), and Sales & Related (1,370 | 9.9%).
Sales and Office Occupations by Sex
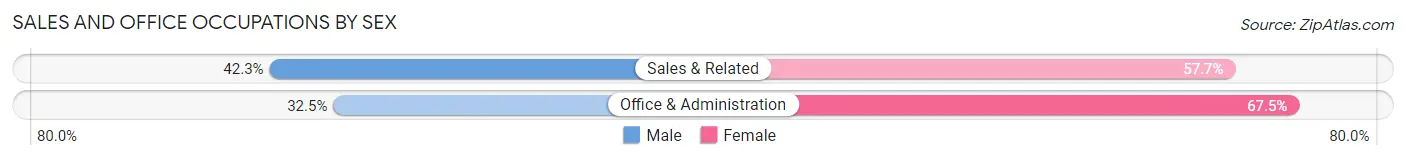
| Occupation | Male | Female |
| Sales & Related | 580 (42.3%) | 790 (57.7%) |
| Office & Administration | 574 (32.5%) | 1,191 (67.5%) |
| Total (Category) | 1,154 (36.8%) | 1,981 (63.2%) |
| Total (Overall) | 8,219 (59.6%) | 5,563 (40.4%) |
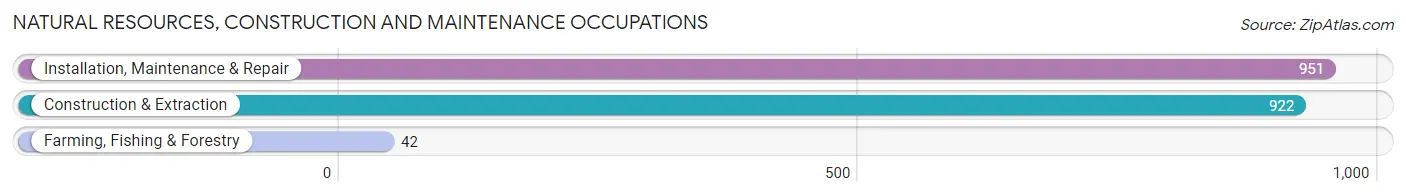
Natural Resources, Construction and Maintenance Occupations
The most common Natural Resources, Construction and Maintenance occupations in Pahrump are Installation, Maintenance & Repair (951 | 6.9%), Construction & Extraction (922 | 6.7%), and Farming, Fishing & Forestry (42 | 0.3%).
Natural Resources, Construction and Maintenance Occupations by Sex
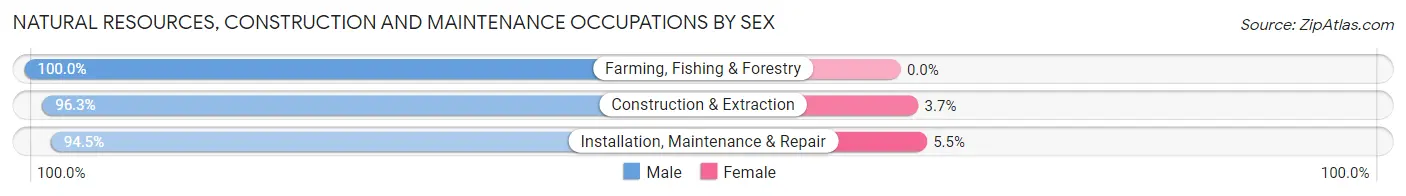
| Occupation | Male | Female |
| Farming, Fishing & Forestry | 42 (100.0%) | 0 (0.0%) |
| Construction & Extraction | 888 (96.3%) | 34 (3.7%) |
| Installation, Maintenance & Repair | 899 (94.5%) | 52 (5.5%) |
| Total (Category) | 1,829 (95.5%) | 86 (4.5%) |
| Total (Overall) | 8,219 (59.6%) | 5,563 (40.4%) |
Production, Transportation and Moving Occupations
The most common Production, Transportation and Moving occupations in Pahrump are Transportation (709 | 5.1%), Material Moving (629 | 4.6%), and Production (487 | 3.5%).
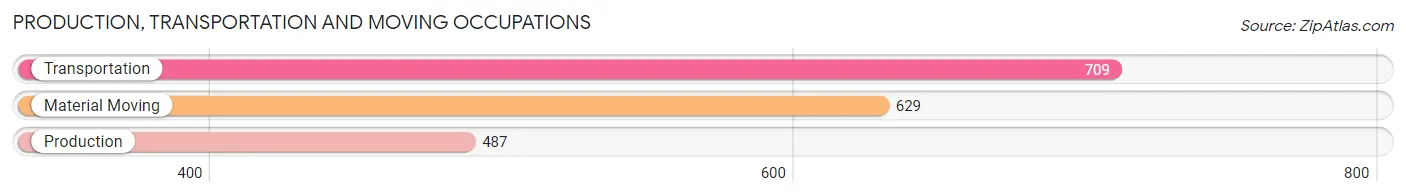
Production, Transportation and Moving Occupations by Sex
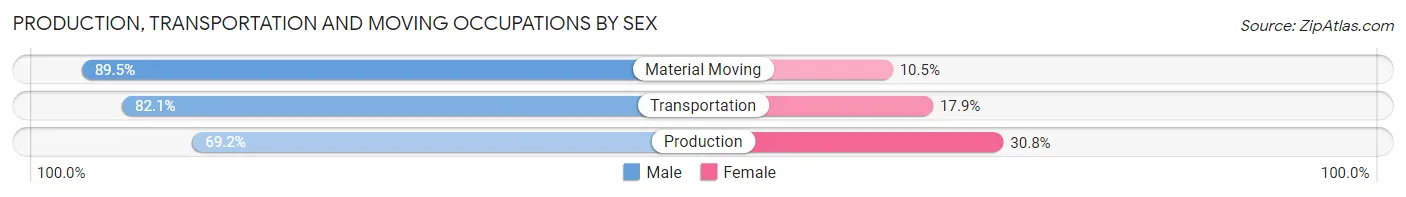
| Occupation | Male | Female |
| Production | 337 (69.2%) | 150 (30.8%) |
| Transportation | 582 (82.1%) | 127 (17.9%) |
| Material Moving | 563 (89.5%) | 66 (10.5%) |
| Total (Category) | 1,482 (81.2%) | 343 (18.8%) |
| Total (Overall) | 8,219 (59.6%) | 5,563 (40.4%) |
Employment Industries by Sex in Pahrump
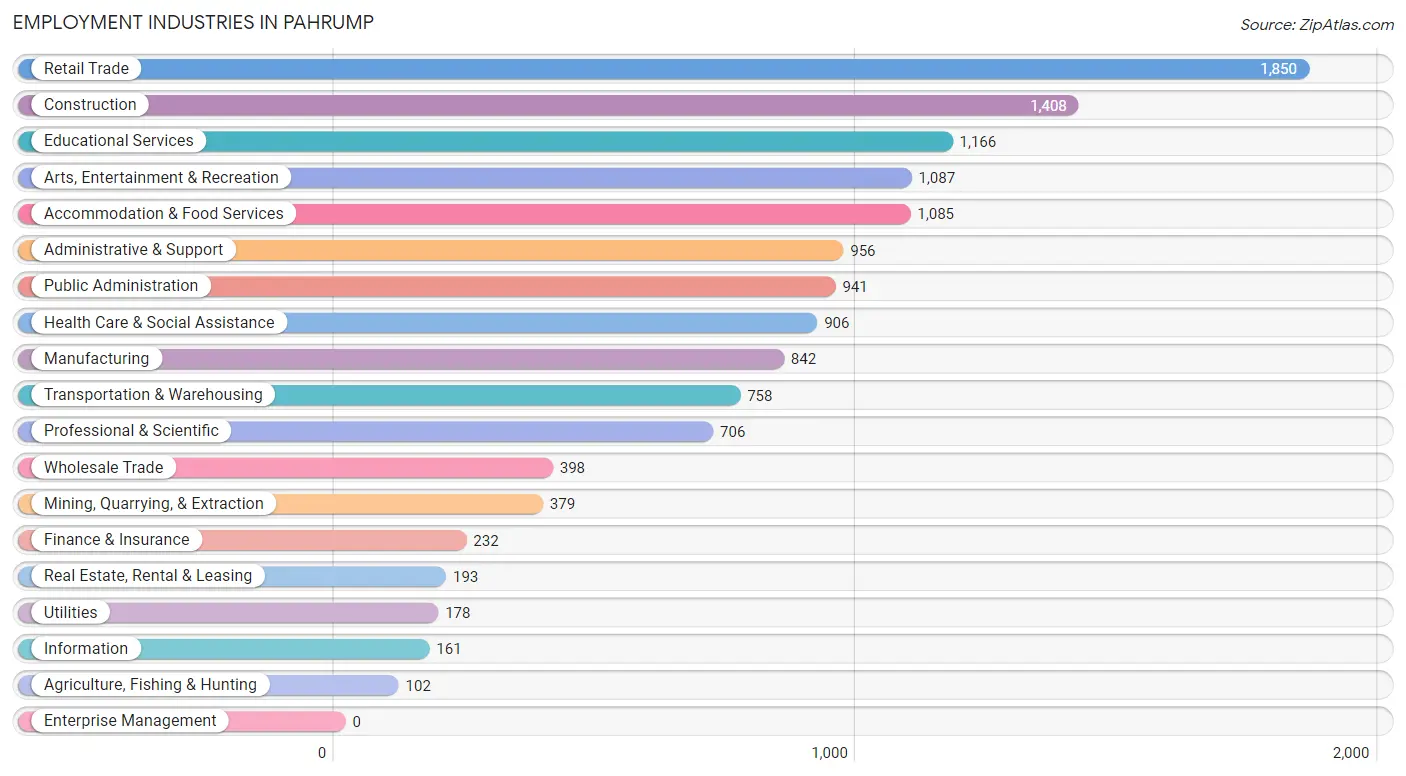
Employment Industries in Pahrump
The major employment industries in Pahrump include Retail Trade (1,850 | 13.4%), Construction (1,408 | 10.2%), Educational Services (1,166 | 8.5%), Arts, Entertainment & Recreation (1,087 | 7.9%), and Accommodation & Food Services (1,085 | 7.9%).
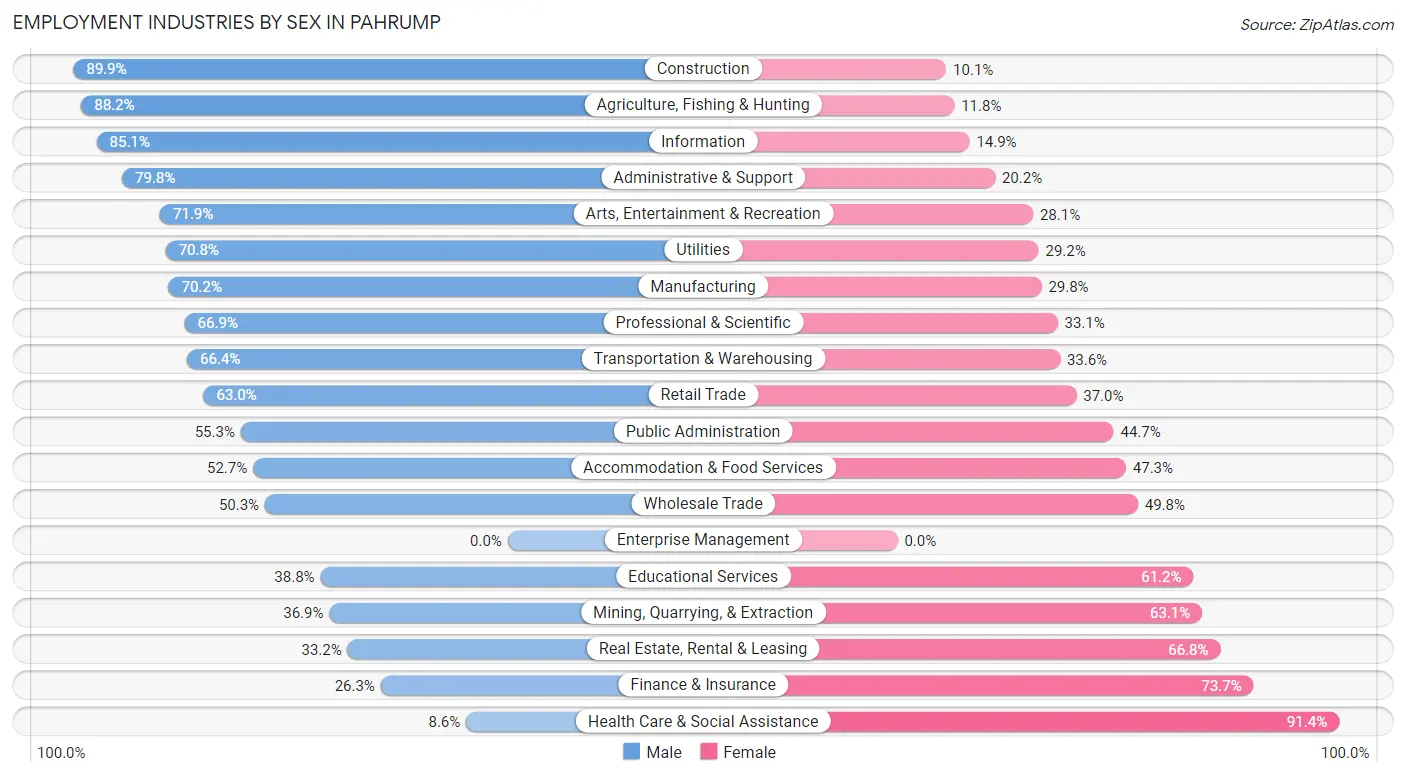
Employment Industries by Sex in Pahrump
The Pahrump industries that see more men than women are Construction (89.9%), Agriculture, Fishing & Hunting (88.2%), and Information (85.1%), whereas the industries that tend to have a higher number of women are Health Care & Social Assistance (91.4%), Finance & Insurance (73.7%), and Real Estate, Rental & Leasing (66.8%).
| Industry | Male | Female |
| Agriculture, Fishing & Hunting | 90 (88.2%) | 12 (11.8%) |
| Mining, Quarrying, & Extraction | 140 (36.9%) | 239 (63.1%) |
| Construction | 1,266 (89.9%) | 142 (10.1%) |
| Manufacturing | 591 (70.2%) | 251 (29.8%) |
| Wholesale Trade | 200 (50.2%) | 198 (49.7%) |
| Retail Trade | 1,165 (63.0%) | 685 (37.0%) |
| Transportation & Warehousing | 503 (66.4%) | 255 (33.6%) |
| Utilities | 126 (70.8%) | 52 (29.2%) |
| Information | 137 (85.1%) | 24 (14.9%) |
| Finance & Insurance | 61 (26.3%) | 171 (73.7%) |
| Real Estate, Rental & Leasing | 64 (33.2%) | 129 (66.8%) |
| Professional & Scientific | 472 (66.9%) | 234 (33.1%) |
| Enterprise Management | 0 (0.0%) | 0 (0.0%) |
| Administrative & Support | 763 (79.8%) | 193 (20.2%) |
| Educational Services | 452 (38.8%) | 714 (61.2%) |
| Health Care & Social Assistance | 78 (8.6%) | 828 (91.4%) |
| Arts, Entertainment & Recreation | 782 (71.9%) | 305 (28.1%) |
| Accommodation & Food Services | 572 (52.7%) | 513 (47.3%) |
| Public Administration | 520 (55.3%) | 421 (44.7%) |
| Total | 8,219 (59.6%) | 5,563 (40.4%) |
Education in Pahrump
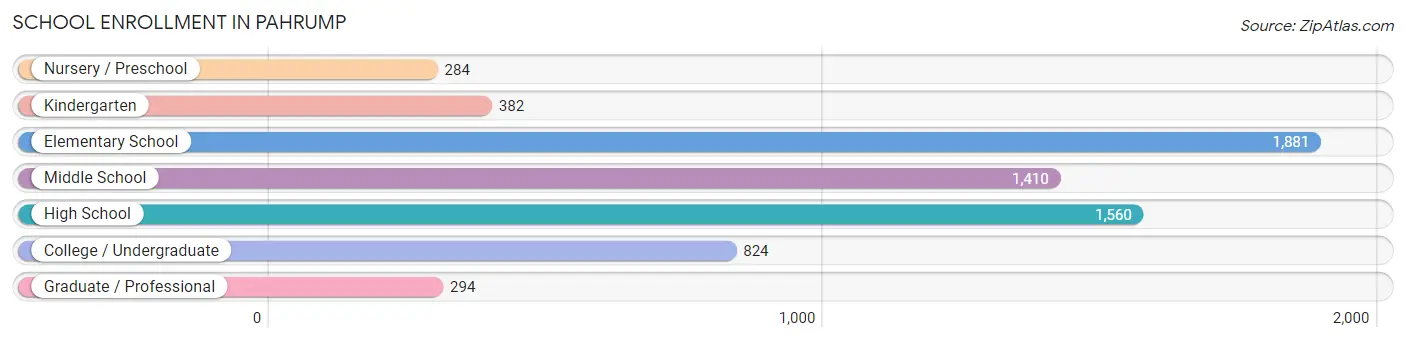
School Enrollment in Pahrump
The most common levels of schooling among the 6,635 students in Pahrump are elementary school (1,881 | 28.3%), high school (1,560 | 23.5%), and middle school (1,410 | 21.2%).
| School Level | # Students | % Students |
| Nursery / Preschool | 284 | 4.3% |
| Kindergarten | 382 | 5.8% |
| Elementary School | 1,881 | 28.3% |
| Middle School | 1,410 | 21.2% |
| High School | 1,560 | 23.5% |
| College / Undergraduate | 824 | 12.4% |
| Graduate / Professional | 294 | 4.4% |
| Total | 6,635 | 100.0% |
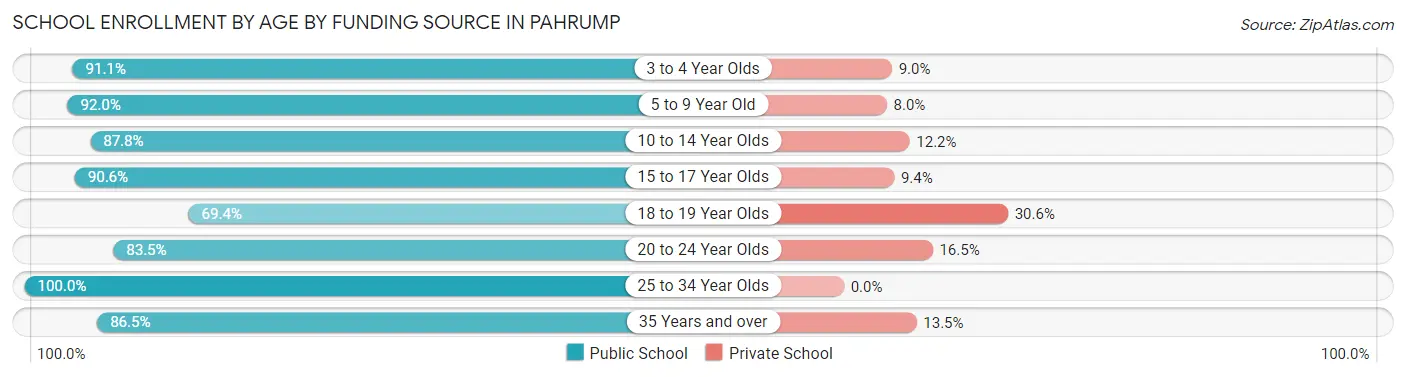
School Enrollment by Age by Funding Source in Pahrump
Out of a total of 6,635 students who are enrolled in schools in Pahrump, 670 (10.1%) attend a private institution, while the remaining 5,965 (89.9%) are enrolled in public schools. The age group of 18 to 19 year olds has the highest likelihood of being enrolled in private schools, with 44 (30.6% in the age bracket) enrolled. Conversely, the age group of 25 to 34 year olds has the lowest likelihood of being enrolled in a private school, with 398 (100.0% in the age bracket) attending a public institution.
| Age Bracket | Public School | Private School |
| 3 to 4 Year Olds | 285 (91.0%) | 28 (8.9%) |
| 5 to 9 Year Old | 2,014 (92.0%) | 175 (8.0%) |
| 10 to 14 Year Olds | 1,398 (87.8%) | 195 (12.2%) |
| 15 to 17 Year Olds | 1,171 (90.6%) | 121 (9.4%) |
| 18 to 19 Year Olds | 100 (69.4%) | 44 (30.6%) |
| 20 to 24 Year Olds | 318 (83.5%) | 63 (16.5%) |
| 25 to 34 Year Olds | 398 (100.0%) | 0 (0.0%) |
| 35 Years and over | 281 (86.5%) | 44 (13.5%) |
| Total | 5,965 (89.9%) | 670 (10.1%) |
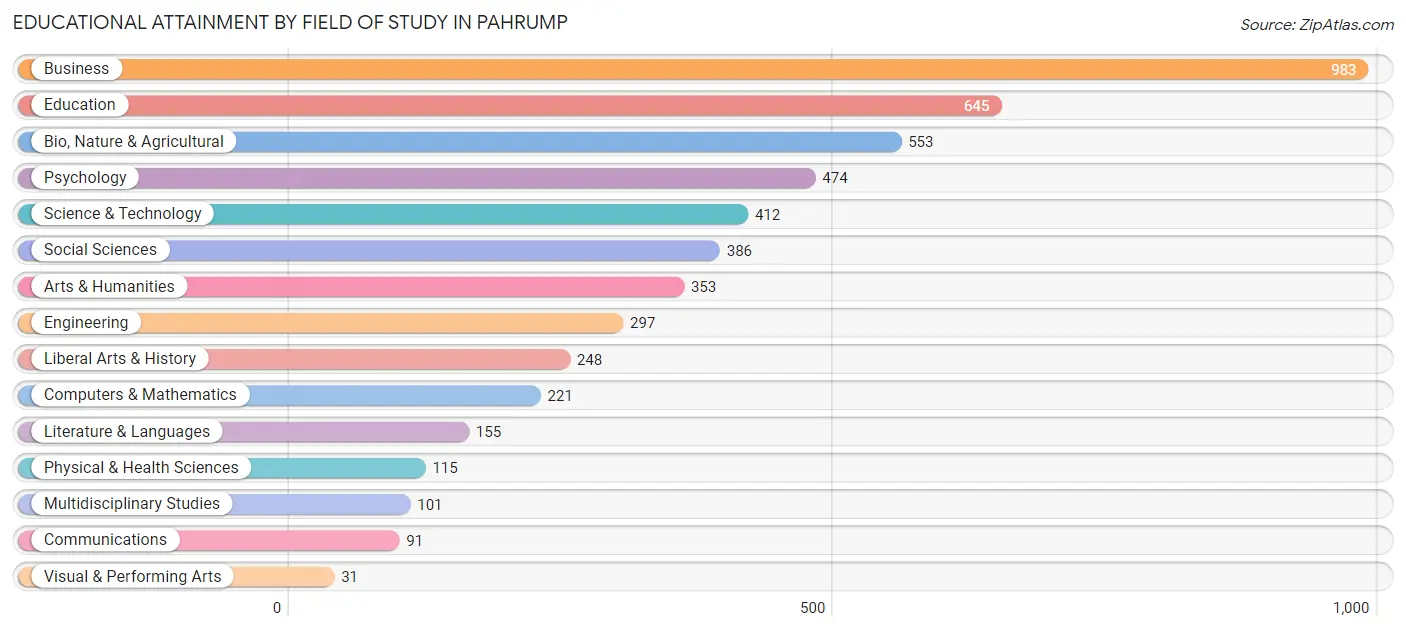
Educational Attainment by Field of Study in Pahrump
Business (983 | 19.4%), education (645 | 12.7%), bio, nature & agricultural (553 | 10.9%), psychology (474 | 9.4%), and science & technology (412 | 8.1%) are the most common fields of study among 5,065 individuals in Pahrump who have obtained a bachelor's degree or higher.
| Field of Study | # Graduates | % Graduates |
| Computers & Mathematics | 221 | 4.4% |
| Bio, Nature & Agricultural | 553 | 10.9% |
| Physical & Health Sciences | 115 | 2.3% |
| Psychology | 474 | 9.4% |
| Social Sciences | 386 | 7.6% |
| Engineering | 297 | 5.9% |
| Multidisciplinary Studies | 101 | 2.0% |
| Science & Technology | 412 | 8.1% |
| Business | 983 | 19.4% |
| Education | 645 | 12.7% |
| Literature & Languages | 155 | 3.1% |
| Liberal Arts & History | 248 | 4.9% |
| Visual & Performing Arts | 31 | 0.6% |
| Communications | 91 | 1.8% |
| Arts & Humanities | 353 | 7.0% |
| Total | 5,065 | 100.0% |
Transportation & Commute in Pahrump
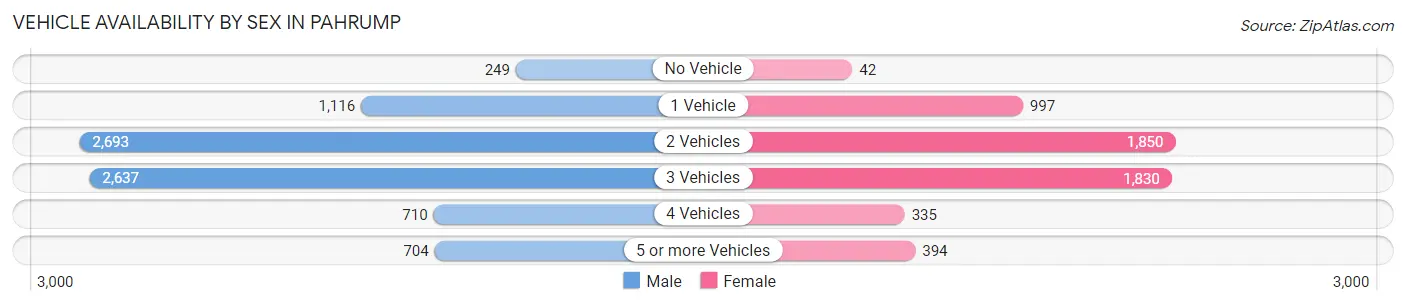
Vehicle Availability by Sex in Pahrump
The most prevalent vehicle ownership categories in Pahrump are males with 2 vehicles (2,693, accounting for 33.2%) and females with 2 vehicles (1,850, making up 49.4%).
| Vehicles Available | Male | Female |
| No Vehicle | 249 (3.1%) | 42 (0.8%) |
| 1 Vehicle | 1,116 (13.8%) | 997 (18.3%) |
| 2 Vehicles | 2,693 (33.2%) | 1,850 (34.0%) |
| 3 Vehicles | 2,637 (32.5%) | 1,830 (33.6%) |
| 4 Vehicles | 710 (8.8%) | 335 (6.1%) |
| 5 or more Vehicles | 704 (8.7%) | 394 (7.2%) |
| Total | 8,109 (100.0%) | 5,448 (100.0%) |
Commute Time in Pahrump
The most frequently occuring commute durations in Pahrump are 10 to 14 minutes (3,126 commuters, 25.2%), 60 to 89 minutes (2,294 commuters, 18.5%), and 15 to 19 minutes (1,966 commuters, 15.8%).
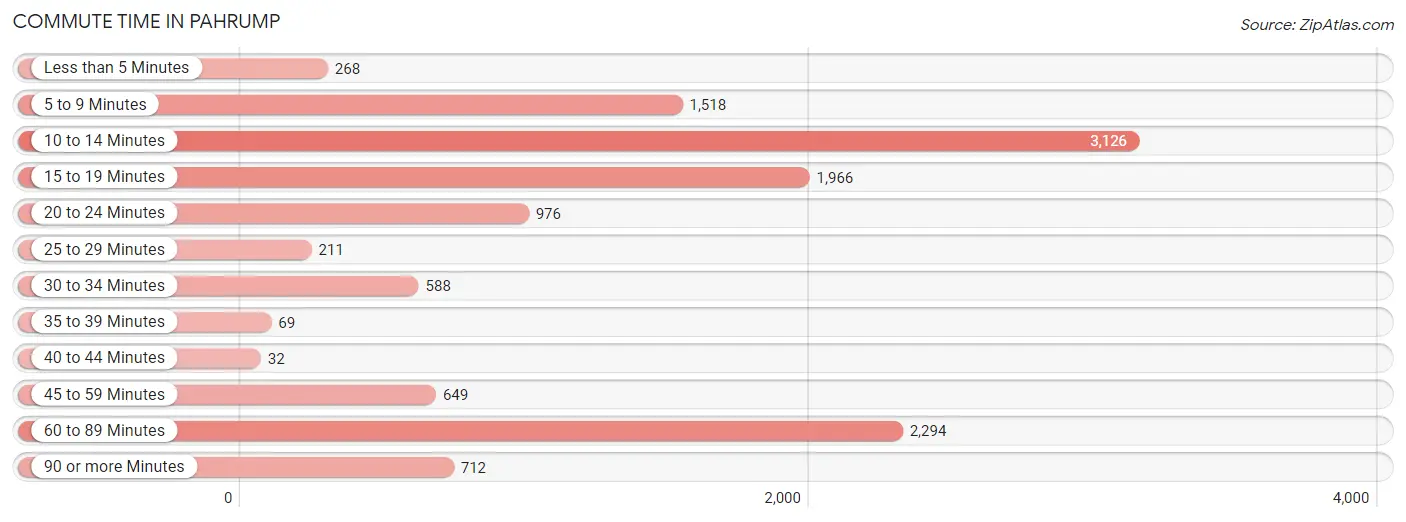
| Commute Time | # Commuters | % Commuters |
| Less than 5 Minutes | 268 | 2.2% |
| 5 to 9 Minutes | 1,518 | 12.2% |
| 10 to 14 Minutes | 3,126 | 25.2% |
| 15 to 19 Minutes | 1,966 | 15.8% |
| 20 to 24 Minutes | 976 | 7.9% |
| 25 to 29 Minutes | 211 | 1.7% |
| 30 to 34 Minutes | 588 | 4.7% |
| 35 to 39 Minutes | 69 | 0.6% |
| 40 to 44 Minutes | 32 | 0.3% |
| 45 to 59 Minutes | 649 | 5.2% |
| 60 to 89 Minutes | 2,294 | 18.5% |
| 90 or more Minutes | 712 | 5.7% |
Commute Time by Sex in Pahrump
The most common commute times in Pahrump are 60 to 89 minutes (1,835 commuters, 24.7%) for males and 10 to 14 minutes (1,426 commuters, 28.5%) for females.
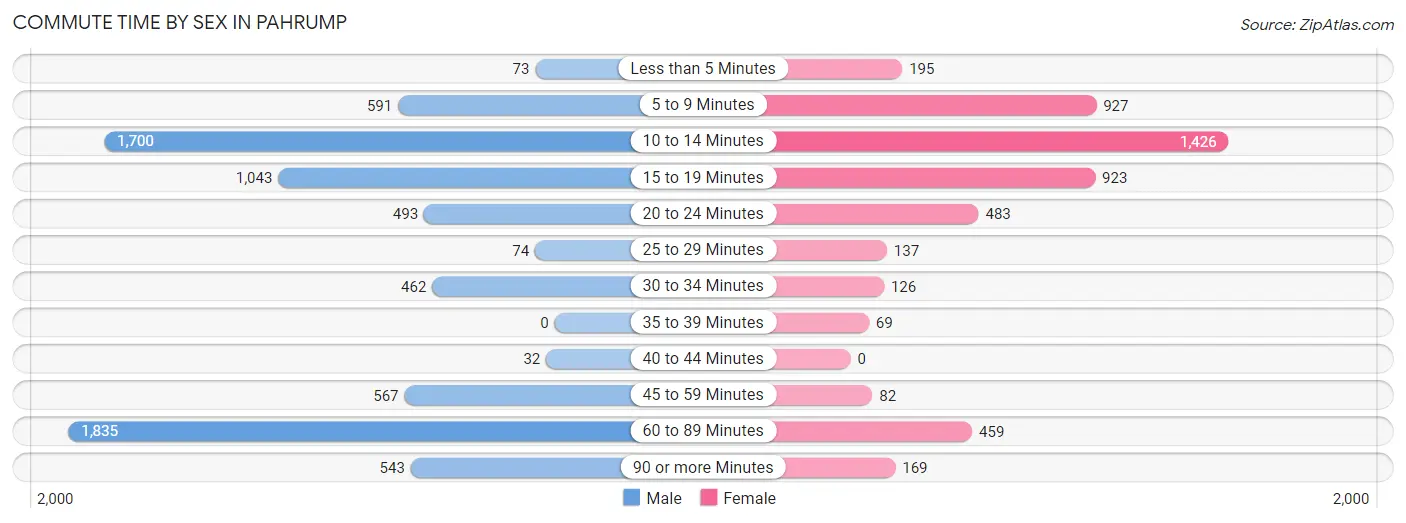
| Commute Time | Male | Female |
| Less than 5 Minutes | 73 (1.0%) | 195 (3.9%) |
| 5 to 9 Minutes | 591 (8.0%) | 927 (18.5%) |
| 10 to 14 Minutes | 1,700 (22.9%) | 1,426 (28.5%) |
| 15 to 19 Minutes | 1,043 (14.1%) | 923 (18.5%) |
| 20 to 24 Minutes | 493 (6.7%) | 483 (9.7%) |
| 25 to 29 Minutes | 74 (1.0%) | 137 (2.7%) |
| 30 to 34 Minutes | 462 (6.2%) | 126 (2.5%) |
| 35 to 39 Minutes | 0 (0.0%) | 69 (1.4%) |
| 40 to 44 Minutes | 32 (0.4%) | 0 (0.0%) |
| 45 to 59 Minutes | 567 (7.6%) | 82 (1.6%) |
| 60 to 89 Minutes | 1,835 (24.7%) | 459 (9.2%) |
| 90 or more Minutes | 543 (7.3%) | 169 (3.4%) |
Time of Departure to Work by Sex in Pahrump
The most frequent times of departure to work in Pahrump are 12:00 AM to 4:59 AM (1,463, 19.7%) for males and 7:30 AM to 7:59 AM (664, 13.3%) for females.
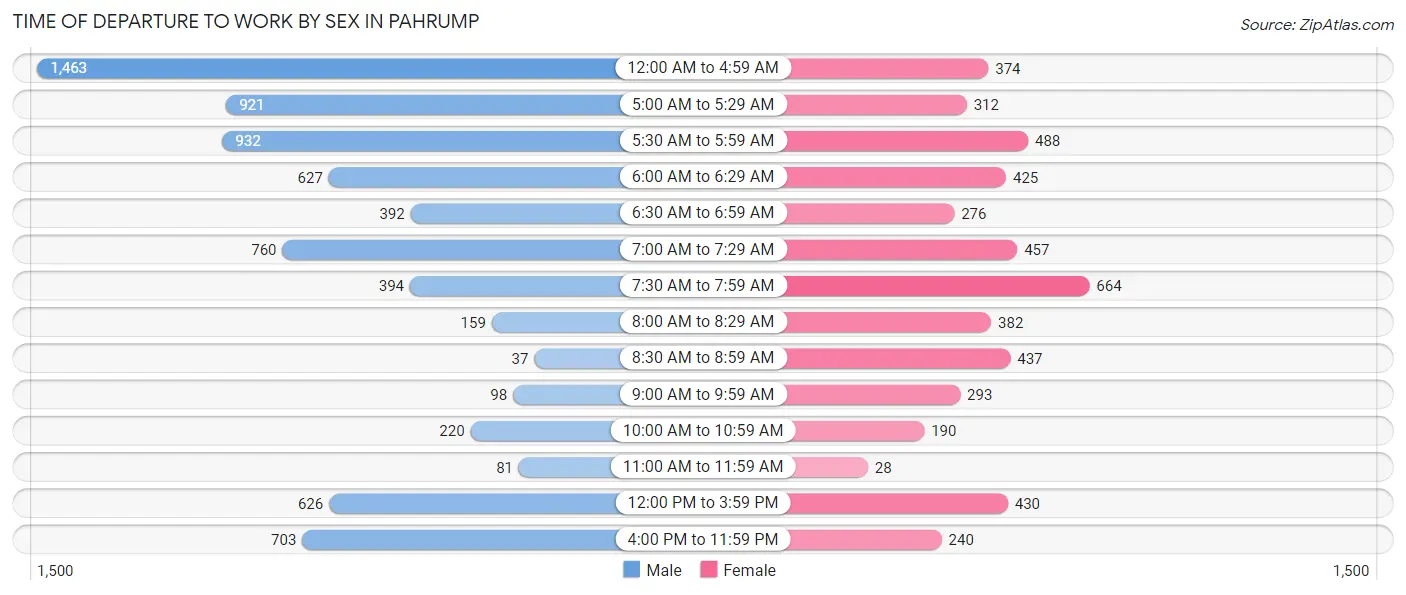
| Time of Departure | Male | Female |
| 12:00 AM to 4:59 AM | 1,463 (19.7%) | 374 (7.5%) |
| 5:00 AM to 5:29 AM | 921 (12.4%) | 312 (6.2%) |
| 5:30 AM to 5:59 AM | 932 (12.6%) | 488 (9.8%) |
| 6:00 AM to 6:29 AM | 627 (8.5%) | 425 (8.5%) |
| 6:30 AM to 6:59 AM | 392 (5.3%) | 276 (5.5%) |
| 7:00 AM to 7:29 AM | 760 (10.2%) | 457 (9.1%) |
| 7:30 AM to 7:59 AM | 394 (5.3%) | 664 (13.3%) |
| 8:00 AM to 8:29 AM | 159 (2.1%) | 382 (7.6%) |
| 8:30 AM to 8:59 AM | 37 (0.5%) | 437 (8.7%) |
| 9:00 AM to 9:59 AM | 98 (1.3%) | 293 (5.9%) |
| 10:00 AM to 10:59 AM | 220 (3.0%) | 190 (3.8%) |
| 11:00 AM to 11:59 AM | 81 (1.1%) | 28 (0.6%) |
| 12:00 PM to 3:59 PM | 626 (8.4%) | 430 (8.6%) |
| 4:00 PM to 11:59 PM | 703 (9.5%) | 240 (4.8%) |
| Total | 7,413 (100.0%) | 4,996 (100.0%) |
Housing Occupancy in Pahrump
Occupancy by Ownership in Pahrump
Of the total 18,598 dwellings in Pahrump, owner-occupied units account for 14,547 (78.2%), while renter-occupied units make up 4,051 (21.8%).
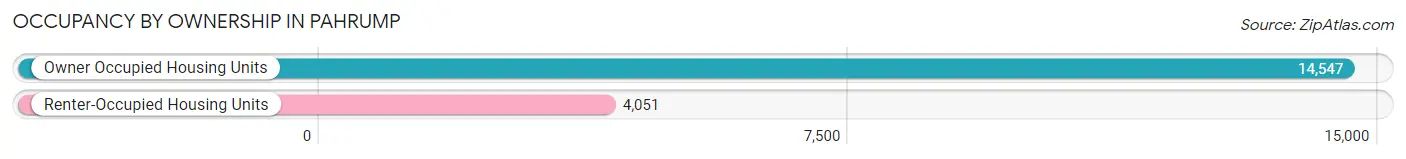
| Occupancy | # Housing Units | % Housing Units |
| Owner Occupied Housing Units | 14,547 | 78.2% |
| Renter-Occupied Housing Units | 4,051 | 21.8% |
| Total Occupied Housing Units | 18,598 | 100.0% |
Occupancy by Household Size in Pahrump
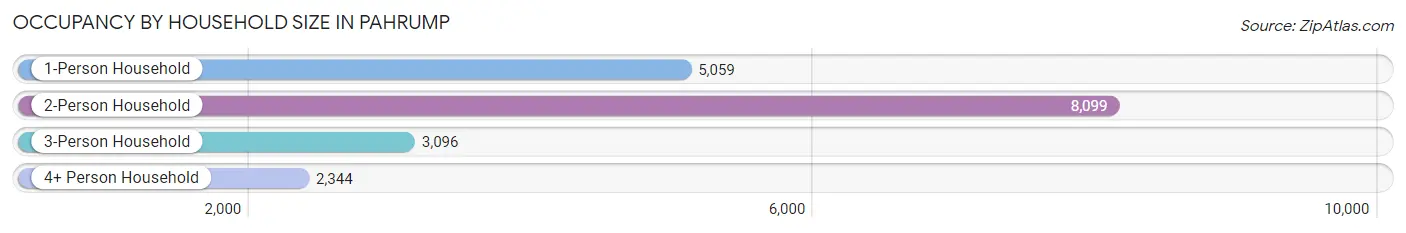
| Household Size | # Housing Units | % Housing Units |
| 1-Person Household | 5,059 | 27.2% |
| 2-Person Household | 8,099 | 43.5% |
| 3-Person Household | 3,096 | 16.7% |
| 4+ Person Household | 2,344 | 12.6% |
| Total Housing Units | 18,598 | 100.0% |
Occupancy by Ownership by Household Size in Pahrump
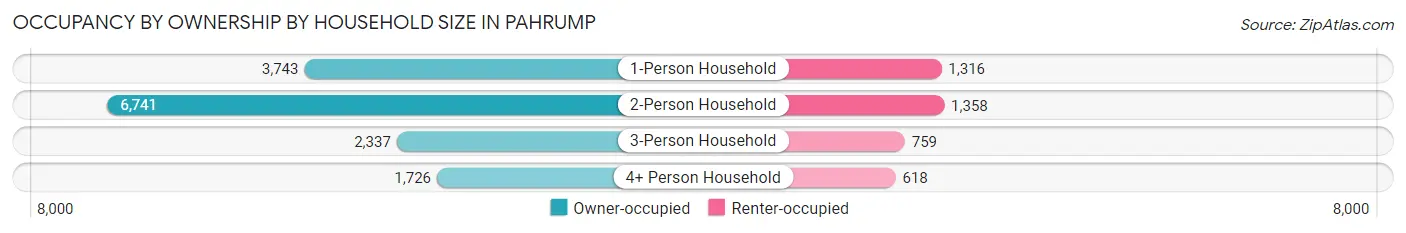
| Household Size | Owner-occupied | Renter-occupied |
| 1-Person Household | 3,743 (74.0%) | 1,316 (26.0%) |
| 2-Person Household | 6,741 (83.2%) | 1,358 (16.8%) |
| 3-Person Household | 2,337 (75.5%) | 759 (24.5%) |
| 4+ Person Household | 1,726 (73.6%) | 618 (26.4%) |
| Total Housing Units | 14,547 (78.2%) | 4,051 (21.8%) |
Occupancy by Educational Attainment in Pahrump
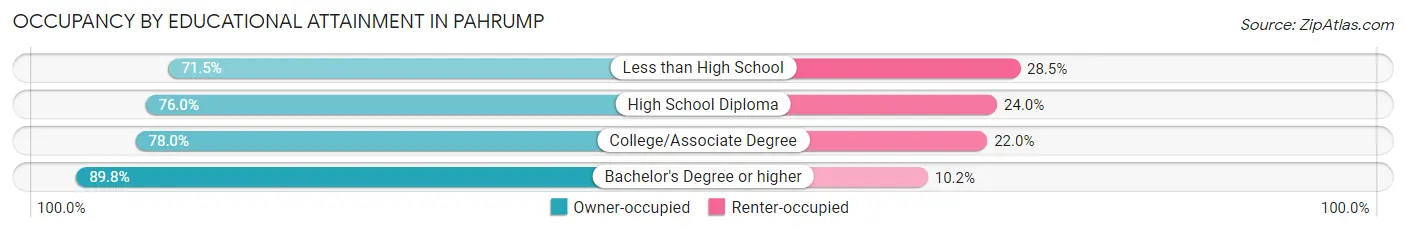
| Household Size | Owner-occupied | Renter-occupied |
| Less than High School | 1,598 (71.5%) | 638 (28.5%) |
| High School Diploma | 4,118 (76.0%) | 1,299 (24.0%) |
| College/Associate Degree | 6,578 (78.0%) | 1,857 (22.0%) |
| Bachelor's Degree or higher | 2,253 (89.8%) | 257 (10.2%) |
Occupancy by Age of Householder in Pahrump
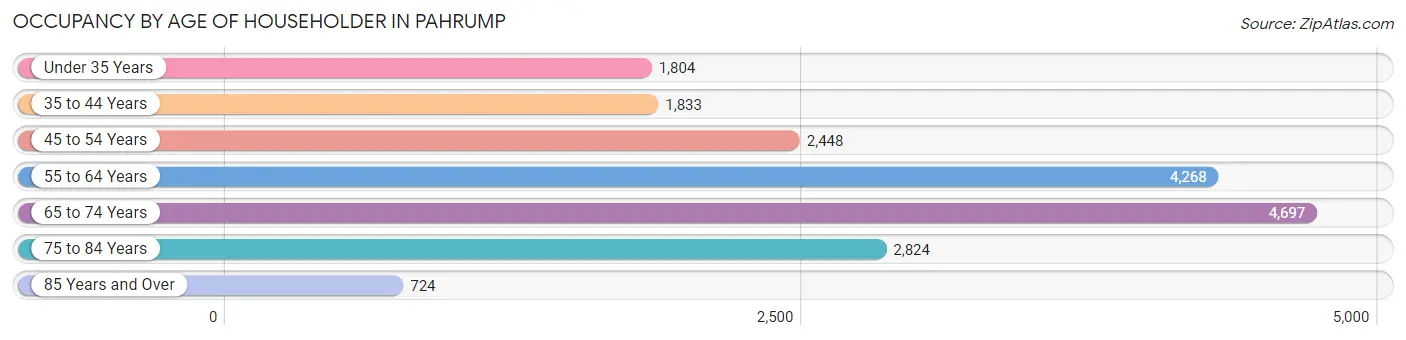
| Age Bracket | # Households | % Households |
| Under 35 Years | 1,804 | 9.7% |
| 35 to 44 Years | 1,833 | 9.9% |
| 45 to 54 Years | 2,448 | 13.2% |
| 55 to 64 Years | 4,268 | 23.0% |
| 65 to 74 Years | 4,697 | 25.3% |
| 75 to 84 Years | 2,824 | 15.2% |
| 85 Years and Over | 724 | 3.9% |
| Total | 18,598 | 100.0% |
Housing Finances in Pahrump
Median Income by Occupancy in Pahrump
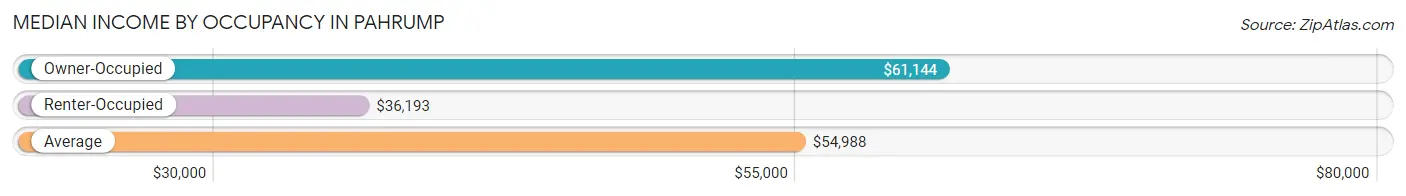
| Occupancy Type | # Households | Median Income |
| Owner-Occupied | 14,547 (78.2%) | $61,144 |
| Renter-Occupied | 4,051 (21.8%) | $36,193 |
| Average | 18,598 (100.0%) | $54,988 |
Occupancy by Householder Income Bracket in Pahrump
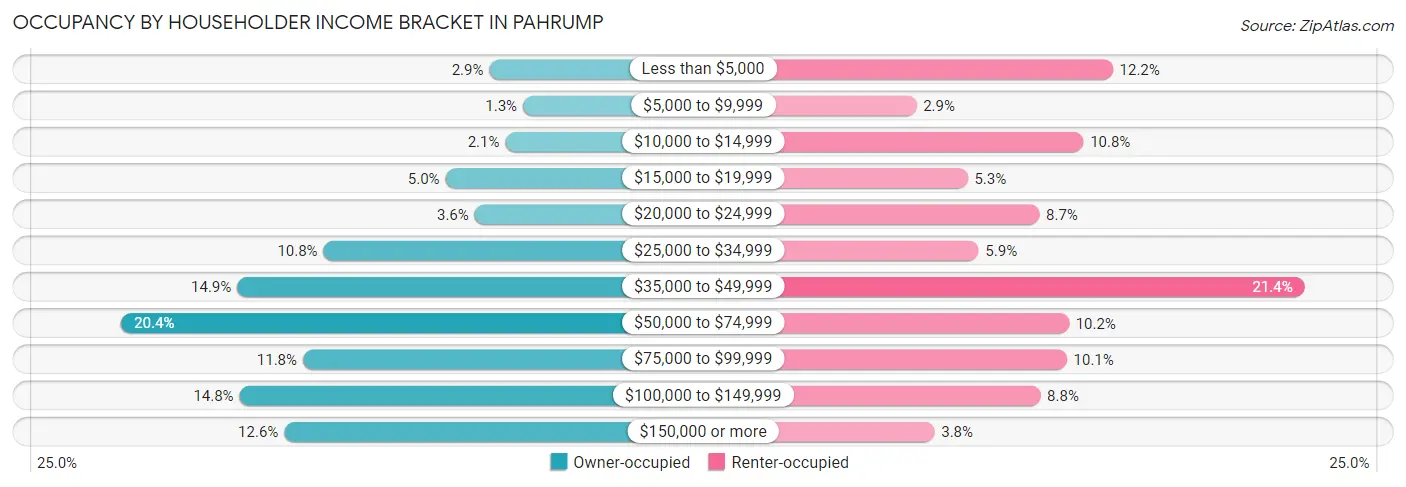
| Income Bracket | Owner-occupied | Renter-occupied |
| Less than $5,000 | 418 (2.9%) | 496 (12.2%) |
| $5,000 to $9,999 | 185 (1.3%) | 117 (2.9%) |
| $10,000 to $14,999 | 307 (2.1%) | 439 (10.8%) |
| $15,000 to $19,999 | 722 (5.0%) | 216 (5.3%) |
| $20,000 to $24,999 | 520 (3.6%) | 354 (8.7%) |
| $25,000 to $34,999 | 1,567 (10.8%) | 237 (5.9%) |
| $35,000 to $49,999 | 2,164 (14.9%) | 866 (21.4%) |
| $50,000 to $74,999 | 2,968 (20.4%) | 411 (10.2%) |
| $75,000 to $99,999 | 1,709 (11.7%) | 407 (10.1%) |
| $100,000 to $149,999 | 2,148 (14.8%) | 356 (8.8%) |
| $150,000 or more | 1,839 (12.6%) | 152 (3.7%) |
| Total | 14,547 (100.0%) | 4,051 (100.0%) |
Monthly Housing Cost Tiers in Pahrump
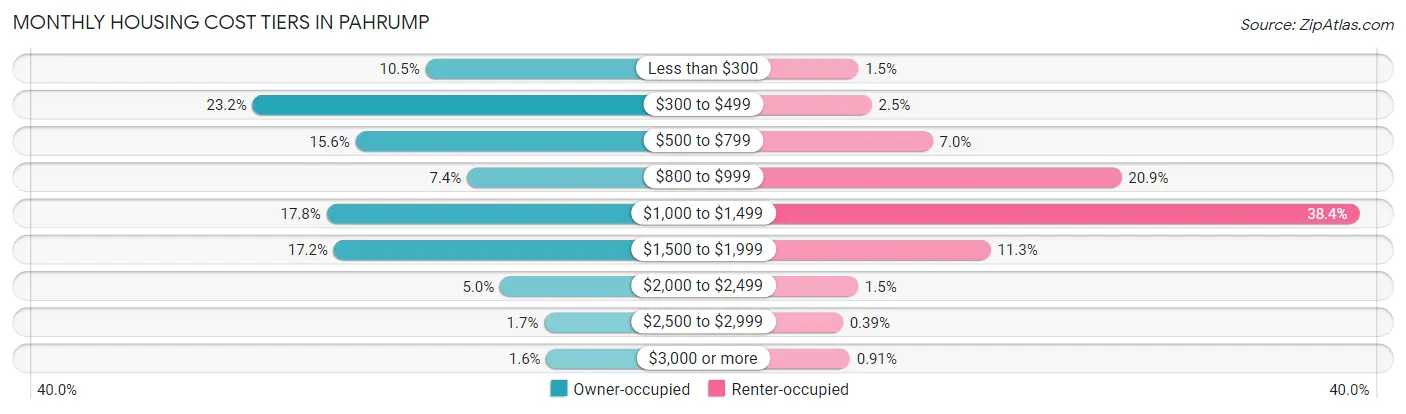
| Monthly Cost | Owner-occupied | Renter-occupied |
| Less than $300 | 1,523 (10.5%) | 62 (1.5%) |
| $300 to $499 | 3,376 (23.2%) | 102 (2.5%) |
| $500 to $799 | 2,273 (15.6%) | 284 (7.0%) |
| $800 to $999 | 1,078 (7.4%) | 847 (20.9%) |
| $1,000 to $1,499 | 2,584 (17.8%) | 1,557 (38.4%) |
| $1,500 to $1,999 | 2,507 (17.2%) | 457 (11.3%) |
| $2,000 to $2,499 | 725 (5.0%) | 61 (1.5%) |
| $2,500 to $2,999 | 252 (1.7%) | 16 (0.4%) |
| $3,000 or more | 229 (1.6%) | 37 (0.9%) |
| Total | 14,547 (100.0%) | 4,051 (100.0%) |
Physical Housing Characteristics in Pahrump
Housing Structures in Pahrump
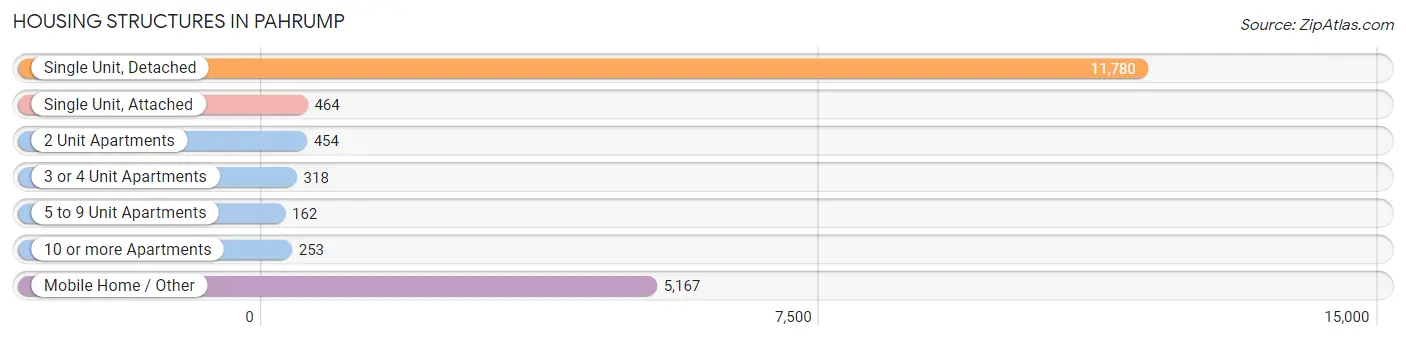
| Structure Type | # Housing Units | % Housing Units |
| Single Unit, Detached | 11,780 | 63.3% |
| Single Unit, Attached | 464 | 2.5% |
| 2 Unit Apartments | 454 | 2.4% |
| 3 or 4 Unit Apartments | 318 | 1.7% |
| 5 to 9 Unit Apartments | 162 | 0.9% |
| 10 or more Apartments | 253 | 1.4% |
| Mobile Home / Other | 5,167 | 27.8% |
| Total | 18,598 | 100.0% |
Housing Structures by Occupancy in Pahrump
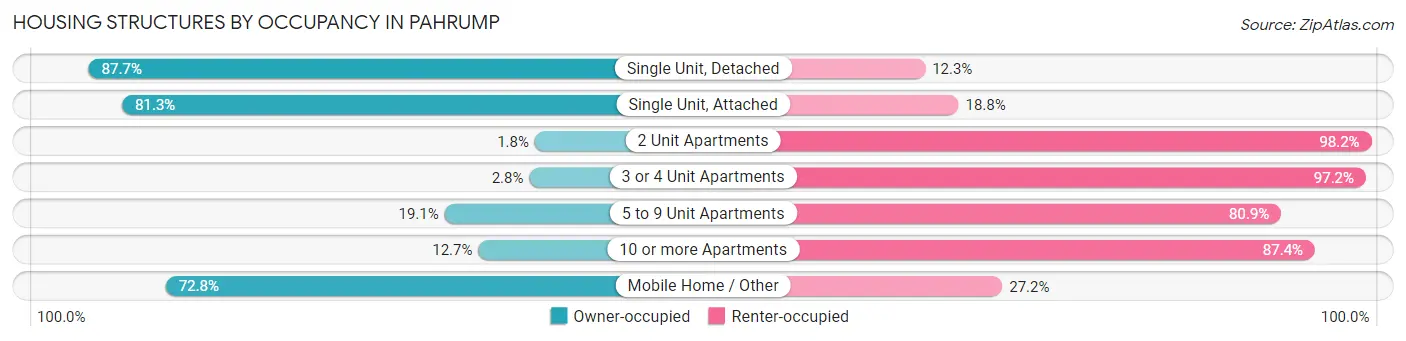
| Structure Type | Owner-occupied | Renter-occupied |
| Single Unit, Detached | 10,327 (87.7%) | 1,453 (12.3%) |
| Single Unit, Attached | 377 (81.2%) | 87 (18.8%) |
| 2 Unit Apartments | 8 (1.8%) | 446 (98.2%) |
| 3 or 4 Unit Apartments | 9 (2.8%) | 309 (97.2%) |
| 5 to 9 Unit Apartments | 31 (19.1%) | 131 (80.9%) |
| 10 or more Apartments | 32 (12.7%) | 221 (87.4%) |
| Mobile Home / Other | 3,763 (72.8%) | 1,404 (27.2%) |
| Total | 14,547 (78.2%) | 4,051 (21.8%) |
Housing Structures by Number of Rooms in Pahrump
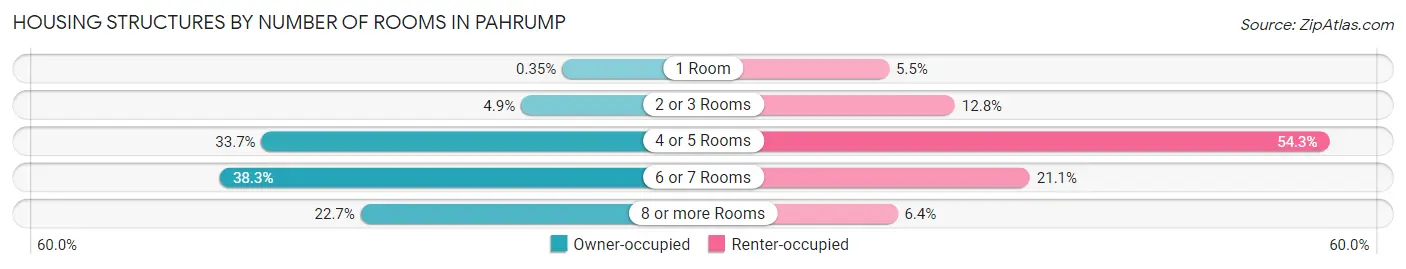
| Number of Rooms | Owner-occupied | Renter-occupied |
| 1 Room | 51 (0.4%) | 221 (5.5%) |
| 2 or 3 Rooms | 714 (4.9%) | 517 (12.8%) |
| 4 or 5 Rooms | 4,905 (33.7%) | 2,200 (54.3%) |
| 6 or 7 Rooms | 5,573 (38.3%) | 854 (21.1%) |
| 8 or more Rooms | 3,304 (22.7%) | 259 (6.4%) |
| Total | 14,547 (100.0%) | 4,051 (100.0%) |
Housing Structure by Heating Type in Pahrump
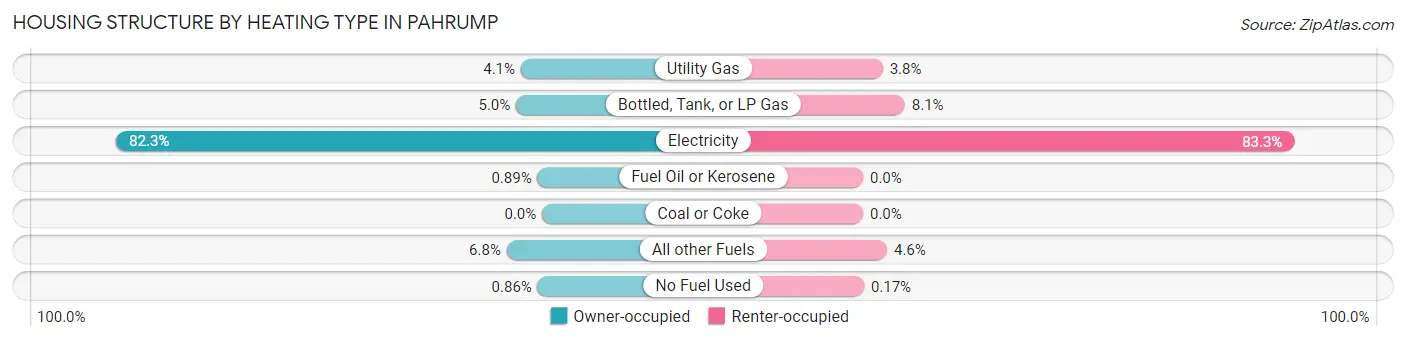
| Heating Type | Owner-occupied | Renter-occupied |
| Utility Gas | 597 (4.1%) | 154 (3.8%) |
| Bottled, Tank, or LP Gas | 730 (5.0%) | 327 (8.1%) |
| Electricity | 11,973 (82.3%) | 3,375 (83.3%) |
| Fuel Oil or Kerosene | 129 (0.9%) | 0 (0.0%) |
| Coal or Coke | 0 (0.0%) | 0 (0.0%) |
| All other Fuels | 993 (6.8%) | 188 (4.6%) |
| No Fuel Used | 125 (0.9%) | 7 (0.2%) |
| Total | 14,547 (100.0%) | 4,051 (100.0%) |
Household Vehicle Usage in Pahrump
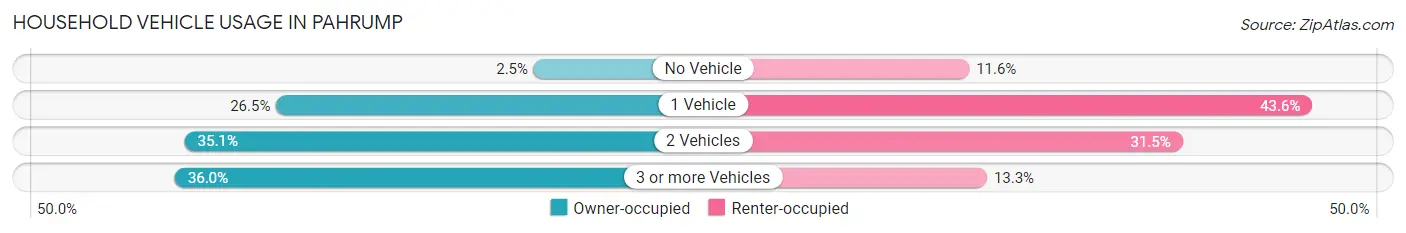
| Vehicles per Household | Owner-occupied | Renter-occupied |
| No Vehicle | 358 (2.5%) | 470 (11.6%) |
| 1 Vehicle | 3,857 (26.5%) | 1,767 (43.6%) |
| 2 Vehicles | 5,100 (35.1%) | 1,277 (31.5%) |
| 3 or more Vehicles | 5,232 (36.0%) | 537 (13.3%) |
| Total | 14,547 (100.0%) | 4,051 (100.0%) |
Real Estate & Mortgages in Pahrump
Real Estate and Mortgage Overview in Pahrump
| Characteristic | Without Mortgage | With Mortgage |
| Housing Units | 6,776 | 7,771 |
| Median Property Value | $225,500 | $270,700 |
| Median Household Income | $49,835 | $1,425 |
| Monthly Housing Costs | $395 | $199 |
| Real Estate Taxes | $1,139 | $221 |
Property Value by Mortgage Status in Pahrump
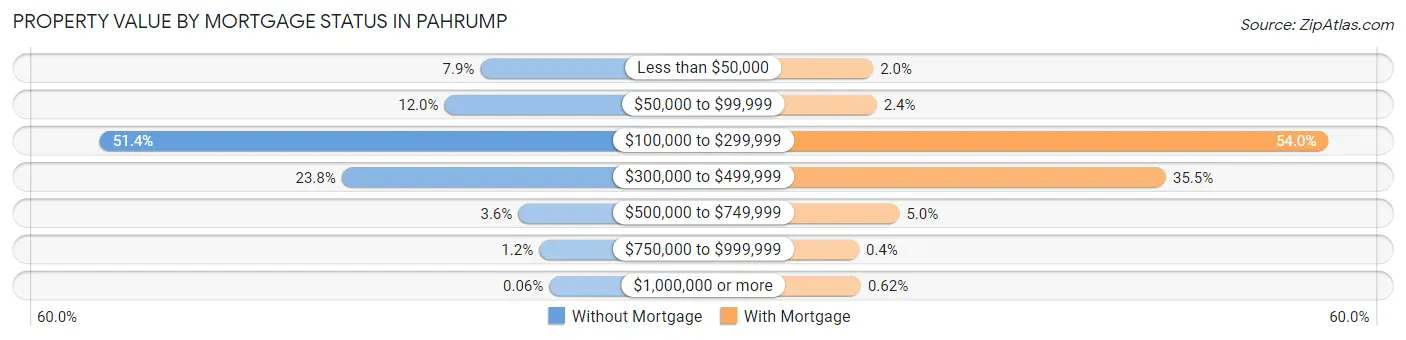
| Property Value | Without Mortgage | With Mortgage |
| Less than $50,000 | 537 (7.9%) | 157 (2.0%) |
| $50,000 to $99,999 | 816 (12.0%) | 189 (2.4%) |
| $100,000 to $299,999 | 3,482 (51.4%) | 4,198 (54.0%) |
| $300,000 to $499,999 | 1,611 (23.8%) | 2,758 (35.5%) |
| $500,000 to $749,999 | 244 (3.6%) | 390 (5.0%) |
| $750,000 to $999,999 | 82 (1.2%) | 31 (0.4%) |
| $1,000,000 or more | 4 (0.1%) | 48 (0.6%) |
| Total | 6,776 (100.0%) | 7,771 (100.0%) |
Household Income by Mortgage Status in Pahrump
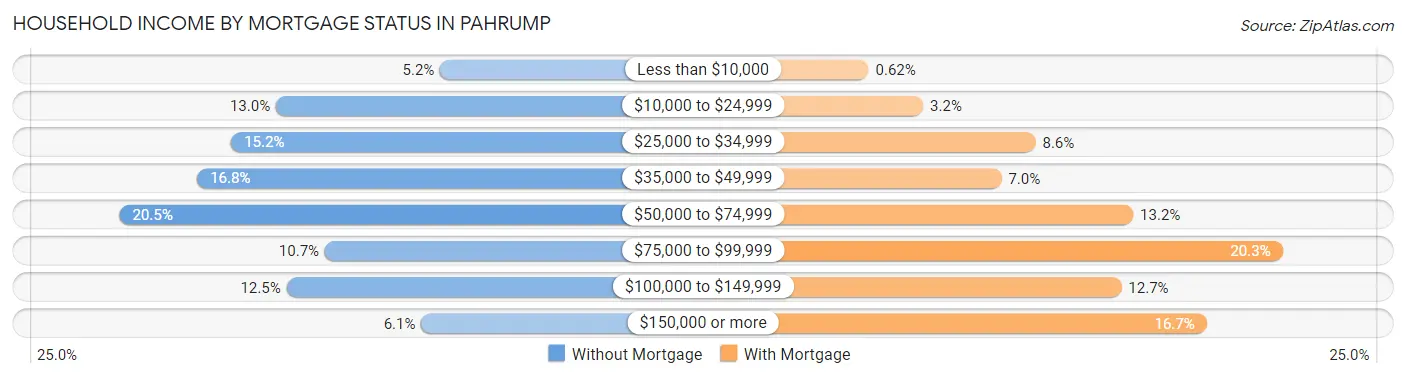
| Household Income | Without Mortgage | With Mortgage |
| Less than $10,000 | 353 (5.2%) | 48 (0.6%) |
| $10,000 to $24,999 | 883 (13.0%) | 250 (3.2%) |
| $25,000 to $34,999 | 1,027 (15.2%) | 666 (8.6%) |
| $35,000 to $49,999 | 1,137 (16.8%) | 540 (7.0%) |
| $50,000 to $74,999 | 1,388 (20.5%) | 1,027 (13.2%) |
| $75,000 to $99,999 | 725 (10.7%) | 1,580 (20.3%) |
| $100,000 to $149,999 | 849 (12.5%) | 984 (12.7%) |
| $150,000 or more | 414 (6.1%) | 1,299 (16.7%) |
| Total | 6,776 (100.0%) | 7,771 (100.0%) |
Property Value to Household Income Ratio in Pahrump
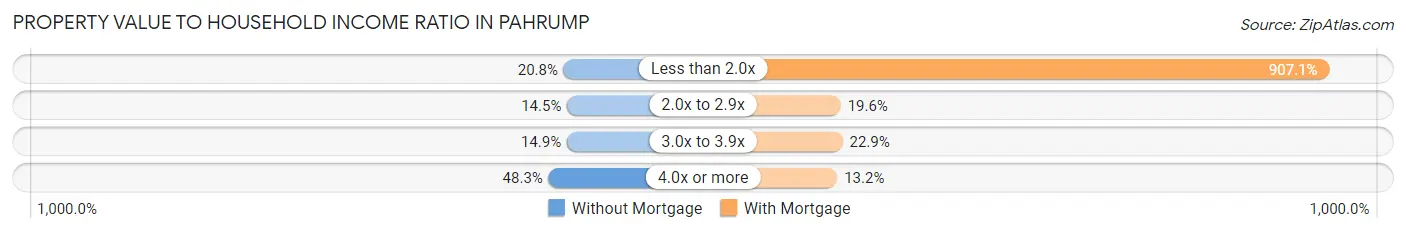
| Value-to-Income Ratio | Without Mortgage | With Mortgage |
| Less than 2.0x | 1,407 (20.8%) | 70,487 (907.0%) |
| 2.0x to 2.9x | 985 (14.5%) | 1,520 (19.6%) |
| 3.0x to 3.9x | 1,012 (14.9%) | 1,781 (22.9%) |
| 4.0x or more | 3,270 (48.3%) | 1,029 (13.2%) |
| Total | 6,776 (100.0%) | 7,771 (100.0%) |
Real Estate Taxes by Mortgage Status in Pahrump
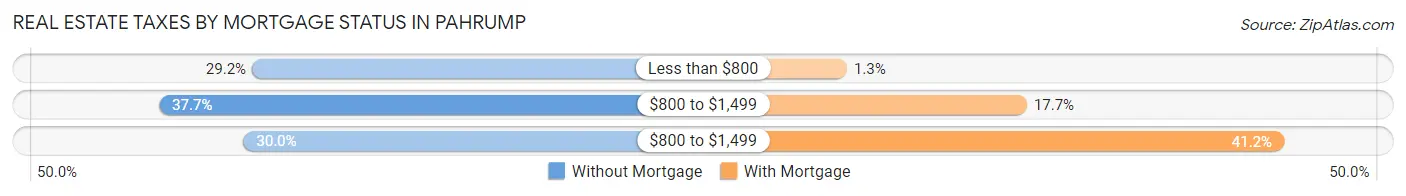
| Property Taxes | Without Mortgage | With Mortgage |
| Less than $800 | 1,981 (29.2%) | 99 (1.3%) |
| $800 to $1,499 | 2,555 (37.7%) | 1,376 (17.7%) |
| $800 to $1,499 | 2,034 (30.0%) | 3,199 (41.2%) |
| Total | 6,776 (100.0%) | 7,771 (100.0%) |
Health & Disability in Pahrump
Health Insurance Coverage by Age in Pahrump
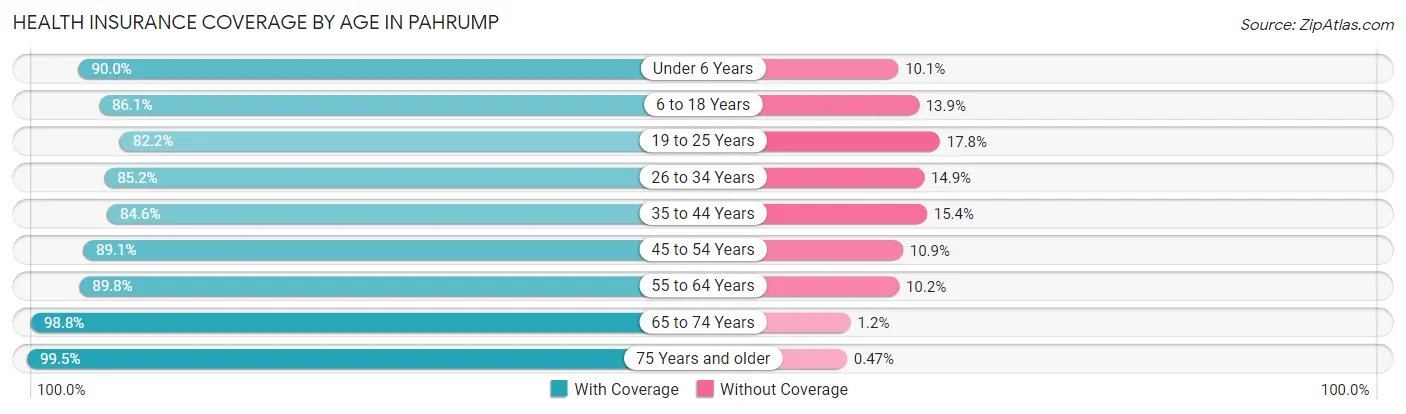
| Age Bracket | With Coverage | Without Coverage |
| Under 6 Years | 2,129 (89.9%) | 238 (10.1%) |
| 6 to 18 Years | 4,653 (86.1%) | 750 (13.9%) |
| 19 to 25 Years | 1,794 (82.2%) | 389 (17.8%) |
| 26 to 34 Years | 3,389 (85.2%) | 591 (14.8%) |
| 35 to 44 Years | 3,325 (84.6%) | 605 (15.4%) |
| 45 to 54 Years | 4,247 (89.1%) | 520 (10.9%) |
| 55 to 64 Years | 6,710 (89.8%) | 762 (10.2%) |
| 65 to 74 Years | 8,379 (98.8%) | 101 (1.2%) |
| 75 Years and older | 5,688 (99.5%) | 27 (0.5%) |
| Total | 40,314 (91.0%) | 3,983 (9.0%) |
Health Insurance Coverage by Citizenship Status in Pahrump
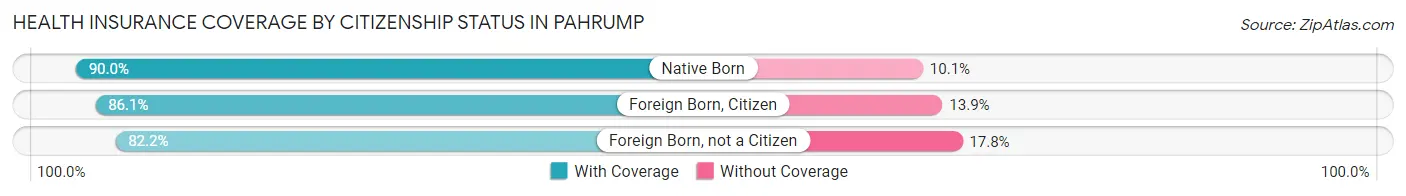
| Citizenship Status | With Coverage | Without Coverage |
| Native Born | 2,129 (89.9%) | 238 (10.1%) |
| Foreign Born, Citizen | 4,653 (86.1%) | 750 (13.9%) |
| Foreign Born, not a Citizen | 1,794 (82.2%) | 389 (17.8%) |
Health Insurance Coverage by Household Income in Pahrump
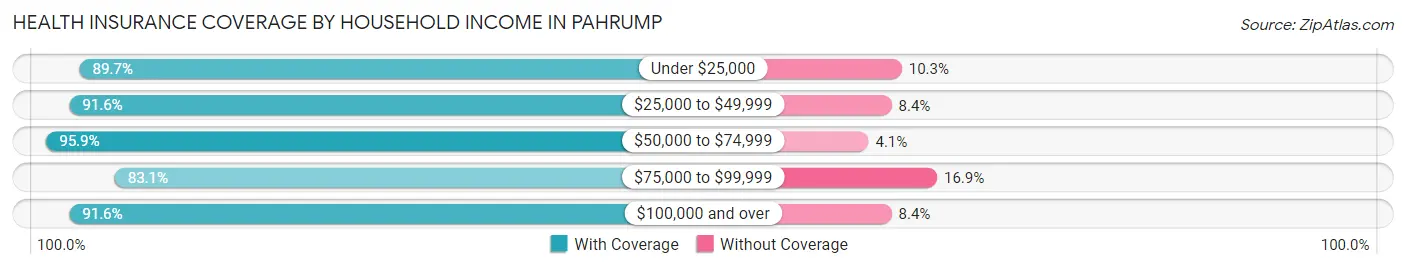
| Household Income | With Coverage | Without Coverage |
| Under $25,000 | 5,906 (89.7%) | 678 (10.3%) |
| $25,000 to $49,999 | 9,151 (91.6%) | 839 (8.4%) |
| $50,000 to $74,999 | 7,754 (95.9%) | 329 (4.1%) |
| $75,000 to $99,999 | 4,752 (83.1%) | 967 (16.9%) |
| $100,000 and over | 12,713 (91.6%) | 1,165 (8.4%) |
Public vs Private Health Insurance Coverage by Age in Pahrump
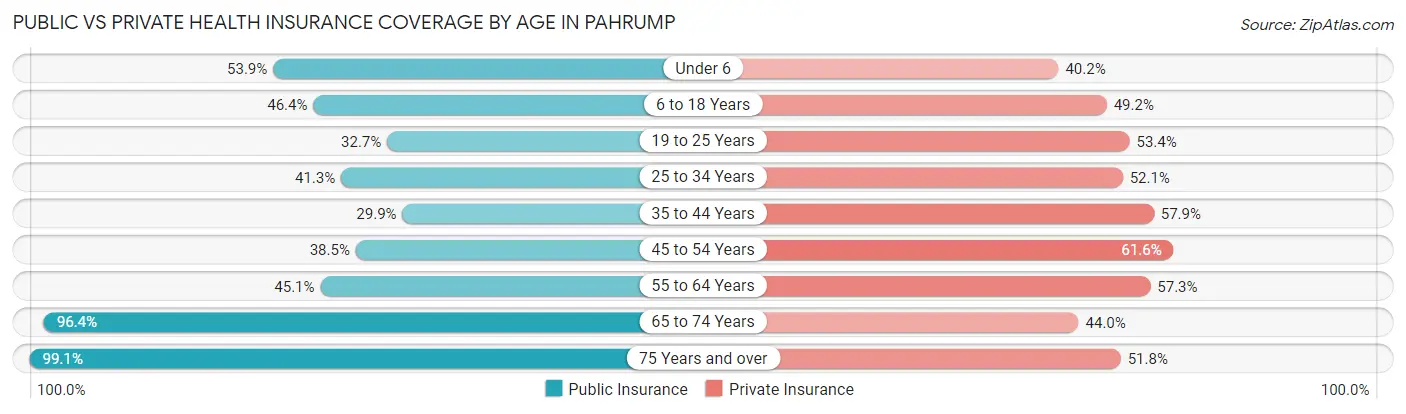
| Age Bracket | Public Insurance | Private Insurance |
| Under 6 | 1,275 (53.9%) | 952 (40.2%) |
| 6 to 18 Years | 2,508 (46.4%) | 2,657 (49.2%) |
| 19 to 25 Years | 714 (32.7%) | 1,166 (53.4%) |
| 25 to 34 Years | 1,642 (41.3%) | 2,075 (52.1%) |
| 35 to 44 Years | 1,174 (29.9%) | 2,276 (57.9%) |
| 45 to 54 Years | 1,837 (38.5%) | 2,935 (61.6%) |
| 55 to 64 Years | 3,370 (45.1%) | 4,279 (57.3%) |
| 65 to 74 Years | 8,177 (96.4%) | 3,728 (44.0%) |
| 75 Years and over | 5,662 (99.1%) | 2,959 (51.8%) |
| Total | 26,359 (59.5%) | 23,027 (52.0%) |
Disability Status by Sex by Age in Pahrump
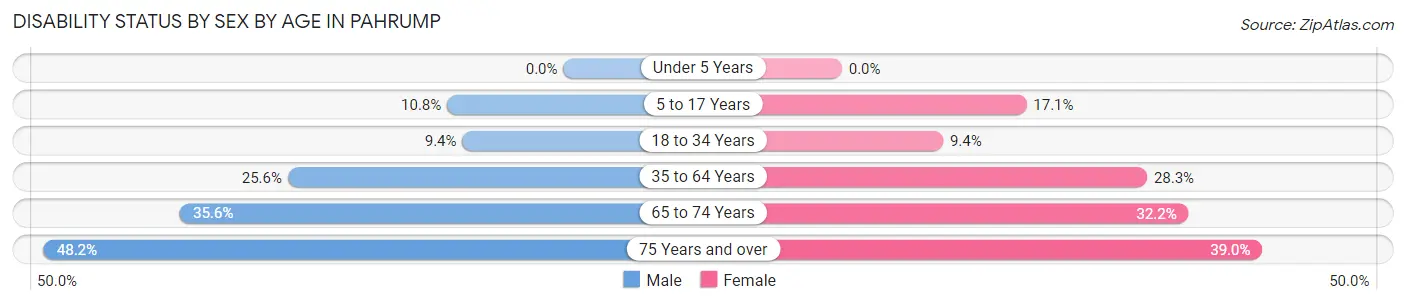
| Age Bracket | Male | Female |
| Under 5 Years | 0 (0.0%) | 0 (0.0%) |
| 5 to 17 Years | 302 (10.8%) | 489 (17.1%) |
| 18 to 34 Years | 327 (9.4%) | 269 (9.4%) |
| 35 to 64 Years | 2,059 (25.6%) | 2,299 (28.3%) |
| 65 to 74 Years | 1,479 (35.6%) | 1,391 (32.2%) |
| 75 Years and over | 1,469 (48.2%) | 1,041 (39.0%) |
Disability Class by Sex by Age in Pahrump
Disability Class: Hearing Difficulty
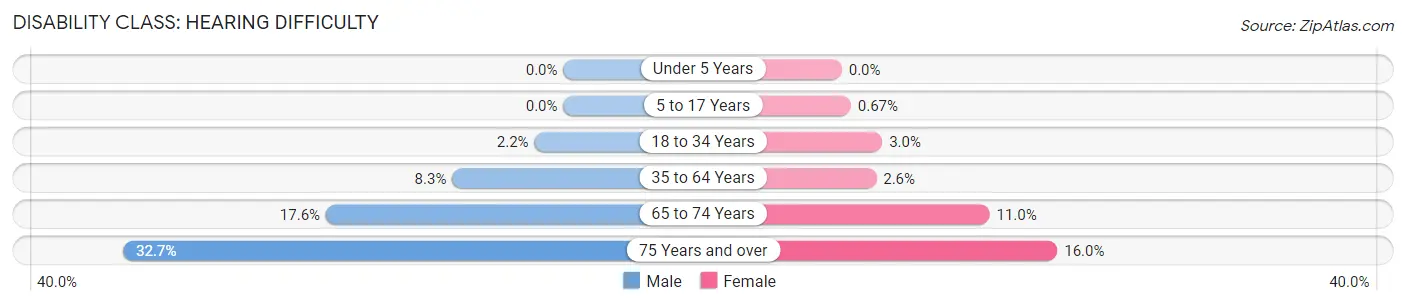
| Age Bracket | Male | Female |
| Under 5 Years | 0 (0.0%) | 0 (0.0%) |
| 5 to 17 Years | 0 (0.0%) | 19 (0.7%) |
| 18 to 34 Years | 75 (2.1%) | 86 (3.0%) |
| 35 to 64 Years | 664 (8.3%) | 208 (2.6%) |
| 65 to 74 Years | 733 (17.6%) | 474 (11.0%) |
| 75 Years and over | 996 (32.7%) | 427 (16.0%) |
Disability Class: Vision Difficulty
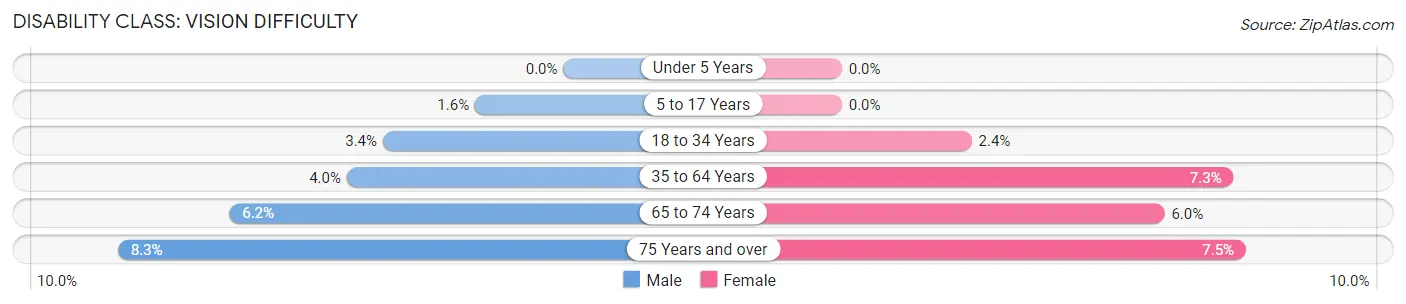
| Age Bracket | Male | Female |
| Under 5 Years | 0 (0.0%) | 0 (0.0%) |
| 5 to 17 Years | 46 (1.6%) | 0 (0.0%) |
| 18 to 34 Years | 117 (3.4%) | 69 (2.4%) |
| 35 to 64 Years | 324 (4.0%) | 590 (7.3%) |
| 65 to 74 Years | 258 (6.2%) | 259 (6.0%) |
| 75 Years and over | 252 (8.3%) | 200 (7.5%) |
Disability Class: Cognitive Difficulty
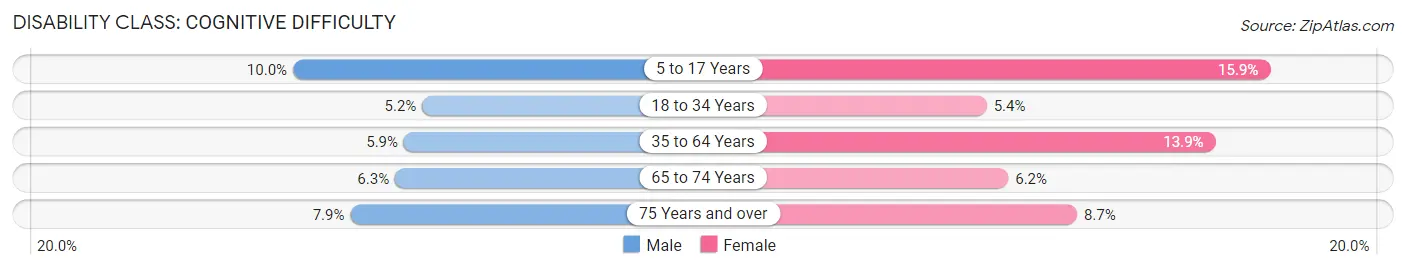
| Age Bracket | Male | Female |
| 5 to 17 Years | 281 (10.0%) | 454 (15.9%) |
| 18 to 34 Years | 183 (5.2%) | 154 (5.4%) |
| 35 to 64 Years | 477 (5.9%) | 1,126 (13.9%) |
| 65 to 74 Years | 260 (6.2%) | 267 (6.2%) |
| 75 Years and over | 241 (7.9%) | 233 (8.7%) |
Disability Class: Ambulatory Difficulty
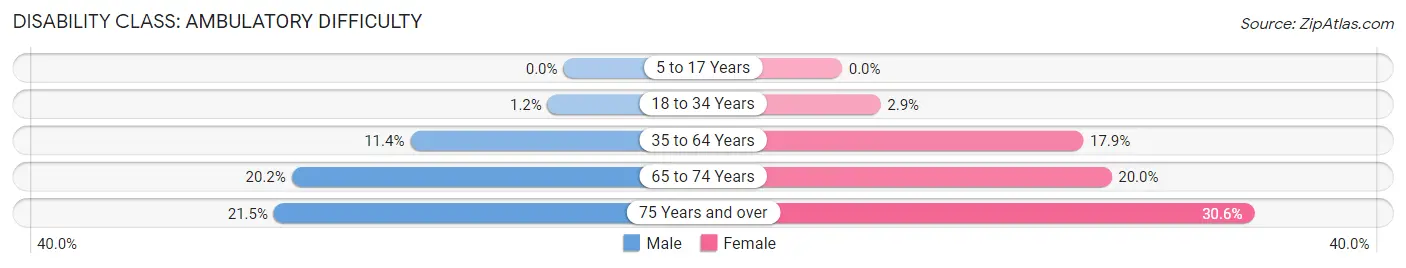
| Age Bracket | Male | Female |
| 5 to 17 Years | 0 (0.0%) | 0 (0.0%) |
| 18 to 34 Years | 41 (1.2%) | 82 (2.9%) |
| 35 to 64 Years | 915 (11.4%) | 1,454 (17.9%) |
| 65 to 74 Years | 839 (20.2%) | 865 (20.0%) |
| 75 Years and over | 655 (21.5%) | 817 (30.6%) |
Disability Class: Self-Care Difficulty
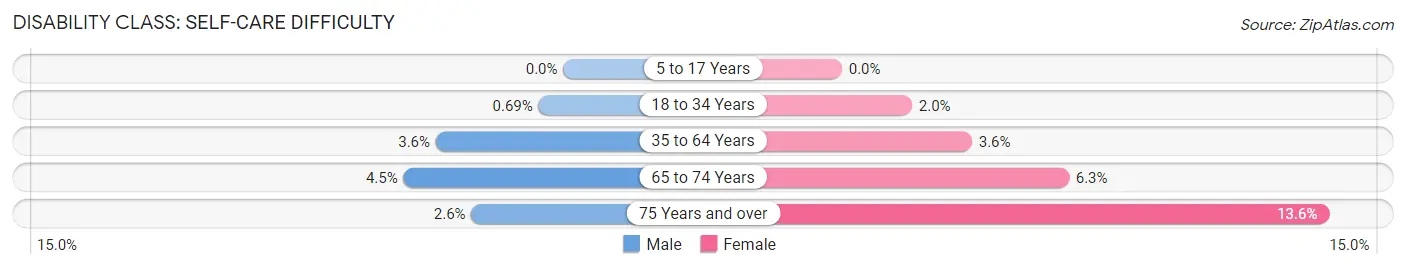
| Age Bracket | Male | Female |
| 5 to 17 Years | 0 (0.0%) | 0 (0.0%) |
| 18 to 34 Years | 24 (0.7%) | 56 (1.9%) |
| 35 to 64 Years | 286 (3.5%) | 294 (3.6%) |
| 65 to 74 Years | 185 (4.4%) | 273 (6.3%) |
| 75 Years and over | 78 (2.6%) | 362 (13.6%) |
Technology Access in Pahrump
Computing Device Access in Pahrump
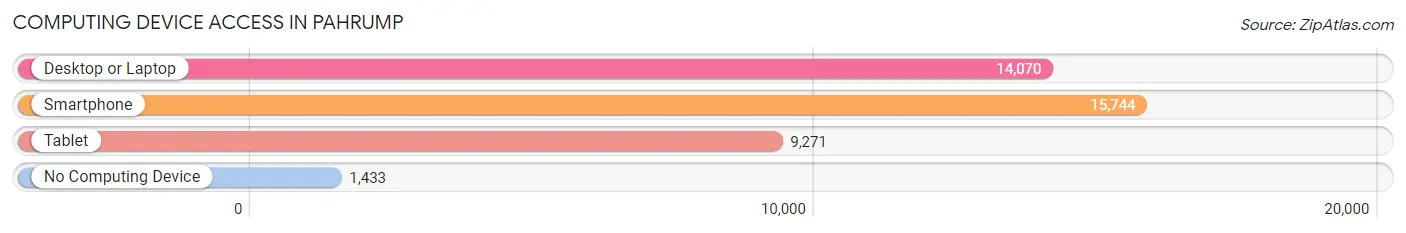
| Device Type | # Households | % Households |
| Desktop or Laptop | 14,070 | 75.6% |
| Smartphone | 15,744 | 84.7% |
| Tablet | 9,271 | 49.8% |
| No Computing Device | 1,433 | 7.7% |
| Total | 18,598 | 100.0% |
Internet Access in Pahrump
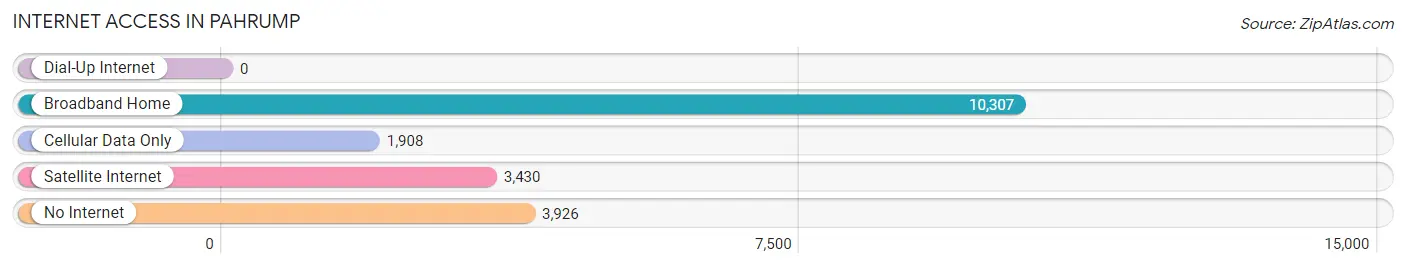
| Internet Type | # Households | % Households |
| Dial-Up Internet | 0 | 0.0% |
| Broadband Home | 10,307 | 55.4% |
| Cellular Data Only | 1,908 | 10.3% |
| Satellite Internet | 3,430 | 18.4% |
| No Internet | 3,926 | 21.1% |
| Total | 18,598 | 100.0% |
Pahrump Summary
Pahrump is a small town located in Nye County, Nevada, United States. It is situated in the Mojave Desert, approximately 60 miles west of Las Vegas. The town is home to approximately 36,000 people, making it the largest town in Nye County.
History
The area that is now Pahrump was originally inhabited by the Southern Paiute people. The first non-native settlers arrived in the area in the late 19th century, and the town was officially founded in 1951. The name Pahrump is derived from the Southern Paiute word for “water rock”, referring to the abundant natural springs in the area.
In the 1950s, the town began to grow rapidly as a result of the construction of the nearby Nevada Test Site. The test site was used for nuclear weapons testing from 1951 to 1992, and the town’s population grew to over 10,000 by the early 1960s.
In the late 1960s, the town began to attract retirees and other people looking for a quiet place to live. This influx of new residents led to the construction of several new housing developments and the establishment of a number of businesses.
Geography
Pahrump is located in the Mojave Desert, approximately 60 miles west of Las Vegas. The town is situated at an elevation of 2,500 feet, and the surrounding area is characterized by rugged mountains and dry lake beds. The climate is arid, with hot summers and mild winters.
Economy
The economy of Pahrump is largely based on tourism and retirement. The town is home to several casinos, golf courses, and other tourist attractions. The nearby Nevada Test Site also provides employment opportunities for many residents.
In addition, the town is home to a number of small businesses, including restaurants, retail stores, and service providers. The town also has a growing wine industry, with several wineries located in the area.
Demographics
As of the 2010 census, the population of Pahrump was 36,441. The racial makeup of the town was 79.3% White, 5.2% African American, 0.7% Native American, 1.2% Asian, 0.2% Pacific Islander, and 11.6% from other races. Hispanic or Latino of any race were 24.3% of the population.
The median household income in Pahrump was $45,813, and the median family income was $50,919. The per capita income was $21,945. About 11.2% of families and 14.3% of the population were below the poverty line, including 19.2% of those under age 18 and 8.2% of those age 65 or over.
Pahrump is a small town with a unique history and culture. The town is home to a diverse population, and the economy is largely based on tourism and retirement. The town is also home to a growing wine industry, and the nearby Nevada Test Site provides employment opportunities for many residents.
Common Questions
What is Per Capita Income in Pahrump?
Per Capita income in Pahrump is $30,801.
What is the Median Family Income in Pahrump?
Median Family Income in Pahrump is $65,032.
What is the Median Household income in Pahrump?
Median Household Income in Pahrump is $54,988.
What is Income or Wage Gap in Pahrump?
Income or Wage Gap in Pahrump is 25.5%.
Women in Pahrump earn 74.5 cents for every dollar earned by a man.
What is Inequality or Gini Index in Pahrump?
Inequality or Gini Index in Pahrump is 0.44.
What is the Total Population of Pahrump?
Total Population of Pahrump is 44,711.
What is the Total Male Population of Pahrump?
Total Male Population of Pahrump is 22,623.
What is the Total Female Population of Pahrump?
Total Female Population of Pahrump is 22,088.
What is the Ratio of Males per 100 Females in Pahrump?
There are 102.42 Males per 100 Females in Pahrump.
What is the Ratio of Females per 100 Males in Pahrump?
There are 97.64 Females per 100 Males in Pahrump.
What is the Median Population Age in Pahrump?
Median Population Age in Pahrump is 53.7 Years.
What is the Average Family Size in Pahrump
Average Family Size in Pahrump is 2.8 People.
What is the Average Household Size in Pahrump
Average Household Size in Pahrump is 2.4 People.
How Large is the Labor Force in Pahrump?
There are 15,354 People in the Labor Forcein in Pahrump.
What is the Percentage of People in the Labor Force in Pahrump?
40.2% of People are in the Labor Force in Pahrump.
What is the Unemployment Rate in Pahrump?
Unemployment Rate in Pahrump is 10.2%.