Wadsworth, NV Map & Demographics
Wadsworth Map
Wadsworth Overview
$25,951
PER CAPITA INCOME
$67,917
AVG FAMILY INCOME
$60,500
AVG HOUSEHOLD INCOME
36.6%
WAGE / INCOME GAP [ % ]
63.4¢/ $1
WAGE / INCOME GAP [ $ ]
0.42
INEQUALITY / GINI INDEX
716
TOTAL POPULATION
382
MALE POPULATION
334
FEMALE POPULATION
114.37
MALES / 100 FEMALES
87.43
FEMALES / 100 MALES
43.7
MEDIAN AGE
3.0
AVG FAMILY SIZE
2.7
AVG HOUSEHOLD SIZE
379
LABOR FORCE [ PEOPLE ]
63.4%
PERCENT IN LABOR FORCE
11.1%
UNEMPLOYMENT RATE
Wadsworth Zip Codes
Wadsworth Area Codes
Income in Wadsworth
Income Overview in Wadsworth
Per Capita Income in Wadsworth is $25,951, while median incomes of families and households are $67,917 and $60,500 respectively.
| Characteristic | Number | Measure |
| Per Capita Income | 716 | $25,951 |
| Median Family Income | 184 | $67,917 |
| Mean Family Income | 184 | $73,405 |
| Median Household Income | 258 | $60,500 |
| Mean Household Income | 258 | $68,633 |
| Income Deficit | 184 | $0 |
| Wage / Income Gap (%) | 716 | 36.59% |
| Wage / Income Gap ($) | 716 | 63.41¢ per $1 |
| Gini / Inequality Index | 716 | 0.42 |
Earnings by Sex in Wadsworth
Average Earnings in Wadsworth are $34,583, $45,096 for men and $28,594 for women, a difference of 36.6%.
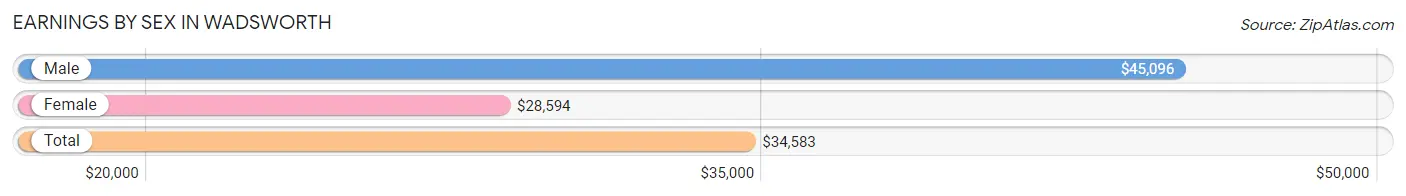
| Sex | Number | Average Earnings |
| Male | 219 (58.6%) | $45,096 |
| Female | 155 (41.4%) | $28,594 |
| Total | 374 (100.0%) | $34,583 |
Earnings by Sex by Income Bracket in Wadsworth
The most common earnings brackets in Wadsworth are $55,000 to $64,999 for men (48 | 21.9%) and $30,000 to $34,999 for women (21 | 13.6%).
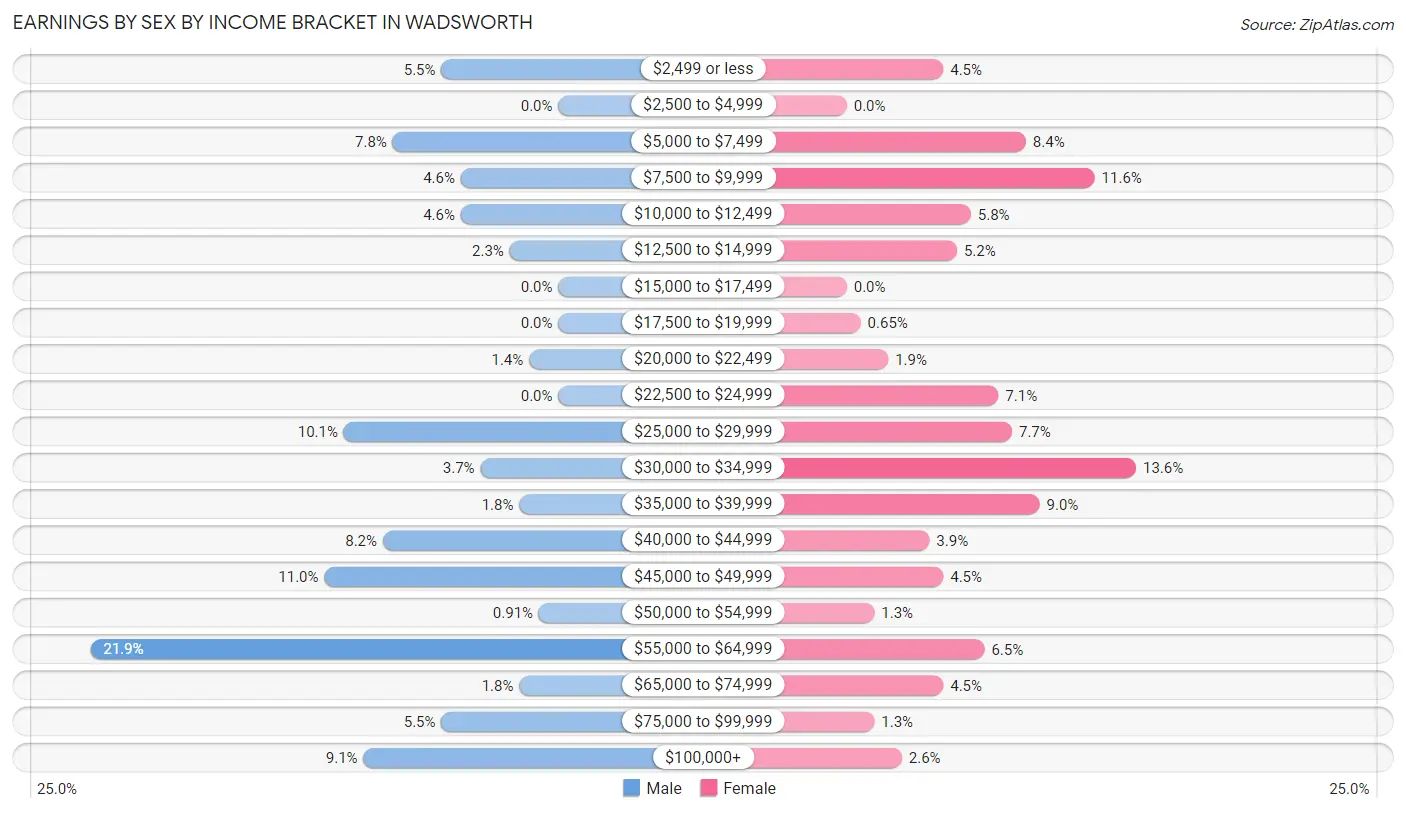
| Income | Male | Female |
| $2,499 or less | 12 (5.5%) | 7 (4.5%) |
| $2,500 to $4,999 | 0 (0.0%) | 0 (0.0%) |
| $5,000 to $7,499 | 17 (7.8%) | 13 (8.4%) |
| $7,500 to $9,999 | 10 (4.6%) | 18 (11.6%) |
| $10,000 to $12,499 | 10 (4.6%) | 9 (5.8%) |
| $12,500 to $14,999 | 5 (2.3%) | 8 (5.2%) |
| $15,000 to $17,499 | 0 (0.0%) | 0 (0.0%) |
| $17,500 to $19,999 | 0 (0.0%) | 1 (0.6%) |
| $20,000 to $22,499 | 3 (1.4%) | 3 (1.9%) |
| $22,500 to $24,999 | 0 (0.0%) | 11 (7.1%) |
| $25,000 to $29,999 | 22 (10.1%) | 12 (7.7%) |
| $30,000 to $34,999 | 8 (3.6%) | 21 (13.6%) |
| $35,000 to $39,999 | 4 (1.8%) | 14 (9.0%) |
| $40,000 to $44,999 | 18 (8.2%) | 6 (3.9%) |
| $45,000 to $49,999 | 24 (11.0%) | 7 (4.5%) |
| $50,000 to $54,999 | 2 (0.9%) | 2 (1.3%) |
| $55,000 to $64,999 | 48 (21.9%) | 10 (6.5%) |
| $65,000 to $74,999 | 4 (1.8%) | 7 (4.5%) |
| $75,000 to $99,999 | 12 (5.5%) | 2 (1.3%) |
| $100,000+ | 20 (9.1%) | 4 (2.6%) |
| Total | 219 (100.0%) | 155 (100.0%) |
Earnings by Sex by Educational Attainment in Wadsworth
Average earnings in Wadsworth are $47,212 for men and $30,750 for women, a difference of 34.9%. Men with an educational attainment of college or associate's degree enjoy the highest average annual earnings of $56,406, while those with high school diploma education earn the least with $44,063. Women with an educational attainment of college or associate's degree earn the most with the average annual earnings of $33,750, while those with high school diploma education have the smallest earnings of $24,688.
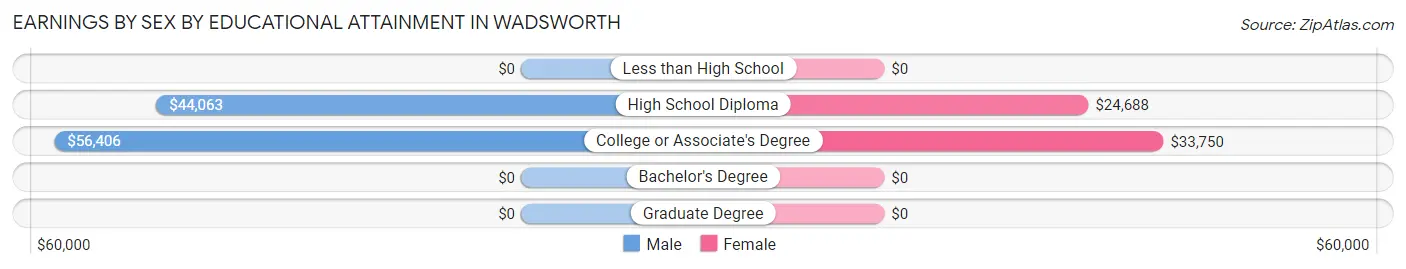
| Educational Attainment | Male Income | Female Income |
| Less than High School | - | - |
| High School Diploma | $44,063 | $24,688 |
| College or Associate's Degree | $56,406 | $33,750 |
| Bachelor's Degree | - | - |
| Graduate Degree | - | - |
| Total | $47,212 | $30,750 |
Family Income in Wadsworth
Family Income Brackets in Wadsworth
According to the Wadsworth family income data, there are 42 families falling into the $50,000 to $74,999 income range, which is the most common income bracket and makes up 22.8% of all families. Conversely, the $10,000 to $14,999 income bracket is the least frequent group with only 3 families (1.6%) belonging to this category.
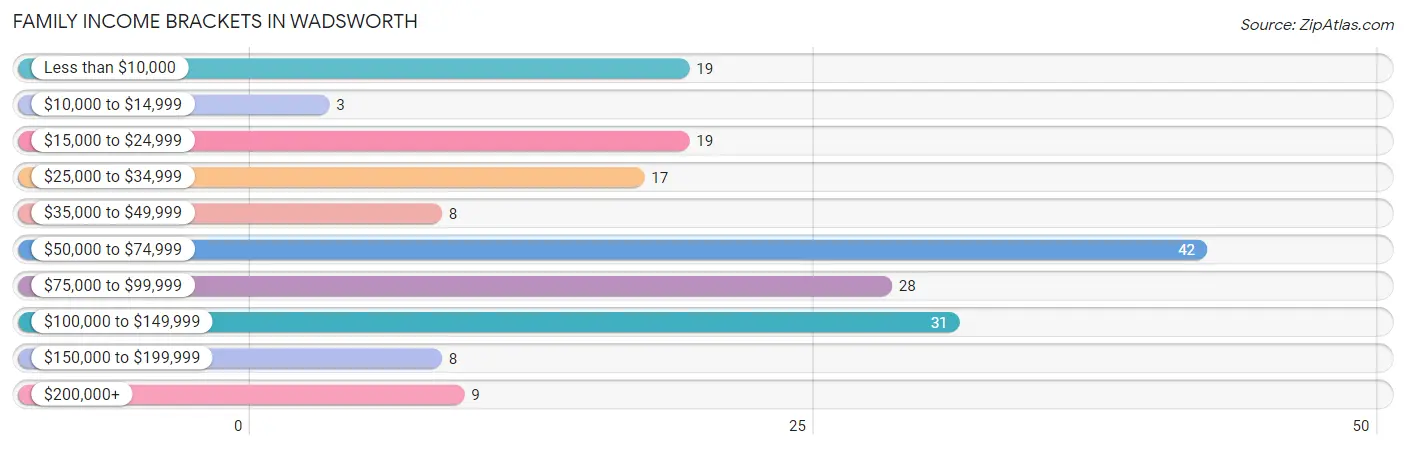
| Income Bracket | # Families | % Families |
| Less than $10,000 | 19 | 10.3% |
| $10,000 to $14,999 | 3 | 1.6% |
| $15,000 to $24,999 | 19 | 10.3% |
| $25,000 to $34,999 | 17 | 9.2% |
| $35,000 to $49,999 | 8 | 4.3% |
| $50,000 to $74,999 | 42 | 22.8% |
| $75,000 to $99,999 | 28 | 15.2% |
| $100,000 to $149,999 | 31 | 16.8% |
| $150,000 to $199,999 | 8 | 4.3% |
| $200,000+ | 9 | 4.9% |
Family Income by Famaliy Size in Wadsworth
4-person families (26 | 14.1%) account for the highest median family income in Wadsworth with $93,333 per family, while 2-person families (101 | 54.9%) have the highest median income of $23,594 per family member.
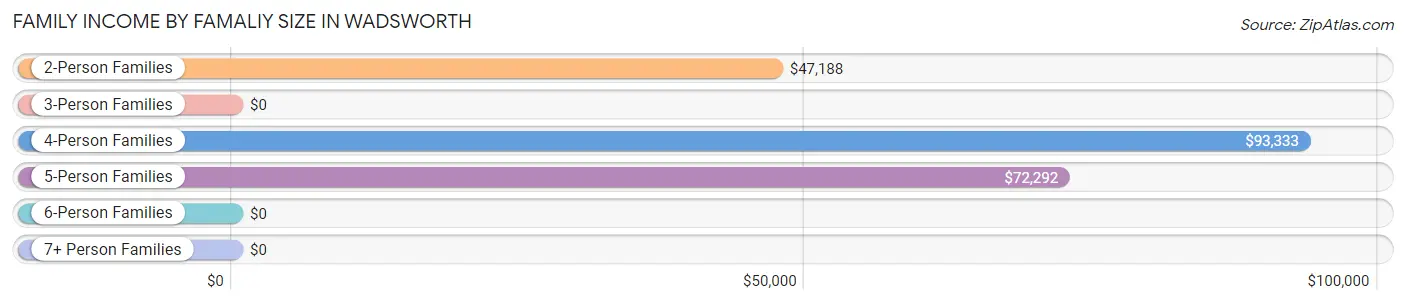
| Income Bracket | # Families | Median Income |
| 2-Person Families | 101 (54.9%) | $47,188 |
| 3-Person Families | 25 (13.6%) | $0 |
| 4-Person Families | 26 (14.1%) | $93,333 |
| 5-Person Families | 19 (10.3%) | $72,292 |
| 6-Person Families | 13 (7.1%) | $0 |
| 7+ Person Families | 0 (0.0%) | $0 |
| Total | 184 (100.0%) | $67,917 |
Family Income by Number of Earners in Wadsworth
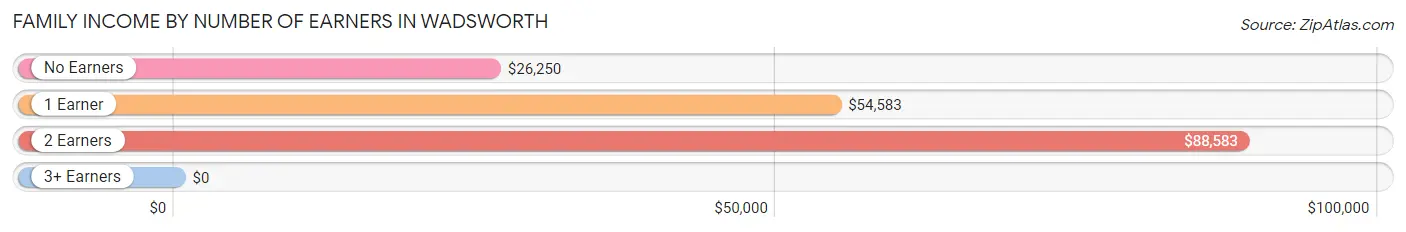
| Number of Earners | # Families | Median Income |
| No Earners | 36 (19.6%) | $26,250 |
| 1 Earner | 57 (31.0%) | $54,583 |
| 2 Earners | 77 (41.8%) | $88,583 |
| 3+ Earners | 14 (7.6%) | $0 |
| Total | 184 (100.0%) | $67,917 |
Household Income in Wadsworth
Household Income Brackets in Wadsworth
With 57 households falling in the category, the $50,000 to $74,999 income range is the most frequent in Wadsworth, accounting for 22.1% of all households. In contrast, only 8 households (3.1%) fall into the $150,000 to $199,999 income bracket, making it the least populous group.
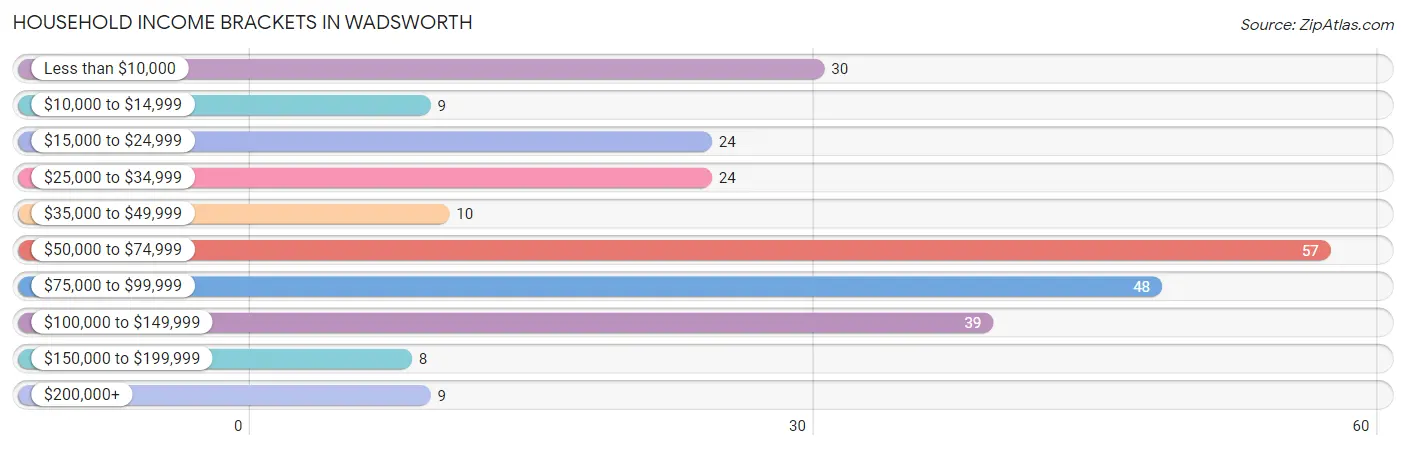
| Income Bracket | # Households | % Households |
| Less than $10,000 | 30 | 11.6% |
| $10,000 to $14,999 | 9 | 3.5% |
| $15,000 to $24,999 | 24 | 9.3% |
| $25,000 to $34,999 | 24 | 9.3% |
| $35,000 to $49,999 | 10 | 3.9% |
| $50,000 to $74,999 | 57 | 22.1% |
| $75,000 to $99,999 | 48 | 18.6% |
| $100,000 to $149,999 | 39 | 15.1% |
| $150,000 to $199,999 | 8 | 3.1% |
| $200,000+ | 9 | 3.5% |
Household Income by Householder Age in Wadsworth
The median household income in Wadsworth is $60,500, with the highest median household income of $88,654 found in the 15 to 24 years age bracket for the primary householder. A total of 30 households (11.6%) fall into this category. Meanwhile, the 65+ years age bracket for the primary householder has the lowest median household income of $30,781, with 55 households (21.3%) in this group.
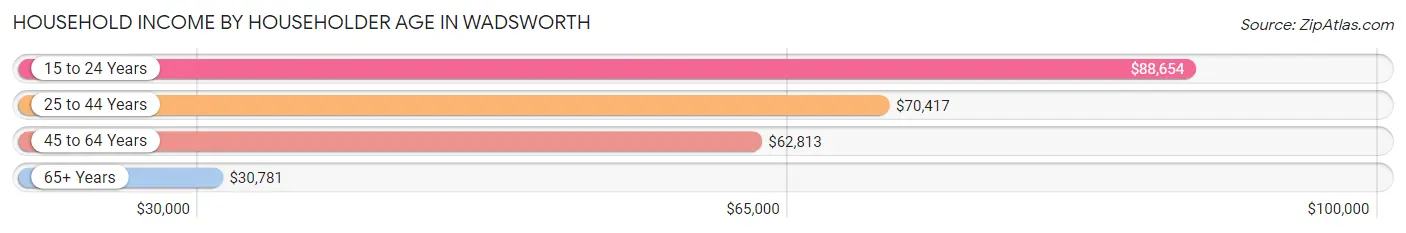
| Income Bracket | # Households | Median Income |
| 15 to 24 Years | 30 (11.6%) | $88,654 |
| 25 to 44 Years | 34 (13.2%) | $70,417 |
| 45 to 64 Years | 139 (53.9%) | $62,813 |
| 65+ Years | 55 (21.3%) | $30,781 |
| Total | 258 (100.0%) | $60,500 |
Poverty in Wadsworth
Income Below Poverty by Sex and Age in Wadsworth
With 14.9% poverty level for males and 27.3% for females among the residents of Wadsworth, 35 to 44 year old males and 12 to 14 year old females are the most vulnerable to poverty, with 9 males (45.0%) and 3 females (100.0%) in their respective age groups living below the poverty level.
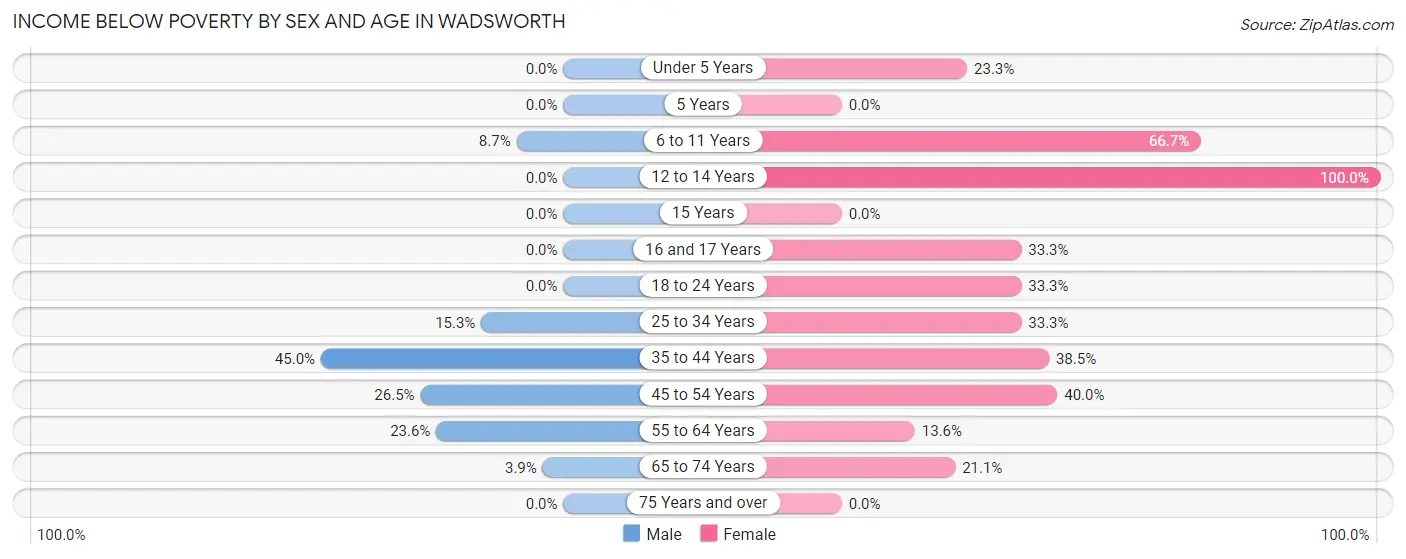
| Age Bracket | Male | Female |
| Under 5 Years | 0 (0.0%) | 10 (23.3%) |
| 5 Years | 0 (0.0%) | 0 (0.0%) |
| 6 to 11 Years | 4 (8.7%) | 4 (66.7%) |
| 12 to 14 Years | 0 (0.0%) | 3 (100.0%) |
| 15 Years | 0 (0.0%) | 0 (0.0%) |
| 16 and 17 Years | 0 (0.0%) | 3 (33.3%) |
| 18 to 24 Years | 0 (0.0%) | 18 (33.3%) |
| 25 to 34 Years | 9 (15.2%) | 9 (33.3%) |
| 35 to 44 Years | 9 (45.0%) | 10 (38.5%) |
| 45 to 54 Years | 13 (26.5%) | 18 (40.0%) |
| 55 to 64 Years | 21 (23.6%) | 8 (13.6%) |
| 65 to 74 Years | 1 (3.8%) | 8 (21.0%) |
| 75 Years and over | 0 (0.0%) | 0 (0.0%) |
| Total | 57 (14.9%) | 91 (27.3%) |
Income Above Poverty by Sex and Age in Wadsworth
According to the poverty statistics in Wadsworth, males aged under 5 years and females aged 75 years and over are the age groups that are most secure financially, with 100.0% of males and 100.0% of females in these age groups living above the poverty line.
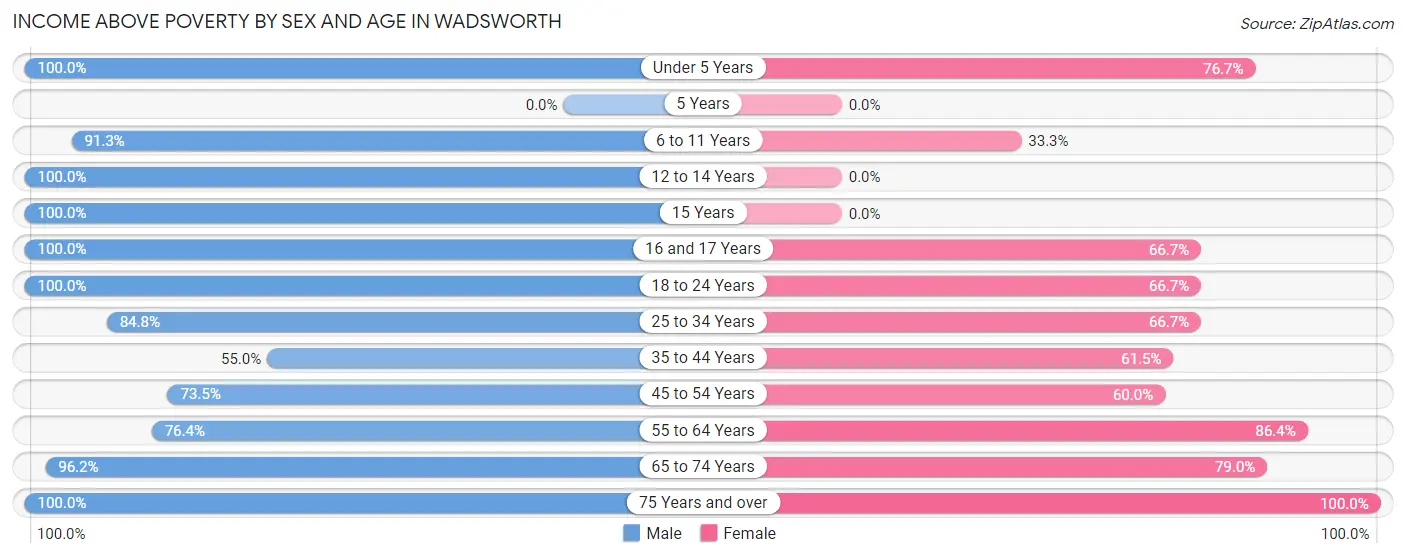
| Age Bracket | Male | Female |
| Under 5 Years | 11 (100.0%) | 33 (76.7%) |
| 5 Years | 0 (0.0%) | 0 (0.0%) |
| 6 to 11 Years | 42 (91.3%) | 2 (33.3%) |
| 12 to 14 Years | 8 (100.0%) | 0 (0.0%) |
| 15 Years | 1 (100.0%) | 0 (0.0%) |
| 16 and 17 Years | 7 (100.0%) | 6 (66.7%) |
| 18 to 24 Years | 46 (100.0%) | 36 (66.7%) |
| 25 to 34 Years | 50 (84.8%) | 18 (66.7%) |
| 35 to 44 Years | 11 (55.0%) | 16 (61.5%) |
| 45 to 54 Years | 36 (73.5%) | 27 (60.0%) |
| 55 to 64 Years | 68 (76.4%) | 51 (86.4%) |
| 65 to 74 Years | 25 (96.2%) | 30 (78.9%) |
| 75 Years and over | 20 (100.0%) | 24 (100.0%) |
| Total | 325 (85.1%) | 243 (72.8%) |
Income Below Poverty Among Married-Couple Families in Wadsworth
The poverty statistics for married-couple families in Wadsworth show that 8.3% or 10 of the total 120 families live below the poverty line. Families with no children have the highest poverty rate of 13.7%, comprising of 10 families. On the other hand, families with 1 or 2 children have the lowest poverty rate of 0.0%, which includes 0 families.
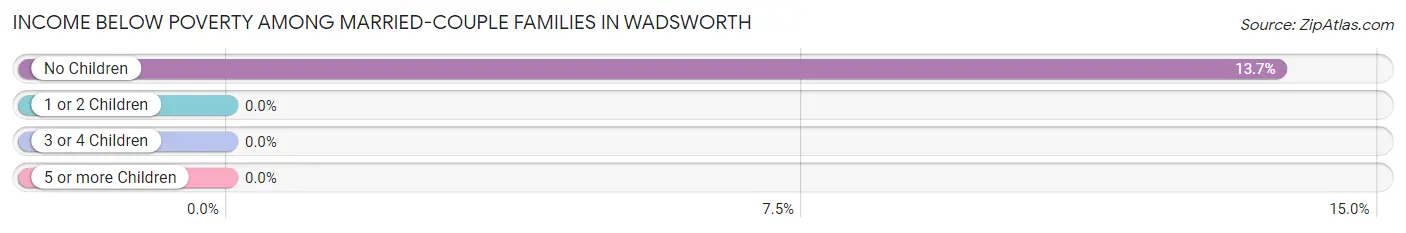
| Children | Above Poverty | Below Poverty |
| No Children | 63 (86.3%) | 10 (13.7%) |
| 1 or 2 Children | 34 (100.0%) | 0 (0.0%) |
| 3 or 4 Children | 13 (100.0%) | 0 (0.0%) |
| 5 or more Children | 0 (0.0%) | 0 (0.0%) |
| Total | 110 (91.7%) | 10 (8.3%) |
Income Below Poverty Among Single-Parent Households in Wadsworth
According to the poverty data in Wadsworth, 20.8% or 5 single-father households and 50.0% or 20 single-mother households are living below the poverty line. Among single-father households, those with no children have the highest poverty rate, with 5 households (25.0%) experiencing poverty. Likewise, among single-mother households, those with 1 or 2 children have the highest poverty rate, with 19 households (61.3%) falling below the poverty line.
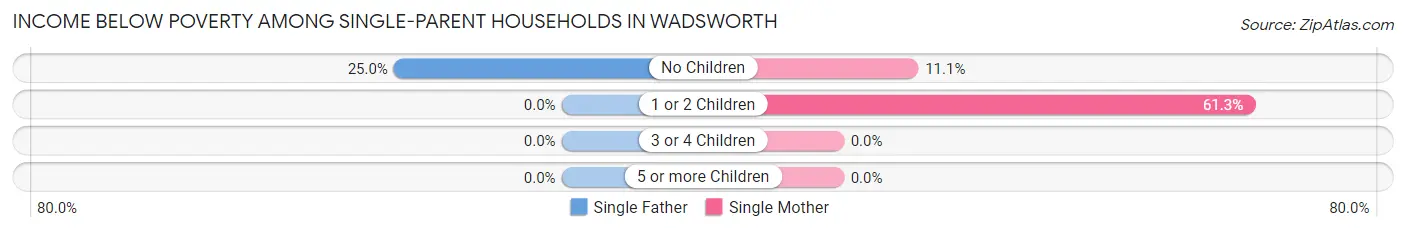
| Children | Single Father | Single Mother |
| No Children | 5 (25.0%) | 1 (11.1%) |
| 1 or 2 Children | 0 (0.0%) | 19 (61.3%) |
| 3 or 4 Children | 0 (0.0%) | 0 (0.0%) |
| 5 or more Children | 0 (0.0%) | 0 (0.0%) |
| Total | 5 (20.8%) | 20 (50.0%) |
Income Below Poverty Among Married-Couple vs Single-Parent Households in Wadsworth
The poverty data for Wadsworth shows that 10 of the married-couple family households (8.3%) and 25 of the single-parent households (39.1%) are living below the poverty level. Within the married-couple family households, those with no children have the highest poverty rate, with 10 households (13.7%) falling below the poverty line. Among the single-parent households, those with 1 or 2 children have the highest poverty rate, with 19 household (61.3%) living below poverty.
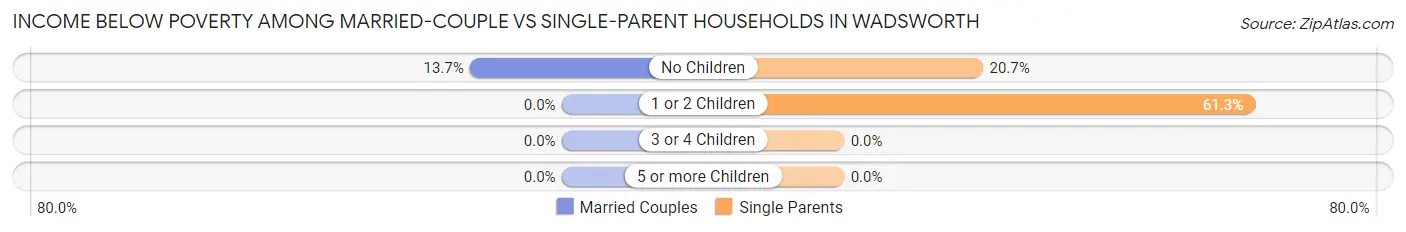
| Children | Married-Couple Families | Single-Parent Households |
| No Children | 10 (13.7%) | 6 (20.7%) |
| 1 or 2 Children | 0 (0.0%) | 19 (61.3%) |
| 3 or 4 Children | 0 (0.0%) | 0 (0.0%) |
| 5 or more Children | 0 (0.0%) | 0 (0.0%) |
| Total | 10 (8.3%) | 25 (39.1%) |
Race in Wadsworth
The most populous races in Wadsworth are Native / Alaskan (370 | 51.7%), White / Caucasian (252 | 35.2%), and Hispanic or Latino (72 | 10.1%).
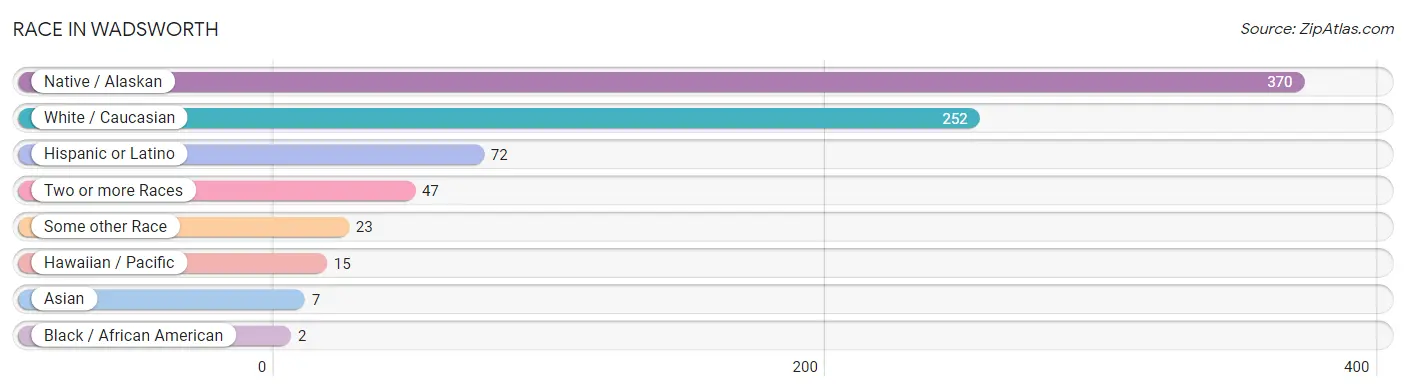
| Race | # Population | % Population |
| Asian | 7 | 1.0% |
| Black / African American | 2 | 0.3% |
| Hawaiian / Pacific | 15 | 2.1% |
| Hispanic or Latino | 72 | 10.1% |
| Native / Alaskan | 370 | 51.7% |
| White / Caucasian | 252 | 35.2% |
| Two or more Races | 47 | 6.6% |
| Some other Race | 23 | 3.2% |
| Total | 716 | 100.0% |
Ancestry in Wadsworth
The most populous ancestries reported in Wadsworth are Paiute (349 | 48.7%), German (67 | 9.4%), Mexican (57 | 8.0%), Navajo (34 | 4.8%), and Irish (29 | 4.1%), together accounting for 74.9% of all Wadsworth residents.
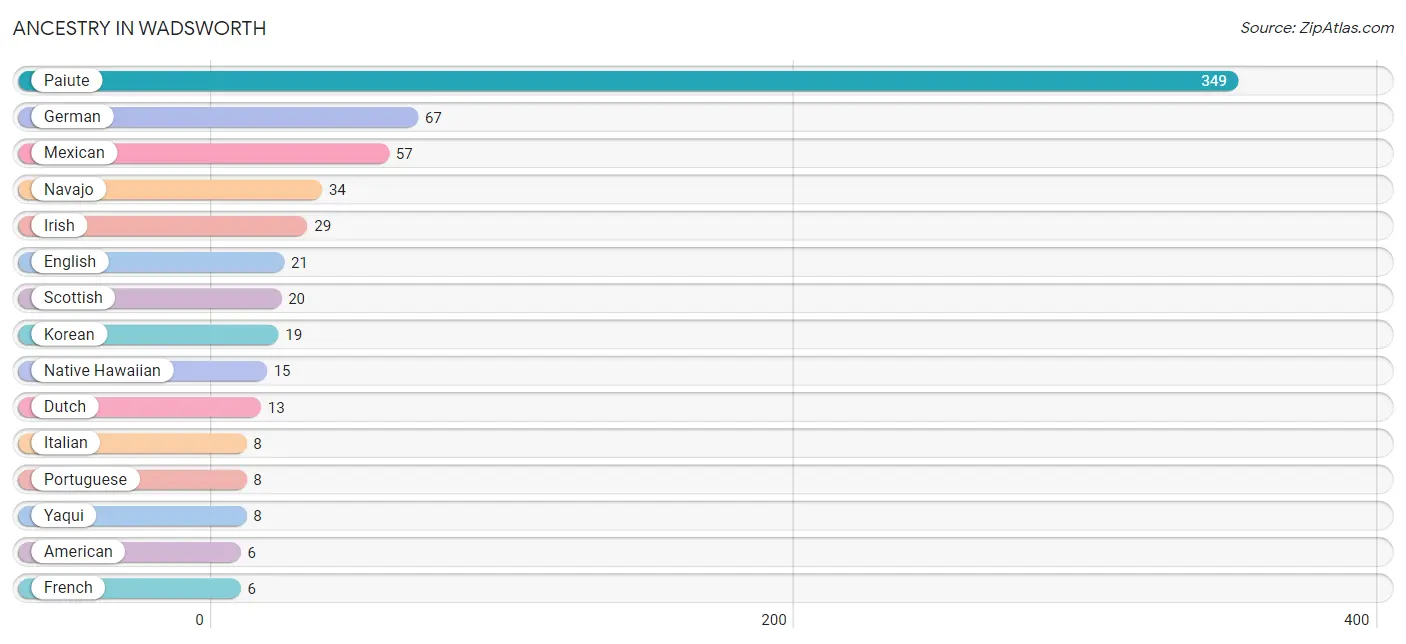
| Ancestry | # Population | % Population |
| American | 6 | 0.8% |
| Bhutanese | 5 | 0.7% |
| Canadian | 4 | 0.6% |
| Central American | 3 | 0.4% |
| Cherokee | 5 | 0.7% |
| Danish | 4 | 0.6% |
| Dutch | 13 | 1.8% |
| English | 21 | 2.9% |
| European | 5 | 0.7% |
| French | 6 | 0.8% |
| German | 67 | 9.4% |
| Guatemalan | 3 | 0.4% |
| Irish | 29 | 4.1% |
| Italian | 8 | 1.1% |
| Korean | 19 | 2.6% |
| Mexican | 57 | 8.0% |
| Native Hawaiian | 15 | 2.1% |
| Navajo | 34 | 4.8% |
| Norwegian | 5 | 0.7% |
| Paiute | 349 | 48.7% |
| Polish | 5 | 0.7% |
| Portuguese | 8 | 1.1% |
| Russian | 4 | 0.6% |
| Scottish | 20 | 2.8% |
| Spanish | 3 | 0.4% |
| Swedish | 5 | 0.7% |
| Yaqui | 8 | 1.1% | View All 27 Rows |
Immigrants in Wadsworth
The most numerous immigrant groups reported in Wadsworth came from Central America (11 | 1.5%), Latin America (11 | 1.5%), El Salvador (4 | 0.6%), Mexico (4 | 0.6%), and Asia (3 | 0.4%), together accounting for 4.6% of all Wadsworth residents.
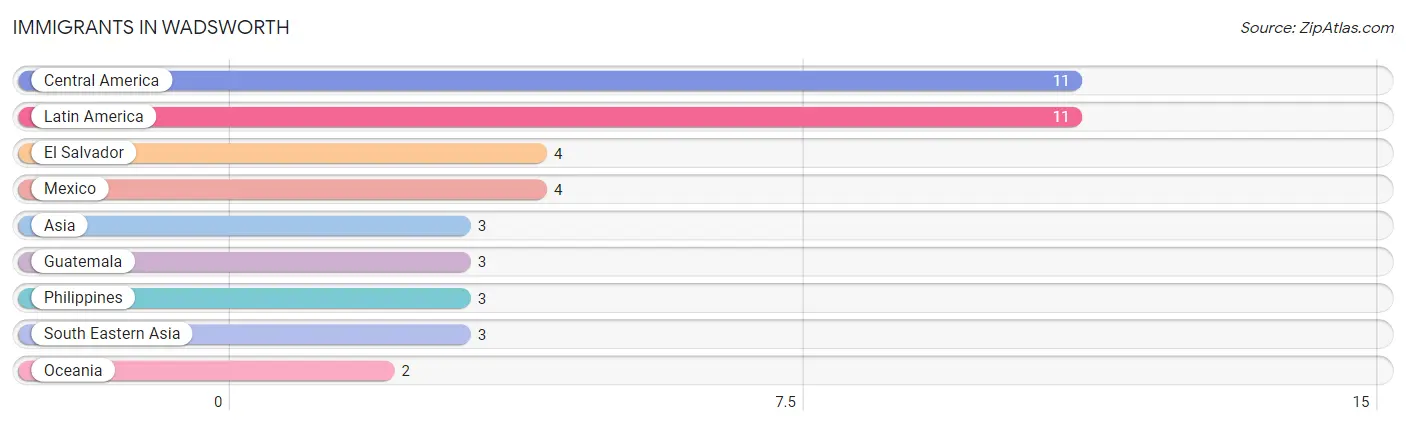
| Immigration Origin | # Population | % Population |
| Asia | 3 | 0.4% |
| Central America | 11 | 1.5% |
| El Salvador | 4 | 0.6% |
| Guatemala | 3 | 0.4% |
| Latin America | 11 | 1.5% |
| Mexico | 4 | 0.6% |
| Oceania | 2 | 0.3% |
| Philippines | 3 | 0.4% |
| South Eastern Asia | 3 | 0.4% | View All 9 Rows |
Sex and Age in Wadsworth
Sex and Age in Wadsworth
The most populous age groups in Wadsworth are 60 to 64 Years (61 | 16.0%) for men and 20 to 24 Years (52 | 15.6%) for women.
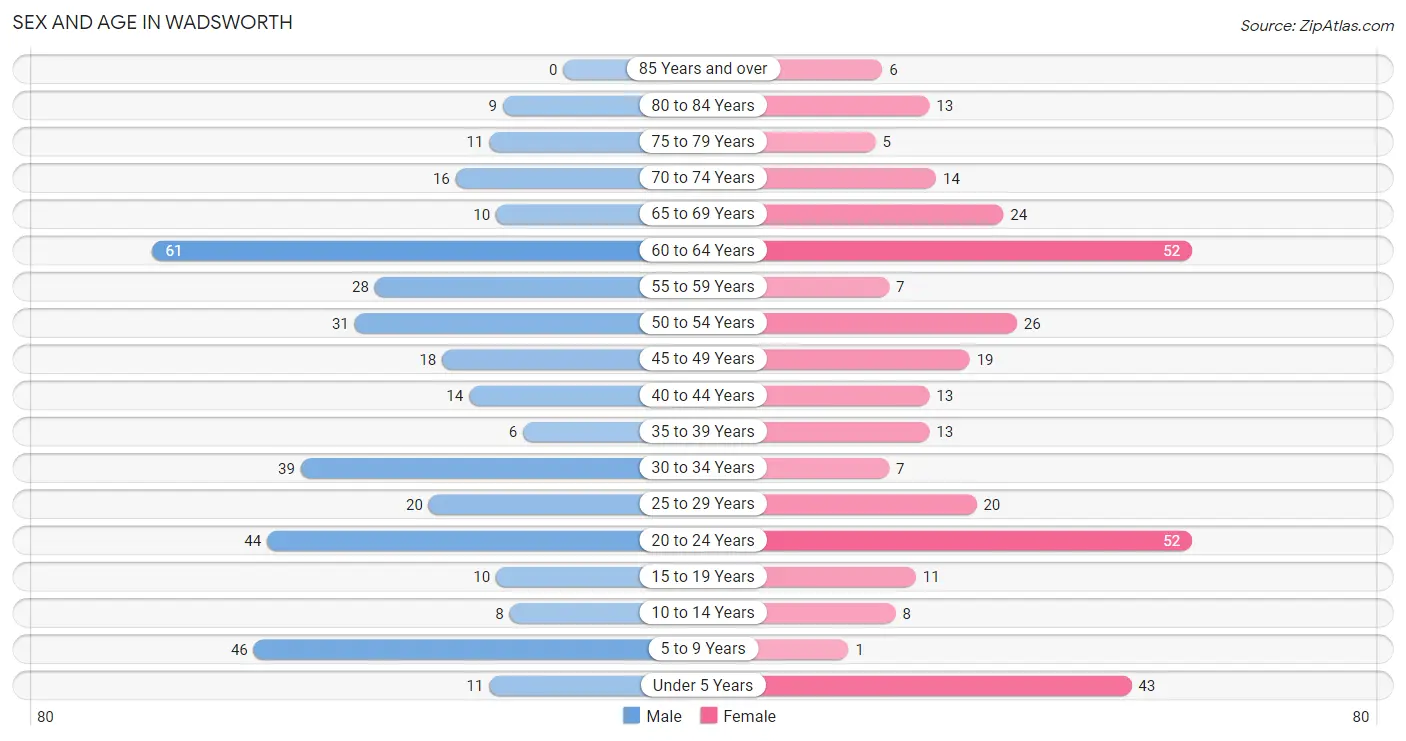
| Age Bracket | Male | Female |
| Under 5 Years | 11 (2.9%) | 43 (12.9%) |
| 5 to 9 Years | 46 (12.0%) | 1 (0.3%) |
| 10 to 14 Years | 8 (2.1%) | 8 (2.4%) |
| 15 to 19 Years | 10 (2.6%) | 11 (3.3%) |
| 20 to 24 Years | 44 (11.5%) | 52 (15.6%) |
| 25 to 29 Years | 20 (5.2%) | 20 (6.0%) |
| 30 to 34 Years | 39 (10.2%) | 7 (2.1%) |
| 35 to 39 Years | 6 (1.6%) | 13 (3.9%) |
| 40 to 44 Years | 14 (3.7%) | 13 (3.9%) |
| 45 to 49 Years | 18 (4.7%) | 19 (5.7%) |
| 50 to 54 Years | 31 (8.1%) | 26 (7.8%) |
| 55 to 59 Years | 28 (7.3%) | 7 (2.1%) |
| 60 to 64 Years | 61 (16.0%) | 52 (15.6%) |
| 65 to 69 Years | 10 (2.6%) | 24 (7.2%) |
| 70 to 74 Years | 16 (4.2%) | 14 (4.2%) |
| 75 to 79 Years | 11 (2.9%) | 5 (1.5%) |
| 80 to 84 Years | 9 (2.4%) | 13 (3.9%) |
| 85 Years and over | 0 (0.0%) | 6 (1.8%) |
| Total | 382 (100.0%) | 334 (100.0%) |
Families and Households in Wadsworth
Median Family Size in Wadsworth
The median family size in Wadsworth is 3.04 persons per family, with single female/mother families (40 | 21.7%) accounting for the largest median family size of 3.58 persons per family. On the other hand, single male/father families (24 | 13.0%) represent the smallest median family size with 2.71 persons per family.
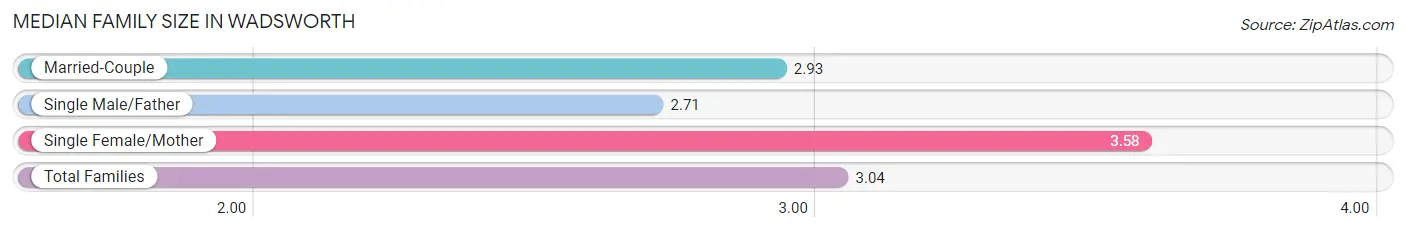
| Family Type | # Families | Family Size |
| Married-Couple | 120 (65.2%) | 2.93 |
| Single Male/Father | 24 (13.0%) | 2.71 |
| Single Female/Mother | 40 (21.7%) | 3.58 |
| Total Families | 184 (100.0%) | 3.04 |
Median Household Size in Wadsworth
The median household size in Wadsworth is 2.72 persons per household, with single female/mother households (40 | 15.5%) accounting for the largest median household size of 4.18 persons per household. non-family households (74 | 28.7%) represent the smallest median household size with 1.54 persons per household.
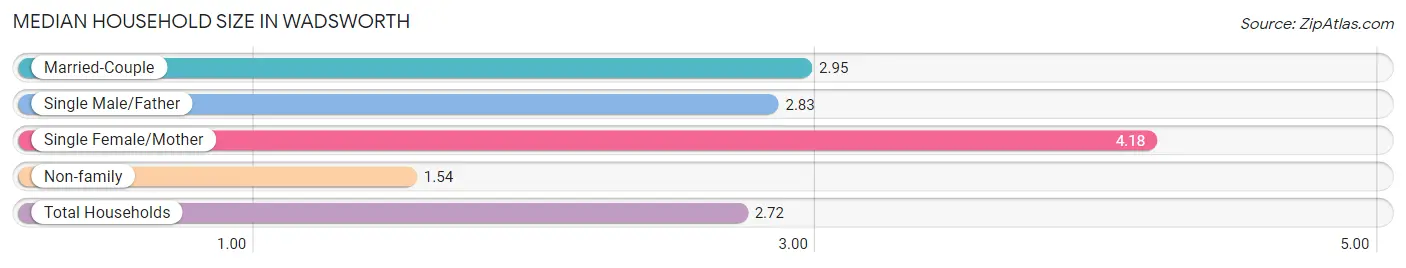
| Household Type | # Households | Household Size |
| Married-Couple | 120 (46.5%) | 2.95 |
| Single Male/Father | 24 (9.3%) | 2.83 |
| Single Female/Mother | 40 (15.5%) | 4.18 |
| Non-family | 74 (28.7%) | 1.54 |
| Total Households | 258 (100.0%) | 2.72 |
Household Size by Marriage Status in Wadsworth
Out of a total of 258 households in Wadsworth, 184 (71.3%) are family households, while 74 (28.7%) are nonfamily households. The most numerous type of family households are 2-person households, comprising 92, and the most common type of nonfamily households are 1-person households, comprising 45.
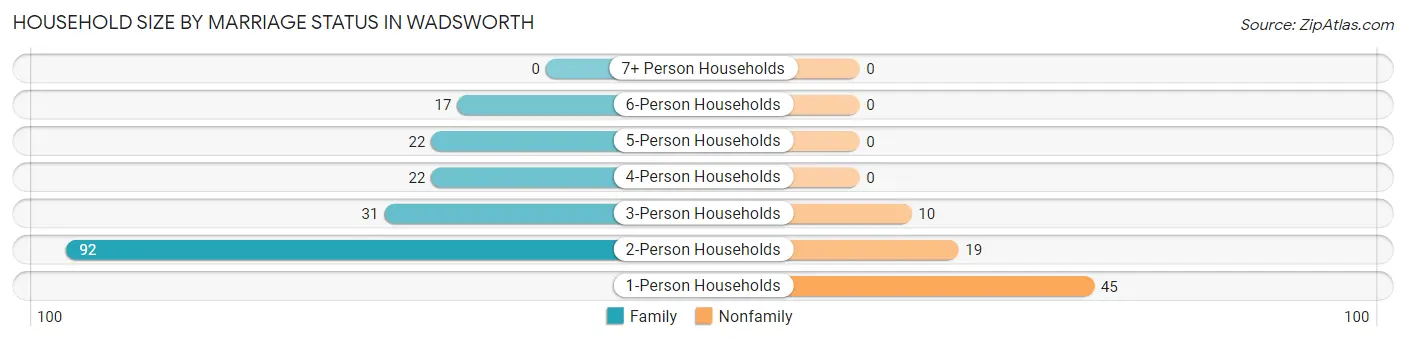
| Household Size | Family Households | Nonfamily Households |
| 1-Person Households | - | 45 (17.4%) |
| 2-Person Households | 92 (35.7%) | 19 (7.4%) |
| 3-Person Households | 31 (12.0%) | 10 (3.9%) |
| 4-Person Households | 22 (8.5%) | 0 (0.0%) |
| 5-Person Households | 22 (8.5%) | 0 (0.0%) |
| 6-Person Households | 17 (6.6%) | 0 (0.0%) |
| 7+ Person Households | 0 (0.0%) | 0 (0.0%) |
| Total | 184 (71.3%) | 74 (28.7%) |
Female Fertility in Wadsworth
Fertility by Age in Wadsworth
Average fertility rate in Wadsworth is 114.0 births per 1,000 women. Women in the age bracket of 20 to 34 years have the highest fertility rate with 165.0 births per 1,000 women. Women in the age bracket of 20 to 34 years acount for 81.2% of all women with births.
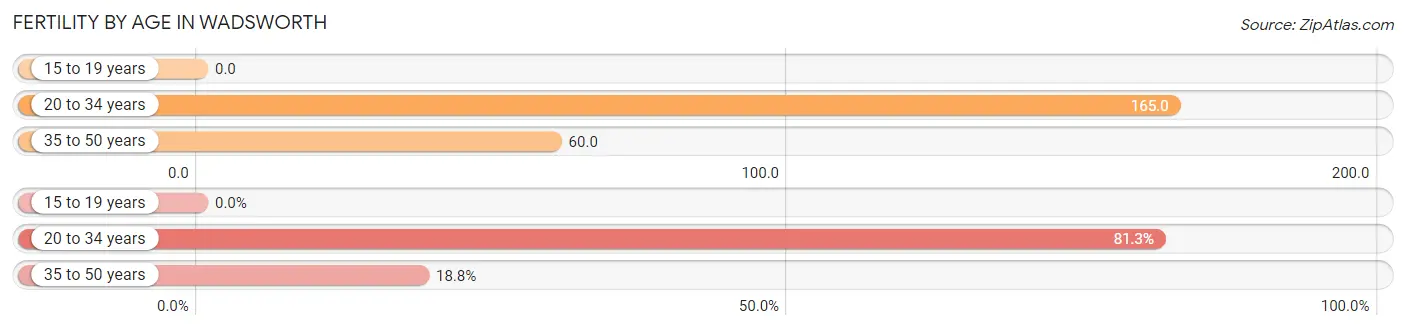
| Age Bracket | Women with Births | Births / 1,000 Women |
| 15 to 19 years | 0 (0.0%) | 0.0 |
| 20 to 34 years | 13 (81.2%) | 165.0 |
| 35 to 50 years | 3 (18.8%) | 60.0 |
| Total | 16 (100.0%) | 114.0 |
Fertility by Age by Marriage Status in Wadsworth
25.0% of women with births (16) in Wadsworth are married. The highest percentage of unmarried women with births falls into 35 to 50 years age bracket with 100.0% of them unmarried at the time of birth, while the lowest percentage of unmarried women with births belong to 20 to 34 years age bracket with 69.2% of them unmarried.
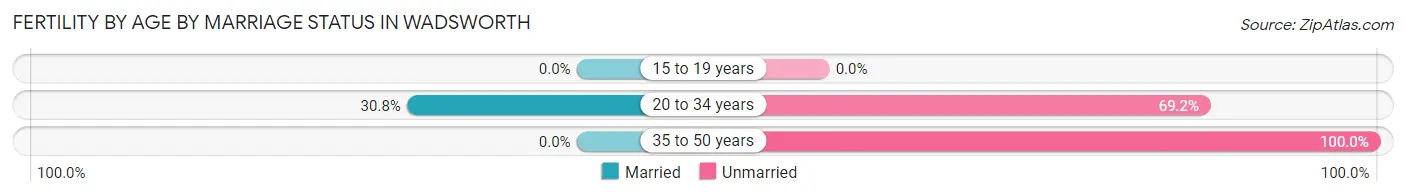
| Age Bracket | Married | Unmarried |
| 15 to 19 years | 0 (0.0%) | 0 (0.0%) |
| 20 to 34 years | 4 (30.8%) | 9 (69.2%) |
| 35 to 50 years | 0 (0.0%) | 3 (100.0%) |
| Total | 4 (25.0%) | 12 (75.0%) |
Fertility by Education in Wadsworth
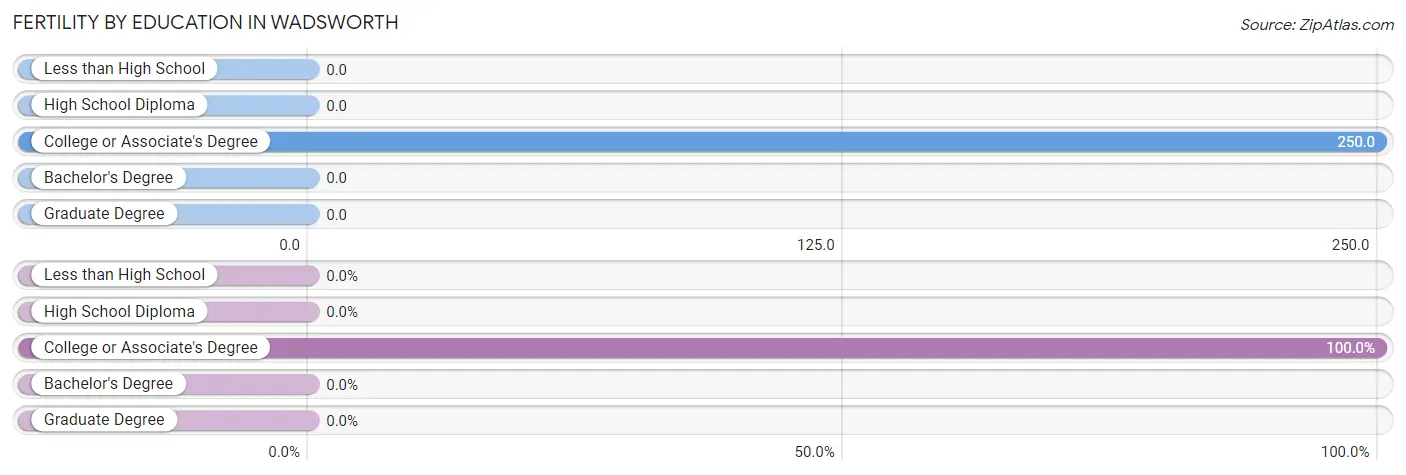
| Educational Attainment | Women with Births | Births / 1,000 Women |
| Less than High School | 0 (0.0%) | 0.0 |
| High School Diploma | 0 (0.0%) | 0.0 |
| College or Associate's Degree | 16 (100.0%) | 250.0 |
| Bachelor's Degree | 0 (0.0%) | 0.0 |
| Graduate Degree | 0 (0.0%) | 0.0 |
| Total | 16 (100.0%) | 114.0 |
Fertility by Education by Marriage Status in Wadsworth
75.0% of women with births in Wadsworth are unmarried. Women with the educational attainment of college or associate's degree are most likely to be married with 25.0% of them married at childbirth, while women with the educational attainment of college or associate's degree are least likely to be married with 75.0% of them unmarried at childbirth.
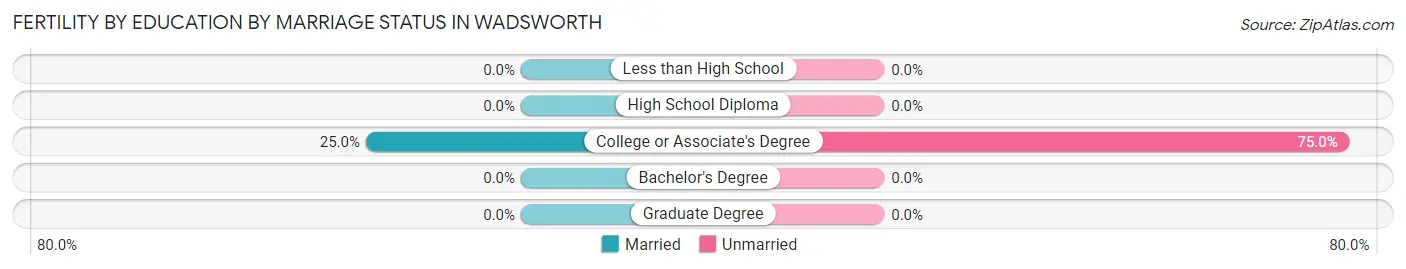
| Educational Attainment | Married | Unmarried |
| Less than High School | 0 (0.0%) | 0 (0.0%) |
| High School Diploma | 0 (0.0%) | 0 (0.0%) |
| College or Associate's Degree | 4 (25.0%) | 12 (75.0%) |
| Bachelor's Degree | 0 (0.0%) | 0 (0.0%) |
| Graduate Degree | 0 (0.0%) | 0 (0.0%) |
| Total | 4 (25.0%) | 12 (75.0%) |
Employment Characteristics in Wadsworth
Employment by Class of Employer in Wadsworth
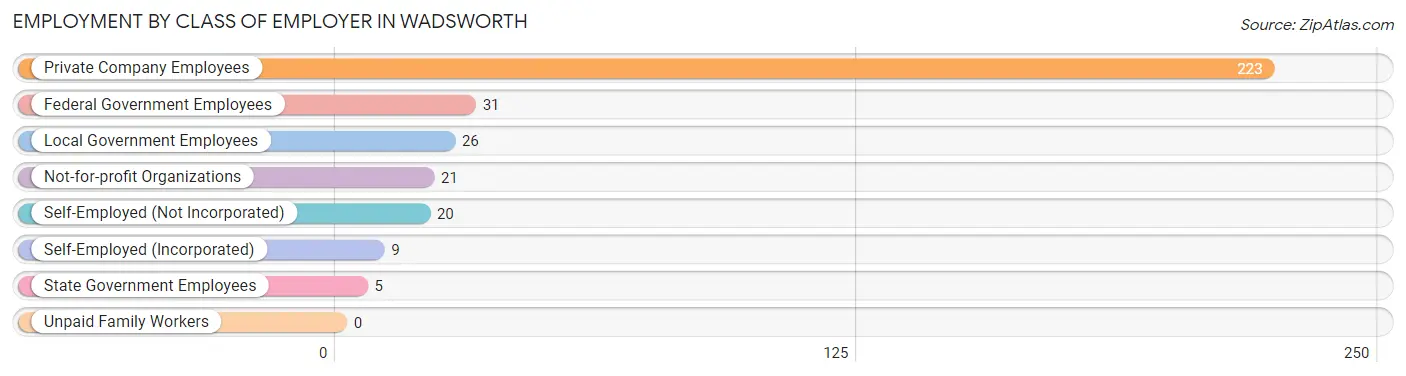
Among the 335 employed individuals in Wadsworth, private company employees (223 | 66.6%), federal government employees (31 | 9.2%), and local government employees (26 | 7.8%) make up the most common classes of employment.
| Employer Class | # Employees | % Employees |
| Private Company Employees | 223 | 66.6% |
| Self-Employed (Incorporated) | 9 | 2.7% |
| Self-Employed (Not Incorporated) | 20 | 6.0% |
| Not-for-profit Organizations | 21 | 6.3% |
| Local Government Employees | 26 | 7.8% |
| State Government Employees | 5 | 1.5% |
| Federal Government Employees | 31 | 9.2% |
| Unpaid Family Workers | 0 | 0.0% |
| Total | 335 | 100.0% |
Employment Status by Age in Wadsworth
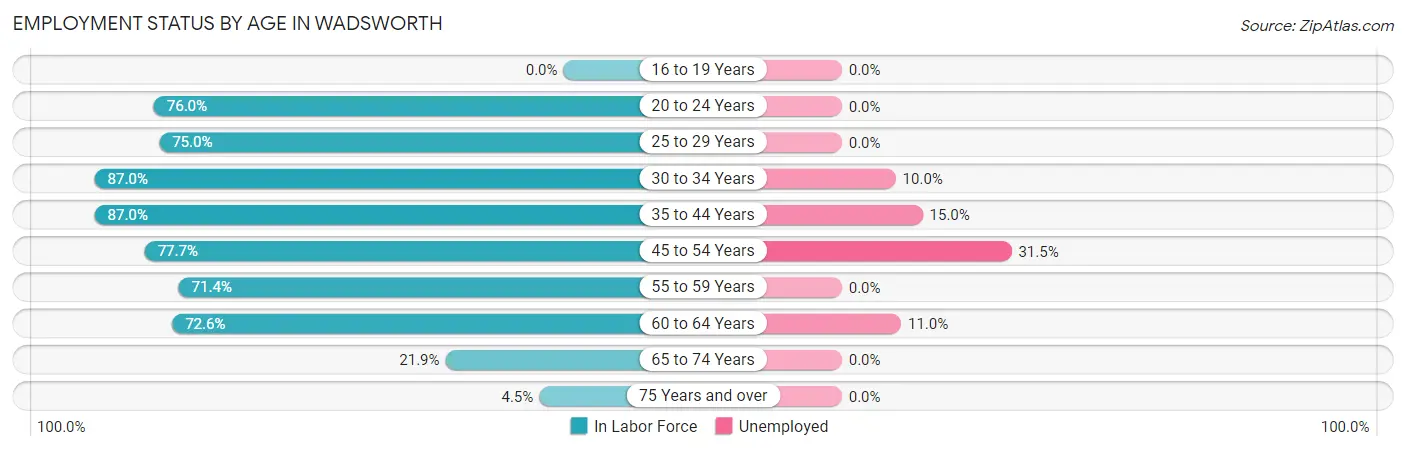
According to the labor force statistics for Wadsworth, out of the total population over 16 years of age (598), 63.4% or 379 individuals are in the labor force, with 11.1% or 42 of them unemployed. The age group with the highest labor force participation rate is 30 to 34 years, with 87.0% or 40 individuals in the labor force. Within the labor force, the 45 to 54 years age range has the highest percentage of unemployed individuals, with 31.5% or 23 of them being unemployed.
| Age Bracket | In Labor Force | Unemployed |
| 16 to 19 Years | 0 (0.0%) | 0 (0.0%) |
| 20 to 24 Years | 73 (76.0%) | 0 (0.0%) |
| 25 to 29 Years | 30 (75.0%) | 0 (0.0%) |
| 30 to 34 Years | 40 (87.0%) | 4 (10.0%) |
| 35 to 44 Years | 40 (87.0%) | 6 (15.0%) |
| 45 to 54 Years | 73 (77.7%) | 23 (31.5%) |
| 55 to 59 Years | 25 (71.4%) | 0 (0.0%) |
| 60 to 64 Years | 82 (72.6%) | 9 (11.0%) |
| 65 to 74 Years | 14 (21.9%) | 0 (0.0%) |
| 75 Years and over | 2 (4.5%) | 0 (0.0%) |
| Total | 379 (63.4%) | 42 (11.1%) |
Employment Status by Educational Attainment in Wadsworth
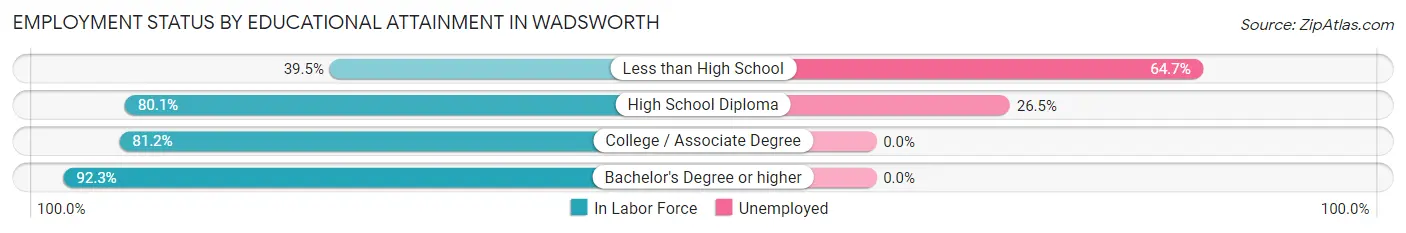
According to labor force statistics for Wadsworth, 77.5% of individuals (290) out of the total population between 25 and 64 years of age (374) are in the labor force, with 14.5% or 42 of them being unemployed. The group with the highest labor force participation rate are those with the educational attainment of bachelor's degree or higher, with 92.3% or 48 individuals in the labor force. Within the labor force, individuals with less than high school education have the highest percentage of unemployment, with 64.7% or 11 of them being unemployed.
| Educational Attainment | In Labor Force | Unemployed |
| Less than High School | 17 (39.5%) | 28 (64.7%) |
| High School Diploma | 117 (80.1%) | 39 (26.5%) |
| College / Associate Degree | 108 (81.2%) | 0 (0.0%) |
| Bachelor's Degree or higher | 48 (92.3%) | 0 (0.0%) |
| Total | 290 (77.5%) | 54 (14.5%) |
Employment Occupations by Sex in Wadsworth
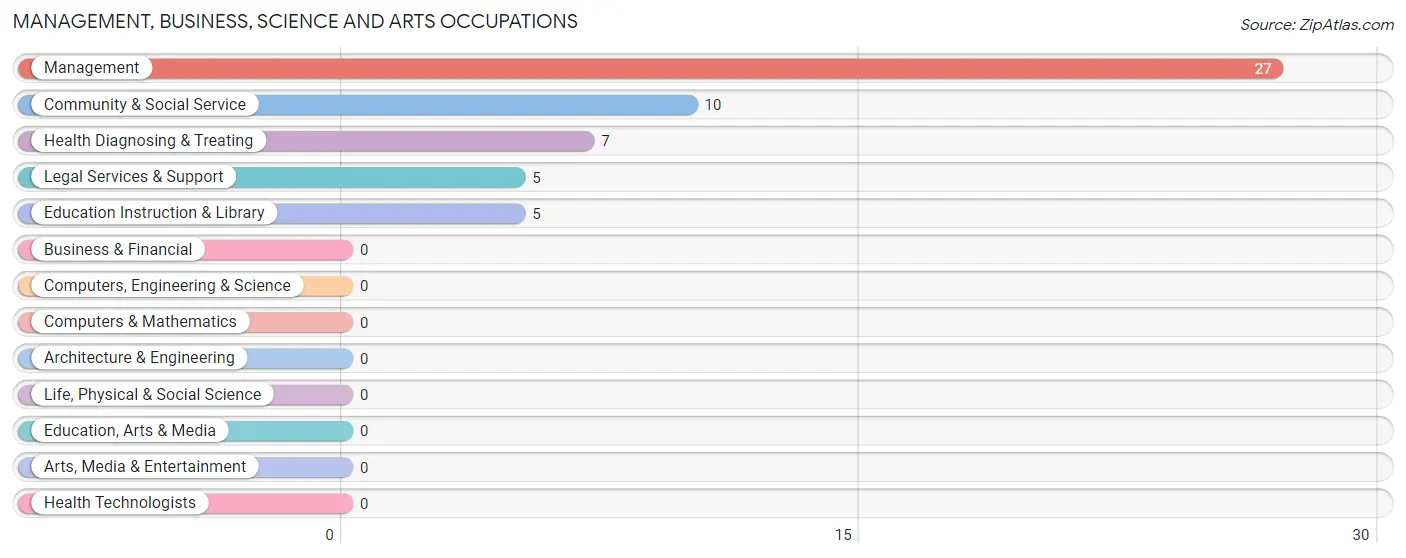
Management, Business, Science and Arts Occupations
The most common Management, Business, Science and Arts occupations in Wadsworth are Management (27 | 8.0%), Community & Social Service (10 | 3.0%), Health Diagnosing & Treating (7 | 2.1%), Legal Services & Support (5 | 1.5%), and Education Instruction & Library (5 | 1.5%).
Management, Business, Science and Arts Occupations by Sex
Within the Management, Business, Science and Arts occupations in Wadsworth, the most male-oriented occupations are Legal Services & Support (100.0%), Community & Social Service (50.0%), and Management (40.7%), while the most female-oriented occupations are Education Instruction & Library (100.0%), Health Diagnosing & Treating (100.0%), and Management (59.3%).
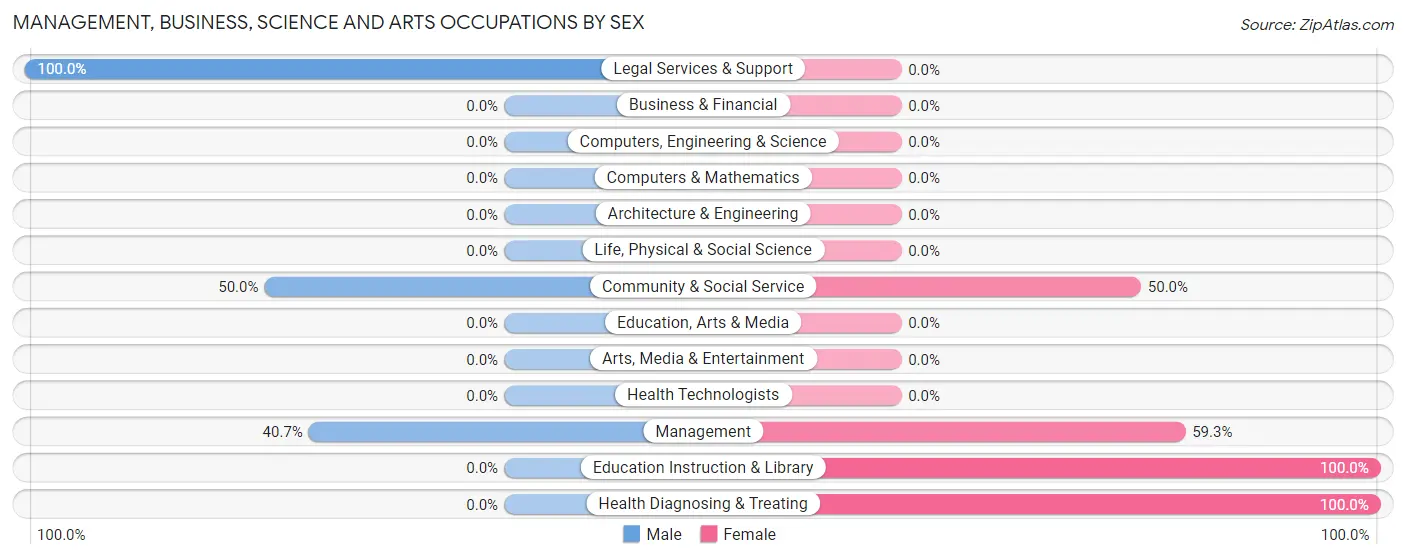
| Occupation | Male | Female |
| Management | 11 (40.7%) | 16 (59.3%) |
| Business & Financial | 0 (0.0%) | 0 (0.0%) |
| Computers, Engineering & Science | 0 (0.0%) | 0 (0.0%) |
| Computers & Mathematics | 0 (0.0%) | 0 (0.0%) |
| Architecture & Engineering | 0 (0.0%) | 0 (0.0%) |
| Life, Physical & Social Science | 0 (0.0%) | 0 (0.0%) |
| Community & Social Service | 5 (50.0%) | 5 (50.0%) |
| Education, Arts & Media | 0 (0.0%) | 0 (0.0%) |
| Legal Services & Support | 5 (100.0%) | 0 (0.0%) |
| Education Instruction & Library | 0 (0.0%) | 5 (100.0%) |
| Arts, Media & Entertainment | 0 (0.0%) | 0 (0.0%) |
| Health Diagnosing & Treating | 0 (0.0%) | 7 (100.0%) |
| Health Technologists | 0 (0.0%) | 0 (0.0%) |
| Total (Category) | 16 (36.4%) | 28 (63.6%) |
| Total (Overall) | 195 (57.9%) | 142 (42.1%) |
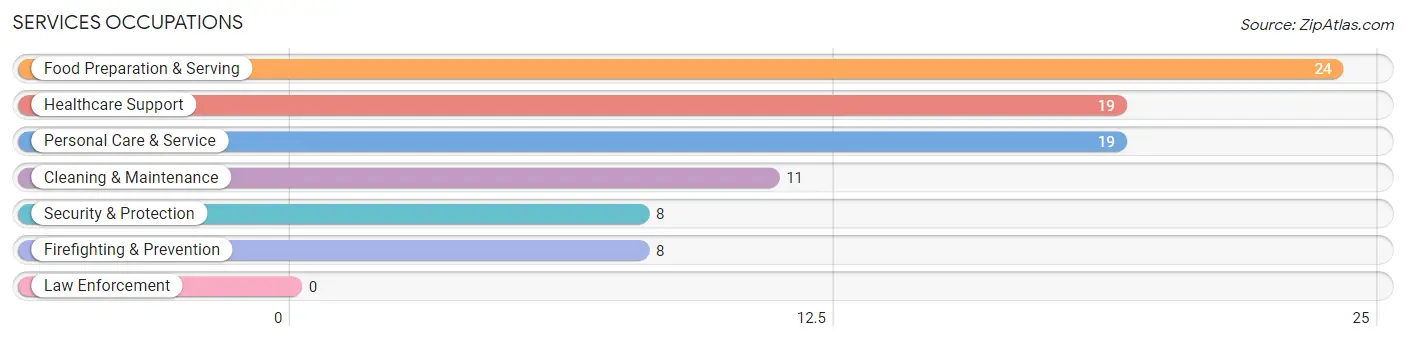
Services Occupations
The most common Services occupations in Wadsworth are Food Preparation & Serving (24 | 7.1%), Healthcare Support (19 | 5.6%), Personal Care & Service (19 | 5.6%), Cleaning & Maintenance (11 | 3.3%), and Security & Protection (8 | 2.4%).
Services Occupations by Sex
Within the Services occupations in Wadsworth, the most male-oriented occupations are Food Preparation & Serving (79.2%), Security & Protection (75.0%), and Firefighting & Prevention (75.0%), while the most female-oriented occupations are Personal Care & Service (100.0%), Healthcare Support (47.4%), and Cleaning & Maintenance (45.5%).
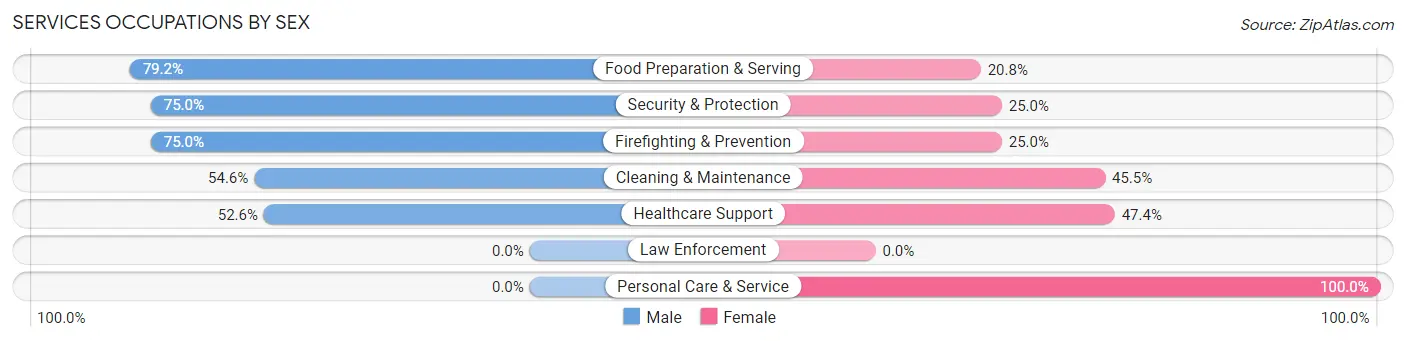
| Occupation | Male | Female |
| Healthcare Support | 10 (52.6%) | 9 (47.4%) |
| Security & Protection | 6 (75.0%) | 2 (25.0%) |
| Firefighting & Prevention | 6 (75.0%) | 2 (25.0%) |
| Law Enforcement | 0 (0.0%) | 0 (0.0%) |
| Food Preparation & Serving | 19 (79.2%) | 5 (20.8%) |
| Cleaning & Maintenance | 6 (54.5%) | 5 (45.5%) |
| Personal Care & Service | 0 (0.0%) | 19 (100.0%) |
| Total (Category) | 41 (50.6%) | 40 (49.4%) |
| Total (Overall) | 195 (57.9%) | 142 (42.1%) |
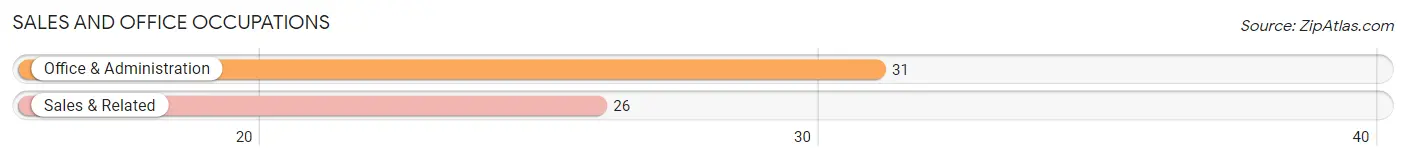
Sales and Office Occupations
The most common Sales and Office occupations in Wadsworth are Office & Administration (31 | 9.2%), and Sales & Related (26 | 7.7%).
Sales and Office Occupations by Sex
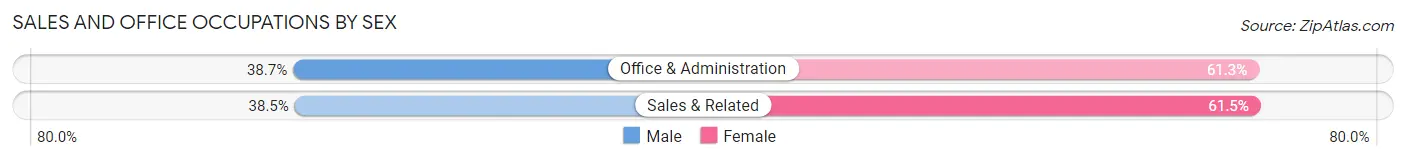
| Occupation | Male | Female |
| Sales & Related | 10 (38.5%) | 16 (61.5%) |
| Office & Administration | 12 (38.7%) | 19 (61.3%) |
| Total (Category) | 22 (38.6%) | 35 (61.4%) |
| Total (Overall) | 195 (57.9%) | 142 (42.1%) |
Natural Resources, Construction and Maintenance Occupations
The most common Natural Resources, Construction and Maintenance occupations in Wadsworth are Construction & Extraction (25 | 7.4%), Installation, Maintenance & Repair (8 | 2.4%), and Farming, Fishing & Forestry (5 | 1.5%).
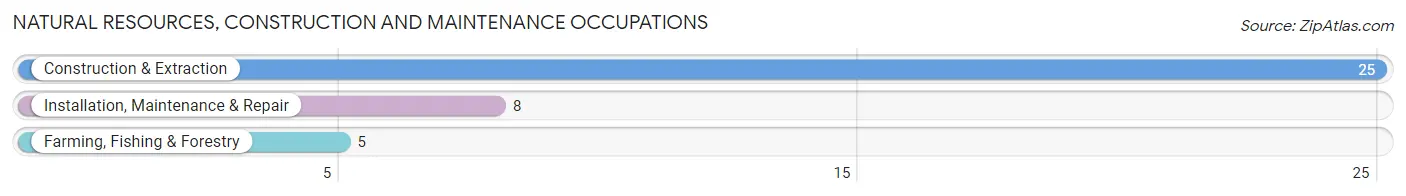
Natural Resources, Construction and Maintenance Occupations by Sex
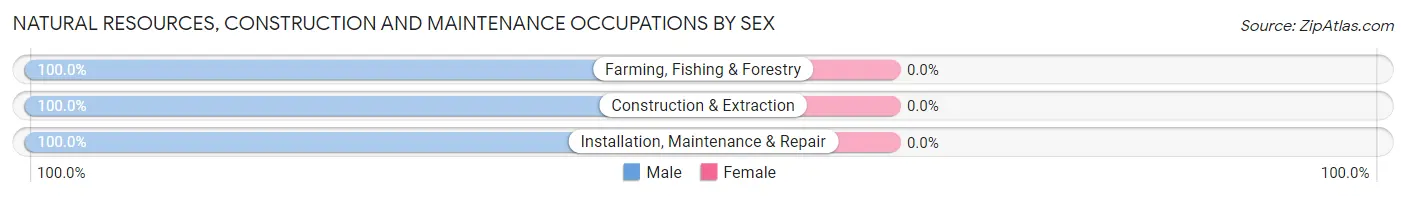
| Occupation | Male | Female |
| Farming, Fishing & Forestry | 5 (100.0%) | 0 (0.0%) |
| Construction & Extraction | 25 (100.0%) | 0 (0.0%) |
| Installation, Maintenance & Repair | 8 (100.0%) | 0 (0.0%) |
| Total (Category) | 38 (100.0%) | 0 (0.0%) |
| Total (Overall) | 195 (57.9%) | 142 (42.1%) |
Production, Transportation and Moving Occupations
The most common Production, Transportation and Moving occupations in Wadsworth are Transportation (53 | 15.7%), Material Moving (40 | 11.9%), and Production (24 | 7.1%).
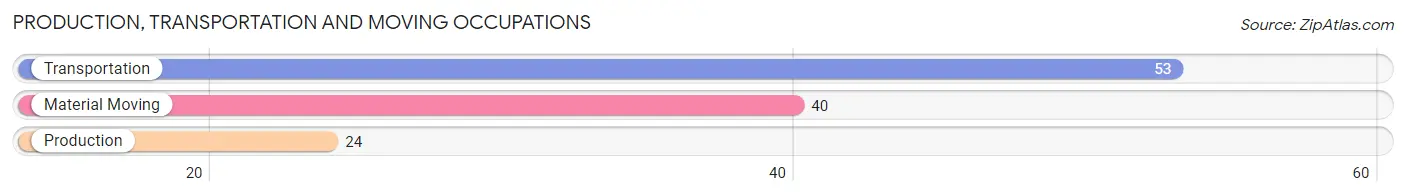
Production, Transportation and Moving Occupations by Sex
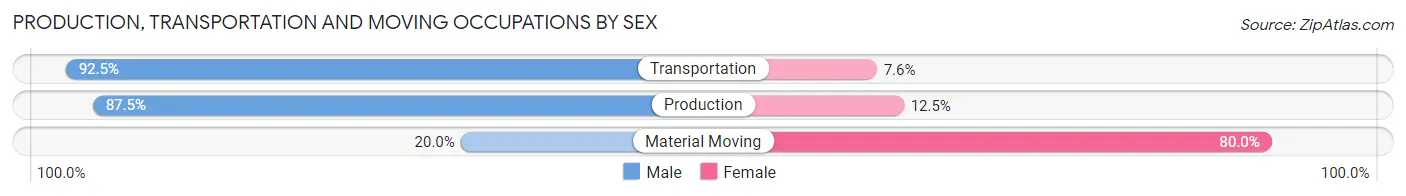
| Occupation | Male | Female |
| Production | 21 (87.5%) | 3 (12.5%) |
| Transportation | 49 (92.4%) | 4 (7.5%) |
| Material Moving | 8 (20.0%) | 32 (80.0%) |
| Total (Category) | 78 (66.7%) | 39 (33.3%) |
| Total (Overall) | 195 (57.9%) | 142 (42.1%) |
Employment Industries by Sex in Wadsworth
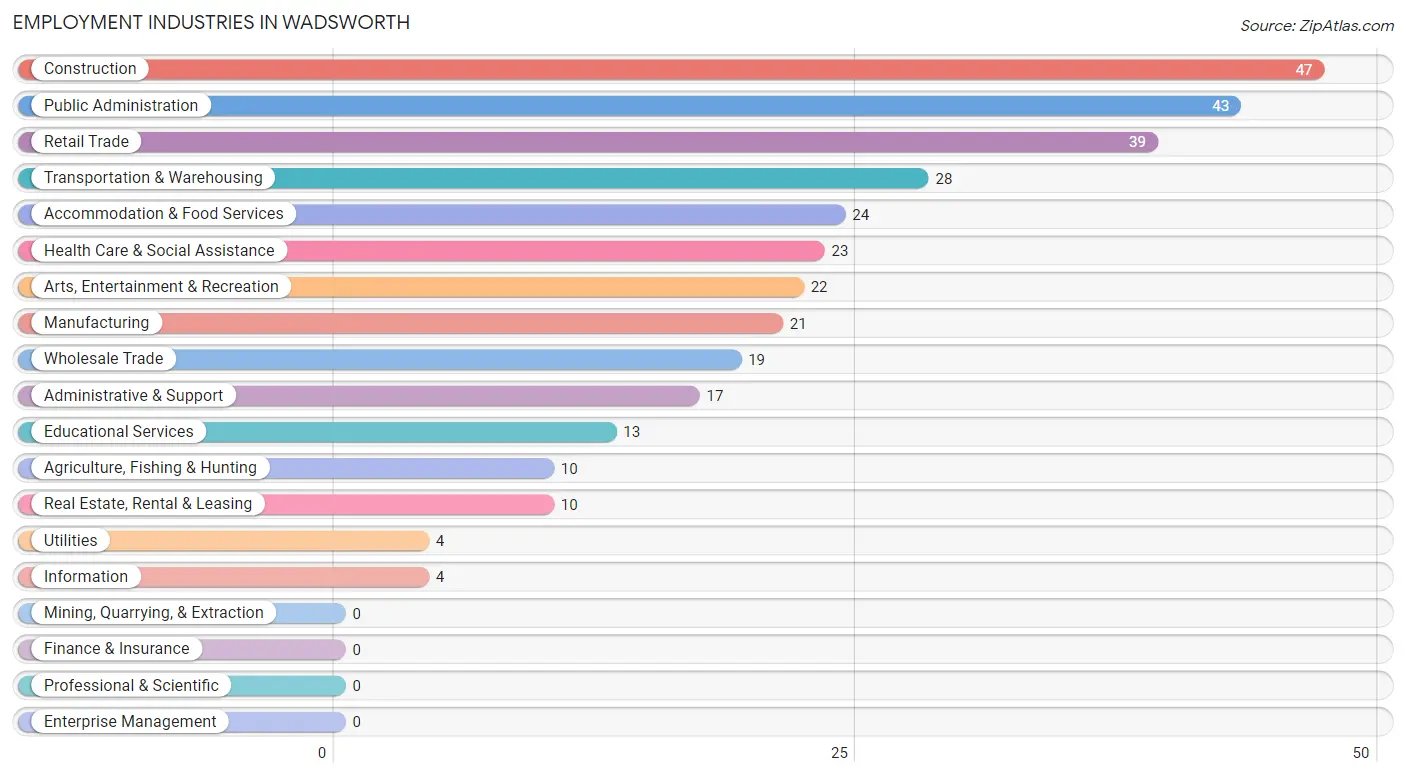
Employment Industries in Wadsworth
The major employment industries in Wadsworth include Construction (47 | 14.0%), Public Administration (43 | 12.8%), Retail Trade (39 | 11.6%), Transportation & Warehousing (28 | 8.3%), and Accommodation & Food Services (24 | 7.1%).
Employment Industries by Sex in Wadsworth
The Wadsworth industries that see more men than women are Agriculture, Fishing & Hunting (100.0%), Transportation & Warehousing (100.0%), and Utilities (100.0%), whereas the industries that tend to have a higher number of women are Educational Services (100.0%), Health Care & Social Assistance (78.3%), and Arts, Entertainment & Recreation (68.2%).
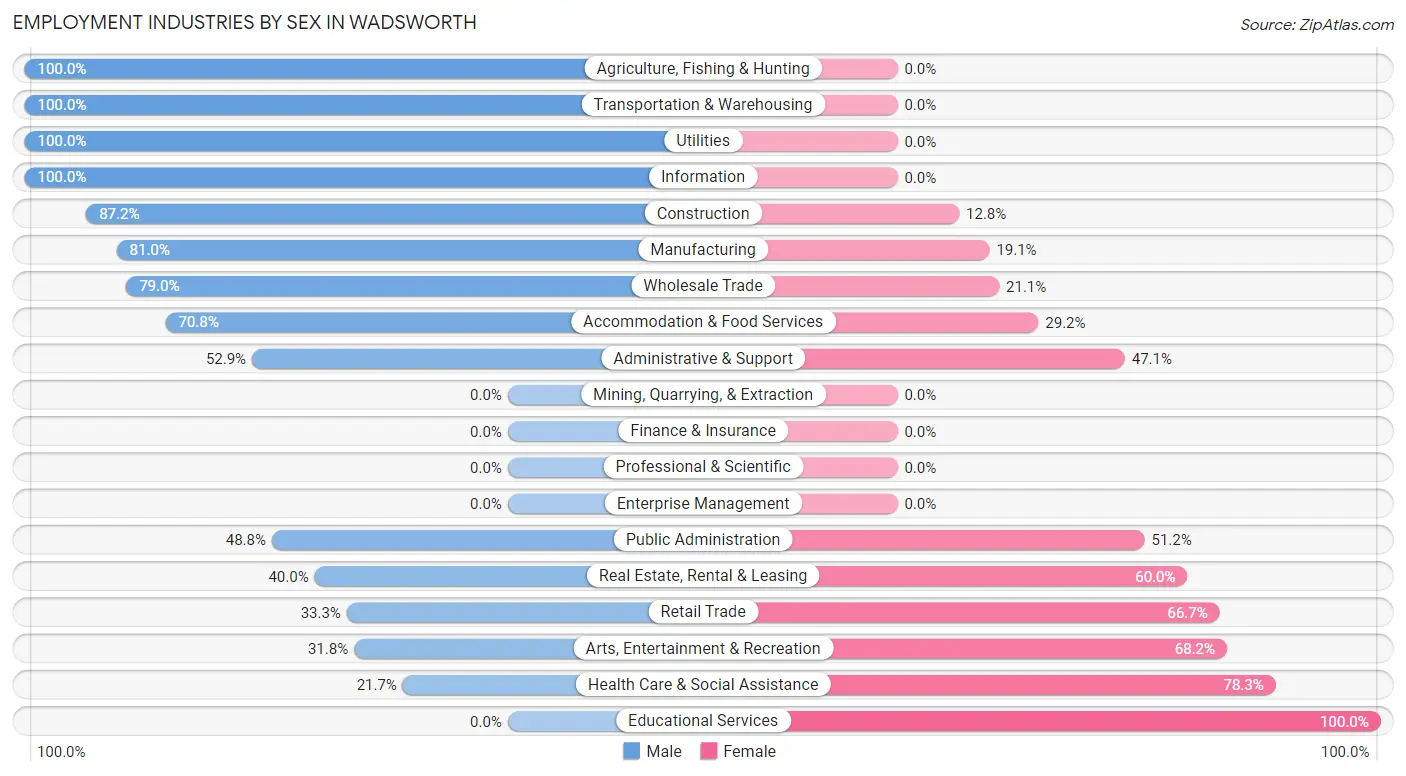
| Industry | Male | Female |
| Agriculture, Fishing & Hunting | 10 (100.0%) | 0 (0.0%) |
| Mining, Quarrying, & Extraction | 0 (0.0%) | 0 (0.0%) |
| Construction | 41 (87.2%) | 6 (12.8%) |
| Manufacturing | 17 (80.9%) | 4 (19.1%) |
| Wholesale Trade | 15 (78.9%) | 4 (21.0%) |
| Retail Trade | 13 (33.3%) | 26 (66.7%) |
| Transportation & Warehousing | 28 (100.0%) | 0 (0.0%) |
| Utilities | 4 (100.0%) | 0 (0.0%) |
| Information | 4 (100.0%) | 0 (0.0%) |
| Finance & Insurance | 0 (0.0%) | 0 (0.0%) |
| Real Estate, Rental & Leasing | 4 (40.0%) | 6 (60.0%) |
| Professional & Scientific | 0 (0.0%) | 0 (0.0%) |
| Enterprise Management | 0 (0.0%) | 0 (0.0%) |
| Administrative & Support | 9 (52.9%) | 8 (47.1%) |
| Educational Services | 0 (0.0%) | 13 (100.0%) |
| Health Care & Social Assistance | 5 (21.7%) | 18 (78.3%) |
| Arts, Entertainment & Recreation | 7 (31.8%) | 15 (68.2%) |
| Accommodation & Food Services | 17 (70.8%) | 7 (29.2%) |
| Public Administration | 21 (48.8%) | 22 (51.2%) |
| Total | 195 (57.9%) | 142 (42.1%) |
Education in Wadsworth
School Enrollment in Wadsworth
The most common levels of schooling among the 108 students in Wadsworth are elementary school (47 | 43.5%), college / undergraduate (28 | 25.9%), and high school (19 | 17.6%).
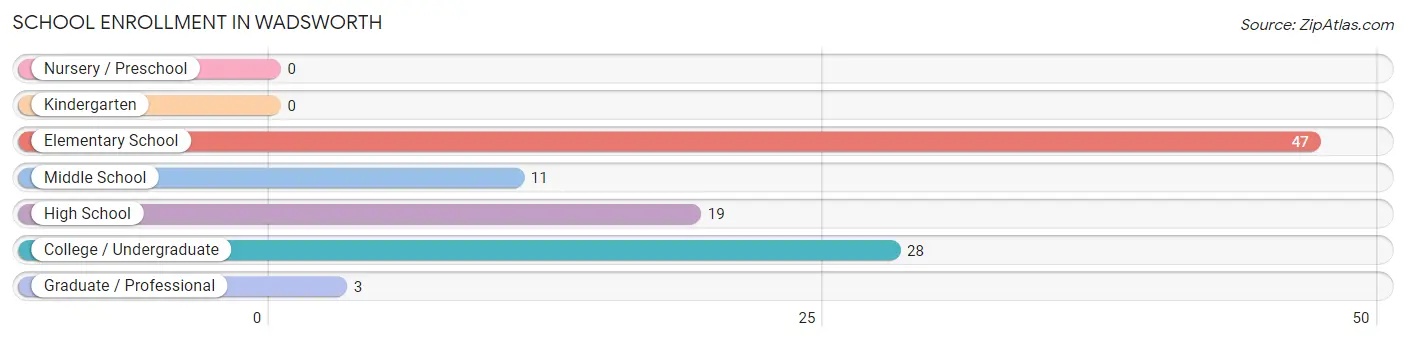
| School Level | # Students | % Students |
| Nursery / Preschool | 0 | 0.0% |
| Kindergarten | 0 | 0.0% |
| Elementary School | 47 | 43.5% |
| Middle School | 11 | 10.2% |
| High School | 19 | 17.6% |
| College / Undergraduate | 28 | 25.9% |
| Graduate / Professional | 3 | 2.8% |
| Total | 108 | 100.0% |
School Enrollment by Age by Funding Source in Wadsworth
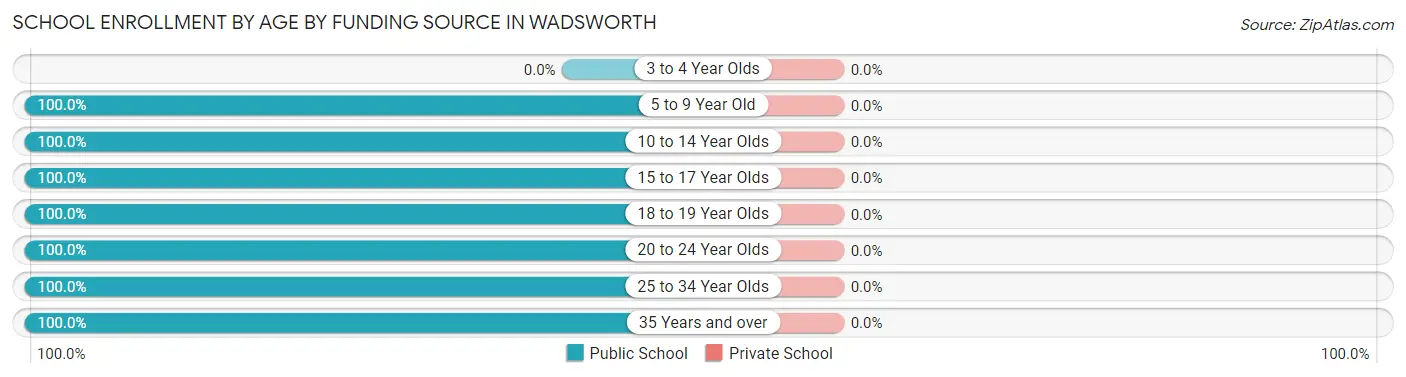
| Age Bracket | Public School | Private School |
| 3 to 4 Year Olds | 0 (0.0%) | 0 (0.0%) |
| 5 to 9 Year Old | 47 (100.0%) | 0 (0.0%) |
| 10 to 14 Year Olds | 13 (100.0%) | 0 (0.0%) |
| 15 to 17 Year Olds | 17 (100.0%) | 0 (0.0%) |
| 18 to 19 Year Olds | 2 (100.0%) | 0 (0.0%) |
| 20 to 24 Year Olds | 20 (100.0%) | 0 (0.0%) |
| 25 to 34 Year Olds | 6 (100.0%) | 0 (0.0%) |
| 35 Years and over | 3 (100.0%) | 0 (0.0%) |
| Total | 108 (100.0%) | 0 (0.0%) |
Educational Attainment by Field of Study in Wadsworth
Computers & mathematics (13 | 21.7%), engineering (12 | 20.0%), visual & performing arts (10 | 16.7%), business (9 | 15.0%), and bio, nature & agricultural (5 | 8.3%) are the most common fields of study among 60 individuals in Wadsworth who have obtained a bachelor's degree or higher.
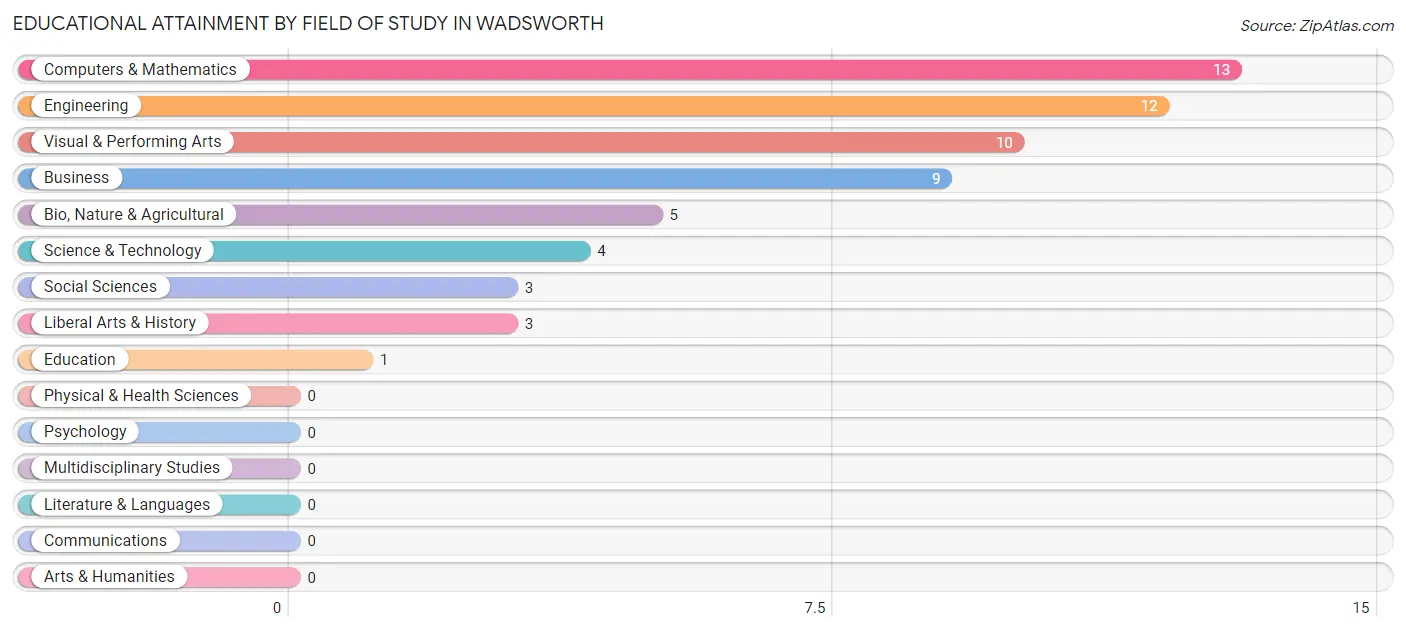
| Field of Study | # Graduates | % Graduates |
| Computers & Mathematics | 13 | 21.7% |
| Bio, Nature & Agricultural | 5 | 8.3% |
| Physical & Health Sciences | 0 | 0.0% |
| Psychology | 0 | 0.0% |
| Social Sciences | 3 | 5.0% |
| Engineering | 12 | 20.0% |
| Multidisciplinary Studies | 0 | 0.0% |
| Science & Technology | 4 | 6.7% |
| Business | 9 | 15.0% |
| Education | 1 | 1.7% |
| Literature & Languages | 0 | 0.0% |
| Liberal Arts & History | 3 | 5.0% |
| Visual & Performing Arts | 10 | 16.7% |
| Communications | 0 | 0.0% |
| Arts & Humanities | 0 | 0.0% |
| Total | 60 | 100.0% |
Transportation & Commute in Wadsworth
Vehicle Availability by Sex in Wadsworth
The most prevalent vehicle ownership categories in Wadsworth are males with 2 vehicles (68, accounting for 36.8%) and females with 2 vehicles (36, making up 48.6%).
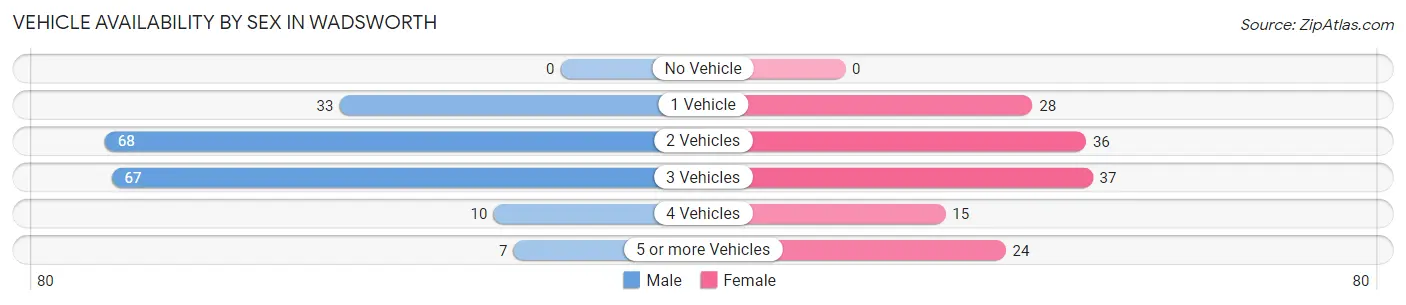
| Vehicles Available | Male | Female |
| No Vehicle | 0 (0.0%) | 0 (0.0%) |
| 1 Vehicle | 33 (17.8%) | 28 (20.0%) |
| 2 Vehicles | 68 (36.8%) | 36 (25.7%) |
| 3 Vehicles | 67 (36.2%) | 37 (26.4%) |
| 4 Vehicles | 10 (5.4%) | 15 (10.7%) |
| 5 or more Vehicles | 7 (3.8%) | 24 (17.1%) |
| Total | 185 (100.0%) | 140 (100.0%) |
Commute Time in Wadsworth
The most frequently occuring commute durations in Wadsworth are 15 to 19 minutes (52 commuters, 16.7%), 5 to 9 minutes (47 commuters, 15.1%), and 20 to 24 minutes (38 commuters, 12.2%).
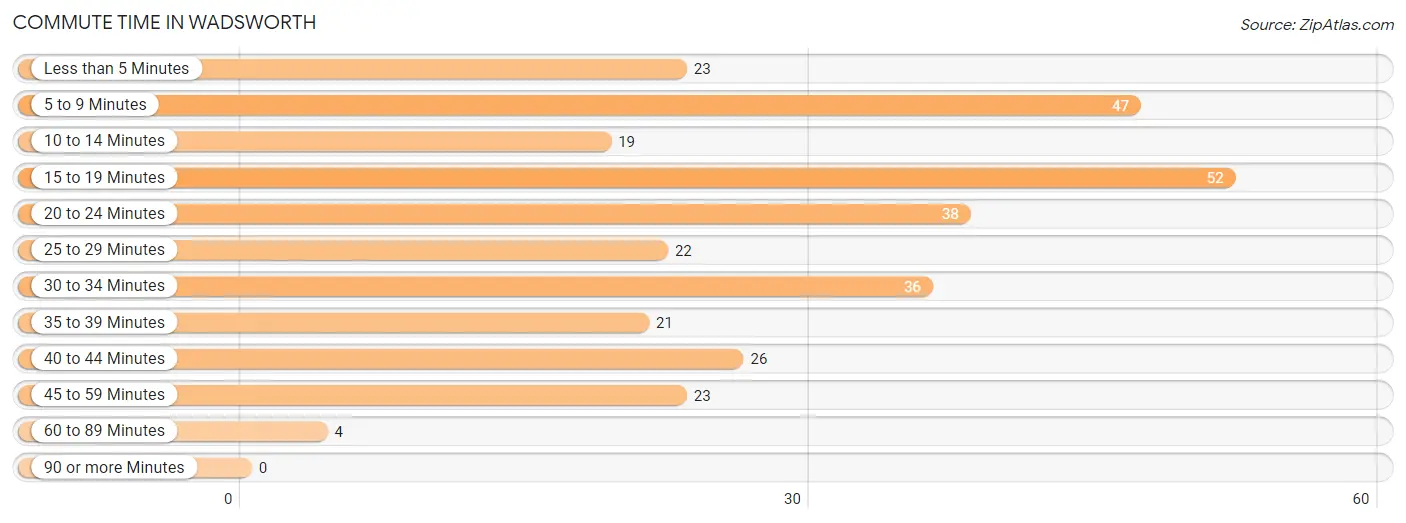
| Commute Time | # Commuters | % Commuters |
| Less than 5 Minutes | 23 | 7.4% |
| 5 to 9 Minutes | 47 | 15.1% |
| 10 to 14 Minutes | 19 | 6.1% |
| 15 to 19 Minutes | 52 | 16.7% |
| 20 to 24 Minutes | 38 | 12.2% |
| 25 to 29 Minutes | 22 | 7.1% |
| 30 to 34 Minutes | 36 | 11.6% |
| 35 to 39 Minutes | 21 | 6.8% |
| 40 to 44 Minutes | 26 | 8.4% |
| 45 to 59 Minutes | 23 | 7.4% |
| 60 to 89 Minutes | 4 | 1.3% |
| 90 or more Minutes | 0 | 0.0% |
Commute Time by Sex in Wadsworth
The most common commute times in Wadsworth are 15 to 19 minutes (45 commuters, 24.7%) for males and 5 to 9 minutes (38 commuters, 29.5%) for females.
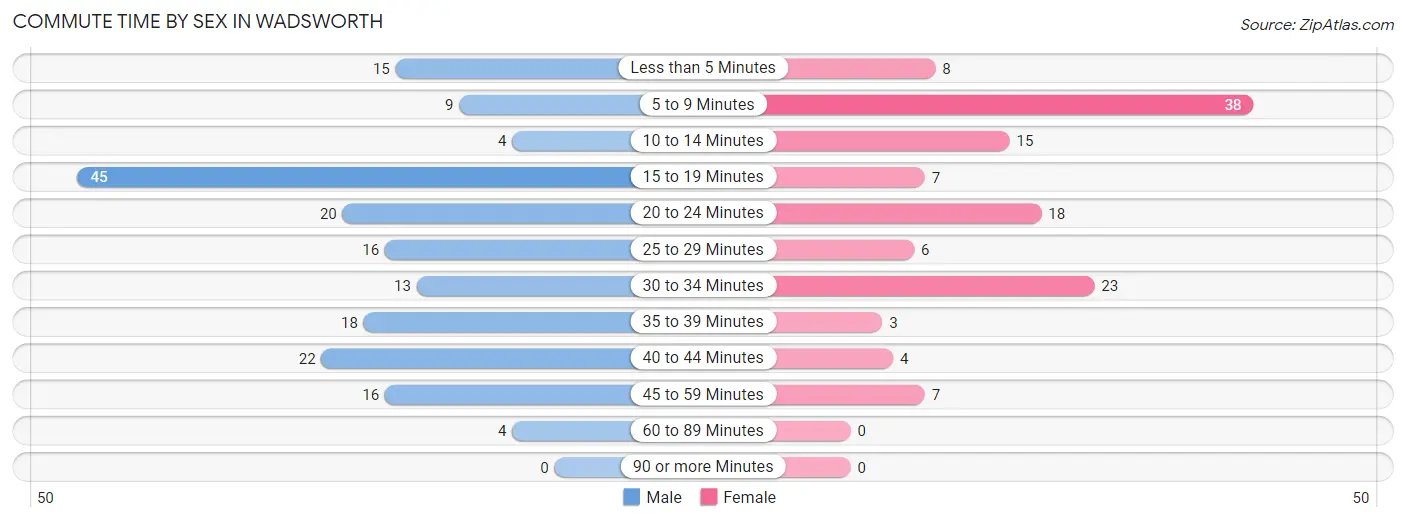
| Commute Time | Male | Female |
| Less than 5 Minutes | 15 (8.2%) | 8 (6.2%) |
| 5 to 9 Minutes | 9 (5.0%) | 38 (29.5%) |
| 10 to 14 Minutes | 4 (2.2%) | 15 (11.6%) |
| 15 to 19 Minutes | 45 (24.7%) | 7 (5.4%) |
| 20 to 24 Minutes | 20 (11.0%) | 18 (14.0%) |
| 25 to 29 Minutes | 16 (8.8%) | 6 (4.6%) |
| 30 to 34 Minutes | 13 (7.1%) | 23 (17.8%) |
| 35 to 39 Minutes | 18 (9.9%) | 3 (2.3%) |
| 40 to 44 Minutes | 22 (12.1%) | 4 (3.1%) |
| 45 to 59 Minutes | 16 (8.8%) | 7 (5.4%) |
| 60 to 89 Minutes | 4 (2.2%) | 0 (0.0%) |
| 90 or more Minutes | 0 (0.0%) | 0 (0.0%) |
Time of Departure to Work by Sex in Wadsworth
The most frequent times of departure to work in Wadsworth are 12:00 AM to 4:59 AM (29, 15.9%) for males and 12:00 PM to 3:59 PM (24, 18.6%) for females.
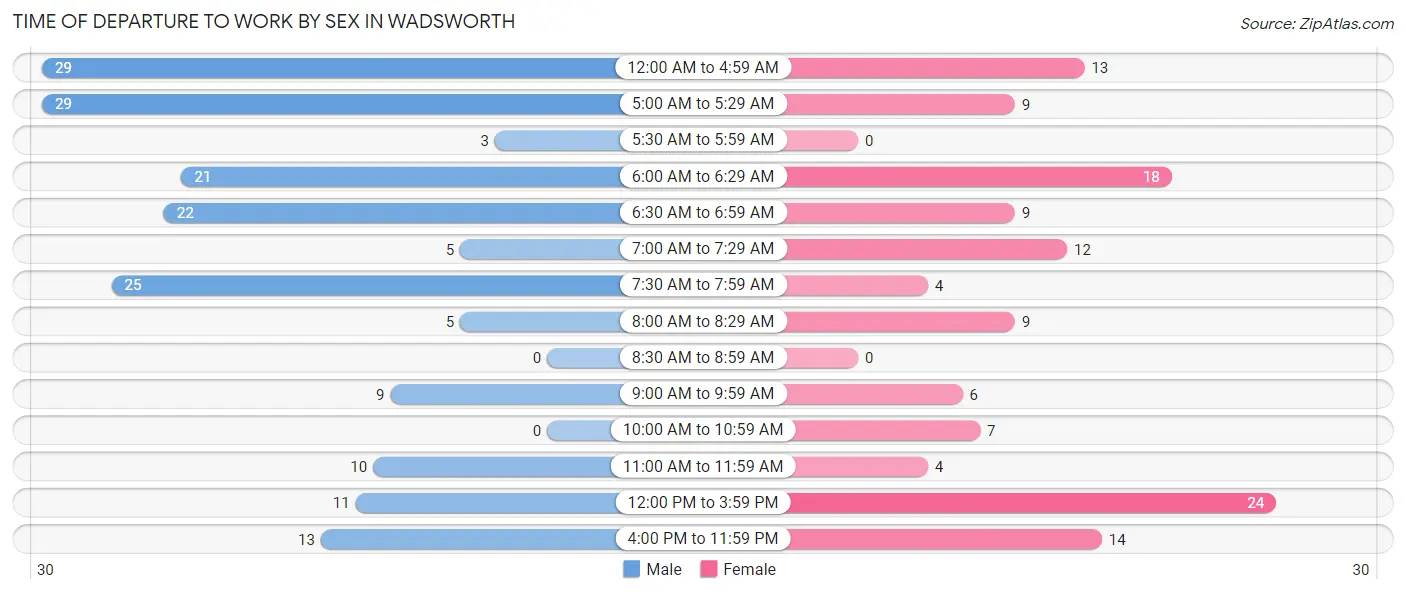
| Time of Departure | Male | Female |
| 12:00 AM to 4:59 AM | 29 (15.9%) | 13 (10.1%) |
| 5:00 AM to 5:29 AM | 29 (15.9%) | 9 (7.0%) |
| 5:30 AM to 5:59 AM | 3 (1.7%) | 0 (0.0%) |
| 6:00 AM to 6:29 AM | 21 (11.5%) | 18 (14.0%) |
| 6:30 AM to 6:59 AM | 22 (12.1%) | 9 (7.0%) |
| 7:00 AM to 7:29 AM | 5 (2.8%) | 12 (9.3%) |
| 7:30 AM to 7:59 AM | 25 (13.7%) | 4 (3.1%) |
| 8:00 AM to 8:29 AM | 5 (2.8%) | 9 (7.0%) |
| 8:30 AM to 8:59 AM | 0 (0.0%) | 0 (0.0%) |
| 9:00 AM to 9:59 AM | 9 (5.0%) | 6 (4.6%) |
| 10:00 AM to 10:59 AM | 0 (0.0%) | 7 (5.4%) |
| 11:00 AM to 11:59 AM | 10 (5.5%) | 4 (3.1%) |
| 12:00 PM to 3:59 PM | 11 (6.0%) | 24 (18.6%) |
| 4:00 PM to 11:59 PM | 13 (7.1%) | 14 (10.8%) |
| Total | 182 (100.0%) | 129 (100.0%) |
Housing Occupancy in Wadsworth
Occupancy by Ownership in Wadsworth
Of the total 258 dwellings in Wadsworth, owner-occupied units account for 142 (55.0%), while renter-occupied units make up 116 (45.0%).
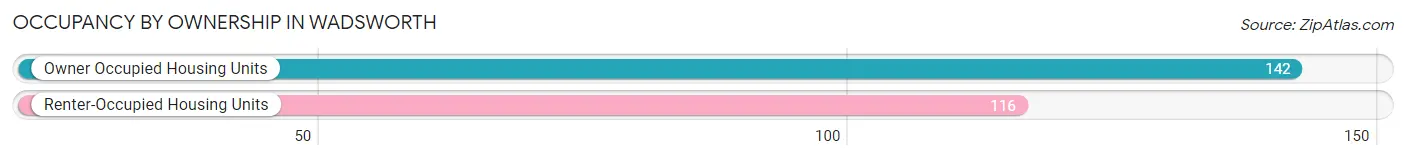
| Occupancy | # Housing Units | % Housing Units |
| Owner Occupied Housing Units | 142 | 55.0% |
| Renter-Occupied Housing Units | 116 | 45.0% |
| Total Occupied Housing Units | 258 | 100.0% |
Occupancy by Household Size in Wadsworth
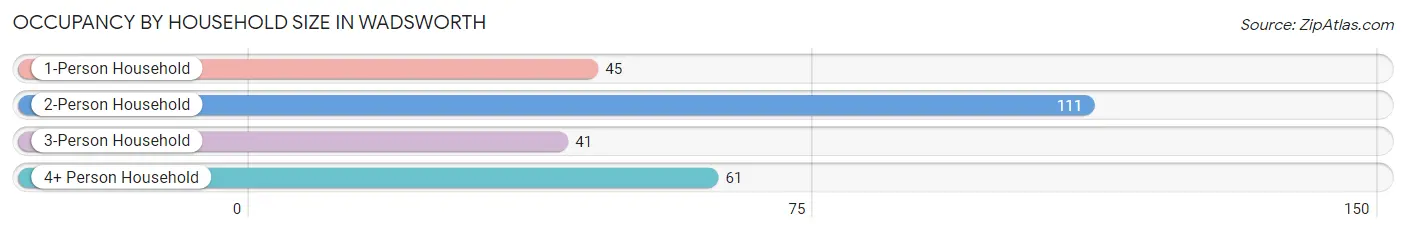
| Household Size | # Housing Units | % Housing Units |
| 1-Person Household | 45 | 17.4% |
| 2-Person Household | 111 | 43.0% |
| 3-Person Household | 41 | 15.9% |
| 4+ Person Household | 61 | 23.6% |
| Total Housing Units | 258 | 100.0% |
Occupancy by Ownership by Household Size in Wadsworth
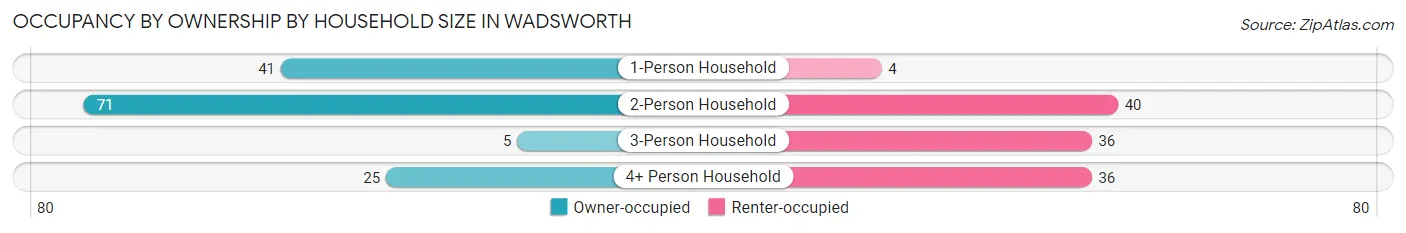
| Household Size | Owner-occupied | Renter-occupied |
| 1-Person Household | 41 (91.1%) | 4 (8.9%) |
| 2-Person Household | 71 (64.0%) | 40 (36.0%) |
| 3-Person Household | 5 (12.2%) | 36 (87.8%) |
| 4+ Person Household | 25 (41.0%) | 36 (59.0%) |
| Total Housing Units | 142 (55.0%) | 116 (45.0%) |
Occupancy by Educational Attainment in Wadsworth
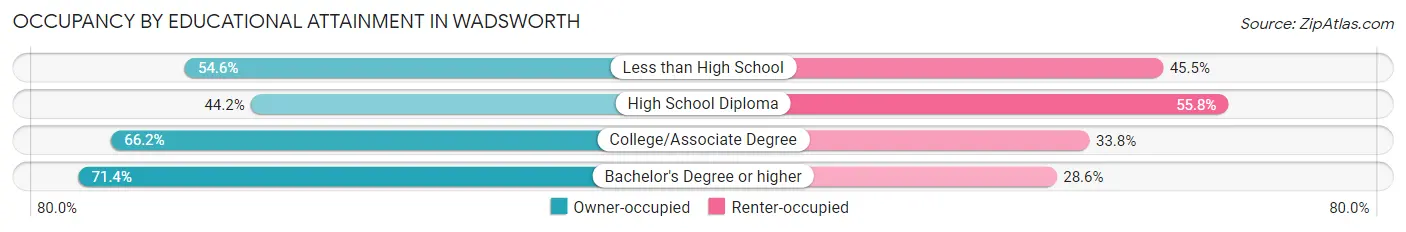
| Household Size | Owner-occupied | Renter-occupied |
| Less than High School | 18 (54.5%) | 15 (45.5%) |
| High School Diploma | 53 (44.2%) | 67 (55.8%) |
| College/Associate Degree | 51 (66.2%) | 26 (33.8%) |
| Bachelor's Degree or higher | 20 (71.4%) | 8 (28.6%) |
Occupancy by Age of Householder in Wadsworth
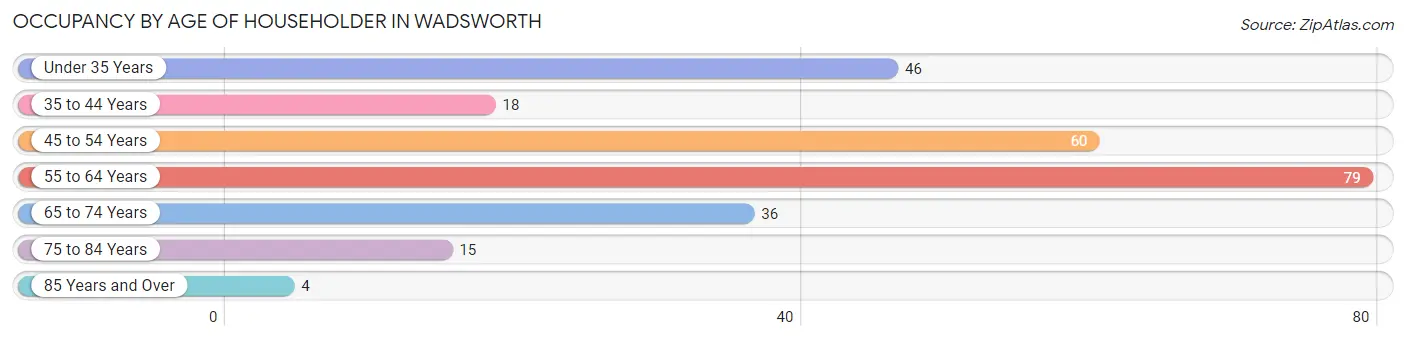
| Age Bracket | # Households | % Households |
| Under 35 Years | 46 | 17.8% |
| 35 to 44 Years | 18 | 7.0% |
| 45 to 54 Years | 60 | 23.3% |
| 55 to 64 Years | 79 | 30.6% |
| 65 to 74 Years | 36 | 14.0% |
| 75 to 84 Years | 15 | 5.8% |
| 85 Years and Over | 4 | 1.5% |
| Total | 258 | 100.0% |
Housing Finances in Wadsworth
Median Income by Occupancy in Wadsworth
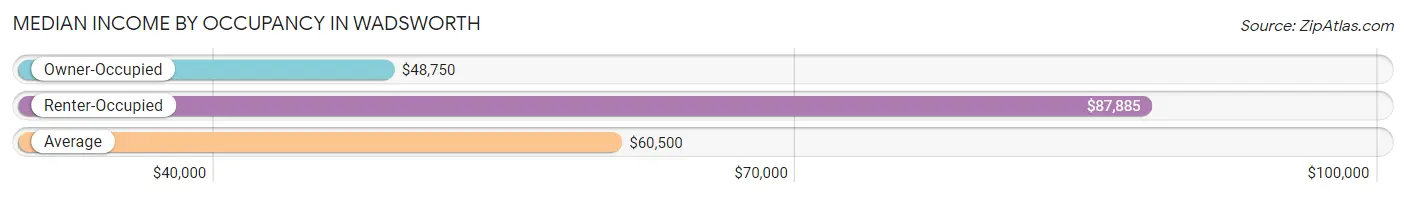
| Occupancy Type | # Households | Median Income |
| Owner-Occupied | 142 (55.0%) | $48,750 |
| Renter-Occupied | 116 (45.0%) | $87,885 |
| Average | 258 (100.0%) | $60,500 |
Occupancy by Householder Income Bracket in Wadsworth
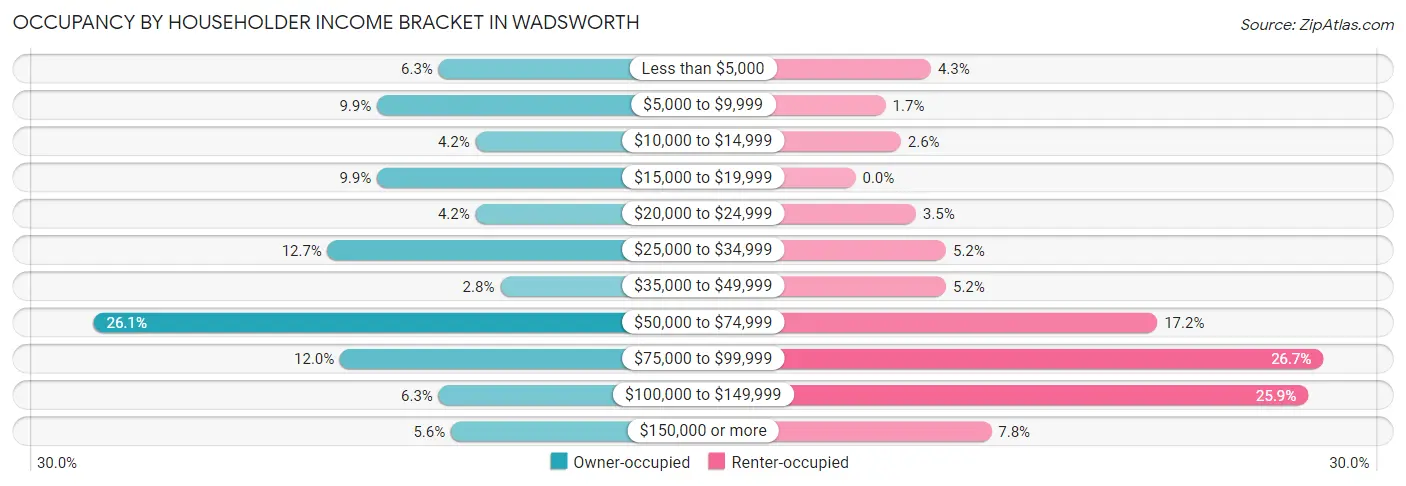
| Income Bracket | Owner-occupied | Renter-occupied |
| Less than $5,000 | 9 (6.3%) | 5 (4.3%) |
| $5,000 to $9,999 | 14 (9.9%) | 2 (1.7%) |
| $10,000 to $14,999 | 6 (4.2%) | 3 (2.6%) |
| $15,000 to $19,999 | 14 (9.9%) | 0 (0.0%) |
| $20,000 to $24,999 | 6 (4.2%) | 4 (3.5%) |
| $25,000 to $34,999 | 18 (12.7%) | 6 (5.2%) |
| $35,000 to $49,999 | 4 (2.8%) | 6 (5.2%) |
| $50,000 to $74,999 | 37 (26.1%) | 20 (17.2%) |
| $75,000 to $99,999 | 17 (12.0%) | 31 (26.7%) |
| $100,000 to $149,999 | 9 (6.3%) | 30 (25.9%) |
| $150,000 or more | 8 (5.6%) | 9 (7.8%) |
| Total | 142 (100.0%) | 116 (100.0%) |
Monthly Housing Cost Tiers in Wadsworth
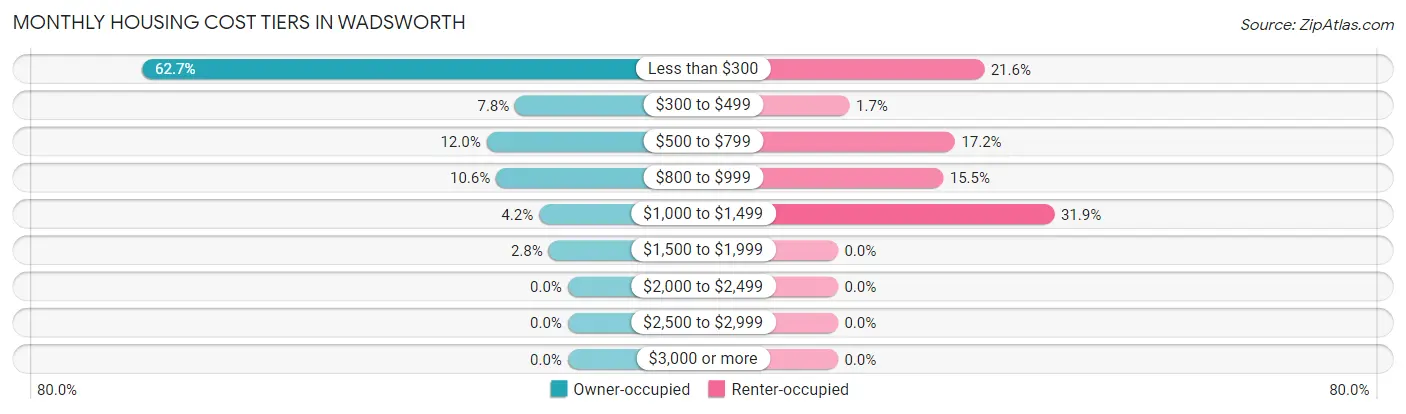
| Monthly Cost | Owner-occupied | Renter-occupied |
| Less than $300 | 89 (62.7%) | 25 (21.5%) |
| $300 to $499 | 11 (7.7%) | 2 (1.7%) |
| $500 to $799 | 17 (12.0%) | 20 (17.2%) |
| $800 to $999 | 15 (10.6%) | 18 (15.5%) |
| $1,000 to $1,499 | 6 (4.2%) | 37 (31.9%) |
| $1,500 to $1,999 | 4 (2.8%) | 0 (0.0%) |
| $2,000 to $2,499 | 0 (0.0%) | 0 (0.0%) |
| $2,500 to $2,999 | 0 (0.0%) | 0 (0.0%) |
| $3,000 or more | 0 (0.0%) | 0 (0.0%) |
| Total | 142 (100.0%) | 116 (100.0%) |
Physical Housing Characteristics in Wadsworth
Housing Structures in Wadsworth
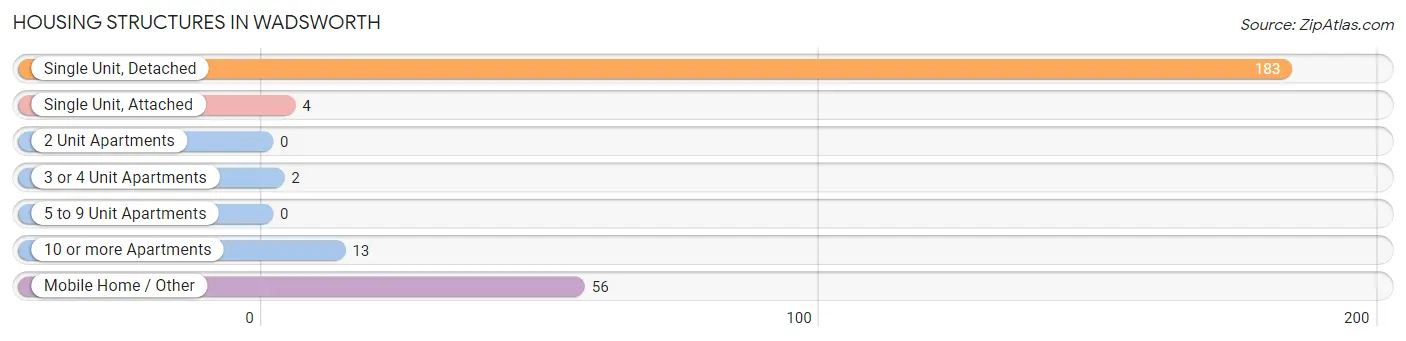
| Structure Type | # Housing Units | % Housing Units |
| Single Unit, Detached | 183 | 70.9% |
| Single Unit, Attached | 4 | 1.5% |
| 2 Unit Apartments | 0 | 0.0% |
| 3 or 4 Unit Apartments | 2 | 0.8% |
| 5 to 9 Unit Apartments | 0 | 0.0% |
| 10 or more Apartments | 13 | 5.0% |
| Mobile Home / Other | 56 | 21.7% |
| Total | 258 | 100.0% |
Housing Structures by Occupancy in Wadsworth
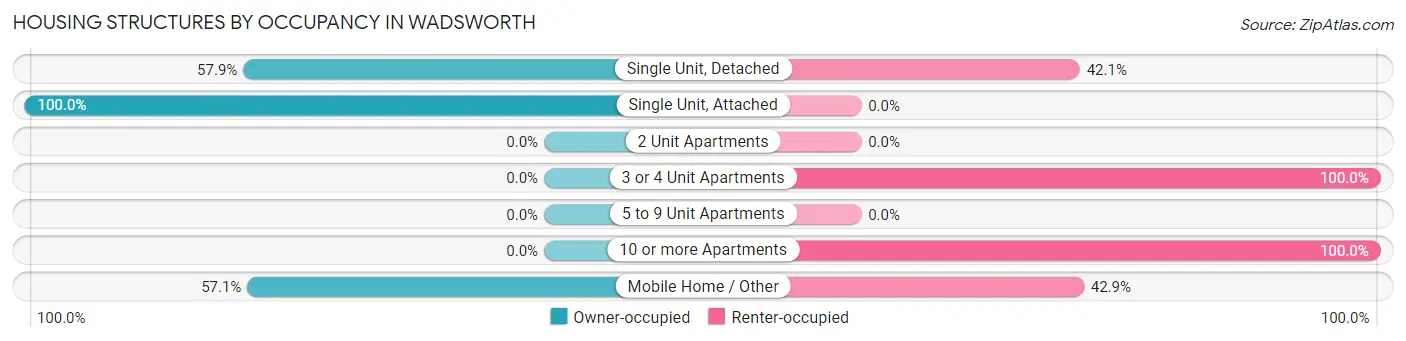
| Structure Type | Owner-occupied | Renter-occupied |
| Single Unit, Detached | 106 (57.9%) | 77 (42.1%) |
| Single Unit, Attached | 4 (100.0%) | 0 (0.0%) |
| 2 Unit Apartments | 0 (0.0%) | 0 (0.0%) |
| 3 or 4 Unit Apartments | 0 (0.0%) | 2 (100.0%) |
| 5 to 9 Unit Apartments | 0 (0.0%) | 0 (0.0%) |
| 10 or more Apartments | 0 (0.0%) | 13 (100.0%) |
| Mobile Home / Other | 32 (57.1%) | 24 (42.9%) |
| Total | 142 (55.0%) | 116 (45.0%) |
Housing Structures by Number of Rooms in Wadsworth
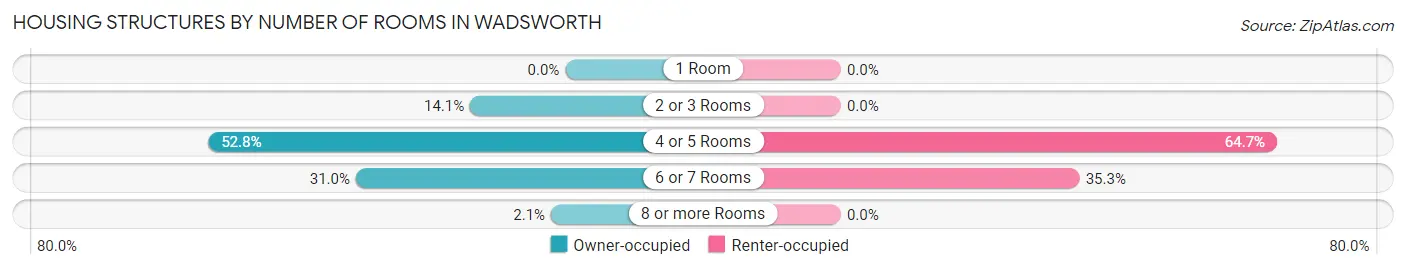
| Number of Rooms | Owner-occupied | Renter-occupied |
| 1 Room | 0 (0.0%) | 0 (0.0%) |
| 2 or 3 Rooms | 20 (14.1%) | 0 (0.0%) |
| 4 or 5 Rooms | 75 (52.8%) | 75 (64.7%) |
| 6 or 7 Rooms | 44 (31.0%) | 41 (35.3%) |
| 8 or more Rooms | 3 (2.1%) | 0 (0.0%) |
| Total | 142 (100.0%) | 116 (100.0%) |
Housing Structure by Heating Type in Wadsworth
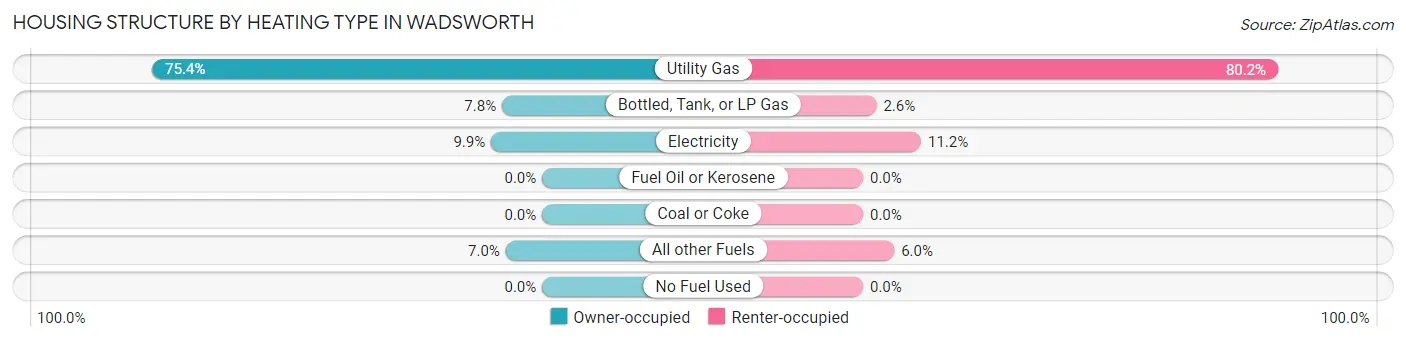
| Heating Type | Owner-occupied | Renter-occupied |
| Utility Gas | 107 (75.3%) | 93 (80.2%) |
| Bottled, Tank, or LP Gas | 11 (7.7%) | 3 (2.6%) |
| Electricity | 14 (9.9%) | 13 (11.2%) |
| Fuel Oil or Kerosene | 0 (0.0%) | 0 (0.0%) |
| Coal or Coke | 0 (0.0%) | 0 (0.0%) |
| All other Fuels | 10 (7.0%) | 7 (6.0%) |
| No Fuel Used | 0 (0.0%) | 0 (0.0%) |
| Total | 142 (100.0%) | 116 (100.0%) |
Household Vehicle Usage in Wadsworth
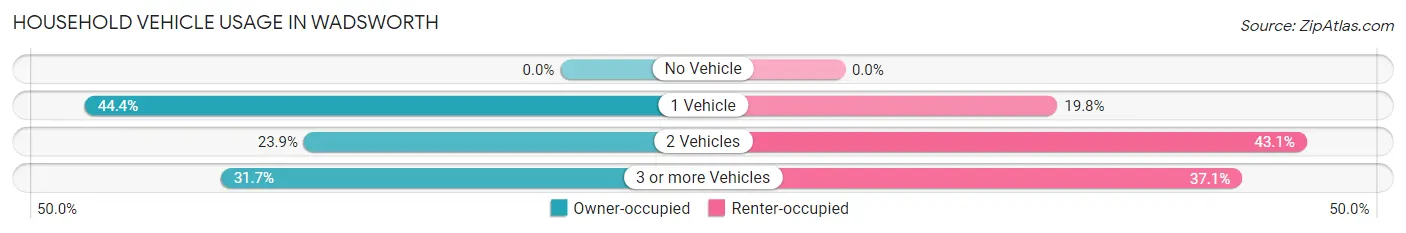
| Vehicles per Household | Owner-occupied | Renter-occupied |
| No Vehicle | 0 (0.0%) | 0 (0.0%) |
| 1 Vehicle | 63 (44.4%) | 23 (19.8%) |
| 2 Vehicles | 34 (23.9%) | 50 (43.1%) |
| 3 or more Vehicles | 45 (31.7%) | 43 (37.1%) |
| Total | 142 (100.0%) | 116 (100.0%) |
Real Estate & Mortgages in Wadsworth
Real Estate and Mortgage Overview in Wadsworth
| Characteristic | Without Mortgage | With Mortgage |
| Housing Units | 113 | 29 |
| Median Property Value | $97,500 | $0 |
| Median Household Income | $30,568 | $0 |
| Monthly Housing Costs | $215 | $0 |
| Real Estate Taxes | $199 | $3 |
Property Value by Mortgage Status in Wadsworth
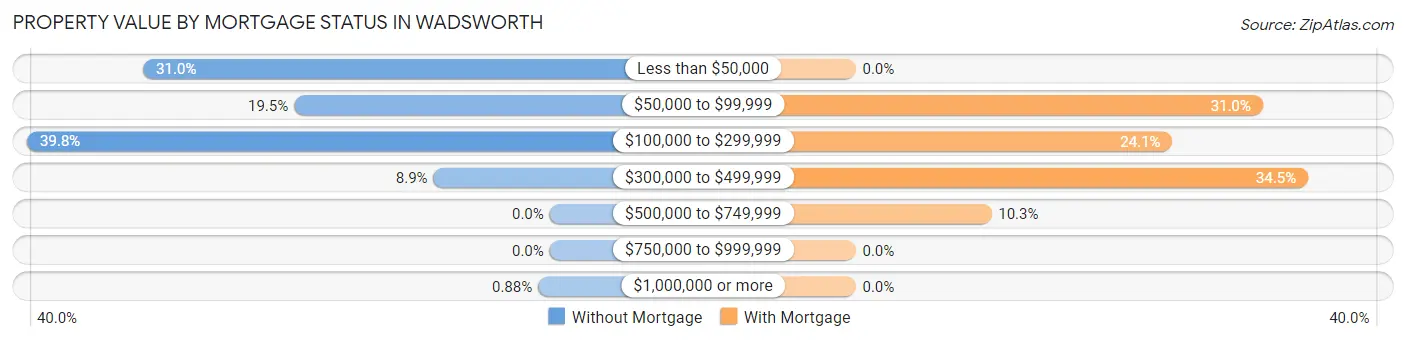
| Property Value | Without Mortgage | With Mortgage |
| Less than $50,000 | 35 (31.0%) | 0 (0.0%) |
| $50,000 to $99,999 | 22 (19.5%) | 9 (31.0%) |
| $100,000 to $299,999 | 45 (39.8%) | 7 (24.1%) |
| $300,000 to $499,999 | 10 (8.8%) | 10 (34.5%) |
| $500,000 to $749,999 | 0 (0.0%) | 3 (10.3%) |
| $750,000 to $999,999 | 0 (0.0%) | 0 (0.0%) |
| $1,000,000 or more | 1 (0.9%) | 0 (0.0%) |
| Total | 113 (100.0%) | 29 (100.0%) |
Household Income by Mortgage Status in Wadsworth
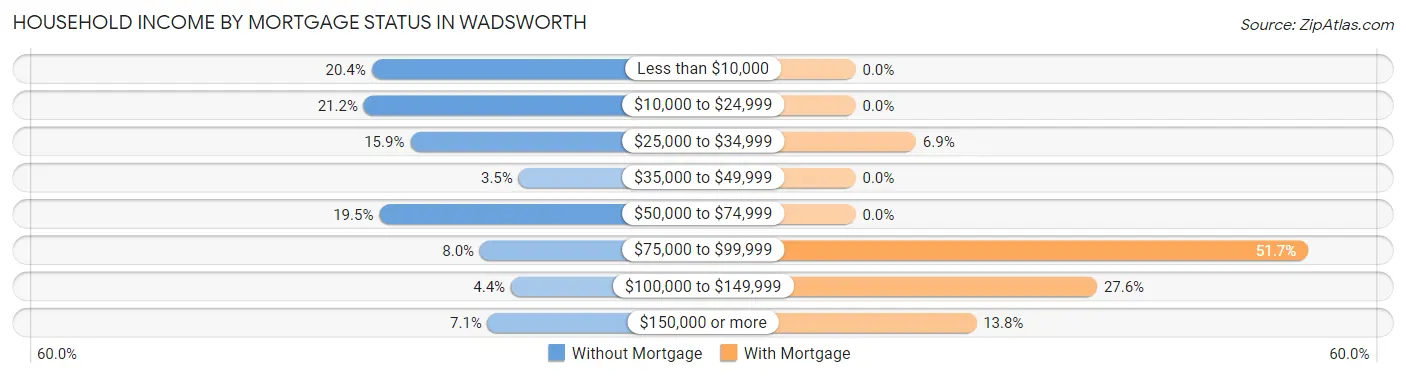
| Household Income | Without Mortgage | With Mortgage |
| Less than $10,000 | 23 (20.3%) | 0 (0.0%) |
| $10,000 to $24,999 | 24 (21.2%) | 0 (0.0%) |
| $25,000 to $34,999 | 18 (15.9%) | 2 (6.9%) |
| $35,000 to $49,999 | 4 (3.5%) | 0 (0.0%) |
| $50,000 to $74,999 | 22 (19.5%) | 0 (0.0%) |
| $75,000 to $99,999 | 9 (8.0%) | 15 (51.7%) |
| $100,000 to $149,999 | 5 (4.4%) | 8 (27.6%) |
| $150,000 or more | 8 (7.1%) | 4 (13.8%) |
| Total | 113 (100.0%) | 29 (100.0%) |
Property Value to Household Income Ratio in Wadsworth
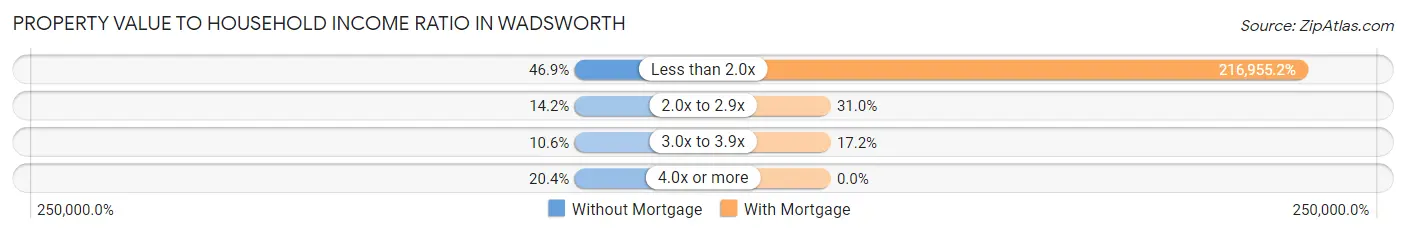
| Value-to-Income Ratio | Without Mortgage | With Mortgage |
| Less than 2.0x | 53 (46.9%) | 62,917 (216,955.2%) |
| 2.0x to 2.9x | 16 (14.2%) | 9 (31.0%) |
| 3.0x to 3.9x | 12 (10.6%) | 5 (17.2%) |
| 4.0x or more | 23 (20.3%) | 0 (0.0%) |
| Total | 113 (100.0%) | 29 (100.0%) |
Real Estate Taxes by Mortgage Status in Wadsworth
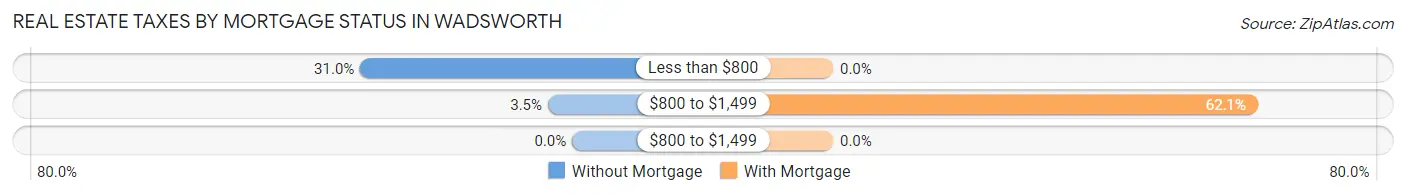
| Property Taxes | Without Mortgage | With Mortgage |
| Less than $800 | 35 (31.0%) | 0 (0.0%) |
| $800 to $1,499 | 4 (3.5%) | 18 (62.1%) |
| $800 to $1,499 | 0 (0.0%) | 0 (0.0%) |
| Total | 113 (100.0%) | 29 (100.0%) |
Health & Disability in Wadsworth
Health Insurance Coverage by Age in Wadsworth
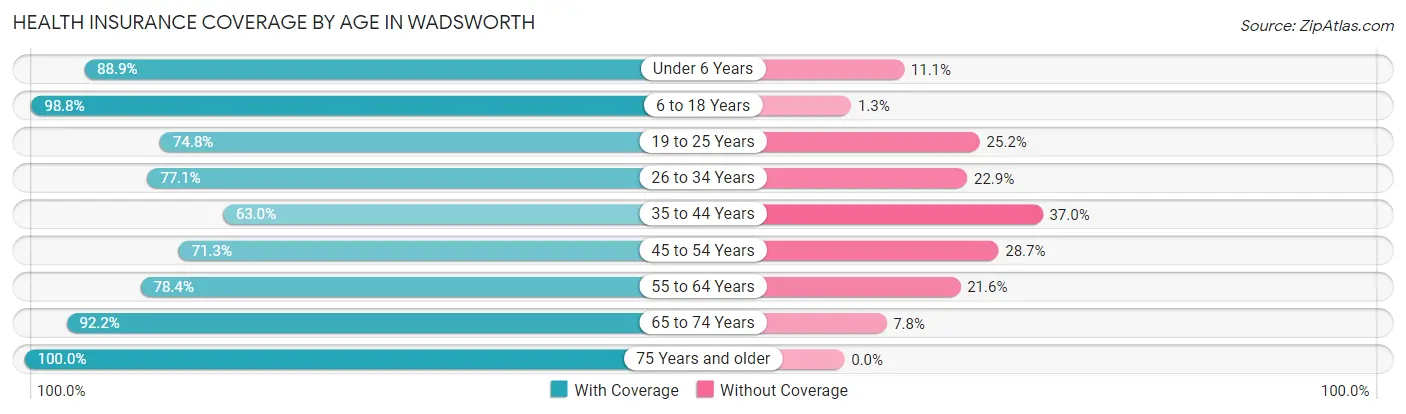
| Age Bracket | With Coverage | Without Coverage |
| Under 6 Years | 48 (88.9%) | 6 (11.1%) |
| 6 to 18 Years | 79 (98.8%) | 1 (1.3%) |
| 19 to 25 Years | 77 (74.8%) | 26 (25.2%) |
| 26 to 34 Years | 64 (77.1%) | 19 (22.9%) |
| 35 to 44 Years | 29 (63.0%) | 17 (37.0%) |
| 45 to 54 Years | 67 (71.3%) | 27 (28.7%) |
| 55 to 64 Years | 116 (78.4%) | 32 (21.6%) |
| 65 to 74 Years | 59 (92.2%) | 5 (7.8%) |
| 75 Years and older | 44 (100.0%) | 0 (0.0%) |
| Total | 583 (81.4%) | 133 (18.6%) |
Health Insurance Coverage by Citizenship Status in Wadsworth
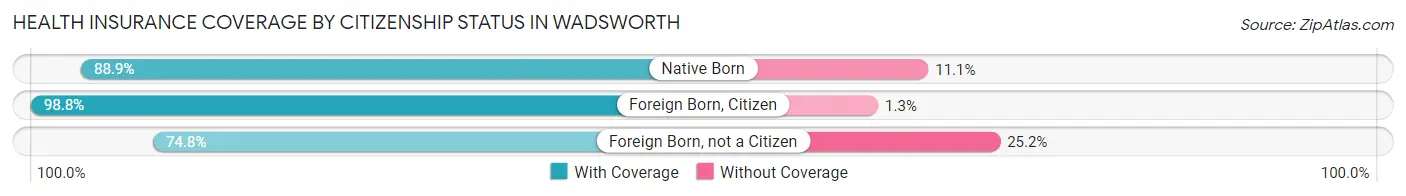
| Citizenship Status | With Coverage | Without Coverage |
| Native Born | 48 (88.9%) | 6 (11.1%) |
| Foreign Born, Citizen | 79 (98.8%) | 1 (1.3%) |
| Foreign Born, not a Citizen | 77 (74.8%) | 26 (25.2%) |
Health Insurance Coverage by Household Income in Wadsworth
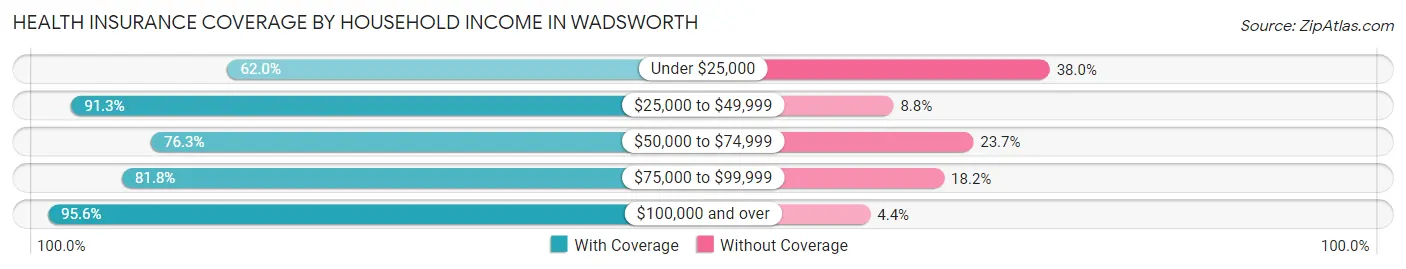
| Household Income | With Coverage | Without Coverage |
| Under $25,000 | 75 (62.0%) | 46 (38.0%) |
| $25,000 to $49,999 | 73 (91.2%) | 7 (8.7%) |
| $50,000 to $74,999 | 132 (76.3%) | 41 (23.7%) |
| $75,000 to $99,999 | 121 (81.8%) | 27 (18.2%) |
| $100,000 and over | 173 (95.6%) | 8 (4.4%) |
Public vs Private Health Insurance Coverage by Age in Wadsworth
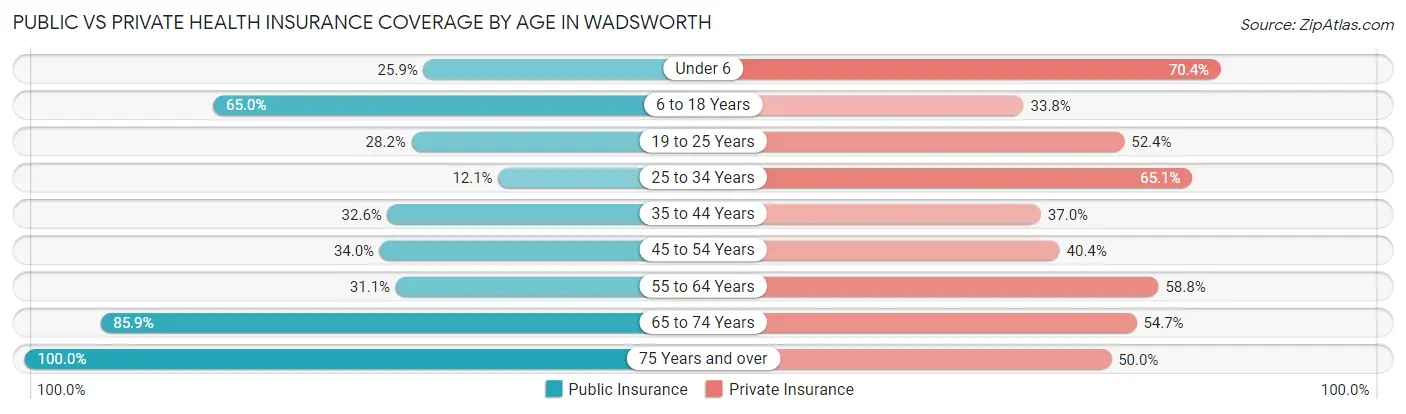
| Age Bracket | Public Insurance | Private Insurance |
| Under 6 | 14 (25.9%) | 38 (70.4%) |
| 6 to 18 Years | 52 (65.0%) | 27 (33.8%) |
| 19 to 25 Years | 29 (28.2%) | 54 (52.4%) |
| 25 to 34 Years | 10 (12.0%) | 54 (65.1%) |
| 35 to 44 Years | 15 (32.6%) | 17 (37.0%) |
| 45 to 54 Years | 32 (34.0%) | 38 (40.4%) |
| 55 to 64 Years | 46 (31.1%) | 87 (58.8%) |
| 65 to 74 Years | 55 (85.9%) | 35 (54.7%) |
| 75 Years and over | 44 (100.0%) | 22 (50.0%) |
| Total | 297 (41.5%) | 372 (52.0%) |
Disability Status by Sex by Age in Wadsworth
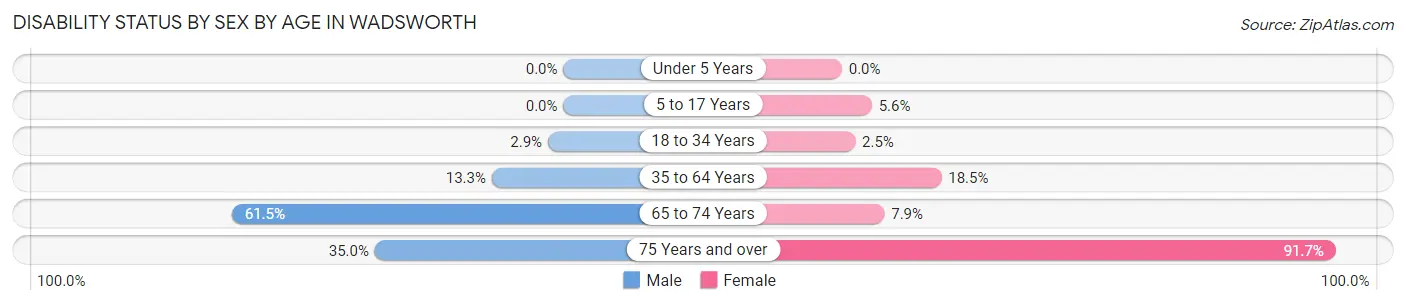
| Age Bracket | Male | Female |
| Under 5 Years | 0 (0.0%) | 0 (0.0%) |
| 5 to 17 Years | 0 (0.0%) | 1 (5.6%) |
| 18 to 34 Years | 3 (2.9%) | 2 (2.5%) |
| 35 to 64 Years | 21 (13.3%) | 24 (18.5%) |
| 65 to 74 Years | 16 (61.5%) | 3 (7.9%) |
| 75 Years and over | 7 (35.0%) | 22 (91.7%) |
Disability Class by Sex by Age in Wadsworth
Disability Class: Hearing Difficulty
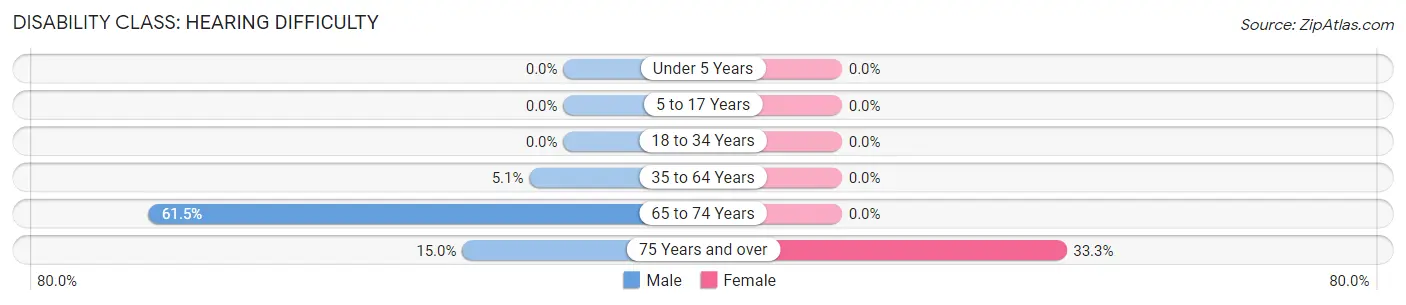
| Age Bracket | Male | Female |
| Under 5 Years | 0 (0.0%) | 0 (0.0%) |
| 5 to 17 Years | 0 (0.0%) | 0 (0.0%) |
| 18 to 34 Years | 0 (0.0%) | 0 (0.0%) |
| 35 to 64 Years | 8 (5.1%) | 0 (0.0%) |
| 65 to 74 Years | 16 (61.5%) | 0 (0.0%) |
| 75 Years and over | 3 (15.0%) | 8 (33.3%) |
Disability Class: Vision Difficulty
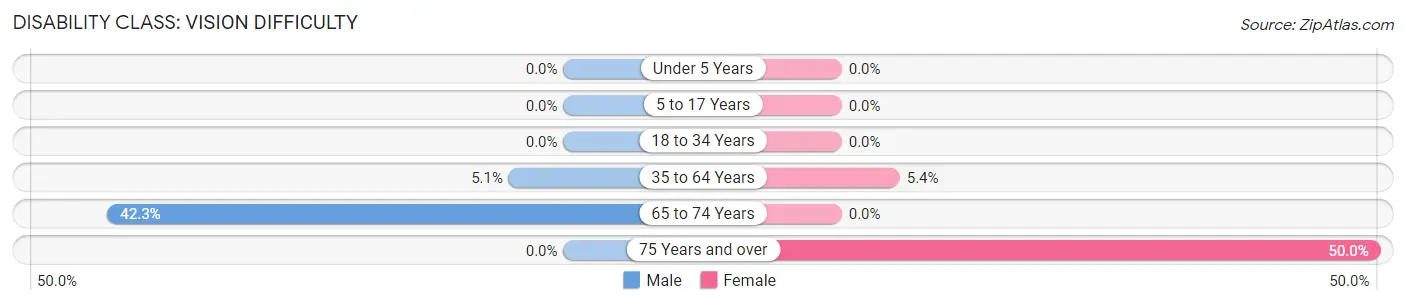
| Age Bracket | Male | Female |
| Under 5 Years | 0 (0.0%) | 0 (0.0%) |
| 5 to 17 Years | 0 (0.0%) | 0 (0.0%) |
| 18 to 34 Years | 0 (0.0%) | 0 (0.0%) |
| 35 to 64 Years | 8 (5.1%) | 7 (5.4%) |
| 65 to 74 Years | 11 (42.3%) | 0 (0.0%) |
| 75 Years and over | 0 (0.0%) | 12 (50.0%) |
Disability Class: Cognitive Difficulty
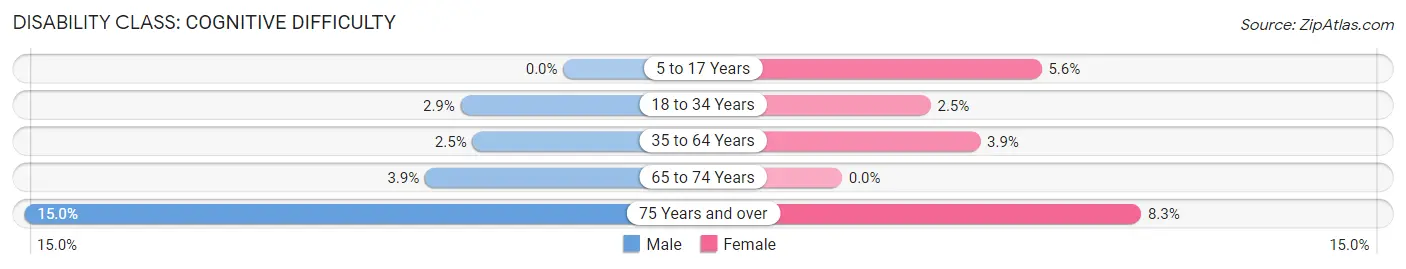
| Age Bracket | Male | Female |
| 5 to 17 Years | 0 (0.0%) | 1 (5.6%) |
| 18 to 34 Years | 3 (2.9%) | 2 (2.5%) |
| 35 to 64 Years | 4 (2.5%) | 5 (3.8%) |
| 65 to 74 Years | 1 (3.8%) | 0 (0.0%) |
| 75 Years and over | 3 (15.0%) | 2 (8.3%) |
Disability Class: Ambulatory Difficulty
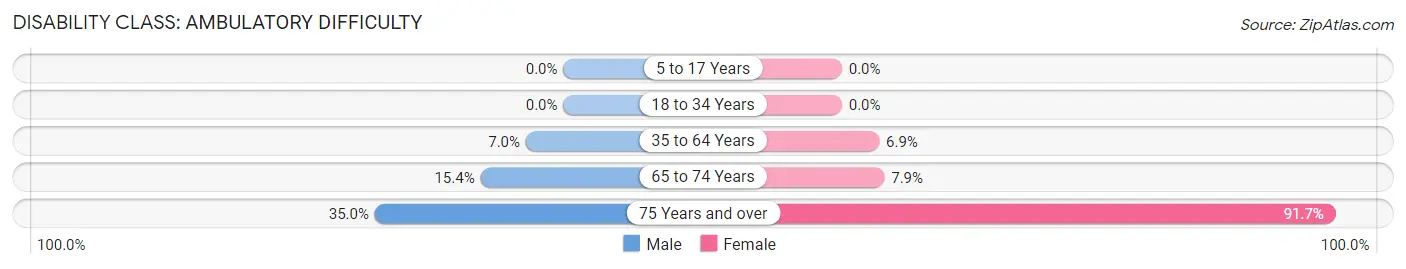
| Age Bracket | Male | Female |
| 5 to 17 Years | 0 (0.0%) | 0 (0.0%) |
| 18 to 34 Years | 0 (0.0%) | 0 (0.0%) |
| 35 to 64 Years | 11 (7.0%) | 9 (6.9%) |
| 65 to 74 Years | 4 (15.4%) | 3 (7.9%) |
| 75 Years and over | 7 (35.0%) | 22 (91.7%) |
Disability Class: Self-Care Difficulty
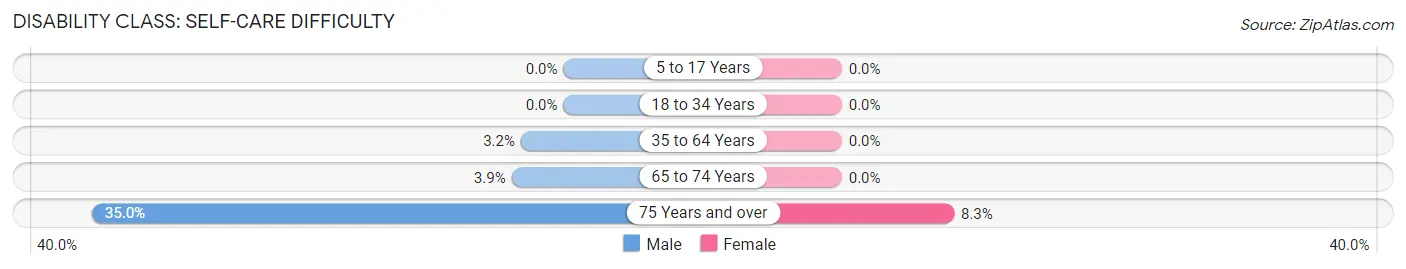
| Age Bracket | Male | Female |
| 5 to 17 Years | 0 (0.0%) | 0 (0.0%) |
| 18 to 34 Years | 0 (0.0%) | 0 (0.0%) |
| 35 to 64 Years | 5 (3.2%) | 0 (0.0%) |
| 65 to 74 Years | 1 (3.8%) | 0 (0.0%) |
| 75 Years and over | 7 (35.0%) | 2 (8.3%) |
Technology Access in Wadsworth
Computing Device Access in Wadsworth
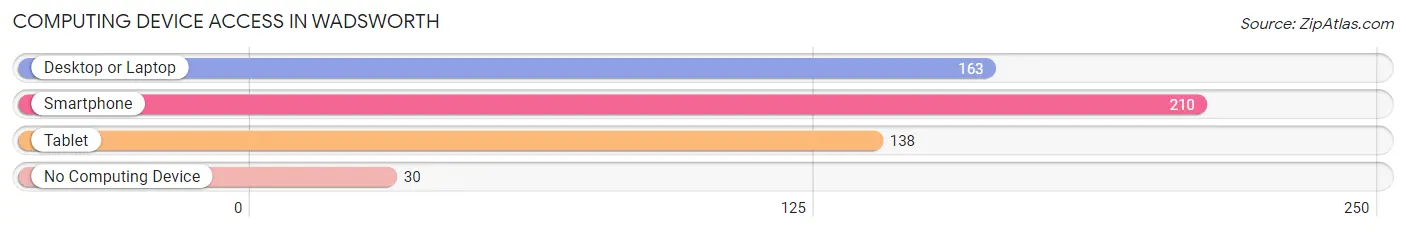
| Device Type | # Households | % Households |
| Desktop or Laptop | 163 | 63.2% |
| Smartphone | 210 | 81.4% |
| Tablet | 138 | 53.5% |
| No Computing Device | 30 | 11.6% |
| Total | 258 | 100.0% |
Internet Access in Wadsworth
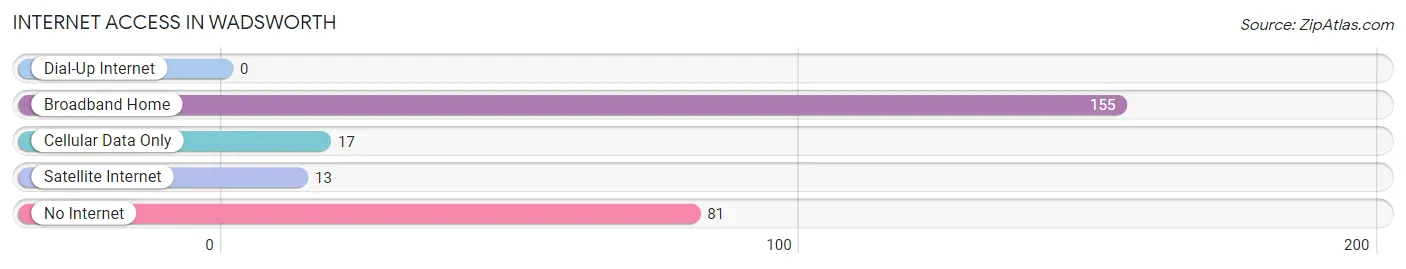
| Internet Type | # Households | % Households |
| Dial-Up Internet | 0 | 0.0% |
| Broadband Home | 155 | 60.1% |
| Cellular Data Only | 17 | 6.6% |
| Satellite Internet | 13 | 5.0% |
| No Internet | 81 | 31.4% |
| Total | 258 | 100.0% |
Wadsworth Summary
Wadsworth is a small unincorporated community located in Washoe County, Nevada, United States. It is situated on the western shore of Pyramid Lake, approximately 40 miles northeast of Reno. The population of Wadsworth was 1,093 at the 2010 census.
History
The area around Wadsworth has been inhabited for thousands of years by the Northern Paiute people. The first European settlers arrived in the area in the late 19th century, and the town of Wadsworth was established in 1868. The town was named after General James S. Wadsworth, a Union general in the American Civil War.
The town was originally a stop on the Central Pacific Railroad, and it served as a supply center for the nearby mining towns of Sutcliffe and Nixon. In the early 20th century, Wadsworth was a popular destination for tourists, who came to fish in Pyramid Lake and enjoy the area's natural beauty.
Geography
Wadsworth is located at the western edge of Pyramid Lake, at an elevation of 4,092 feet. The town is situated in the high desert of western Nevada, and is surrounded by mountains and desert terrain. The nearby Pyramid Lake Indian Reservation is home to the Northern Paiute people.
The climate in Wadsworth is semi-arid, with hot summers and cold winters. The average annual precipitation is 6.5 inches, and the average annual temperature is 54.3°F.
Economy
The economy of Wadsworth is largely based on tourism and recreation. The town is a popular destination for fishing, camping, and other outdoor activities. The nearby Pyramid Lake Indian Reservation is home to a number of businesses, including a casino, a hotel, and a golf course.
The town is also home to a number of small businesses, including restaurants, convenience stores, and gas stations. The nearby towns of Sutcliffe and Nixon are home to a number of mining operations, which provide employment opportunities for Wadsworth residents.
Demographics
As of the 2010 census, the population of Wadsworth was 1,093. The racial makeup of the town was 79.3% White, 0.7% African American, 0.7% Native American, 0.7% Asian, 0.1% Pacific Islander, 16.2% from other races, and 2.3% from two or more races. Hispanic or Latino of any race were 24.2% of the population.
The median household income in Wadsworth was $37,917, and the median family income was $41,250. The per capita income was $17,945. About 17.2% of families and 20.2% of the population were below the poverty line, including 28.3% of those under age 18 and 8.3% of those age 65 or over.
Common Questions
What is Per Capita Income in Wadsworth?
Per Capita income in Wadsworth is $25,951.
What is the Median Family Income in Wadsworth?
Median Family Income in Wadsworth is $67,917.
What is the Median Household income in Wadsworth?
Median Household Income in Wadsworth is $60,500.
What is Income or Wage Gap in Wadsworth?
Income or Wage Gap in Wadsworth is 36.6%.
Women in Wadsworth earn 63.4 cents for every dollar earned by a man.
What is Inequality or Gini Index in Wadsworth?
Inequality or Gini Index in Wadsworth is 0.42.
What is the Total Population of Wadsworth?
Total Population of Wadsworth is 716.
What is the Total Male Population of Wadsworth?
Total Male Population of Wadsworth is 382.
What is the Total Female Population of Wadsworth?
Total Female Population of Wadsworth is 334.
What is the Ratio of Males per 100 Females in Wadsworth?
There are 114.37 Males per 100 Females in Wadsworth.
What is the Ratio of Females per 100 Males in Wadsworth?
There are 87.43 Females per 100 Males in Wadsworth.
What is the Median Population Age in Wadsworth?
Median Population Age in Wadsworth is 43.7 Years.
What is the Average Family Size in Wadsworth
Average Family Size in Wadsworth is 3.0 People.
What is the Average Household Size in Wadsworth
Average Household Size in Wadsworth is 2.7 People.
How Large is the Labor Force in Wadsworth?
There are 379 People in the Labor Forcein in Wadsworth.
What is the Percentage of People in the Labor Force in Wadsworth?
63.4% of People are in the Labor Force in Wadsworth.
What is the Unemployment Rate in Wadsworth?
Unemployment Rate in Wadsworth is 11.1%.