Sun Valley, NV Map & Demographics
Sun Valley Map
Sun Valley Overview
$25,807
PER CAPITA INCOME
$74,914
AVG FAMILY INCOME
$71,471
AVG HOUSEHOLD INCOME
20.5%
WAGE / INCOME GAP [ % ]
79.5¢/ $1
WAGE / INCOME GAP [ $ ]
$7,789
FAMILY INCOME DEFICIT
0.39
INEQUALITY / GINI INDEX
22,775
TOTAL POPULATION
11,780
MALE POPULATION
10,995
FEMALE POPULATION
107.14
MALES / 100 FEMALES
93.34
FEMALES / 100 MALES
32.5
MEDIAN AGE
3.7
AVG FAMILY SIZE
3.3
AVG HOUSEHOLD SIZE
10,966
LABOR FORCE [ PEOPLE ]
64.4%
PERCENT IN LABOR FORCE
5.1%
UNEMPLOYMENT RATE
Sun Valley Zip Codes
Sun Valley Area Codes
Income in Sun Valley
Income Overview in Sun Valley
Per Capita Income in Sun Valley is $25,807, while median incomes of families and households are $74,914 and $71,471 respectively.
| Characteristic | Number | Measure |
| Per Capita Income | 22,775 | $25,807 |
| Median Family Income | 5,247 | $74,914 |
| Mean Family Income | 5,247 | $89,529 |
| Median Household Income | 6,920 | $71,471 |
| Mean Household Income | 6,920 | $83,893 |
| Income Deficit | 5,247 | $7,789 |
| Wage / Income Gap (%) | 22,775 | 20.55% |
| Wage / Income Gap ($) | 22,775 | 79.45¢ per $1 |
| Gini / Inequality Index | 22,775 | 0.39 |
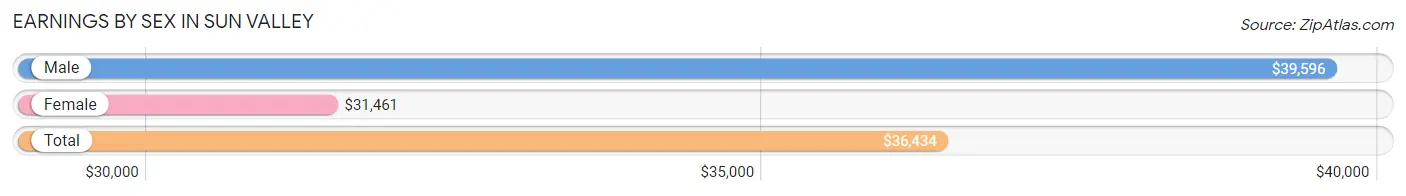
Earnings by Sex in Sun Valley
Average Earnings in Sun Valley are $36,434, $39,596 for men and $31,461 for women, a difference of 20.5%.
| Sex | Number | Average Earnings |
| Male | 6,580 (56.8%) | $39,596 |
| Female | 5,013 (43.2%) | $31,461 |
| Total | 11,593 (100.0%) | $36,434 |
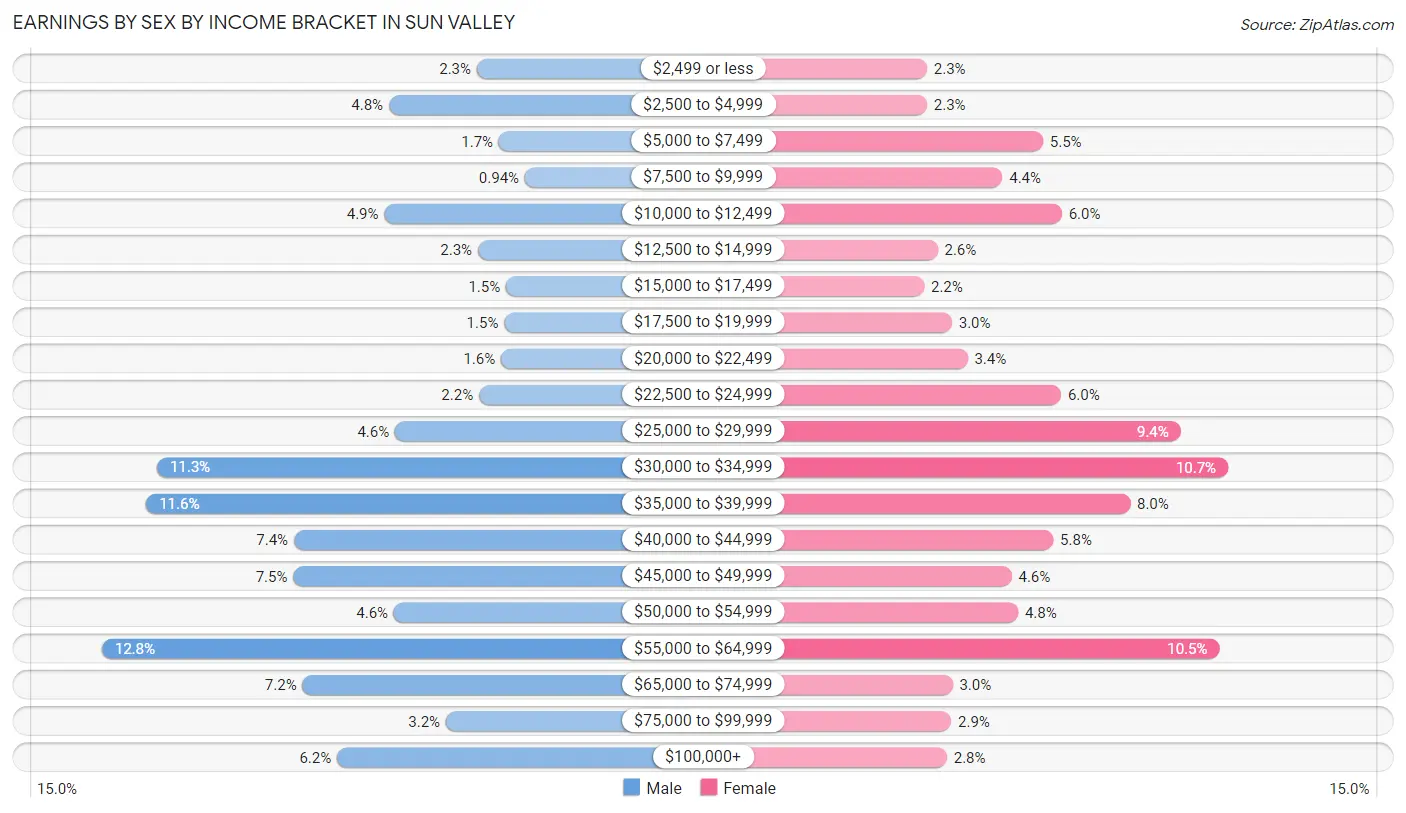
Earnings by Sex by Income Bracket in Sun Valley
The most common earnings brackets in Sun Valley are $55,000 to $64,999 for men (844 | 12.8%) and $30,000 to $34,999 for women (537 | 10.7%).
| Income | Male | Female |
| $2,499 or less | 151 (2.3%) | 113 (2.2%) |
| $2,500 to $4,999 | 313 (4.8%) | 113 (2.2%) |
| $5,000 to $7,499 | 110 (1.7%) | 276 (5.5%) |
| $7,500 to $9,999 | 62 (0.9%) | 219 (4.4%) |
| $10,000 to $12,499 | 322 (4.9%) | 303 (6.0%) |
| $12,500 to $14,999 | 149 (2.3%) | 128 (2.5%) |
| $15,000 to $17,499 | 97 (1.5%) | 109 (2.2%) |
| $17,500 to $19,999 | 100 (1.5%) | 148 (2.9%) |
| $20,000 to $22,499 | 106 (1.6%) | 170 (3.4%) |
| $22,500 to $24,999 | 147 (2.2%) | 302 (6.0%) |
| $25,000 to $29,999 | 302 (4.6%) | 470 (9.4%) |
| $30,000 to $34,999 | 742 (11.3%) | 537 (10.7%) |
| $35,000 to $39,999 | 762 (11.6%) | 399 (8.0%) |
| $40,000 to $44,999 | 489 (7.4%) | 291 (5.8%) |
| $45,000 to $49,999 | 490 (7.4%) | 232 (4.6%) |
| $50,000 to $54,999 | 304 (4.6%) | 241 (4.8%) |
| $55,000 to $64,999 | 844 (12.8%) | 525 (10.5%) |
| $65,000 to $74,999 | 473 (7.2%) | 149 (3.0%) |
| $75,000 to $99,999 | 208 (3.2%) | 147 (2.9%) |
| $100,000+ | 409 (6.2%) | 141 (2.8%) |
| Total | 6,580 (100.0%) | 5,013 (100.0%) |
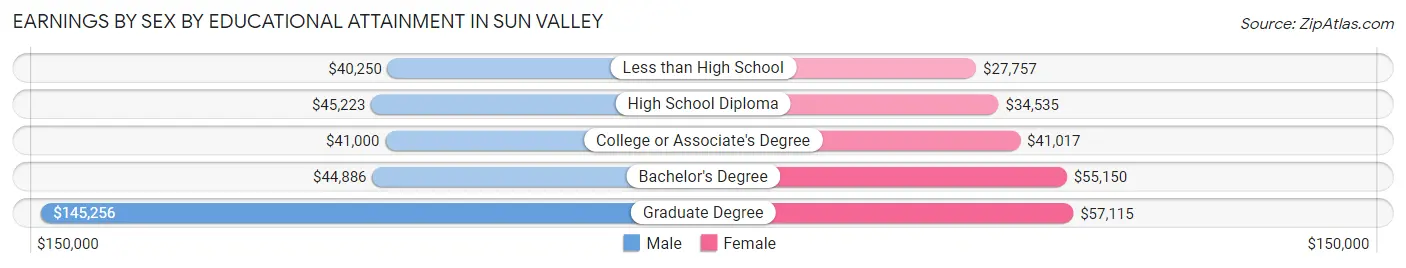
Earnings by Sex by Educational Attainment in Sun Valley
Average earnings in Sun Valley are $43,341 for men and $34,559 for women, a difference of 20.3%. Men with an educational attainment of graduate degree enjoy the highest average annual earnings of $145,256, while those with less than high school education earn the least with $40,250. Women with an educational attainment of graduate degree earn the most with the average annual earnings of $57,115, while those with less than high school education have the smallest earnings of $27,757.
| Educational Attainment | Male Income | Female Income |
| Less than High School | $40,250 | $27,757 |
| High School Diploma | $45,223 | $34,535 |
| College or Associate's Degree | $41,000 | $41,017 |
| Bachelor's Degree | $44,886 | $55,150 |
| Graduate Degree | $145,256 | $57,115 |
| Total | $43,341 | $34,559 |
Family Income in Sun Valley
Family Income Brackets in Sun Valley
According to the Sun Valley family income data, there are 1,286 families falling into the $100,000 to $149,999 income range, which is the most common income bracket and makes up 24.5% of all families. Conversely, the less than $10,000 income bracket is the least frequent group with only 42 families (0.8%) belonging to this category.
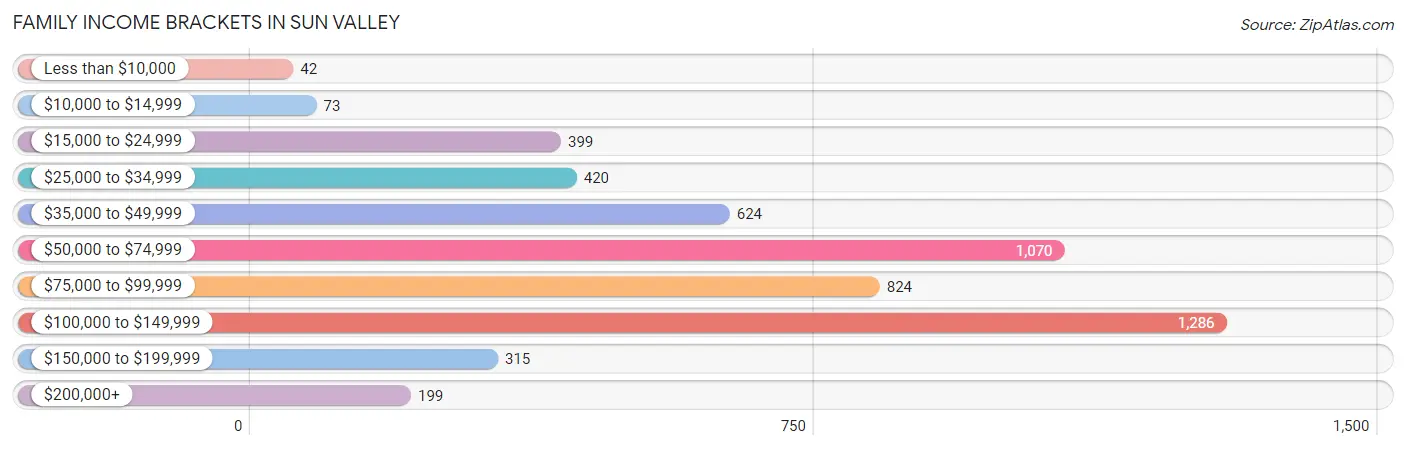
| Income Bracket | # Families | % Families |
| Less than $10,000 | 42 | 0.8% |
| $10,000 to $14,999 | 73 | 1.4% |
| $15,000 to $24,999 | 399 | 7.6% |
| $25,000 to $34,999 | 420 | 8.0% |
| $35,000 to $49,999 | 624 | 11.9% |
| $50,000 to $74,999 | 1,070 | 20.4% |
| $75,000 to $99,999 | 824 | 15.7% |
| $100,000 to $149,999 | 1,286 | 24.5% |
| $150,000 to $199,999 | 315 | 6.0% |
| $200,000+ | 199 | 3.8% |
Family Income by Famaliy Size in Sun Valley
7+ person families (399 | 7.6%) account for the highest median family income in Sun Valley with $106,734 per family, while 2-person families (1,438 | 27.4%) have the highest median income of $32,375 per family member.
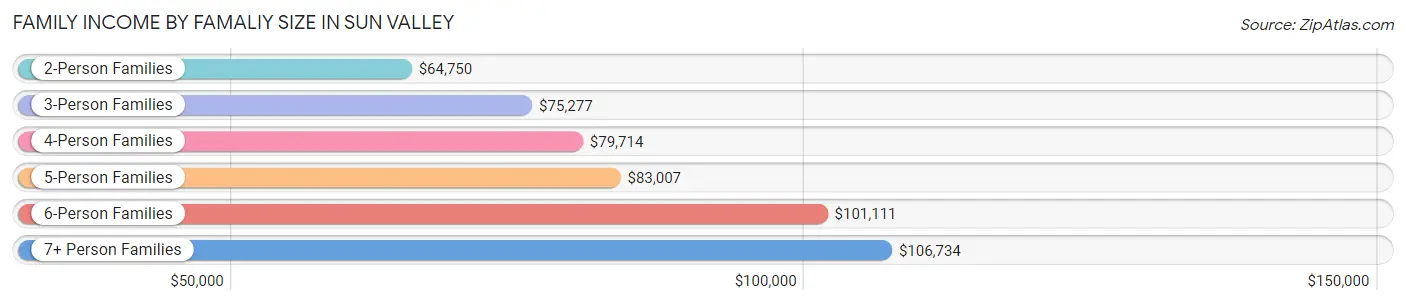
| Income Bracket | # Families | Median Income |
| 2-Person Families | 1,438 (27.4%) | $64,750 |
| 3-Person Families | 1,355 (25.8%) | $75,277 |
| 4-Person Families | 964 (18.4%) | $79,714 |
| 5-Person Families | 763 (14.5%) | $83,007 |
| 6-Person Families | 328 (6.2%) | $101,111 |
| 7+ Person Families | 399 (7.6%) | $106,734 |
| Total | 5,247 (100.0%) | $74,914 |
Family Income by Number of Earners in Sun Valley
The median family income in Sun Valley is $74,914, with families comprising 3+ earners (1,098) having the highest median family income of $122,650, while families with no earners (673) have the lowest median family income of $22,750, accounting for 20.9% and 12.8% of families, respectively.
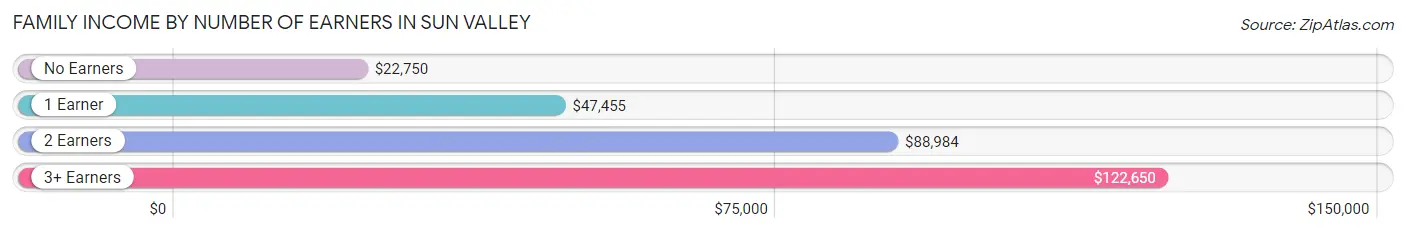
| Number of Earners | # Families | Median Income |
| No Earners | 673 (12.8%) | $22,750 |
| 1 Earner | 1,364 (26.0%) | $47,455 |
| 2 Earners | 2,112 (40.3%) | $88,984 |
| 3+ Earners | 1,098 (20.9%) | $122,650 |
| Total | 5,247 (100.0%) | $74,914 |
Household Income in Sun Valley
Household Income Brackets in Sun Valley
With 1,585 households falling in the category, the $100,000 to $149,999 income range is the most frequent in Sun Valley, accounting for 22.9% of all households. In contrast, only 152 households (2.2%) fall into the $10,000 to $14,999 income bracket, making it the least populous group.
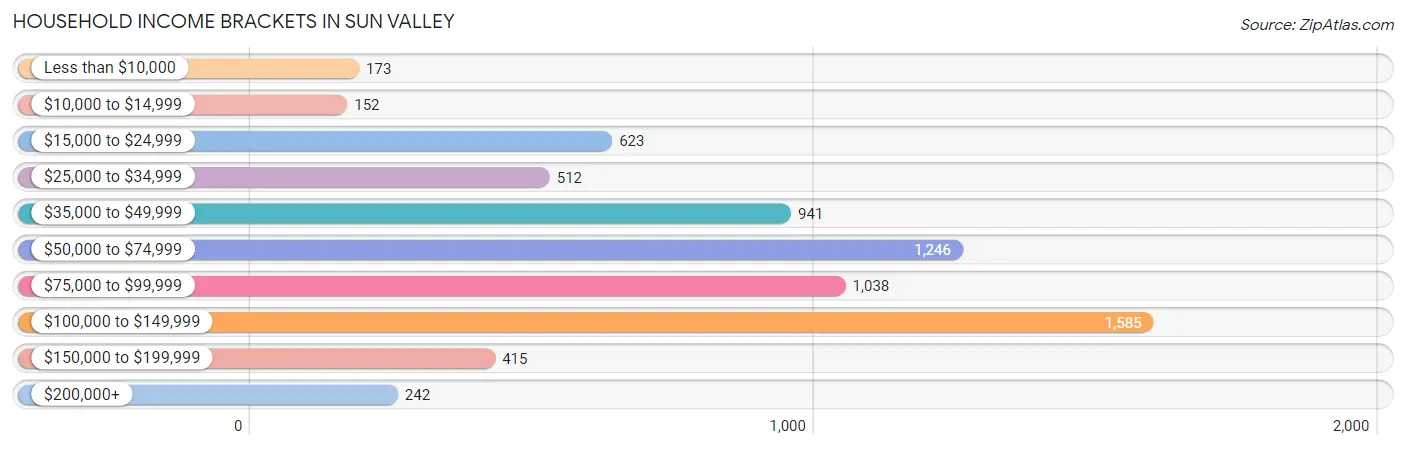
| Income Bracket | # Households | % Households |
| Less than $10,000 | 173 | 2.5% |
| $10,000 to $14,999 | 152 | 2.2% |
| $15,000 to $24,999 | 623 | 9.0% |
| $25,000 to $34,999 | 512 | 7.4% |
| $35,000 to $49,999 | 941 | 13.6% |
| $50,000 to $74,999 | 1,246 | 18.0% |
| $75,000 to $99,999 | 1,038 | 15.0% |
| $100,000 to $149,999 | 1,585 | 22.9% |
| $150,000 to $199,999 | 415 | 6.0% |
| $200,000+ | 242 | 3.5% |
Household Income by Householder Age in Sun Valley
The median household income in Sun Valley is $71,471, with the highest median household income of $79,826 found in the 15 to 24 years age bracket for the primary householder. A total of 159 households (2.3%) fall into this category. Meanwhile, the 65+ years age bracket for the primary householder has the lowest median household income of $45,179, with 1,707 households (24.7%) in this group.
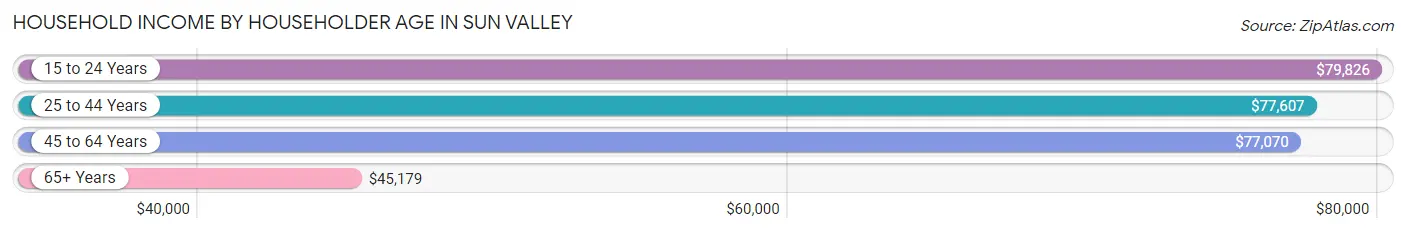
| Income Bracket | # Households | Median Income |
| 15 to 24 Years | 159 (2.3%) | $79,826 |
| 25 to 44 Years | 2,168 (31.3%) | $77,607 |
| 45 to 64 Years | 2,886 (41.7%) | $77,070 |
| 65+ Years | 1,707 (24.7%) | $45,179 |
| Total | 6,920 (100.0%) | $71,471 |
Poverty in Sun Valley
Income Below Poverty by Sex and Age in Sun Valley
With 18.2% poverty level for males and 15.6% for females among the residents of Sun Valley, under 5 year old males and 5 year old females are the most vulnerable to poverty, with 296 males (31.4%) and 59 females (29.1%) in their respective age groups living below the poverty level.
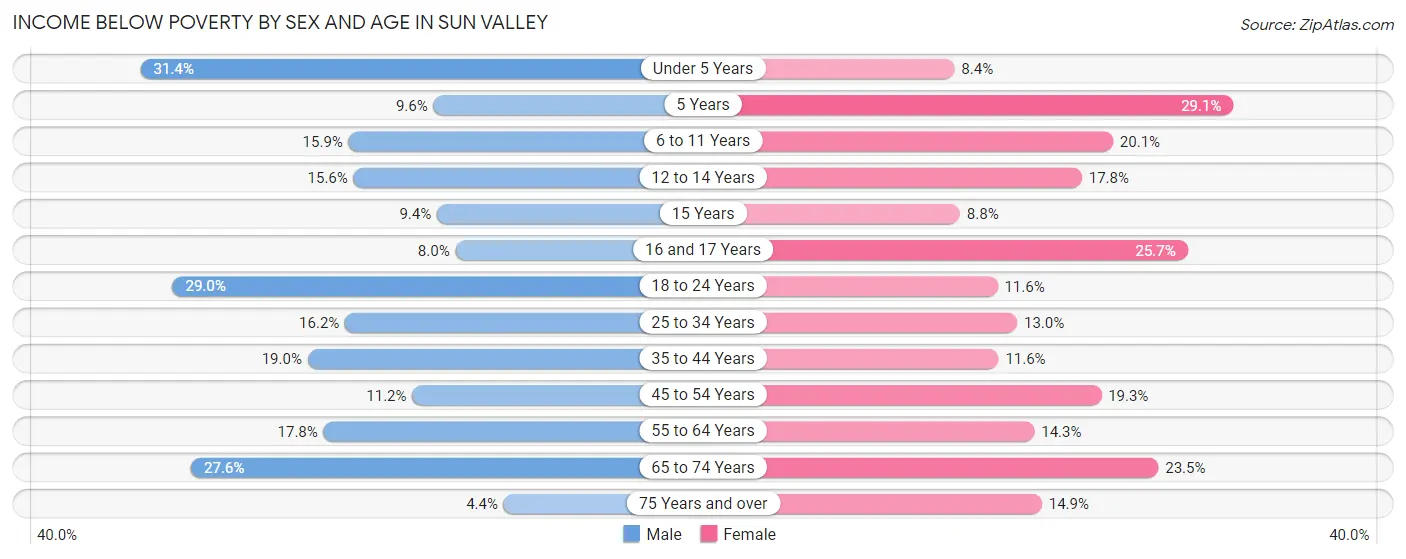
| Age Bracket | Male | Female |
| Under 5 Years | 296 (31.4%) | 70 (8.4%) |
| 5 Years | 19 (9.6%) | 59 (29.1%) |
| 6 to 11 Years | 150 (15.9%) | 225 (20.1%) |
| 12 to 14 Years | 76 (15.6%) | 98 (17.8%) |
| 15 Years | 9 (9.4%) | 25 (8.8%) |
| 16 and 17 Years | 37 (8.0%) | 67 (25.7%) |
| 18 to 24 Years | 286 (29.0%) | 107 (11.6%) |
| 25 to 34 Years | 336 (16.2%) | 225 (13.0%) |
| 35 to 44 Years | 219 (19.0%) | 126 (11.6%) |
| 45 to 54 Years | 188 (11.2%) | 285 (19.3%) |
| 55 to 64 Years | 226 (17.8%) | 181 (14.3%) |
| 65 to 74 Years | 272 (27.6%) | 157 (23.5%) |
| 75 Years and over | 21 (4.4%) | 79 (14.8%) |
| Total | 2,135 (18.2%) | 1,704 (15.6%) |
Income Above Poverty by Sex and Age in Sun Valley
According to the poverty statistics in Sun Valley, males aged 75 years and over and females aged under 5 years are the age groups that are most secure financially, with 95.6% of males and 91.6% of females in these age groups living above the poverty line.
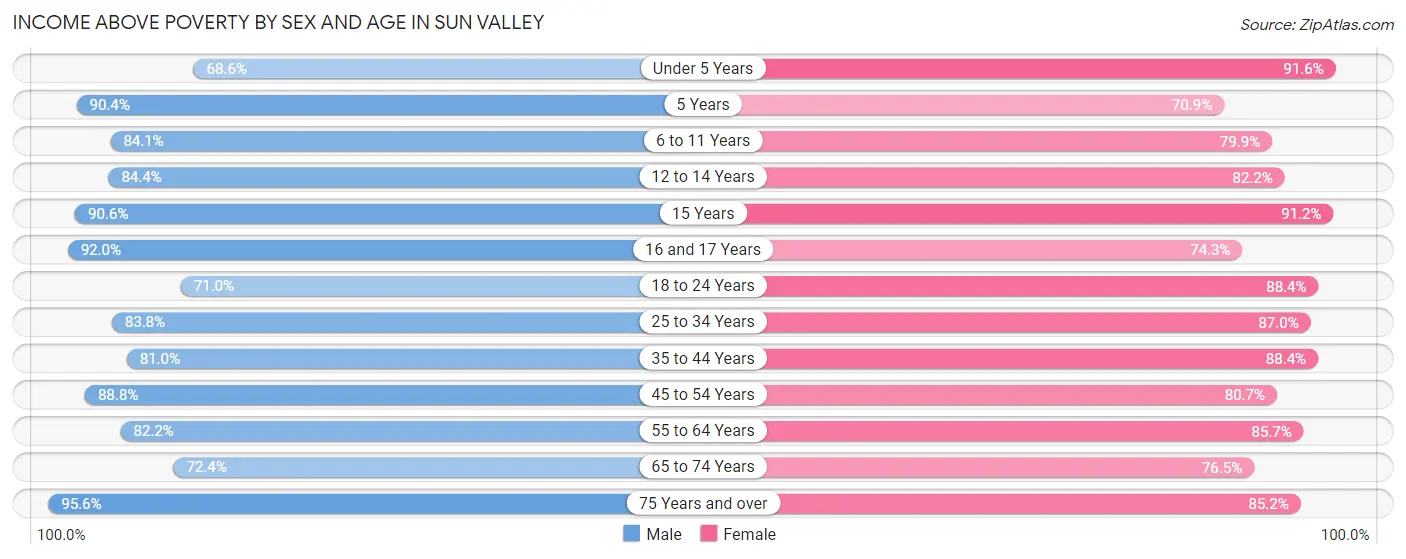
| Age Bracket | Male | Female |
| Under 5 Years | 647 (68.6%) | 767 (91.6%) |
| 5 Years | 178 (90.4%) | 144 (70.9%) |
| 6 to 11 Years | 791 (84.1%) | 893 (79.9%) |
| 12 to 14 Years | 412 (84.4%) | 452 (82.2%) |
| 15 Years | 87 (90.6%) | 260 (91.2%) |
| 16 and 17 Years | 425 (92.0%) | 194 (74.3%) |
| 18 to 24 Years | 700 (71.0%) | 819 (88.4%) |
| 25 to 34 Years | 1,738 (83.8%) | 1,504 (87.0%) |
| 35 to 44 Years | 935 (81.0%) | 957 (88.4%) |
| 45 to 54 Years | 1,489 (88.8%) | 1,195 (80.7%) |
| 55 to 64 Years | 1,044 (82.2%) | 1,086 (85.7%) |
| 65 to 74 Years | 712 (72.4%) | 511 (76.5%) |
| 75 Years and over | 454 (95.6%) | 453 (85.2%) |
| Total | 9,612 (81.8%) | 9,235 (84.4%) |
Income Below Poverty Among Married-Couple Families in Sun Valley
The poverty statistics for married-couple families in Sun Valley show that 7.2% or 248 of the total 3,425 families live below the poverty line. Families with 5 or more children have the highest poverty rate of 68.5%, comprising of 50 families. On the other hand, families with no children have the lowest poverty rate of 2.7%, which includes 42 families.
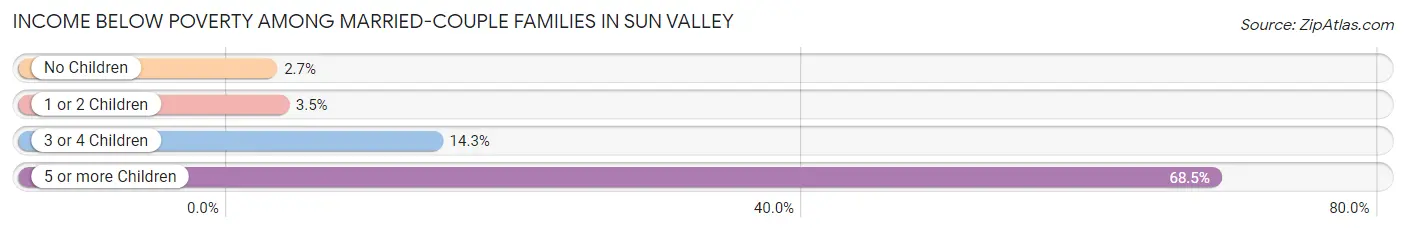
| Children | Above Poverty | Below Poverty |
| No Children | 1,494 (97.3%) | 42 (2.7%) |
| 1 or 2 Children | 926 (96.5%) | 34 (3.5%) |
| 3 or 4 Children | 734 (85.8%) | 122 (14.2%) |
| 5 or more Children | 23 (31.5%) | 50 (68.5%) |
| Total | 3,177 (92.8%) | 248 (7.2%) |
Income Below Poverty Among Single-Parent Households in Sun Valley
According to the poverty data in Sun Valley, 33.8% or 282 single-father households and 21.0% or 208 single-mother households are living below the poverty line. Among single-father households, those with no children have the highest poverty rate, with 259 households (48.5%) experiencing poverty. Likewise, among single-mother households, those with 3 or 4 children have the highest poverty rate, with 68 households (40.7%) falling below the poverty line.
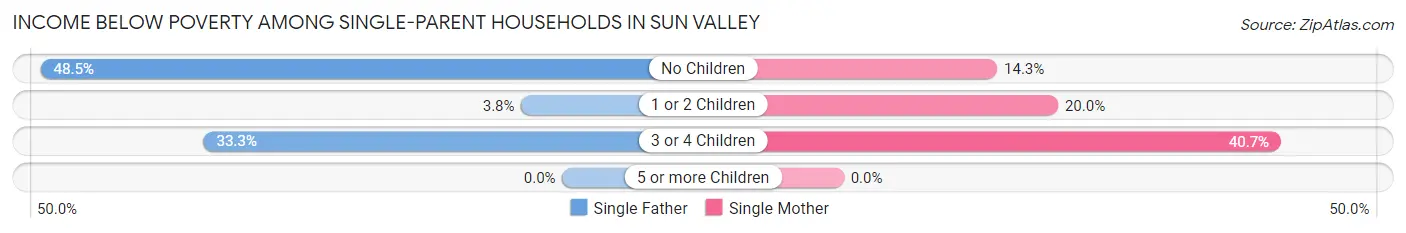
| Children | Single Father | Single Mother |
| No Children | 259 (48.5%) | 42 (14.3%) |
| 1 or 2 Children | 10 (3.8%) | 98 (20.0%) |
| 3 or 4 Children | 13 (33.3%) | 68 (40.7%) |
| 5 or more Children | 0 (0.0%) | 0 (0.0%) |
| Total | 282 (33.8%) | 208 (21.0%) |
Income Below Poverty Among Married-Couple vs Single-Parent Households in Sun Valley
The poverty data for Sun Valley shows that 248 of the married-couple family households (7.2%) and 490 of the single-parent households (26.9%) are living below the poverty level. Within the married-couple family households, those with 5 or more children have the highest poverty rate, with 50 households (68.5%) falling below the poverty line. Among the single-parent households, those with 3 or 4 children have the highest poverty rate, with 81 household (39.3%) living below poverty.
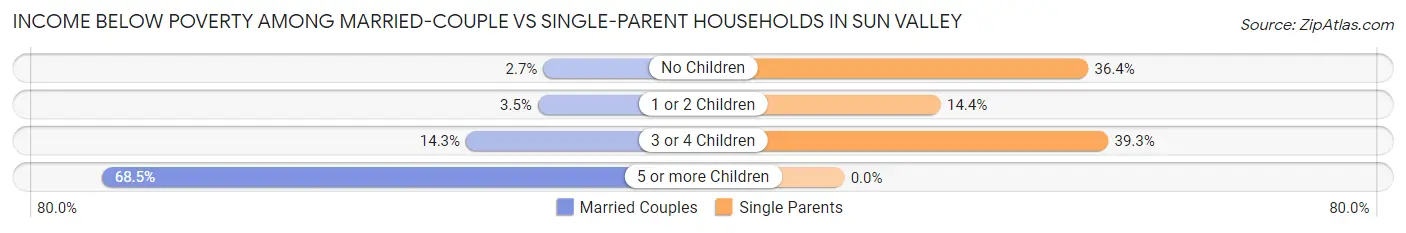
| Children | Married-Couple Families | Single-Parent Households |
| No Children | 42 (2.7%) | 301 (36.3%) |
| 1 or 2 Children | 34 (3.5%) | 108 (14.4%) |
| 3 or 4 Children | 122 (14.2%) | 81 (39.3%) |
| 5 or more Children | 50 (68.5%) | 0 (0.0%) |
| Total | 248 (7.2%) | 490 (26.9%) |
Race in Sun Valley
The most populous races in Sun Valley are White / Caucasian (12,955 | 56.9%), Hispanic or Latino (11,812 | 51.9%), and Some other Race (5,782 | 25.4%).
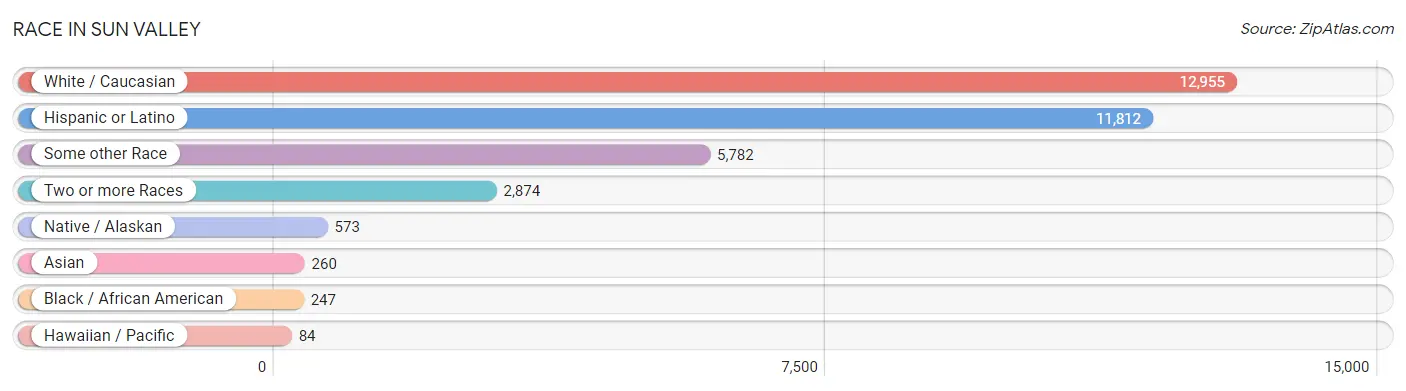
| Race | # Population | % Population |
| Asian | 260 | 1.1% |
| Black / African American | 247 | 1.1% |
| Hawaiian / Pacific | 84 | 0.4% |
| Hispanic or Latino | 11,812 | 51.9% |
| Native / Alaskan | 573 | 2.5% |
| White / Caucasian | 12,955 | 56.9% |
| Two or more Races | 2,874 | 12.6% |
| Some other Race | 5,782 | 25.4% |
| Total | 22,775 | 100.0% |
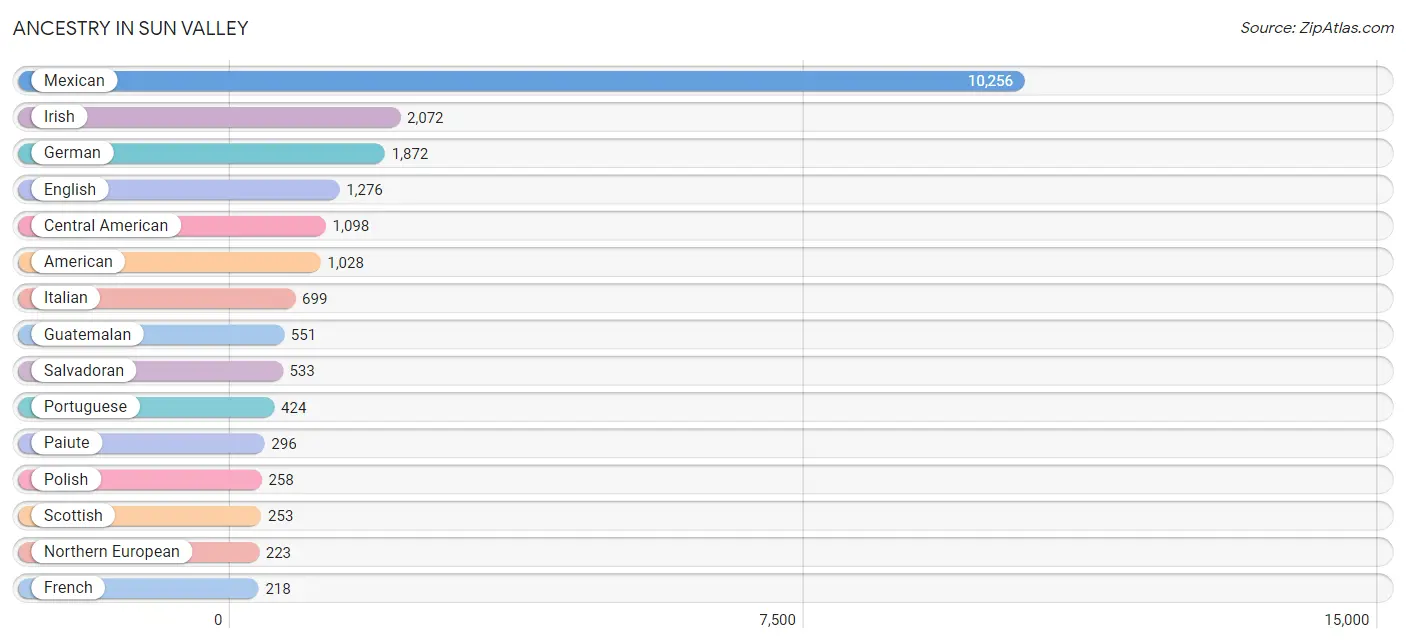
Ancestry in Sun Valley
The most populous ancestries reported in Sun Valley are Mexican (10,256 | 45.0%), Irish (2,072 | 9.1%), German (1,872 | 8.2%), English (1,276 | 5.6%), and Central American (1,098 | 4.8%), together accounting for 72.8% of all Sun Valley residents.
| Ancestry | # Population | % Population |
| African | 9 | 0.0% |
| Aleut | 113 | 0.5% |
| American | 1,028 | 4.5% |
| Arab | 11 | 0.1% |
| Armenian | 24 | 0.1% |
| Austrian | 15 | 0.1% |
| Basque | 17 | 0.1% |
| Belgian | 42 | 0.2% |
| Bhutanese | 27 | 0.1% |
| Blackfeet | 8 | 0.0% |
| British | 34 | 0.2% |
| Bulgarian | 10 | 0.0% |
| Burmese | 78 | 0.3% |
| Canadian | 101 | 0.4% |
| Central American | 1,098 | 4.8% |
| Cherokee | 102 | 0.4% |
| Cuban | 22 | 0.1% |
| Czech | 60 | 0.3% |
| Czechoslovakian | 30 | 0.1% |
| Danish | 110 | 0.5% |
| Dutch | 169 | 0.7% |
| Eastern European | 70 | 0.3% |
| English | 1,276 | 5.6% |
| European | 125 | 0.5% |
| Finnish | 9 | 0.0% |
| French | 218 | 1.0% |
| French Canadian | 81 | 0.4% |
| German | 1,872 | 8.2% |
| Ghanaian | 5 | 0.0% |
| Greek | 29 | 0.1% |
| Guamanian / Chamorro | 3 | 0.0% |
| Guatemalan | 551 | 2.4% |
| Hungarian | 9 | 0.0% |
| Irish | 2,072 | 9.1% |
| Iroquois | 19 | 0.1% |
| Italian | 699 | 3.1% |
| Korean | 119 | 0.5% |
| Lebanese | 11 | 0.1% |
| Mexican | 10,256 | 45.0% |
| Mexican American Indian | 118 | 0.5% |
| Native Hawaiian | 49 | 0.2% |
| Navajo | 14 | 0.1% |
| New Zealander | 9 | 0.0% |
| Nicaraguan | 14 | 0.1% |
| Northern European | 223 | 1.0% |
| Norwegian | 185 | 0.8% |
| Paiute | 296 | 1.3% |
| Pennsylvania German | 18 | 0.1% |
| Polish | 258 | 1.1% |
| Portuguese | 424 | 1.9% |
| Puerto Rican | 106 | 0.5% |
| Puget Sound Salish | 2 | 0.0% |
| Russian | 10 | 0.0% |
| Salvadoran | 533 | 2.3% |
| Scandinavian | 14 | 0.1% |
| Scotch-Irish | 148 | 0.6% |
| Scottish | 253 | 1.1% |
| Sioux | 11 | 0.1% |
| Slovene | 7 | 0.0% |
| Spaniard | 77 | 0.3% |
| Spanish | 182 | 0.8% |
| Sri Lankan | 39 | 0.2% |
| Subsaharan African | 14 | 0.1% |
| Swedish | 133 | 0.6% |
| Swiss | 50 | 0.2% |
| Thai | 182 | 0.8% |
| Tongan | 5 | 0.0% |
| Ukrainian | 30 | 0.1% |
| Welsh | 41 | 0.2% |
| Yugoslavian | 17 | 0.1% | View All 70 Rows |
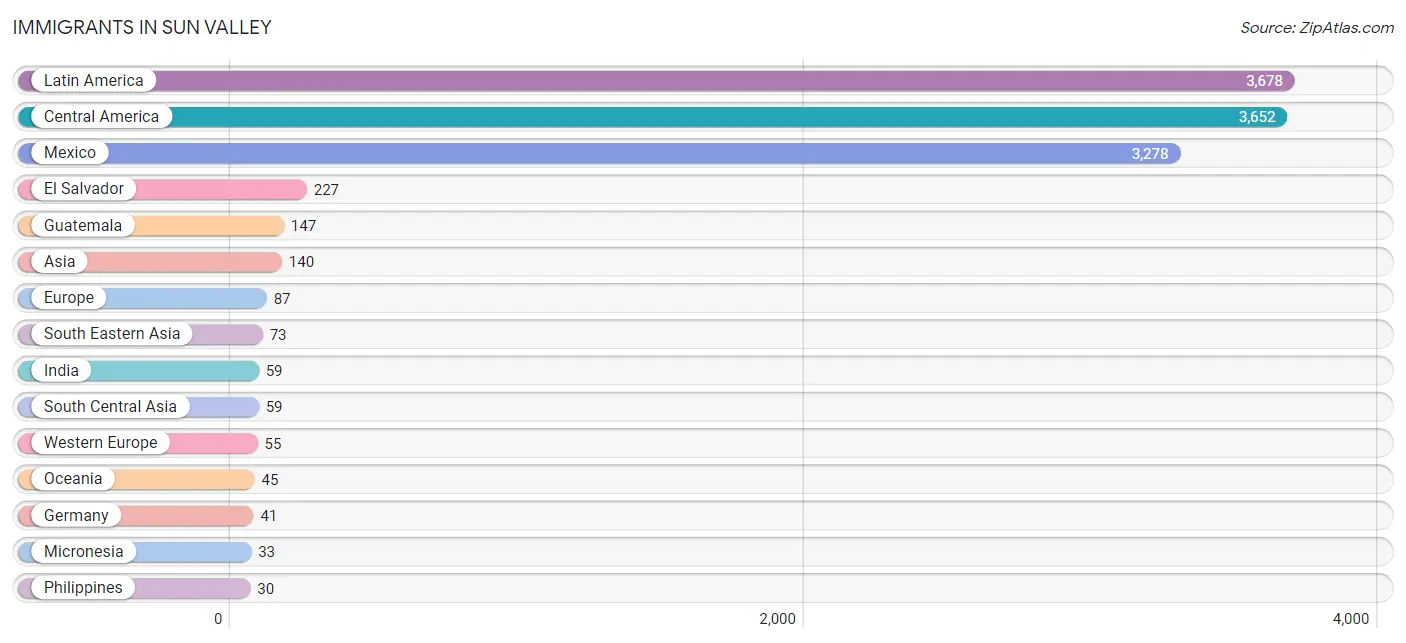
Immigrants in Sun Valley
The most numerous immigrant groups reported in Sun Valley came from Latin America (3,678 | 16.2%), Central America (3,652 | 16.0%), Mexico (3,278 | 14.4%), El Salvador (227 | 1.0%), and Guatemala (147 | 0.6%), together accounting for 48.2% of all Sun Valley residents.
| Immigration Origin | # Population | % Population |
| Africa | 9 | 0.0% |
| Asia | 140 | 0.6% |
| Canada | 28 | 0.1% |
| Caribbean | 11 | 0.1% |
| Central America | 3,652 | 16.0% |
| Cuba | 11 | 0.1% |
| Eastern Africa | 9 | 0.0% |
| Eastern Asia | 8 | 0.0% |
| Eastern Europe | 13 | 0.1% |
| El Salvador | 227 | 1.0% |
| Europe | 87 | 0.4% |
| Germany | 41 | 0.2% |
| Guatemala | 147 | 0.6% |
| India | 59 | 0.3% |
| Indonesia | 14 | 0.1% |
| Kenya | 9 | 0.0% |
| Korea | 8 | 0.0% |
| Latin America | 3,678 | 16.2% |
| Mexico | 3,278 | 14.4% |
| Micronesia | 33 | 0.1% |
| Netherlands | 14 | 0.1% |
| Northern Europe | 19 | 0.1% |
| Oceania | 45 | 0.2% |
| Peru | 15 | 0.1% |
| Philippines | 30 | 0.1% |
| Russia | 13 | 0.1% |
| South America | 15 | 0.1% |
| South Central Asia | 59 | 0.3% |
| South Eastern Asia | 73 | 0.3% |
| Vietnam | 29 | 0.1% |
| Western Europe | 55 | 0.2% | View All 31 Rows |
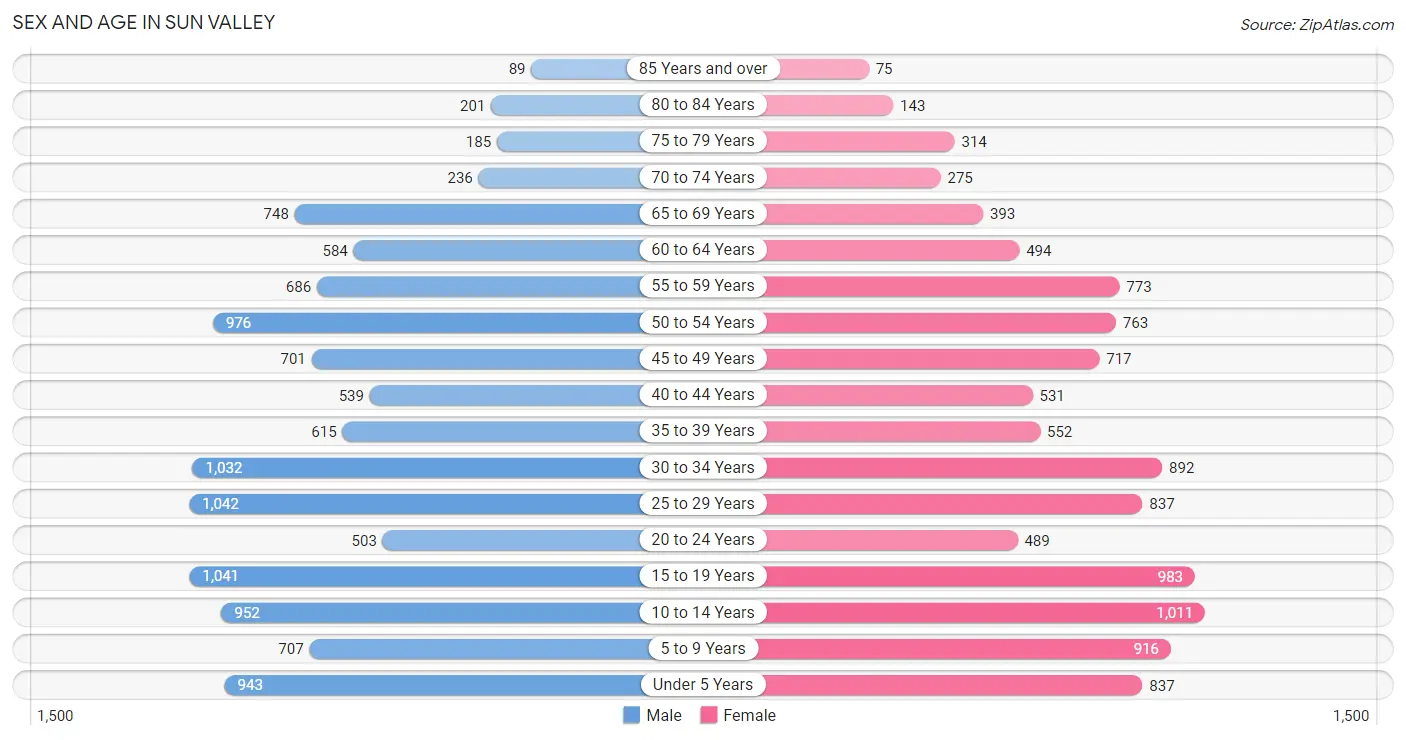
Sex and Age in Sun Valley
Sex and Age in Sun Valley
The most populous age groups in Sun Valley are 25 to 29 Years (1,042 | 8.8%) for men and 10 to 14 Years (1,011 | 9.2%) for women.
| Age Bracket | Male | Female |
| Under 5 Years | 943 (8.0%) | 837 (7.6%) |
| 5 to 9 Years | 707 (6.0%) | 916 (8.3%) |
| 10 to 14 Years | 952 (8.1%) | 1,011 (9.2%) |
| 15 to 19 Years | 1,041 (8.8%) | 983 (8.9%) |
| 20 to 24 Years | 503 (4.3%) | 489 (4.4%) |
| 25 to 29 Years | 1,042 (8.8%) | 837 (7.6%) |
| 30 to 34 Years | 1,032 (8.8%) | 892 (8.1%) |
| 35 to 39 Years | 615 (5.2%) | 552 (5.0%) |
| 40 to 44 Years | 539 (4.6%) | 531 (4.8%) |
| 45 to 49 Years | 701 (5.9%) | 717 (6.5%) |
| 50 to 54 Years | 976 (8.3%) | 763 (6.9%) |
| 55 to 59 Years | 686 (5.8%) | 773 (7.0%) |
| 60 to 64 Years | 584 (5.0%) | 494 (4.5%) |
| 65 to 69 Years | 748 (6.4%) | 393 (3.6%) |
| 70 to 74 Years | 236 (2.0%) | 275 (2.5%) |
| 75 to 79 Years | 185 (1.6%) | 314 (2.9%) |
| 80 to 84 Years | 201 (1.7%) | 143 (1.3%) |
| 85 Years and over | 89 (0.8%) | 75 (0.7%) |
| Total | 11,780 (100.0%) | 10,995 (100.0%) |
Families and Households in Sun Valley
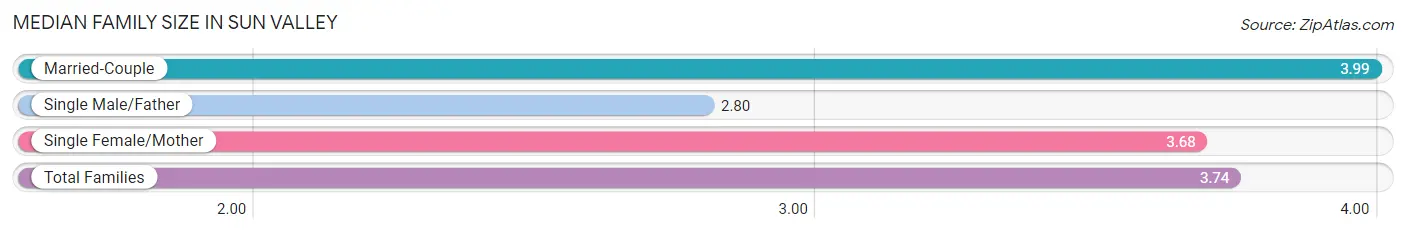
Median Family Size in Sun Valley
The median family size in Sun Valley is 3.74 persons per family, with married-couple families (3,425 | 65.3%) accounting for the largest median family size of 3.99 persons per family. On the other hand, single male/father families (834 | 15.9%) represent the smallest median family size with 2.80 persons per family.
| Family Type | # Families | Family Size |
| Married-Couple | 3,425 (65.3%) | 3.99 |
| Single Male/Father | 834 (15.9%) | 2.80 |
| Single Female/Mother | 988 (18.8%) | 3.68 |
| Total Families | 5,247 (100.0%) | 3.74 |
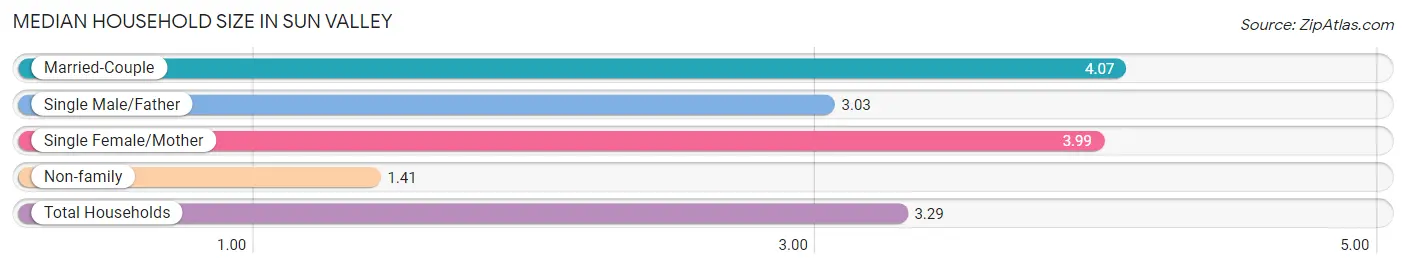
Median Household Size in Sun Valley
The median household size in Sun Valley is 3.29 persons per household, with married-couple households (3,425 | 49.5%) accounting for the largest median household size of 4.07 persons per household. non-family households (1,673 | 24.2%) represent the smallest median household size with 1.41 persons per household.
| Household Type | # Households | Household Size |
| Married-Couple | 3,425 (49.5%) | 4.07 |
| Single Male/Father | 834 (12.0%) | 3.03 |
| Single Female/Mother | 988 (14.3%) | 3.99 |
| Non-family | 1,673 (24.2%) | 1.41 |
| Total Households | 6,920 (100.0%) | 3.29 |
Household Size by Marriage Status in Sun Valley
Out of a total of 6,920 households in Sun Valley, 5,247 (75.8%) are family households, while 1,673 (24.2%) are nonfamily households. The most numerous type of family households are 3-person households, comprising 1,307, and the most common type of nonfamily households are 1-person households, comprising 1,190.
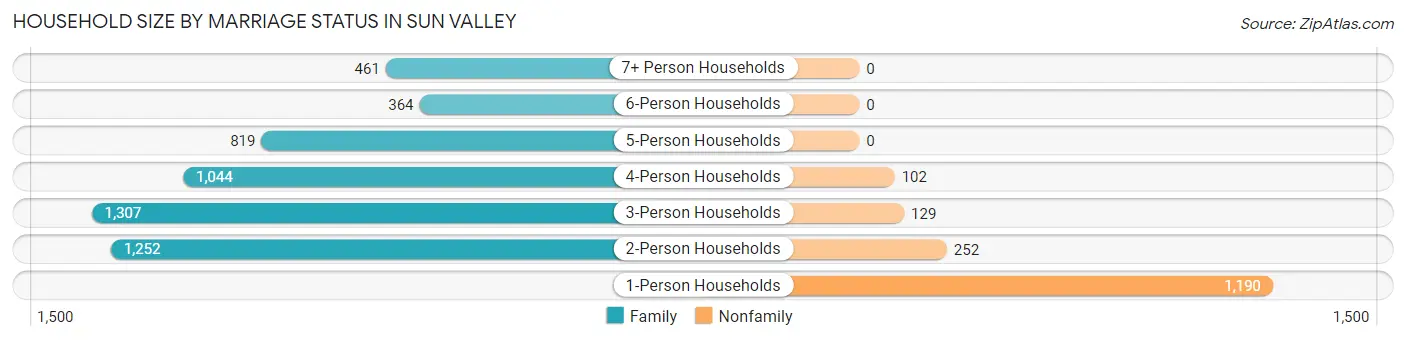
| Household Size | Family Households | Nonfamily Households |
| 1-Person Households | - | 1,190 (17.2%) |
| 2-Person Households | 1,252 (18.1%) | 252 (3.6%) |
| 3-Person Households | 1,307 (18.9%) | 129 (1.9%) |
| 4-Person Households | 1,044 (15.1%) | 102 (1.5%) |
| 5-Person Households | 819 (11.8%) | 0 (0.0%) |
| 6-Person Households | 364 (5.3%) | 0 (0.0%) |
| 7+ Person Households | 461 (6.7%) | 0 (0.0%) |
| Total | 5,247 (75.8%) | 1,673 (24.2%) |
Female Fertility in Sun Valley
Fertility by Age in Sun Valley
Average fertility rate in Sun Valley is 66.0 births per 1,000 women. Women in the age bracket of 20 to 34 years have the highest fertility rate with 152.0 births per 1,000 women. Women in the age bracket of 20 to 34 years acount for 100.0% of all women with births.
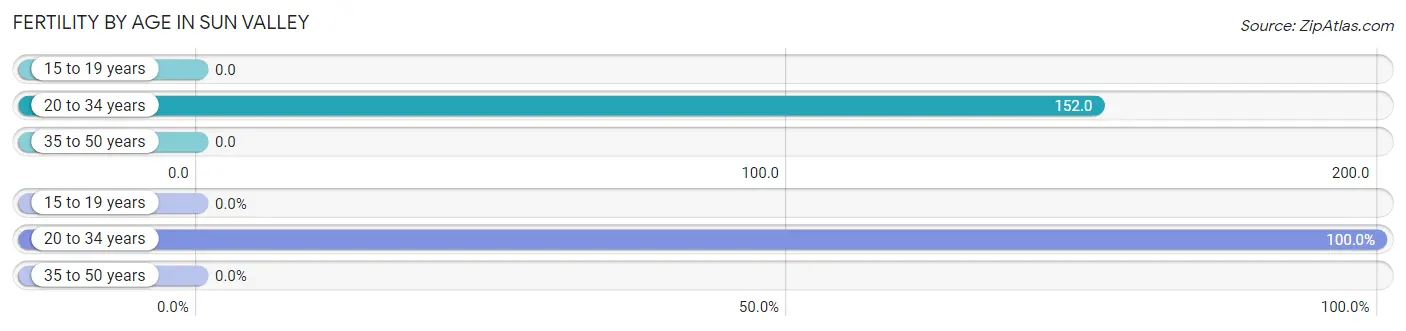
| Age Bracket | Women with Births | Births / 1,000 Women |
| 15 to 19 years | 0 (0.0%) | 0.0 |
| 20 to 34 years | 338 (100.0%) | 152.0 |
| 35 to 50 years | 0 (0.0%) | 0.0 |
| Total | 338 (100.0%) | 66.0 |
Fertility by Age by Marriage Status in Sun Valley
91.7% of women with births (338) in Sun Valley are married. The highest percentage of unmarried women with births falls into 20 to 34 years age bracket with 8.3% of them unmarried at the time of birth, while the lowest percentage of unmarried women with births belong to 20 to 34 years age bracket with 8.3% of them unmarried.
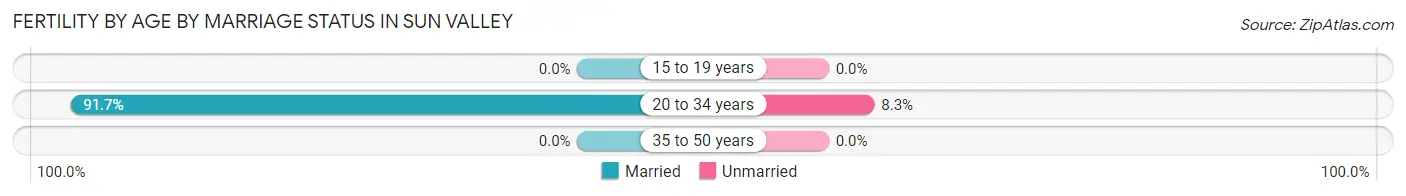
| Age Bracket | Married | Unmarried |
| 15 to 19 years | 0 (0.0%) | 0 (0.0%) |
| 20 to 34 years | 310 (91.7%) | 28 (8.3%) |
| 35 to 50 years | 0 (0.0%) | 0 (0.0%) |
| Total | 310 (91.7%) | 28 (8.3%) |
Fertility by Education in Sun Valley
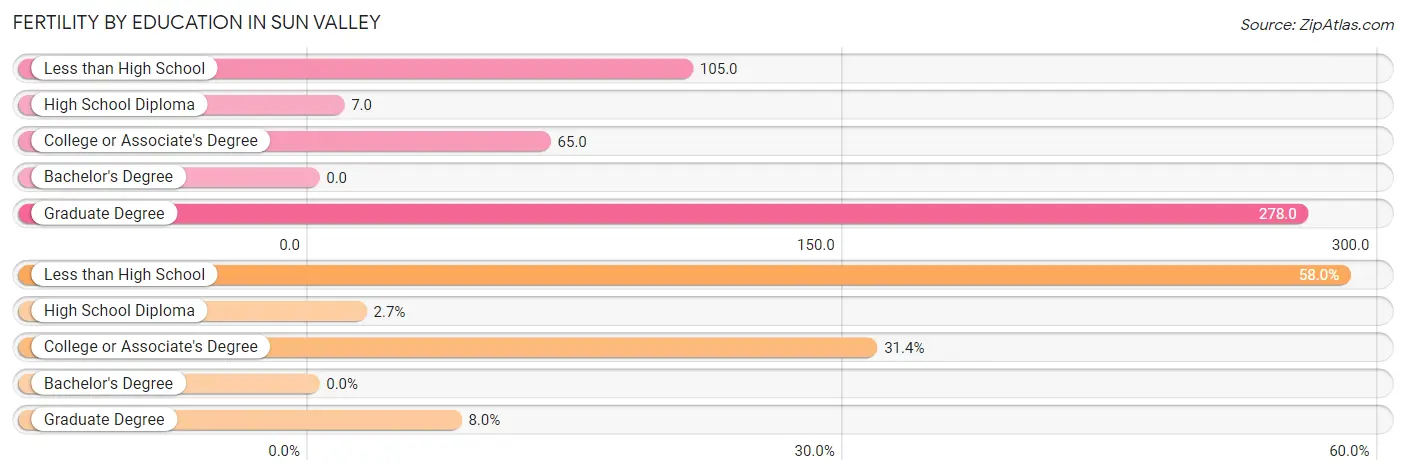
| Educational Attainment | Women with Births | Births / 1,000 Women |
| Less than High School | 196 (58.0%) | 105.0 |
| High School Diploma | 9 (2.7%) | 7.0 |
| College or Associate's Degree | 106 (31.4%) | 65.0 |
| Bachelor's Degree | 0 (0.0%) | 0.0 |
| Graduate Degree | 27 (8.0%) | 278.0 |
| Total | 338 (100.0%) | 66.0 |
Fertility by Education by Marriage Status in Sun Valley
8.3% of women with births in Sun Valley are unmarried. Women with the educational attainment of high school diploma are most likely to be married with 100.0% of them married at childbirth, while women with the educational attainment of less than high school are least likely to be married with 9.7% of them unmarried at childbirth.
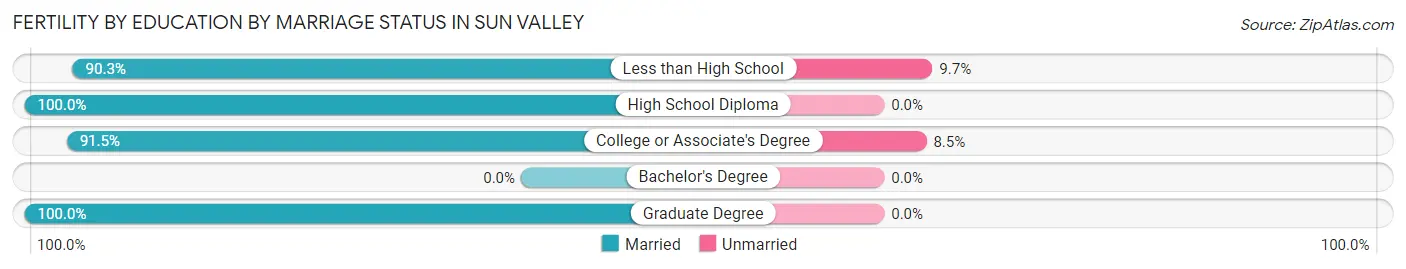
| Educational Attainment | Married | Unmarried |
| Less than High School | 177 (90.3%) | 19 (9.7%) |
| High School Diploma | 9 (100.0%) | 0 (0.0%) |
| College or Associate's Degree | 97 (91.5%) | 9 (8.5%) |
| Bachelor's Degree | 0 (0.0%) | 0 (0.0%) |
| Graduate Degree | 27 (100.0%) | 0 (0.0%) |
| Total | 310 (91.7%) | 28 (8.3%) |
Employment Characteristics in Sun Valley
Employment by Class of Employer in Sun Valley
Among the 10,202 employed individuals in Sun Valley, private company employees (8,459 | 82.9%), not-for-profit organizations (505 | 5.0%), and local government employees (329 | 3.2%) make up the most common classes of employment.
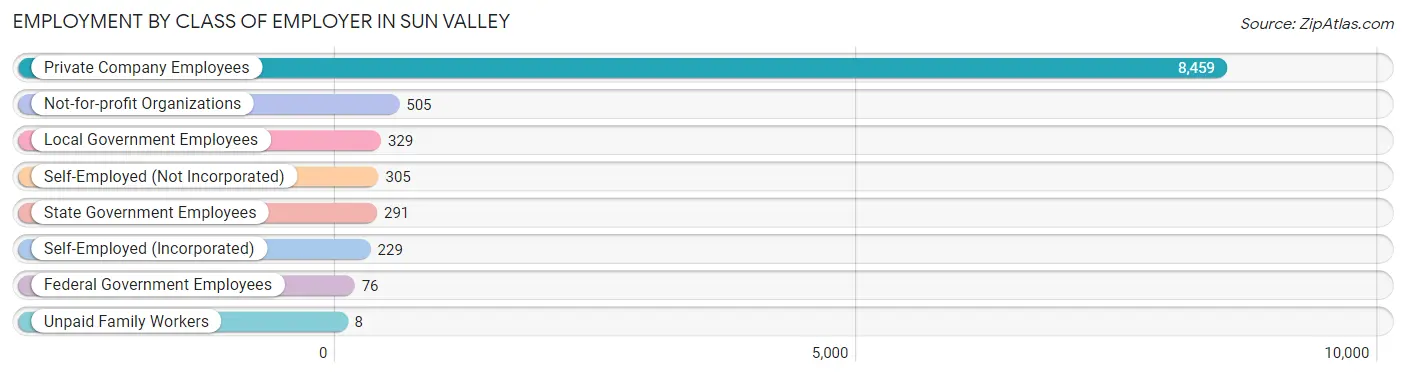
| Employer Class | # Employees | % Employees |
| Private Company Employees | 8,459 | 82.9% |
| Self-Employed (Incorporated) | 229 | 2.2% |
| Self-Employed (Not Incorporated) | 305 | 3.0% |
| Not-for-profit Organizations | 505 | 5.0% |
| Local Government Employees | 329 | 3.2% |
| State Government Employees | 291 | 2.9% |
| Federal Government Employees | 76 | 0.7% |
| Unpaid Family Workers | 8 | 0.1% |
| Total | 10,202 | 100.0% |
Employment Status by Age in Sun Valley
According to the labor force statistics for Sun Valley, out of the total population over 16 years of age (17,028), 64.4% or 10,966 individuals are in the labor force, with 5.1% or 559 of them unemployed. The age group with the highest labor force participation rate is 30 to 34 years, with 82.0% or 1,578 individuals in the labor force. Within the labor force, the 75 years and over age range has the highest percentage of unemployed individuals, with 26.1% or 30 of them being unemployed.
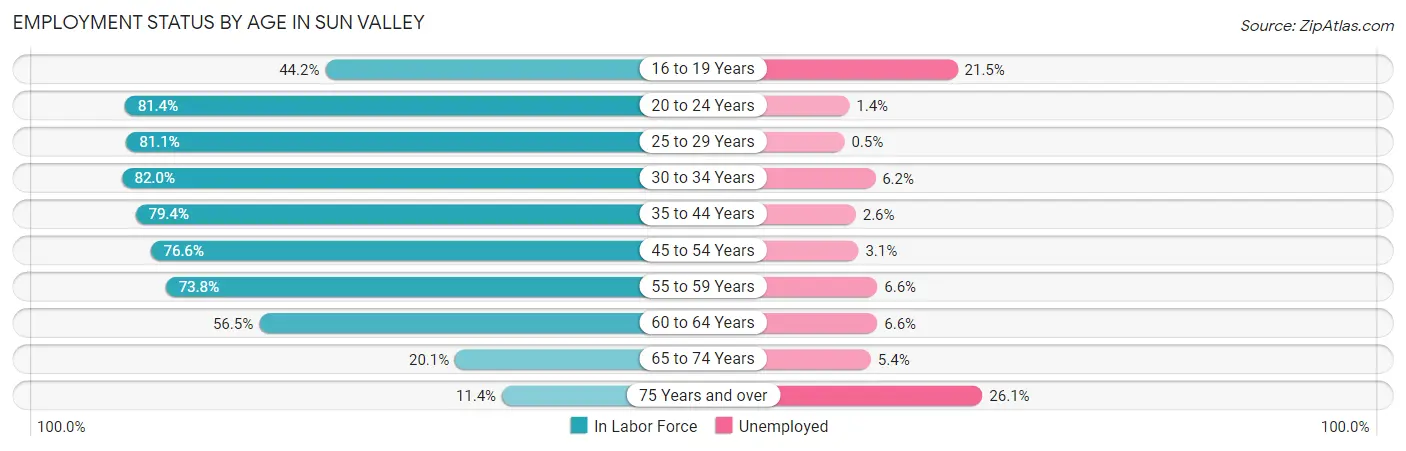
| Age Bracket | In Labor Force | Unemployed |
| 16 to 19 Years | 726 (44.2%) | 156 (21.5%) |
| 20 to 24 Years | 807 (81.4%) | 11 (1.4%) |
| 25 to 29 Years | 1,524 (81.1%) | 8 (0.5%) |
| 30 to 34 Years | 1,578 (82.0%) | 98 (6.2%) |
| 35 to 44 Years | 1,776 (79.4%) | 46 (2.6%) |
| 45 to 54 Years | 2,418 (76.6%) | 75 (3.1%) |
| 55 to 59 Years | 1,077 (73.8%) | 71 (6.6%) |
| 60 to 64 Years | 609 (56.5%) | 40 (6.6%) |
| 65 to 74 Years | 332 (20.1%) | 18 (5.4%) |
| 75 Years and over | 115 (11.4%) | 30 (26.1%) |
| Total | 10,966 (64.4%) | 559 (5.1%) |
Employment Status by Educational Attainment in Sun Valley
According to labor force statistics for Sun Valley, 76.5% of individuals (8,977) out of the total population between 25 and 64 years of age (11,734) are in the labor force, with 3.8% or 341 of them being unemployed. The group with the highest labor force participation rate are those with the educational attainment of college / associate degree, with 82.9% or 2,803 individuals in the labor force. Within the labor force, individuals with bachelor's degree or higher education have the highest percentage of unemployment, with 6.5% or 48 of them being unemployed.
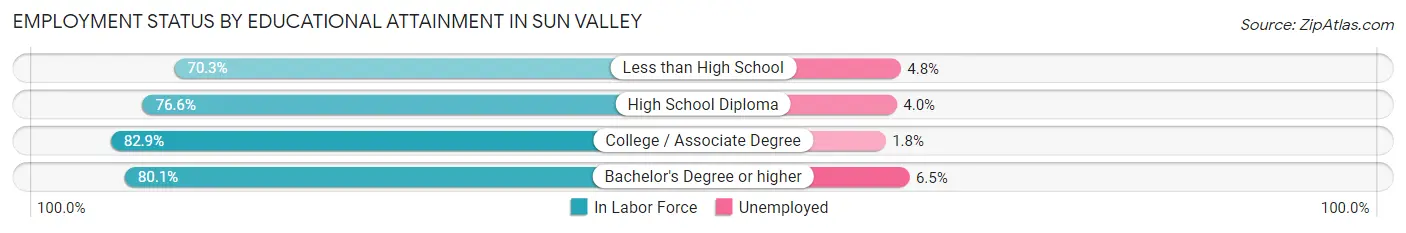
| Educational Attainment | In Labor Force | Unemployed |
| Less than High School | 2,818 (70.3%) | 192 (4.8%) |
| High School Diploma | 2,621 (76.6%) | 137 (4.0%) |
| College / Associate Degree | 2,803 (82.9%) | 61 (1.8%) |
| Bachelor's Degree or higher | 739 (80.1%) | 60 (6.5%) |
| Total | 8,977 (76.5%) | 446 (3.8%) |
Employment Occupations by Sex in Sun Valley
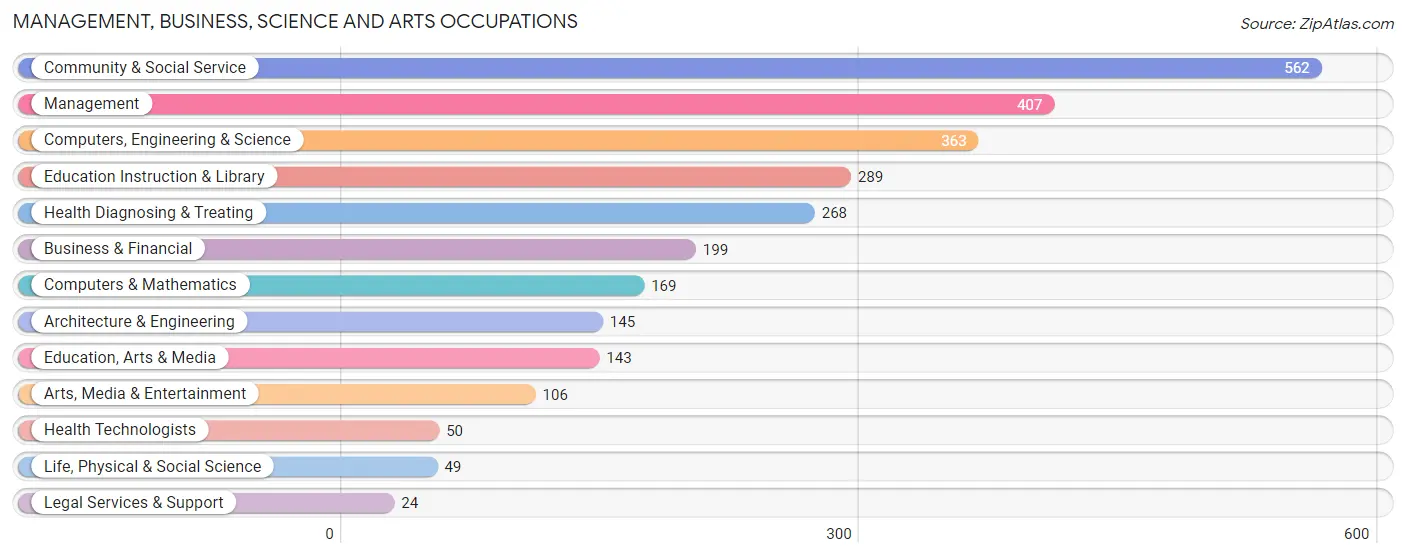
Management, Business, Science and Arts Occupations
The most common Management, Business, Science and Arts occupations in Sun Valley are Community & Social Service (562 | 5.4%), Management (407 | 3.9%), Computers, Engineering & Science (363 | 3.5%), Education Instruction & Library (289 | 2.8%), and Health Diagnosing & Treating (268 | 2.6%).
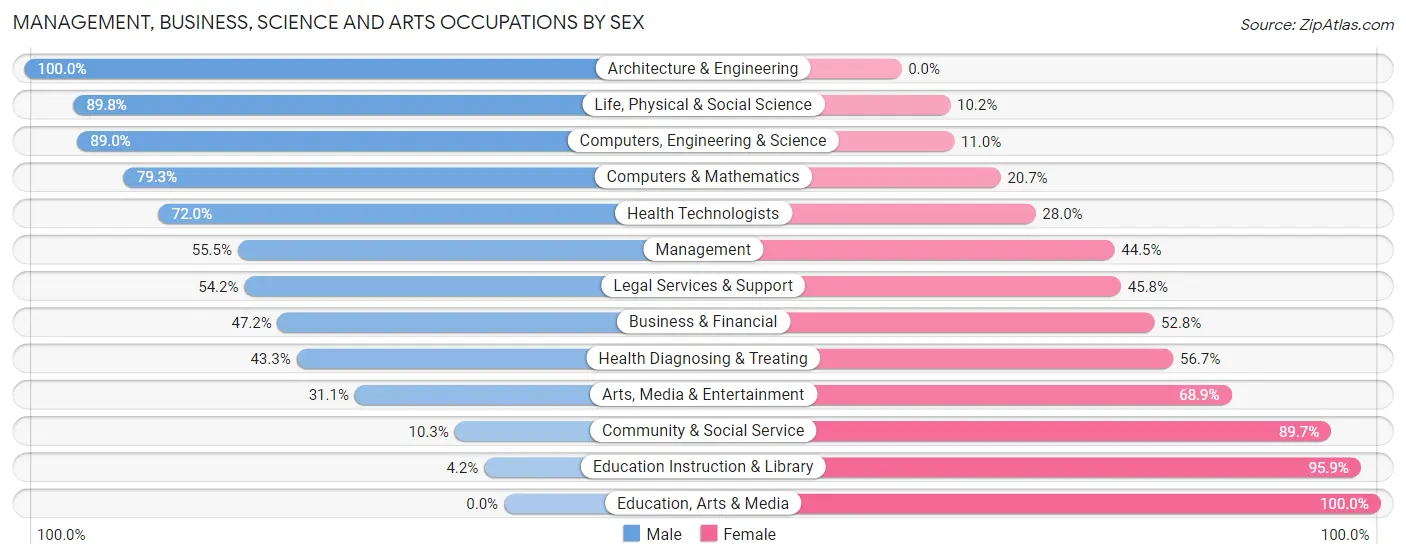
Management, Business, Science and Arts Occupations by Sex
Within the Management, Business, Science and Arts occupations in Sun Valley, the most male-oriented occupations are Architecture & Engineering (100.0%), Life, Physical & Social Science (89.8%), and Computers, Engineering & Science (89.0%), while the most female-oriented occupations are Education, Arts & Media (100.0%), Education Instruction & Library (95.9%), and Community & Social Service (89.7%).
| Occupation | Male | Female |
| Management | 226 (55.5%) | 181 (44.5%) |
| Business & Financial | 94 (47.2%) | 105 (52.8%) |
| Computers, Engineering & Science | 323 (89.0%) | 40 (11.0%) |
| Computers & Mathematics | 134 (79.3%) | 35 (20.7%) |
| Architecture & Engineering | 145 (100.0%) | 0 (0.0%) |
| Life, Physical & Social Science | 44 (89.8%) | 5 (10.2%) |
| Community & Social Service | 58 (10.3%) | 504 (89.7%) |
| Education, Arts & Media | 0 (0.0%) | 143 (100.0%) |
| Legal Services & Support | 13 (54.2%) | 11 (45.8%) |
| Education Instruction & Library | 12 (4.2%) | 277 (95.9%) |
| Arts, Media & Entertainment | 33 (31.1%) | 73 (68.9%) |
| Health Diagnosing & Treating | 116 (43.3%) | 152 (56.7%) |
| Health Technologists | 36 (72.0%) | 14 (28.0%) |
| Total (Category) | 817 (45.4%) | 982 (54.6%) |
| Total (Overall) | 5,850 (56.2%) | 4,558 (43.8%) |
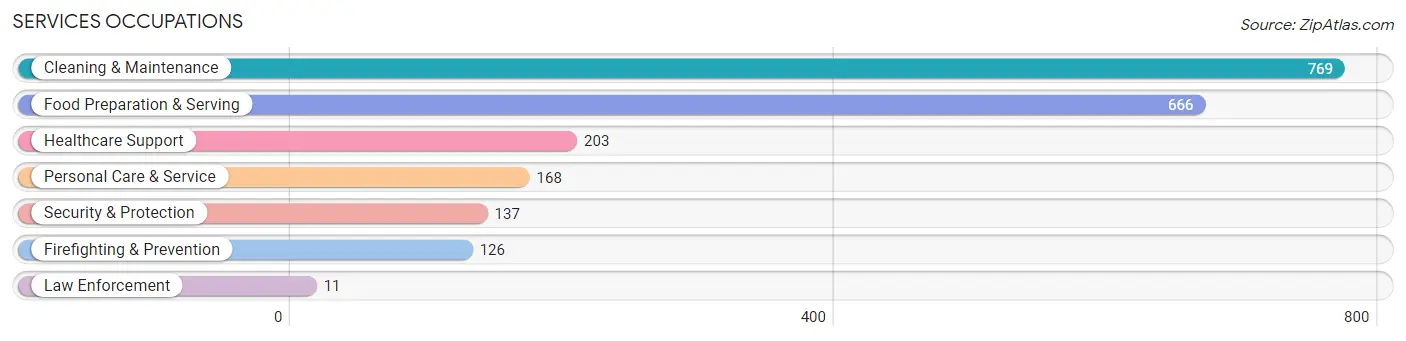
Services Occupations
The most common Services occupations in Sun Valley are Cleaning & Maintenance (769 | 7.4%), Food Preparation & Serving (666 | 6.4%), Healthcare Support (203 | 1.9%), Personal Care & Service (168 | 1.6%), and Security & Protection (137 | 1.3%).
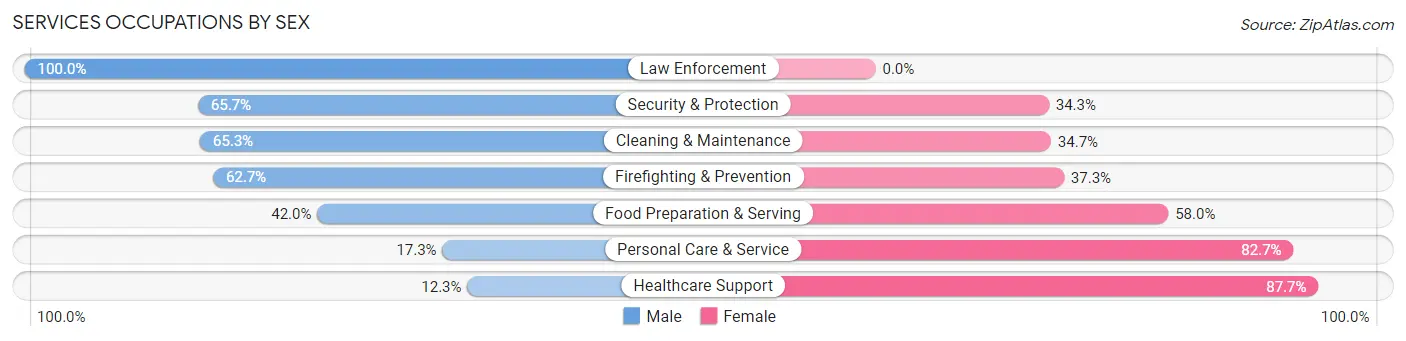
Services Occupations by Sex
Within the Services occupations in Sun Valley, the most male-oriented occupations are Law Enforcement (100.0%), Security & Protection (65.7%), and Cleaning & Maintenance (65.3%), while the most female-oriented occupations are Healthcare Support (87.7%), Personal Care & Service (82.7%), and Food Preparation & Serving (58.0%).
| Occupation | Male | Female |
| Healthcare Support | 25 (12.3%) | 178 (87.7%) |
| Security & Protection | 90 (65.7%) | 47 (34.3%) |
| Firefighting & Prevention | 79 (62.7%) | 47 (37.3%) |
| Law Enforcement | 11 (100.0%) | 0 (0.0%) |
| Food Preparation & Serving | 280 (42.0%) | 386 (58.0%) |
| Cleaning & Maintenance | 502 (65.3%) | 267 (34.7%) |
| Personal Care & Service | 29 (17.3%) | 139 (82.7%) |
| Total (Category) | 926 (47.7%) | 1,017 (52.3%) |
| Total (Overall) | 5,850 (56.2%) | 4,558 (43.8%) |
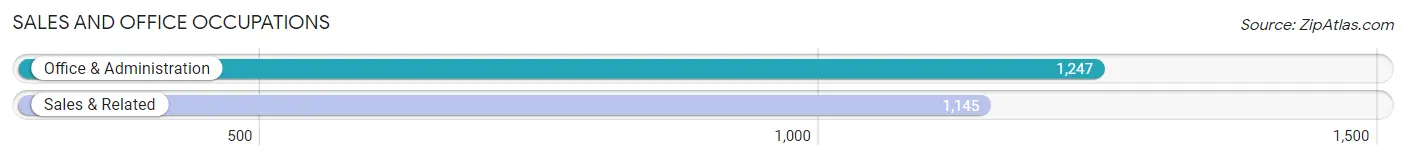
Sales and Office Occupations
The most common Sales and Office occupations in Sun Valley are Office & Administration (1,247 | 12.0%), and Sales & Related (1,145 | 11.0%).
Sales and Office Occupations by Sex
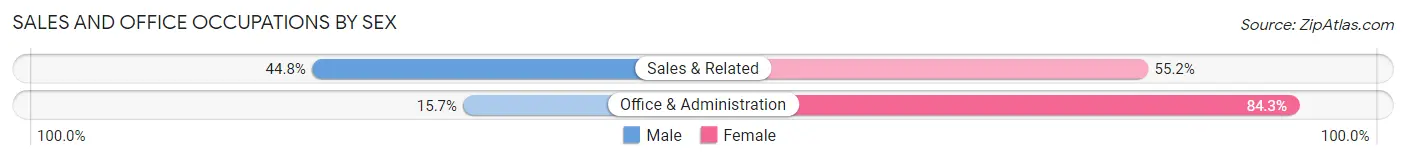
| Occupation | Male | Female |
| Sales & Related | 513 (44.8%) | 632 (55.2%) |
| Office & Administration | 196 (15.7%) | 1,051 (84.3%) |
| Total (Category) | 709 (29.6%) | 1,683 (70.4%) |
| Total (Overall) | 5,850 (56.2%) | 4,558 (43.8%) |
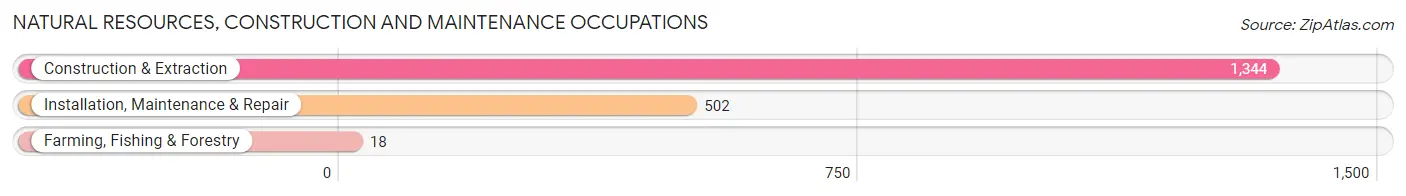
Natural Resources, Construction and Maintenance Occupations
The most common Natural Resources, Construction and Maintenance occupations in Sun Valley are Construction & Extraction (1,344 | 12.9%), Installation, Maintenance & Repair (502 | 4.8%), and Farming, Fishing & Forestry (18 | 0.2%).
Natural Resources, Construction and Maintenance Occupations by Sex
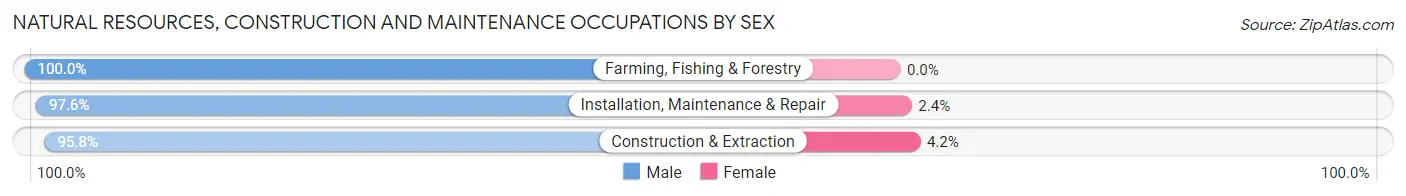
| Occupation | Male | Female |
| Farming, Fishing & Forestry | 18 (100.0%) | 0 (0.0%) |
| Construction & Extraction | 1,288 (95.8%) | 56 (4.2%) |
| Installation, Maintenance & Repair | 490 (97.6%) | 12 (2.4%) |
| Total (Category) | 1,796 (96.4%) | 68 (3.6%) |
| Total (Overall) | 5,850 (56.2%) | 4,558 (43.8%) |
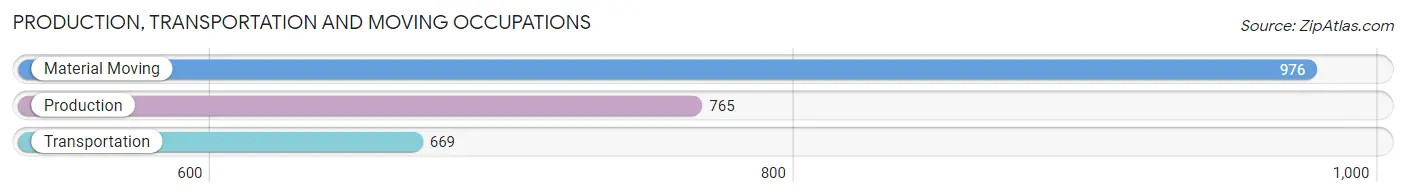
Production, Transportation and Moving Occupations
The most common Production, Transportation and Moving occupations in Sun Valley are Material Moving (976 | 9.4%), Production (765 | 7.3%), and Transportation (669 | 6.4%).
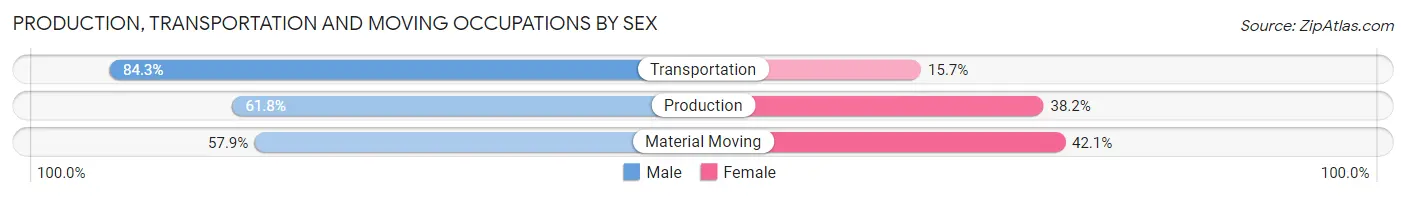
Production, Transportation and Moving Occupations by Sex
| Occupation | Male | Female |
| Production | 473 (61.8%) | 292 (38.2%) |
| Transportation | 564 (84.3%) | 105 (15.7%) |
| Material Moving | 565 (57.9%) | 411 (42.1%) |
| Total (Category) | 1,602 (66.5%) | 808 (33.5%) |
| Total (Overall) | 5,850 (56.2%) | 4,558 (43.8%) |
Employment Industries by Sex in Sun Valley
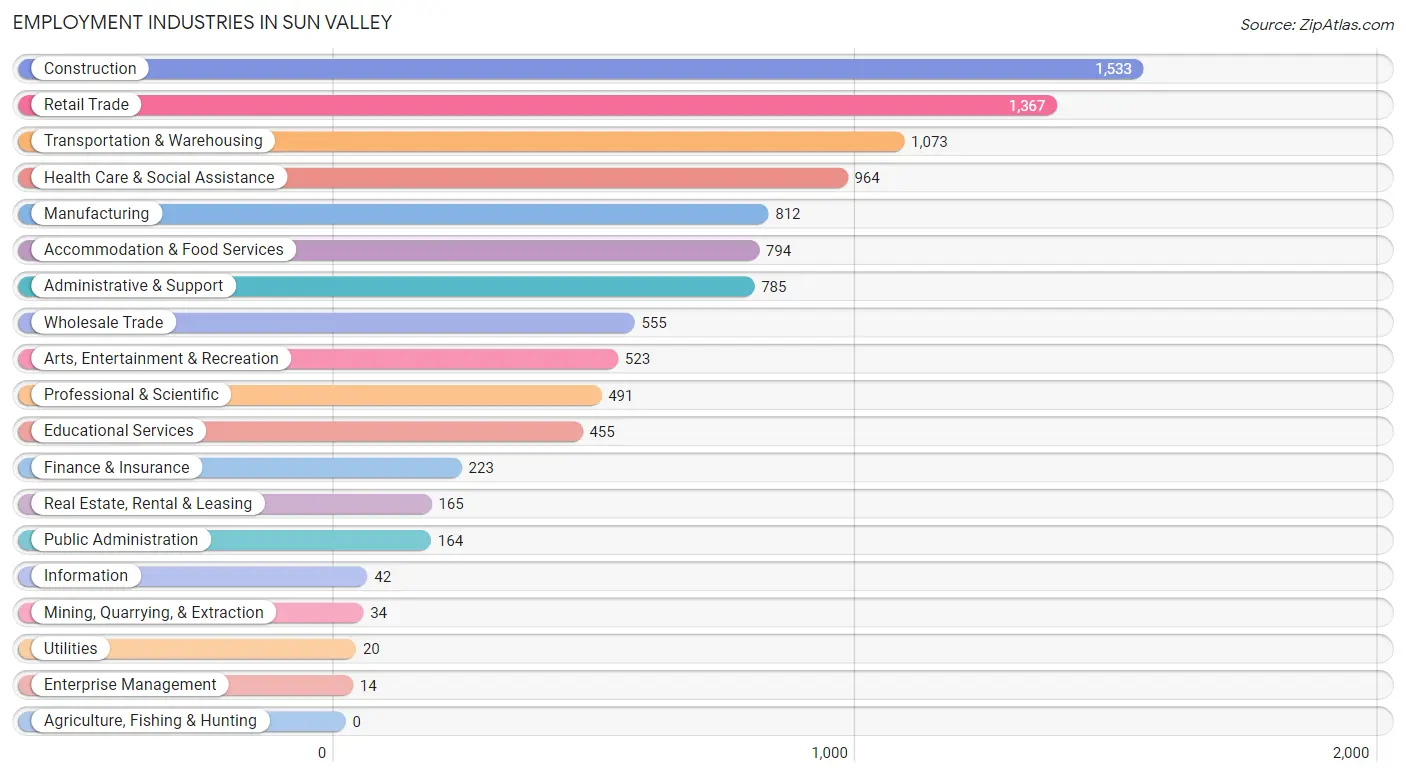
Employment Industries in Sun Valley
The major employment industries in Sun Valley include Construction (1,533 | 14.7%), Retail Trade (1,367 | 13.1%), Transportation & Warehousing (1,073 | 10.3%), Health Care & Social Assistance (964 | 9.3%), and Manufacturing (812 | 7.8%).
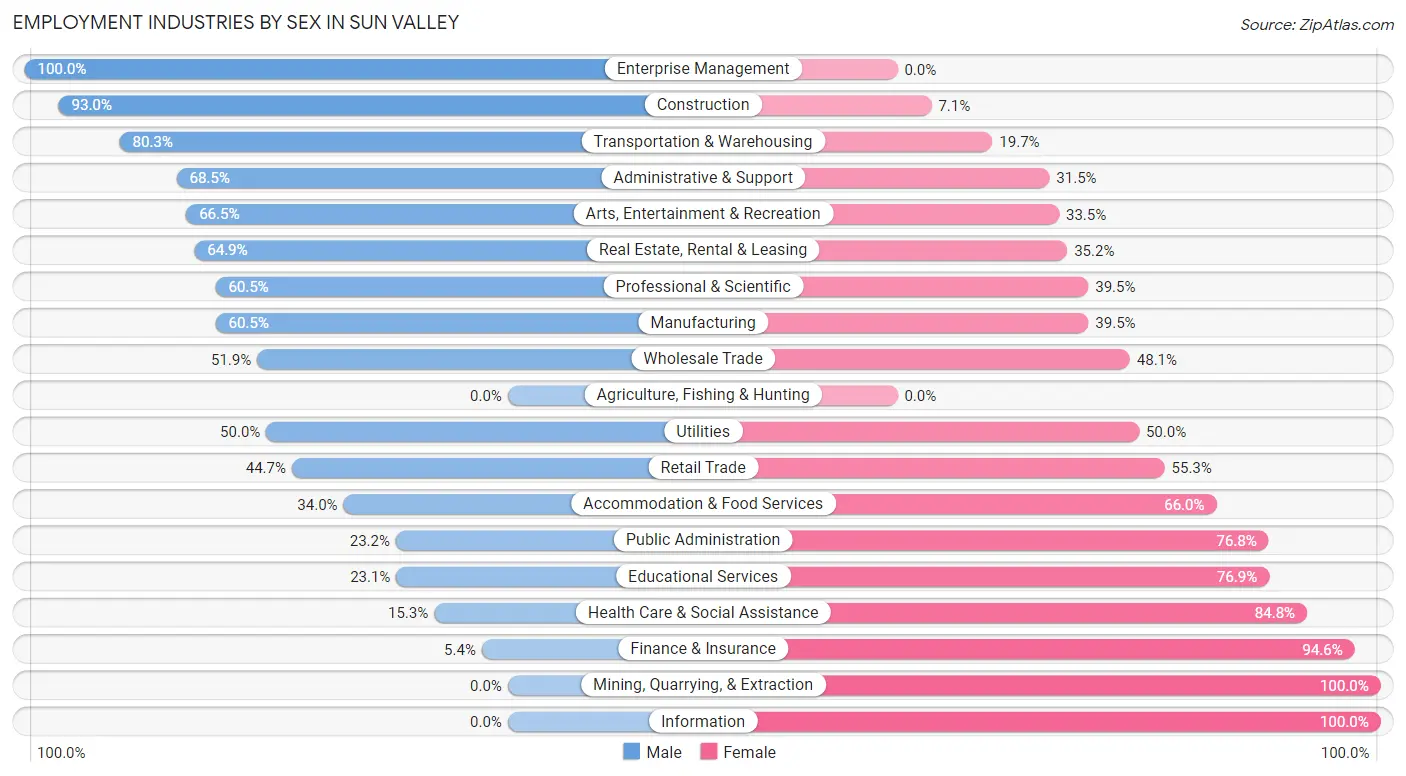
Employment Industries by Sex in Sun Valley
The Sun Valley industries that see more men than women are Enterprise Management (100.0%), Construction (92.9%), and Transportation & Warehousing (80.3%), whereas the industries that tend to have a higher number of women are Mining, Quarrying, & Extraction (100.0%), Information (100.0%), and Finance & Insurance (94.6%).
| Industry | Male | Female |
| Agriculture, Fishing & Hunting | 0 (0.0%) | 0 (0.0%) |
| Mining, Quarrying, & Extraction | 0 (0.0%) | 34 (100.0%) |
| Construction | 1,425 (92.9%) | 108 (7.0%) |
| Manufacturing | 491 (60.5%) | 321 (39.5%) |
| Wholesale Trade | 288 (51.9%) | 267 (48.1%) |
| Retail Trade | 611 (44.7%) | 756 (55.3%) |
| Transportation & Warehousing | 862 (80.3%) | 211 (19.7%) |
| Utilities | 10 (50.0%) | 10 (50.0%) |
| Information | 0 (0.0%) | 42 (100.0%) |
| Finance & Insurance | 12 (5.4%) | 211 (94.6%) |
| Real Estate, Rental & Leasing | 107 (64.8%) | 58 (35.1%) |
| Professional & Scientific | 297 (60.5%) | 194 (39.5%) |
| Enterprise Management | 14 (100.0%) | 0 (0.0%) |
| Administrative & Support | 538 (68.5%) | 247 (31.5%) |
| Educational Services | 105 (23.1%) | 350 (76.9%) |
| Health Care & Social Assistance | 147 (15.2%) | 817 (84.8%) |
| Arts, Entertainment & Recreation | 348 (66.5%) | 175 (33.5%) |
| Accommodation & Food Services | 270 (34.0%) | 524 (66.0%) |
| Public Administration | 38 (23.2%) | 126 (76.8%) |
| Total | 5,850 (56.2%) | 4,558 (43.8%) |
Education in Sun Valley
School Enrollment in Sun Valley
The most common levels of schooling among the 5,533 students in Sun Valley are high school (1,638 | 29.6%), middle school (1,513 | 27.4%), and elementary school (1,191 | 21.5%).
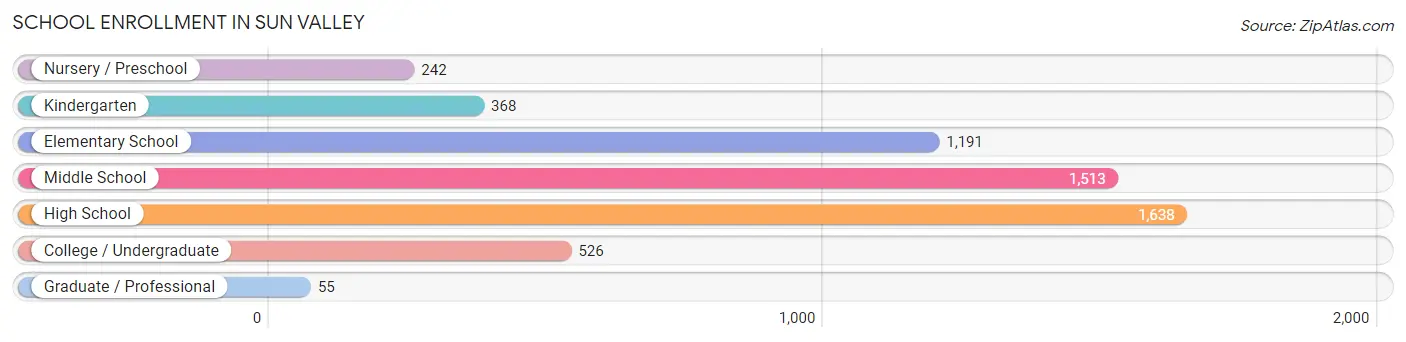
| School Level | # Students | % Students |
| Nursery / Preschool | 242 | 4.4% |
| Kindergarten | 368 | 6.7% |
| Elementary School | 1,191 | 21.5% |
| Middle School | 1,513 | 27.4% |
| High School | 1,638 | 29.6% |
| College / Undergraduate | 526 | 9.5% |
| Graduate / Professional | 55 | 1.0% |
| Total | 5,533 | 100.0% |
School Enrollment by Age by Funding Source in Sun Valley
Out of a total of 5,533 students who are enrolled in schools in Sun Valley, 205 (3.7%) attend a private institution, while the remaining 5,328 (96.3%) are enrolled in public schools. The age group of 25 to 34 year olds has the highest likelihood of being enrolled in private schools, with 41 (26.0% in the age bracket) enrolled. Conversely, the age group of 20 to 24 year olds has the lowest likelihood of being enrolled in a private school, with 149 (100.0% in the age bracket) attending a public institution.
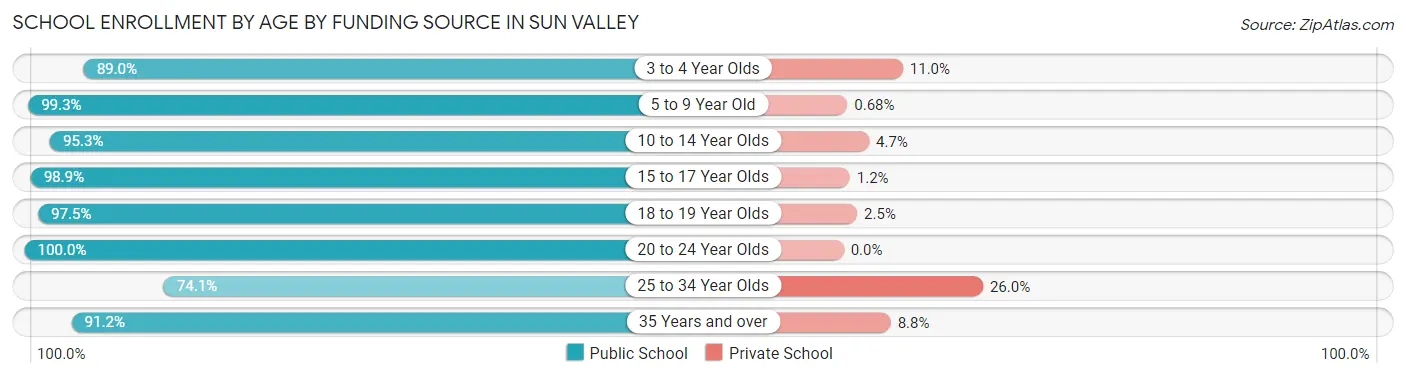
| Age Bracket | Public School | Private School |
| 3 to 4 Year Olds | 218 (89.0%) | 27 (11.0%) |
| 5 to 9 Year Old | 1,470 (99.3%) | 10 (0.7%) |
| 10 to 14 Year Olds | 1,870 (95.3%) | 93 (4.7%) |
| 15 to 17 Year Olds | 1,036 (98.9%) | 12 (1.1%) |
| 18 to 19 Year Olds | 311 (97.5%) | 8 (2.5%) |
| 20 to 24 Year Olds | 149 (100.0%) | 0 (0.0%) |
| 25 to 34 Year Olds | 117 (74.1%) | 41 (26.0%) |
| 35 Years and over | 156 (91.2%) | 15 (8.8%) |
| Total | 5,328 (96.3%) | 205 (3.7%) |
Educational Attainment by Field of Study in Sun Valley
Social sciences (236 | 17.4%), business (163 | 12.0%), education (135 | 10.0%), bio, nature & agricultural (133 | 9.8%), and arts & humanities (132 | 9.7%) are the most common fields of study among 1,356 individuals in Sun Valley who have obtained a bachelor's degree or higher.
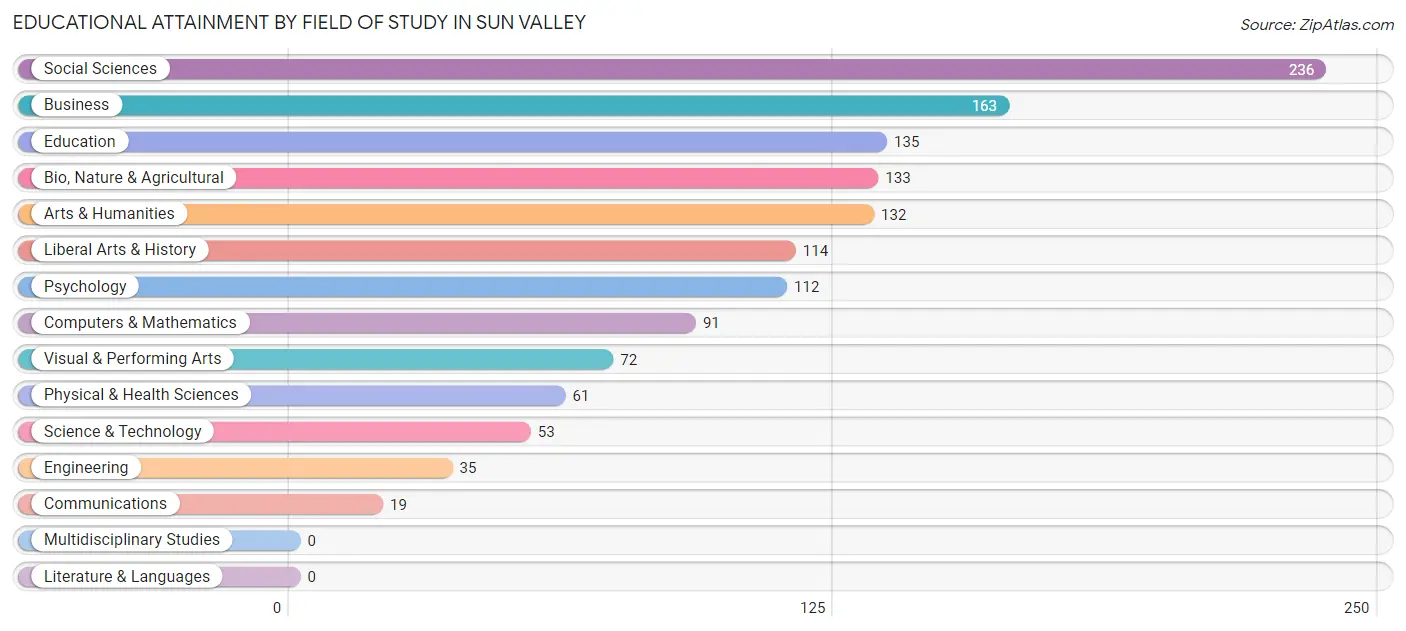
| Field of Study | # Graduates | % Graduates |
| Computers & Mathematics | 91 | 6.7% |
| Bio, Nature & Agricultural | 133 | 9.8% |
| Physical & Health Sciences | 61 | 4.5% |
| Psychology | 112 | 8.3% |
| Social Sciences | 236 | 17.4% |
| Engineering | 35 | 2.6% |
| Multidisciplinary Studies | 0 | 0.0% |
| Science & Technology | 53 | 3.9% |
| Business | 163 | 12.0% |
| Education | 135 | 10.0% |
| Literature & Languages | 0 | 0.0% |
| Liberal Arts & History | 114 | 8.4% |
| Visual & Performing Arts | 72 | 5.3% |
| Communications | 19 | 1.4% |
| Arts & Humanities | 132 | 9.7% |
| Total | 1,356 | 100.0% |
Transportation & Commute in Sun Valley
Vehicle Availability by Sex in Sun Valley
The most prevalent vehicle ownership categories in Sun Valley are males with 2 vehicles (1,808, accounting for 31.1%) and females with 2 vehicles (1,487, making up 41.2%).
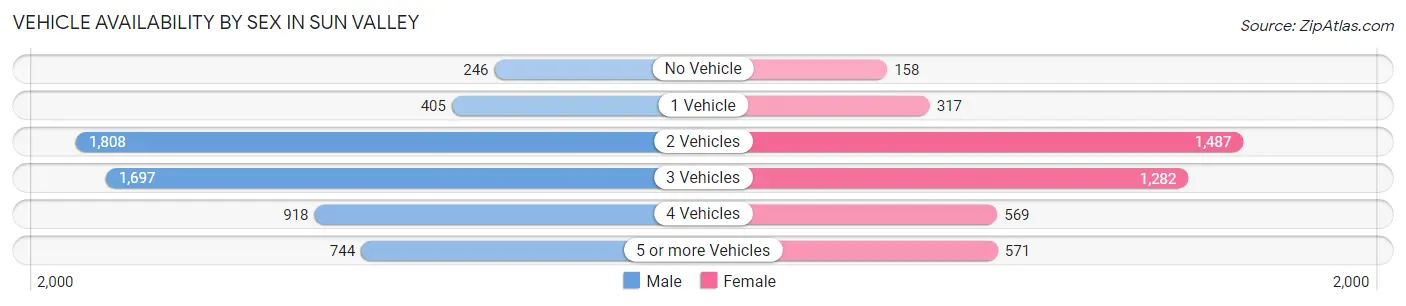
| Vehicles Available | Male | Female |
| No Vehicle | 246 (4.2%) | 158 (3.6%) |
| 1 Vehicle | 405 (7.0%) | 317 (7.2%) |
| 2 Vehicles | 1,808 (31.1%) | 1,487 (33.9%) |
| 3 Vehicles | 1,697 (29.2%) | 1,282 (29.2%) |
| 4 Vehicles | 918 (15.8%) | 569 (13.0%) |
| 5 or more Vehicles | 744 (12.8%) | 571 (13.0%) |
| Total | 5,818 (100.0%) | 4,384 (100.0%) |
Commute Time in Sun Valley
The most frequently occuring commute durations in Sun Valley are 20 to 24 minutes (2,480 commuters, 24.9%), 15 to 19 minutes (2,359 commuters, 23.7%), and 30 to 34 minutes (1,228 commuters, 12.3%).
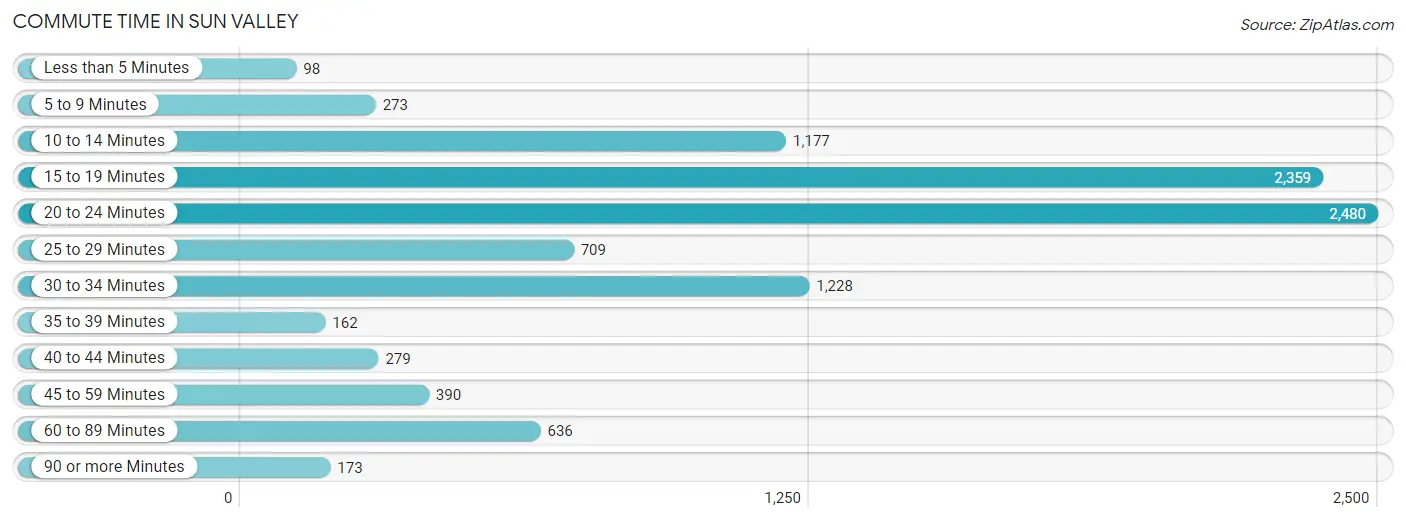
| Commute Time | # Commuters | % Commuters |
| Less than 5 Minutes | 98 | 1.0% |
| 5 to 9 Minutes | 273 | 2.7% |
| 10 to 14 Minutes | 1,177 | 11.8% |
| 15 to 19 Minutes | 2,359 | 23.7% |
| 20 to 24 Minutes | 2,480 | 24.9% |
| 25 to 29 Minutes | 709 | 7.1% |
| 30 to 34 Minutes | 1,228 | 12.3% |
| 35 to 39 Minutes | 162 | 1.6% |
| 40 to 44 Minutes | 279 | 2.8% |
| 45 to 59 Minutes | 390 | 3.9% |
| 60 to 89 Minutes | 636 | 6.4% |
| 90 or more Minutes | 173 | 1.7% |
Commute Time by Sex in Sun Valley
The most common commute times in Sun Valley are 20 to 24 minutes (1,422 commuters, 24.8%) for males and 20 to 24 minutes (1,058 commuters, 25.0%) for females.
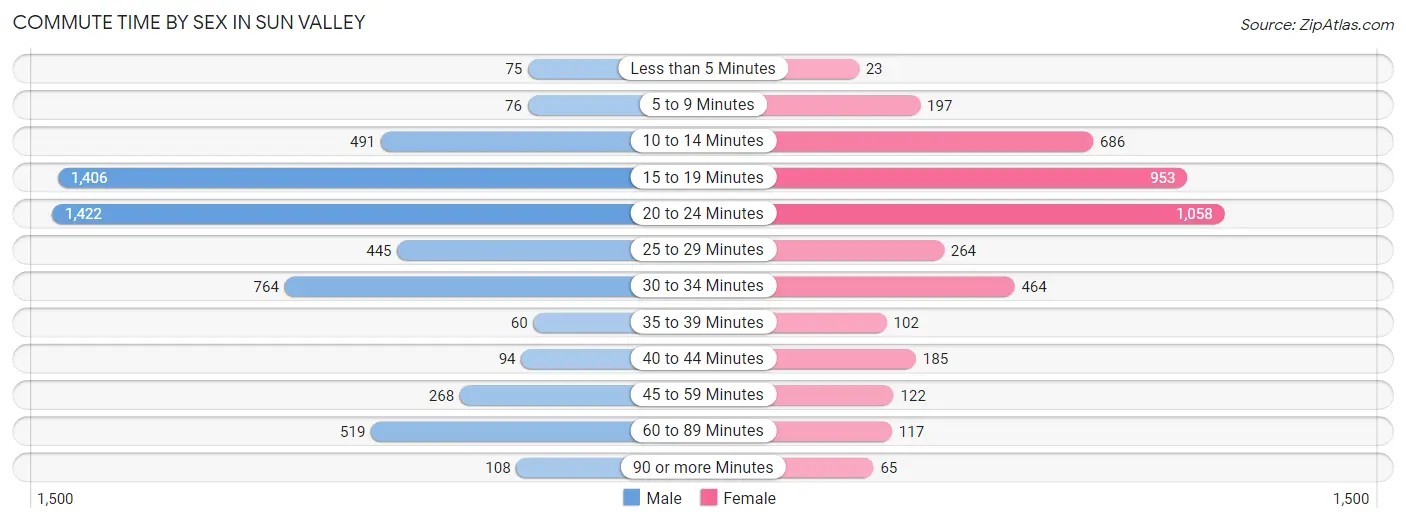
| Commute Time | Male | Female |
| Less than 5 Minutes | 75 (1.3%) | 23 (0.5%) |
| 5 to 9 Minutes | 76 (1.3%) | 197 (4.6%) |
| 10 to 14 Minutes | 491 (8.6%) | 686 (16.2%) |
| 15 to 19 Minutes | 1,406 (24.5%) | 953 (22.5%) |
| 20 to 24 Minutes | 1,422 (24.8%) | 1,058 (25.0%) |
| 25 to 29 Minutes | 445 (7.8%) | 264 (6.2%) |
| 30 to 34 Minutes | 764 (13.3%) | 464 (11.0%) |
| 35 to 39 Minutes | 60 (1.1%) | 102 (2.4%) |
| 40 to 44 Minutes | 94 (1.6%) | 185 (4.4%) |
| 45 to 59 Minutes | 268 (4.7%) | 122 (2.9%) |
| 60 to 89 Minutes | 519 (9.1%) | 117 (2.8%) |
| 90 or more Minutes | 108 (1.9%) | 65 (1.5%) |
Time of Departure to Work by Sex in Sun Valley
The most frequent times of departure to work in Sun Valley are 6:00 AM to 6:29 AM (800, 14.0%) for males and 7:00 AM to 7:29 AM (620, 14.6%) for females.
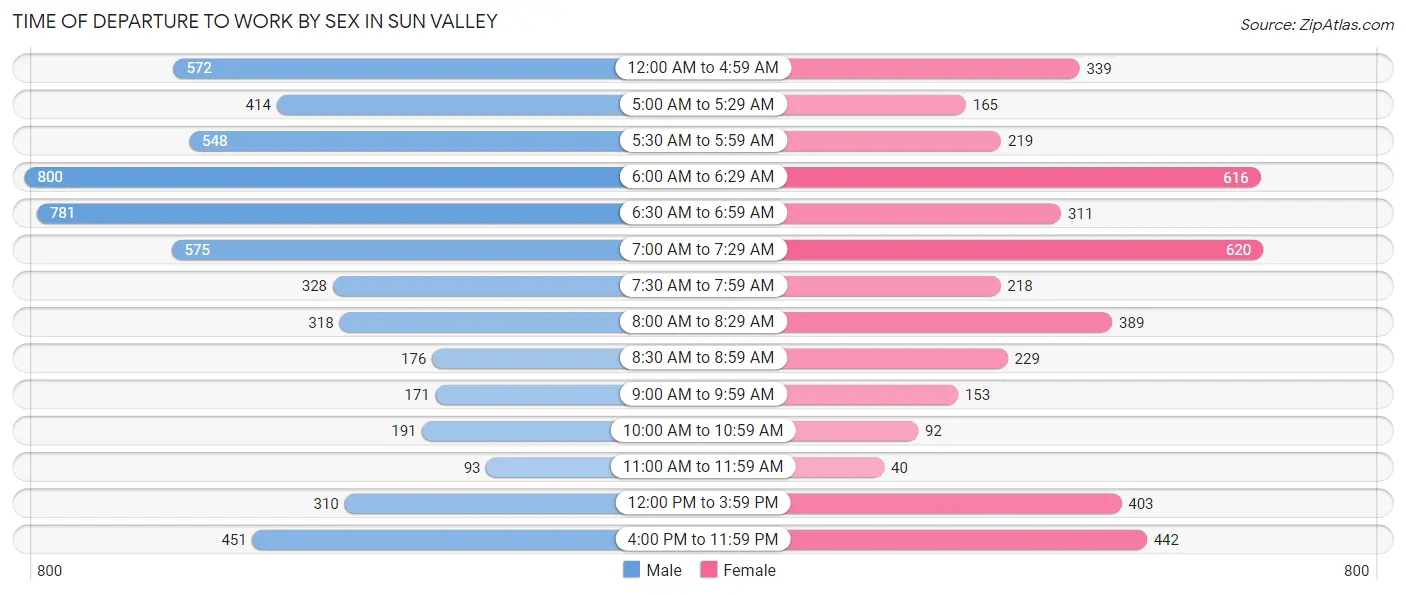
| Time of Departure | Male | Female |
| 12:00 AM to 4:59 AM | 572 (10.0%) | 339 (8.0%) |
| 5:00 AM to 5:29 AM | 414 (7.2%) | 165 (3.9%) |
| 5:30 AM to 5:59 AM | 548 (9.6%) | 219 (5.2%) |
| 6:00 AM to 6:29 AM | 800 (14.0%) | 616 (14.5%) |
| 6:30 AM to 6:59 AM | 781 (13.6%) | 311 (7.3%) |
| 7:00 AM to 7:29 AM | 575 (10.0%) | 620 (14.6%) |
| 7:30 AM to 7:59 AM | 328 (5.7%) | 218 (5.1%) |
| 8:00 AM to 8:29 AM | 318 (5.6%) | 389 (9.2%) |
| 8:30 AM to 8:59 AM | 176 (3.1%) | 229 (5.4%) |
| 9:00 AM to 9:59 AM | 171 (3.0%) | 153 (3.6%) |
| 10:00 AM to 10:59 AM | 191 (3.3%) | 92 (2.2%) |
| 11:00 AM to 11:59 AM | 93 (1.6%) | 40 (0.9%) |
| 12:00 PM to 3:59 PM | 310 (5.4%) | 403 (9.5%) |
| 4:00 PM to 11:59 PM | 451 (7.9%) | 442 (10.4%) |
| Total | 5,728 (100.0%) | 4,236 (100.0%) |
Housing Occupancy in Sun Valley
Occupancy by Ownership in Sun Valley
Of the total 6,920 dwellings in Sun Valley, owner-occupied units account for 4,957 (71.6%), while renter-occupied units make up 1,963 (28.4%).
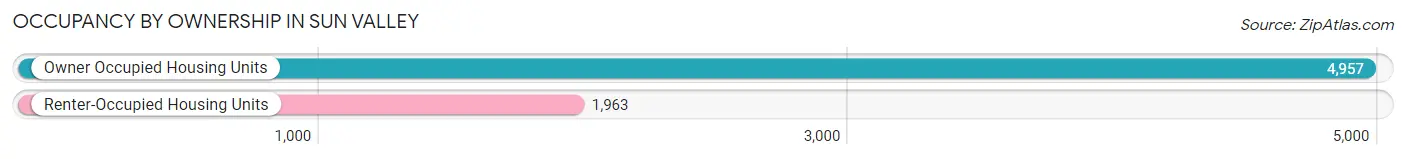
| Occupancy | # Housing Units | % Housing Units |
| Owner Occupied Housing Units | 4,957 | 71.6% |
| Renter-Occupied Housing Units | 1,963 | 28.4% |
| Total Occupied Housing Units | 6,920 | 100.0% |
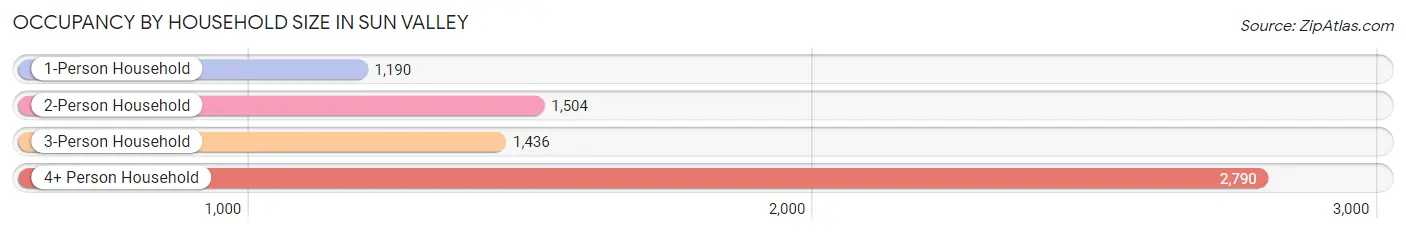
Occupancy by Household Size in Sun Valley
| Household Size | # Housing Units | % Housing Units |
| 1-Person Household | 1,190 | 17.2% |
| 2-Person Household | 1,504 | 21.7% |
| 3-Person Household | 1,436 | 20.7% |
| 4+ Person Household | 2,790 | 40.3% |
| Total Housing Units | 6,920 | 100.0% |
Occupancy by Ownership by Household Size in Sun Valley
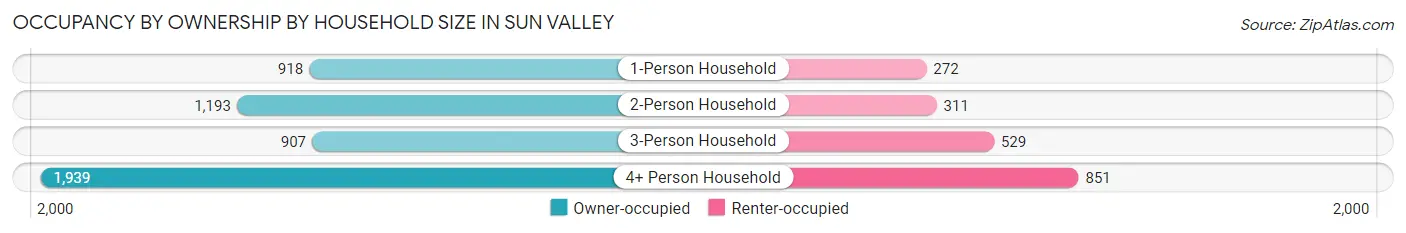
| Household Size | Owner-occupied | Renter-occupied |
| 1-Person Household | 918 (77.1%) | 272 (22.9%) |
| 2-Person Household | 1,193 (79.3%) | 311 (20.7%) |
| 3-Person Household | 907 (63.2%) | 529 (36.8%) |
| 4+ Person Household | 1,939 (69.5%) | 851 (30.5%) |
| Total Housing Units | 4,957 (71.6%) | 1,963 (28.4%) |
Occupancy by Educational Attainment in Sun Valley
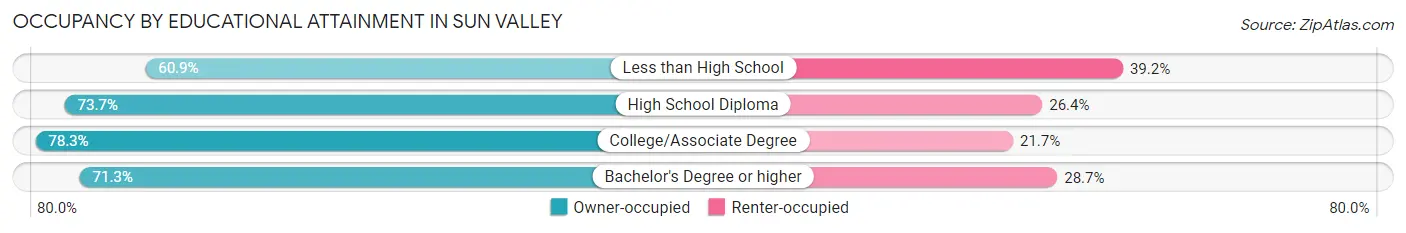
| Household Size | Owner-occupied | Renter-occupied |
| Less than High School | 1,133 (60.9%) | 729 (39.2%) |
| High School Diploma | 1,470 (73.7%) | 526 (26.4%) |
| College/Associate Degree | 1,915 (78.3%) | 531 (21.7%) |
| Bachelor's Degree or higher | 439 (71.3%) | 177 (28.7%) |
Occupancy by Age of Householder in Sun Valley
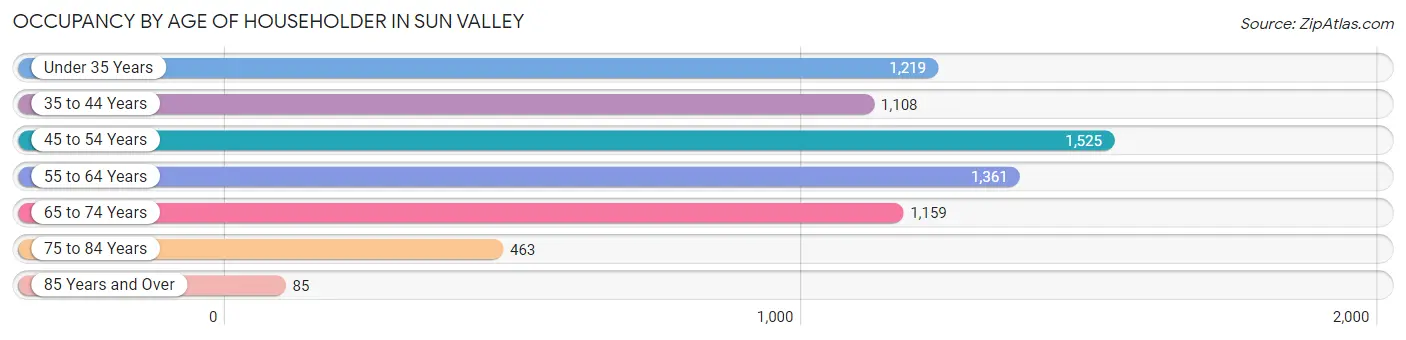
| Age Bracket | # Households | % Households |
| Under 35 Years | 1,219 | 17.6% |
| 35 to 44 Years | 1,108 | 16.0% |
| 45 to 54 Years | 1,525 | 22.0% |
| 55 to 64 Years | 1,361 | 19.7% |
| 65 to 74 Years | 1,159 | 16.8% |
| 75 to 84 Years | 463 | 6.7% |
| 85 Years and Over | 85 | 1.2% |
| Total | 6,920 | 100.0% |
Housing Finances in Sun Valley
Median Income by Occupancy in Sun Valley
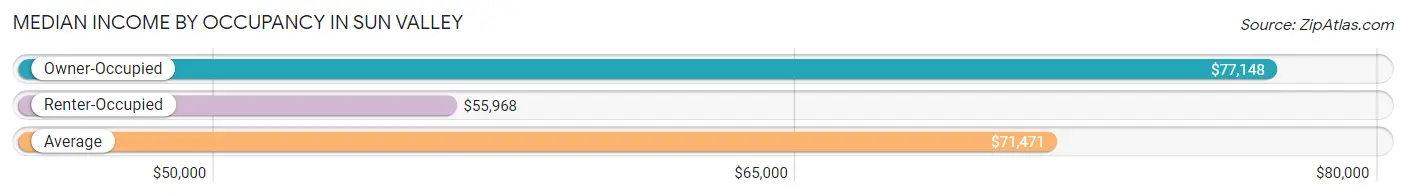
| Occupancy Type | # Households | Median Income |
| Owner-Occupied | 4,957 (71.6%) | $77,148 |
| Renter-Occupied | 1,963 (28.4%) | $55,968 |
| Average | 6,920 (100.0%) | $71,471 |
Occupancy by Householder Income Bracket in Sun Valley
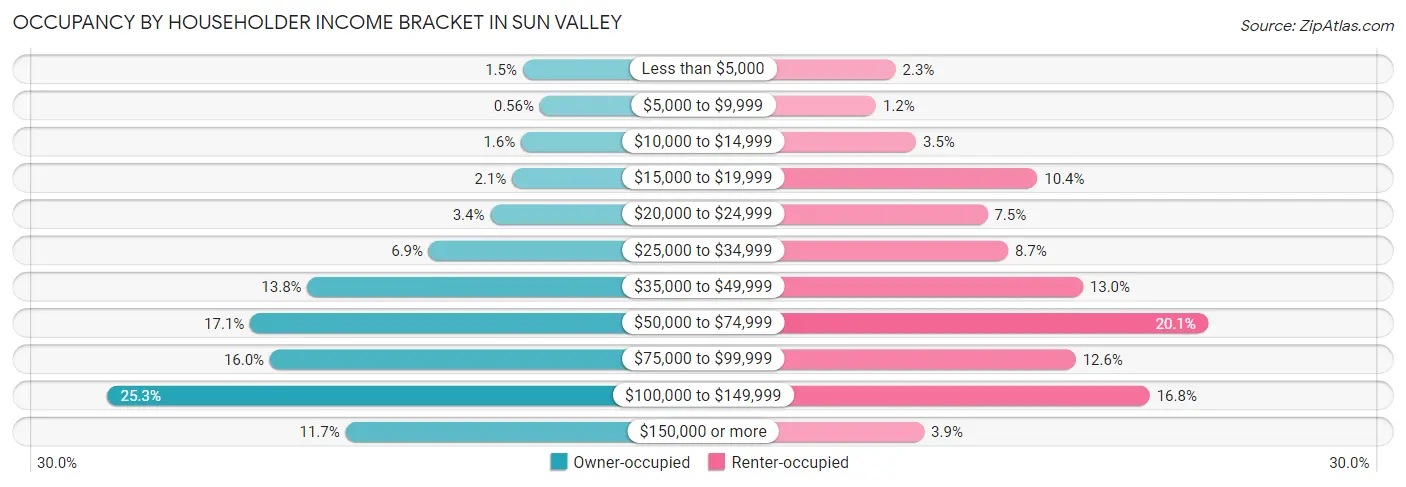
| Income Bracket | Owner-occupied | Renter-occupied |
| Less than $5,000 | 76 (1.5%) | 45 (2.3%) |
| $5,000 to $9,999 | 28 (0.6%) | 23 (1.2%) |
| $10,000 to $14,999 | 81 (1.6%) | 68 (3.5%) |
| $15,000 to $19,999 | 106 (2.1%) | 204 (10.4%) |
| $20,000 to $24,999 | 168 (3.4%) | 148 (7.5%) |
| $25,000 to $34,999 | 342 (6.9%) | 171 (8.7%) |
| $35,000 to $49,999 | 686 (13.8%) | 255 (13.0%) |
| $50,000 to $74,999 | 848 (17.1%) | 395 (20.1%) |
| $75,000 to $99,999 | 792 (16.0%) | 247 (12.6%) |
| $100,000 to $149,999 | 1,252 (25.3%) | 330 (16.8%) |
| $150,000 or more | 578 (11.7%) | 77 (3.9%) |
| Total | 4,957 (100.0%) | 1,963 (100.0%) |
Monthly Housing Cost Tiers in Sun Valley
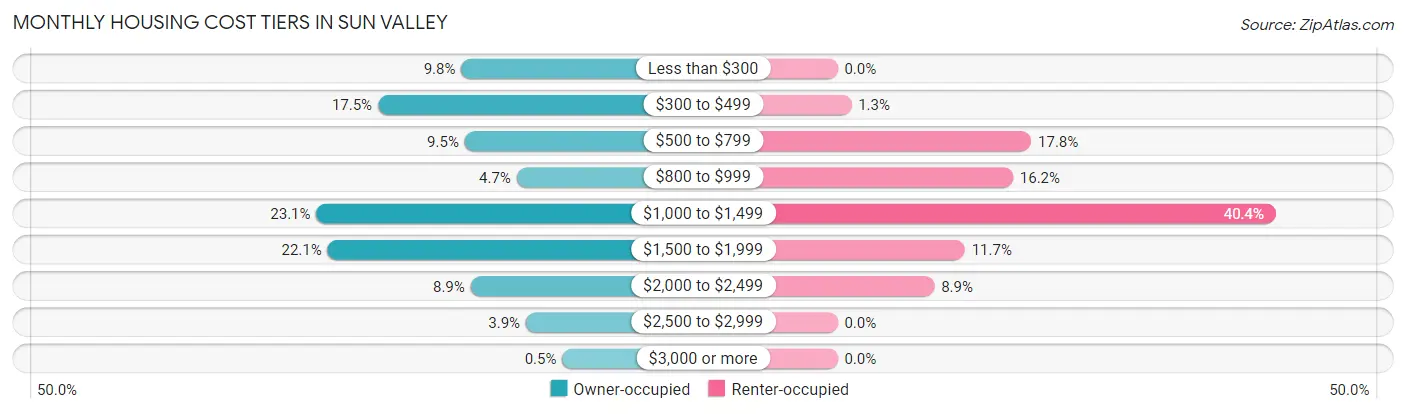
| Monthly Cost | Owner-occupied | Renter-occupied |
| Less than $300 | 486 (9.8%) | 0 (0.0%) |
| $300 to $499 | 866 (17.5%) | 25 (1.3%) |
| $500 to $799 | 470 (9.5%) | 350 (17.8%) |
| $800 to $999 | 233 (4.7%) | 317 (16.2%) |
| $1,000 to $1,499 | 1,147 (23.1%) | 792 (40.4%) |
| $1,500 to $1,999 | 1,096 (22.1%) | 230 (11.7%) |
| $2,000 to $2,499 | 443 (8.9%) | 175 (8.9%) |
| $2,500 to $2,999 | 191 (3.8%) | 0 (0.0%) |
| $3,000 or more | 25 (0.5%) | 0 (0.0%) |
| Total | 4,957 (100.0%) | 1,963 (100.0%) |
Physical Housing Characteristics in Sun Valley
Housing Structures in Sun Valley
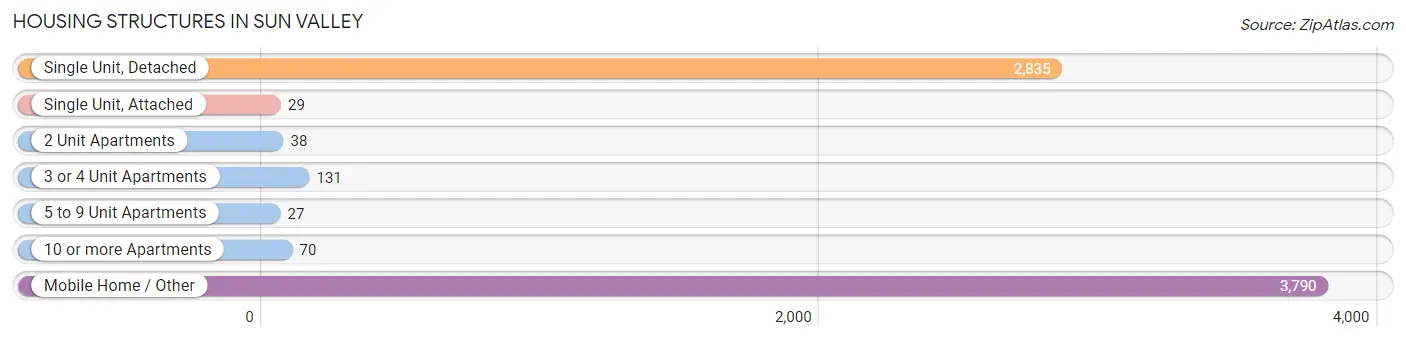
| Structure Type | # Housing Units | % Housing Units |
| Single Unit, Detached | 2,835 | 41.0% |
| Single Unit, Attached | 29 | 0.4% |
| 2 Unit Apartments | 38 | 0.5% |
| 3 or 4 Unit Apartments | 131 | 1.9% |
| 5 to 9 Unit Apartments | 27 | 0.4% |
| 10 or more Apartments | 70 | 1.0% |
| Mobile Home / Other | 3,790 | 54.8% |
| Total | 6,920 | 100.0% |
Housing Structures by Occupancy in Sun Valley
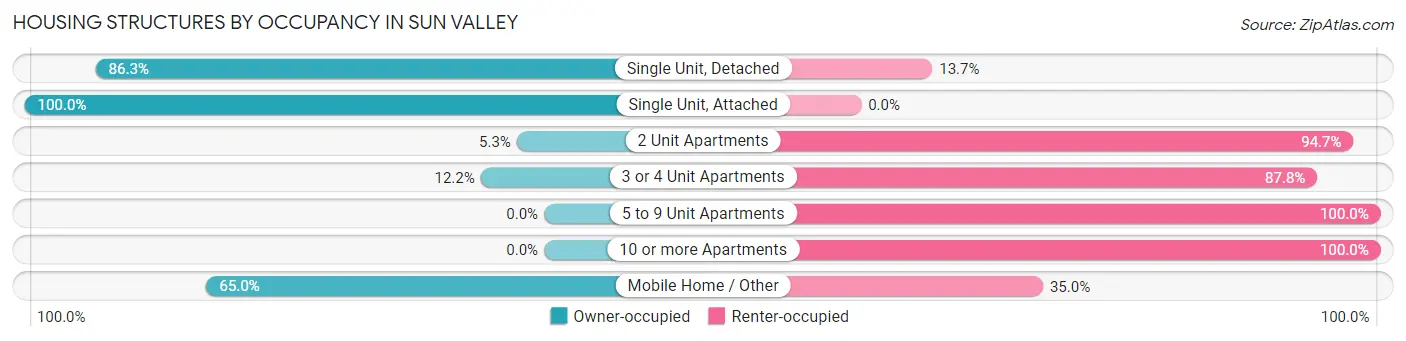
| Structure Type | Owner-occupied | Renter-occupied |
| Single Unit, Detached | 2,447 (86.3%) | 388 (13.7%) |
| Single Unit, Attached | 29 (100.0%) | 0 (0.0%) |
| 2 Unit Apartments | 2 (5.3%) | 36 (94.7%) |
| 3 or 4 Unit Apartments | 16 (12.2%) | 115 (87.8%) |
| 5 to 9 Unit Apartments | 0 (0.0%) | 27 (100.0%) |
| 10 or more Apartments | 0 (0.0%) | 70 (100.0%) |
| Mobile Home / Other | 2,463 (65.0%) | 1,327 (35.0%) |
| Total | 4,957 (71.6%) | 1,963 (28.4%) |
Housing Structures by Number of Rooms in Sun Valley
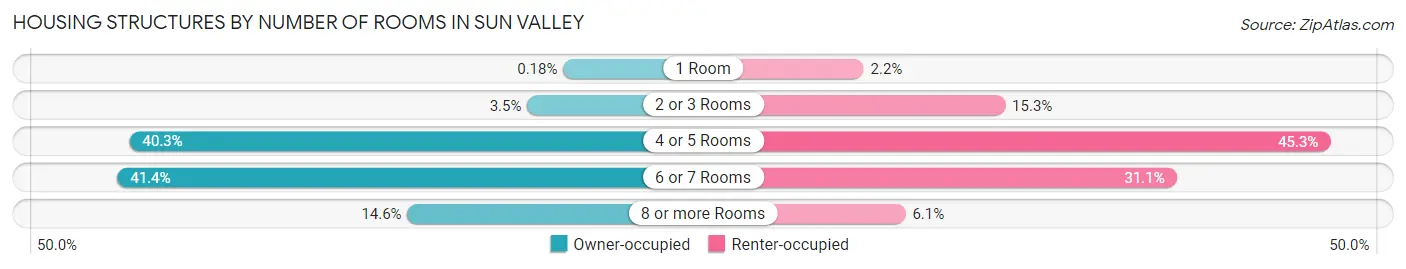
| Number of Rooms | Owner-occupied | Renter-occupied |
| 1 Room | 9 (0.2%) | 43 (2.2%) |
| 2 or 3 Rooms | 174 (3.5%) | 300 (15.3%) |
| 4 or 5 Rooms | 1,998 (40.3%) | 890 (45.3%) |
| 6 or 7 Rooms | 2,053 (41.4%) | 611 (31.1%) |
| 8 or more Rooms | 723 (14.6%) | 119 (6.1%) |
| Total | 4,957 (100.0%) | 1,963 (100.0%) |
Housing Structure by Heating Type in Sun Valley
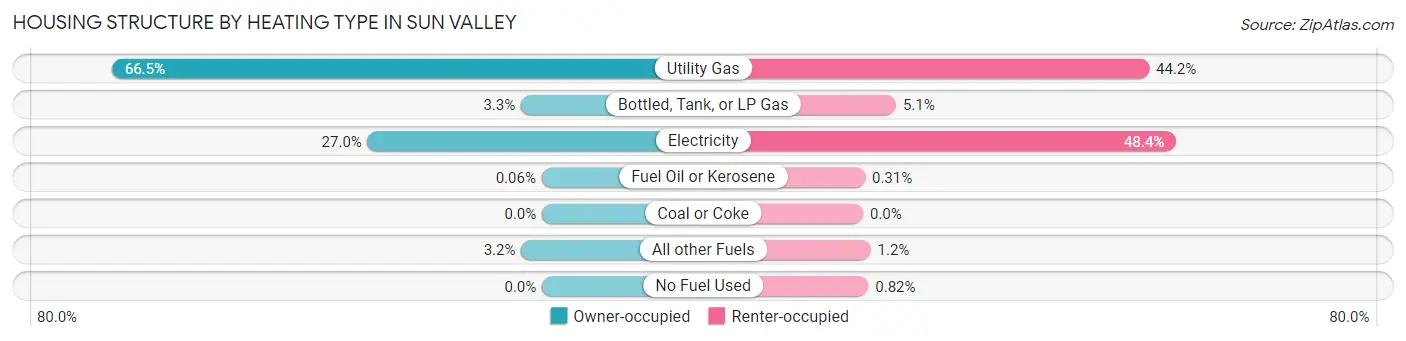
| Heating Type | Owner-occupied | Renter-occupied |
| Utility Gas | 3,297 (66.5%) | 868 (44.2%) |
| Bottled, Tank, or LP Gas | 161 (3.3%) | 100 (5.1%) |
| Electricity | 1,337 (27.0%) | 950 (48.4%) |
| Fuel Oil or Kerosene | 3 (0.1%) | 6 (0.3%) |
| Coal or Coke | 0 (0.0%) | 0 (0.0%) |
| All other Fuels | 159 (3.2%) | 23 (1.2%) |
| No Fuel Used | 0 (0.0%) | 16 (0.8%) |
| Total | 4,957 (100.0%) | 1,963 (100.0%) |
Household Vehicle Usage in Sun Valley
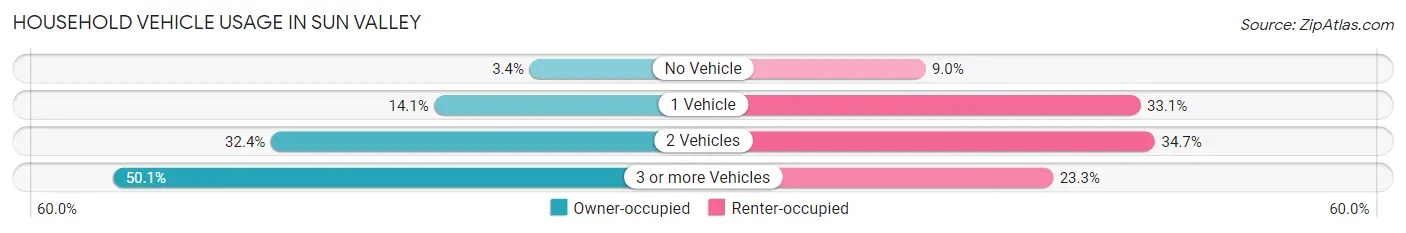
| Vehicles per Household | Owner-occupied | Renter-occupied |
| No Vehicle | 169 (3.4%) | 176 (9.0%) |
| 1 Vehicle | 698 (14.1%) | 649 (33.1%) |
| 2 Vehicles | 1,605 (32.4%) | 681 (34.7%) |
| 3 or more Vehicles | 2,485 (50.1%) | 457 (23.3%) |
| Total | 4,957 (100.0%) | 1,963 (100.0%) |
Real Estate & Mortgages in Sun Valley
Real Estate and Mortgage Overview in Sun Valley
| Characteristic | Without Mortgage | With Mortgage |
| Housing Units | 1,832 | 3,125 |
| Median Property Value | $215,400 | $309,900 |
| Median Household Income | $62,792 | $403 |
| Monthly Housing Costs | $386 | $25 |
| Real Estate Taxes | $695 | $65 |
Property Value by Mortgage Status in Sun Valley
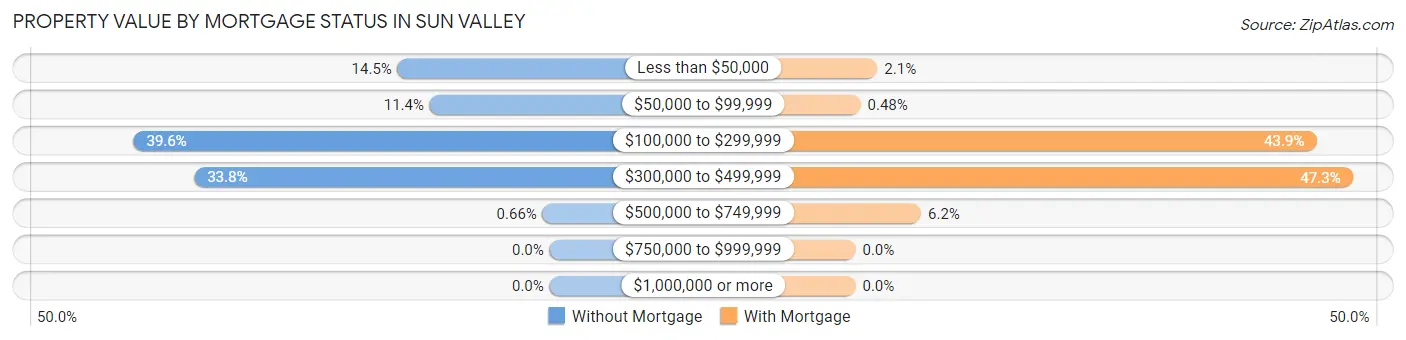
| Property Value | Without Mortgage | With Mortgage |
| Less than $50,000 | 265 (14.5%) | 65 (2.1%) |
| $50,000 to $99,999 | 209 (11.4%) | 15 (0.5%) |
| $100,000 to $299,999 | 726 (39.6%) | 1,371 (43.9%) |
| $300,000 to $499,999 | 620 (33.8%) | 1,479 (47.3%) |
| $500,000 to $749,999 | 12 (0.7%) | 195 (6.2%) |
| $750,000 to $999,999 | 0 (0.0%) | 0 (0.0%) |
| $1,000,000 or more | 0 (0.0%) | 0 (0.0%) |
| Total | 1,832 (100.0%) | 3,125 (100.0%) |
Household Income by Mortgage Status in Sun Valley
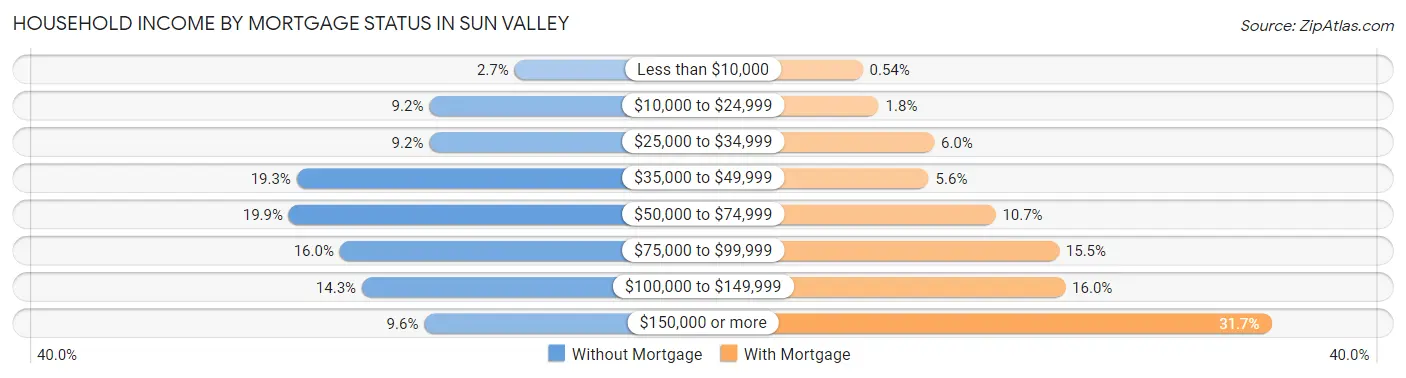
| Household Income | Without Mortgage | With Mortgage |
| Less than $10,000 | 49 (2.7%) | 17 (0.5%) |
| $10,000 to $24,999 | 168 (9.2%) | 55 (1.8%) |
| $25,000 to $34,999 | 168 (9.2%) | 187 (6.0%) |
| $35,000 to $49,999 | 353 (19.3%) | 174 (5.6%) |
| $50,000 to $74,999 | 364 (19.9%) | 333 (10.7%) |
| $75,000 to $99,999 | 293 (16.0%) | 484 (15.5%) |
| $100,000 to $149,999 | 262 (14.3%) | 499 (16.0%) |
| $150,000 or more | 175 (9.6%) | 990 (31.7%) |
| Total | 1,832 (100.0%) | 3,125 (100.0%) |
Property Value to Household Income Ratio in Sun Valley
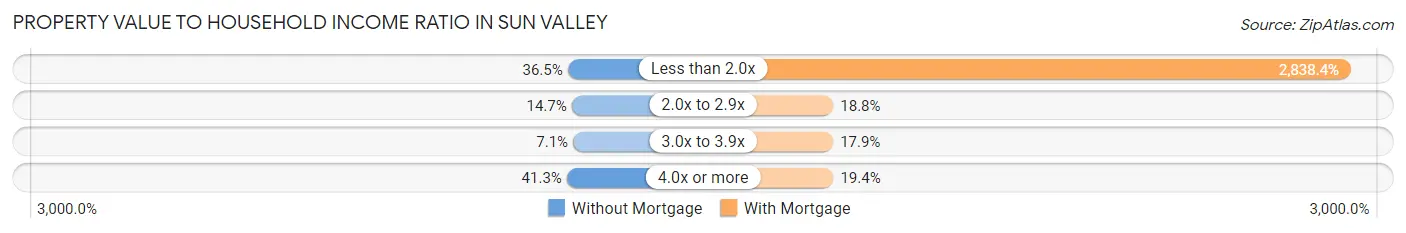
| Value-to-Income Ratio | Without Mortgage | With Mortgage |
| Less than 2.0x | 669 (36.5%) | 88,701 (2,838.4%) |
| 2.0x to 2.9x | 269 (14.7%) | 588 (18.8%) |
| 3.0x to 3.9x | 130 (7.1%) | 558 (17.9%) |
| 4.0x or more | 756 (41.3%) | 607 (19.4%) |
| Total | 1,832 (100.0%) | 3,125 (100.0%) |
Real Estate Taxes by Mortgage Status in Sun Valley
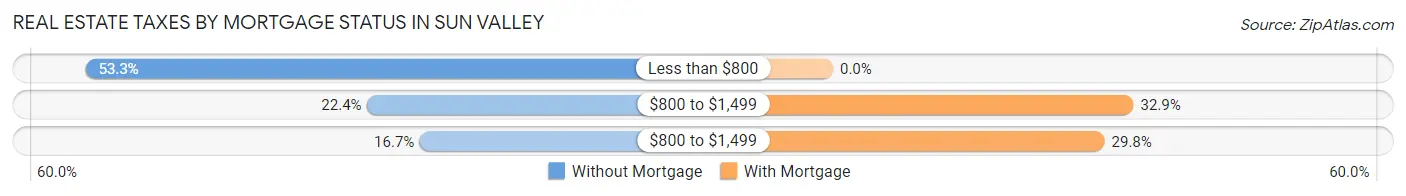
| Property Taxes | Without Mortgage | With Mortgage |
| Less than $800 | 977 (53.3%) | 0 (0.0%) |
| $800 to $1,499 | 411 (22.4%) | 1,029 (32.9%) |
| $800 to $1,499 | 305 (16.7%) | 930 (29.8%) |
| Total | 1,832 (100.0%) | 3,125 (100.0%) |
Health & Disability in Sun Valley
Health Insurance Coverage by Age in Sun Valley
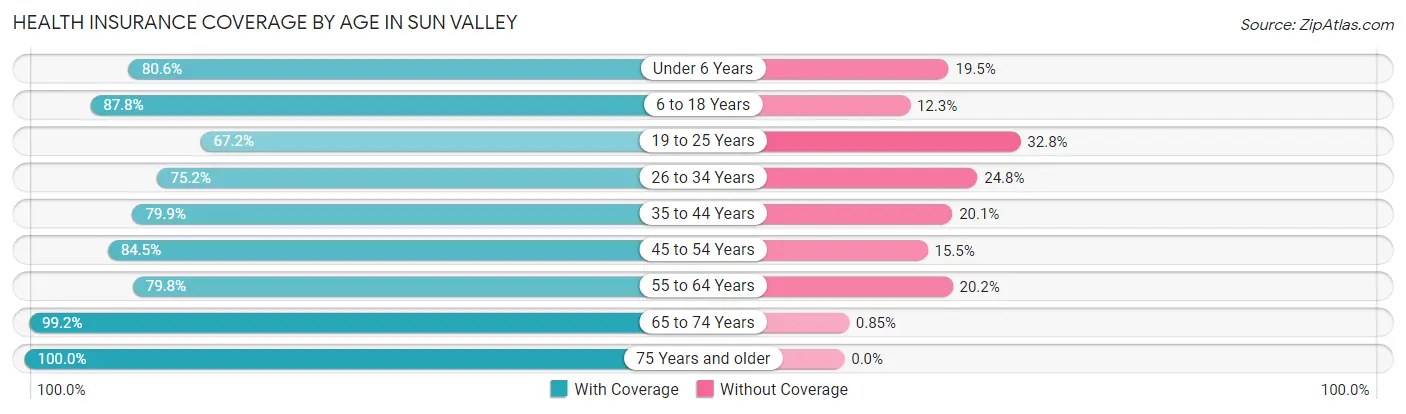
| Age Bracket | With Coverage | Without Coverage |
| Under 6 Years | 1,764 (80.5%) | 426 (19.5%) |
| 6 to 18 Years | 4,282 (87.7%) | 598 (12.2%) |
| 19 to 25 Years | 1,088 (67.2%) | 532 (32.8%) |
| 26 to 34 Years | 2,628 (75.2%) | 867 (24.8%) |
| 35 to 44 Years | 1,787 (79.9%) | 450 (20.1%) |
| 45 to 54 Years | 2,667 (84.5%) | 490 (15.5%) |
| 55 to 64 Years | 2,025 (79.8%) | 512 (20.2%) |
| 65 to 74 Years | 1,638 (99.2%) | 14 (0.9%) |
| 75 Years and older | 1,007 (100.0%) | 0 (0.0%) |
| Total | 18,886 (82.9%) | 3,889 (17.1%) |
Health Insurance Coverage by Citizenship Status in Sun Valley
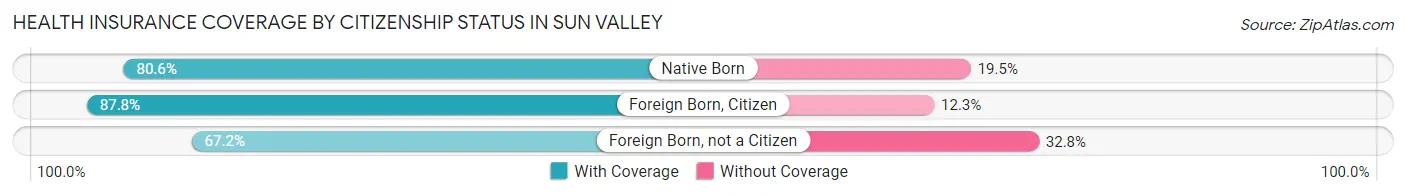
| Citizenship Status | With Coverage | Without Coverage |
| Native Born | 1,764 (80.5%) | 426 (19.5%) |
| Foreign Born, Citizen | 4,282 (87.7%) | 598 (12.2%) |
| Foreign Born, not a Citizen | 1,088 (67.2%) | 532 (32.8%) |
Health Insurance Coverage by Household Income in Sun Valley
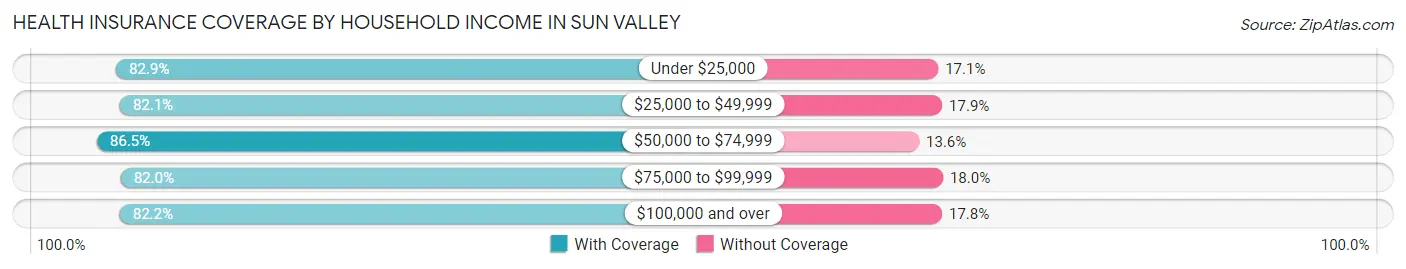
| Household Income | With Coverage | Without Coverage |
| Under $25,000 | 1,770 (82.9%) | 366 (17.1%) |
| $25,000 to $49,999 | 3,130 (82.1%) | 681 (17.9%) |
| $50,000 to $74,999 | 3,355 (86.5%) | 526 (13.6%) |
| $75,000 to $99,999 | 2,867 (82.0%) | 630 (18.0%) |
| $100,000 and over | 7,764 (82.2%) | 1,686 (17.8%) |
Public vs Private Health Insurance Coverage by Age in Sun Valley
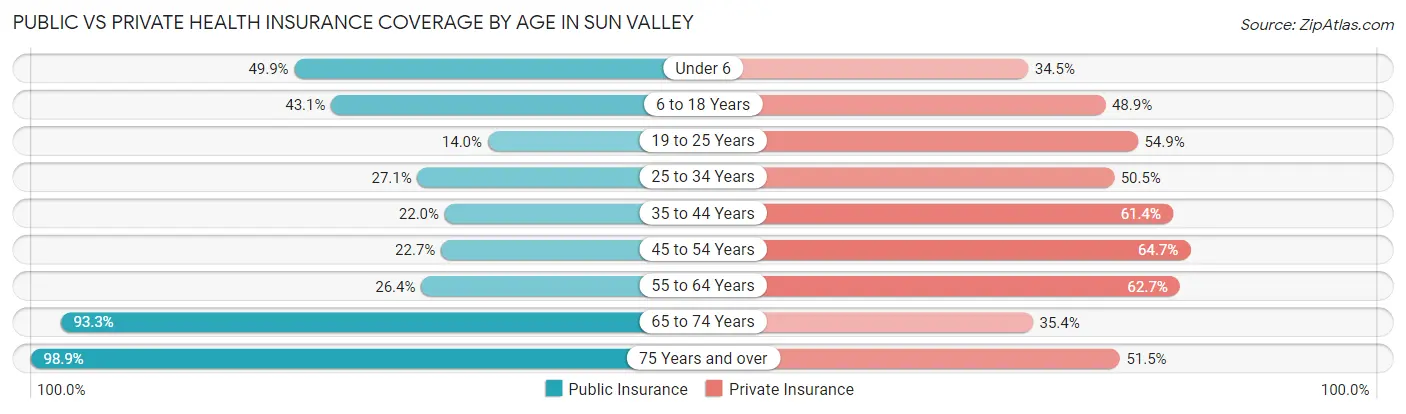
| Age Bracket | Public Insurance | Private Insurance |
| Under 6 | 1,093 (49.9%) | 756 (34.5%) |
| 6 to 18 Years | 2,102 (43.1%) | 2,384 (48.8%) |
| 19 to 25 Years | 227 (14.0%) | 889 (54.9%) |
| 25 to 34 Years | 946 (27.1%) | 1,764 (50.5%) |
| 35 to 44 Years | 492 (22.0%) | 1,374 (61.4%) |
| 45 to 54 Years | 716 (22.7%) | 2,041 (64.6%) |
| 55 to 64 Years | 669 (26.4%) | 1,591 (62.7%) |
| 65 to 74 Years | 1,542 (93.3%) | 585 (35.4%) |
| 75 Years and over | 996 (98.9%) | 519 (51.5%) |
| Total | 8,783 (38.6%) | 11,903 (52.3%) |
Disability Status by Sex by Age in Sun Valley
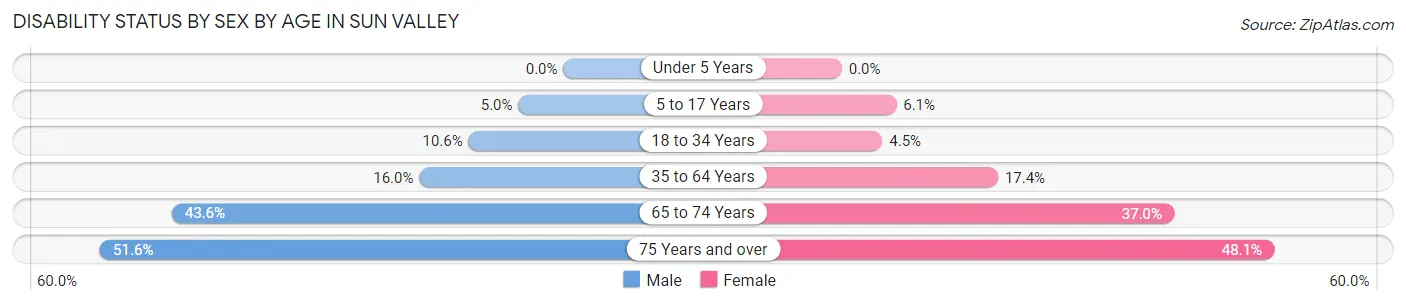
| Age Bracket | Male | Female |
| Under 5 Years | 0 (0.0%) | 0 (0.0%) |
| 5 to 17 Years | 111 (5.0%) | 150 (6.1%) |
| 18 to 34 Years | 323 (10.6%) | 120 (4.5%) |
| 35 to 64 Years | 658 (16.0%) | 666 (17.4%) |
| 65 to 74 Years | 429 (43.6%) | 247 (37.0%) |
| 75 Years and over | 245 (51.6%) | 256 (48.1%) |
Disability Class by Sex by Age in Sun Valley
Disability Class: Hearing Difficulty
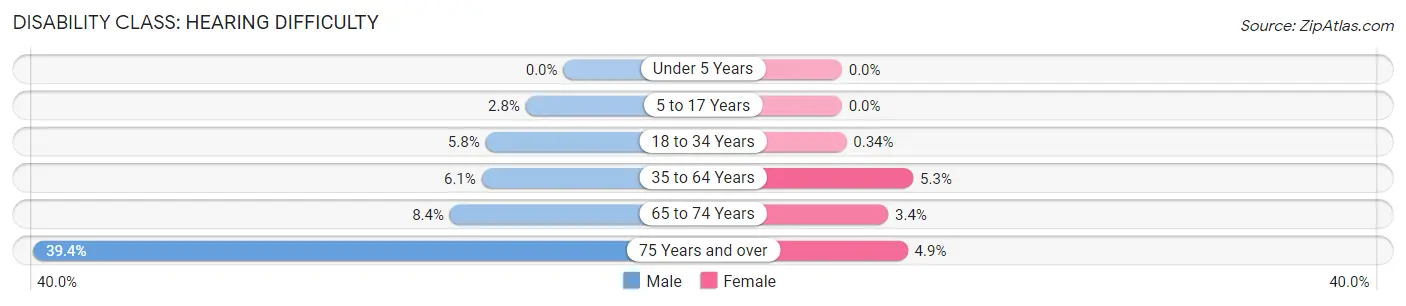
| Age Bracket | Male | Female |
| Under 5 Years | 0 (0.0%) | 0 (0.0%) |
| 5 to 17 Years | 62 (2.8%) | 0 (0.0%) |
| 18 to 34 Years | 177 (5.8%) | 9 (0.3%) |
| 35 to 64 Years | 249 (6.1%) | 203 (5.3%) |
| 65 to 74 Years | 83 (8.4%) | 23 (3.4%) |
| 75 Years and over | 187 (39.4%) | 26 (4.9%) |
Disability Class: Vision Difficulty
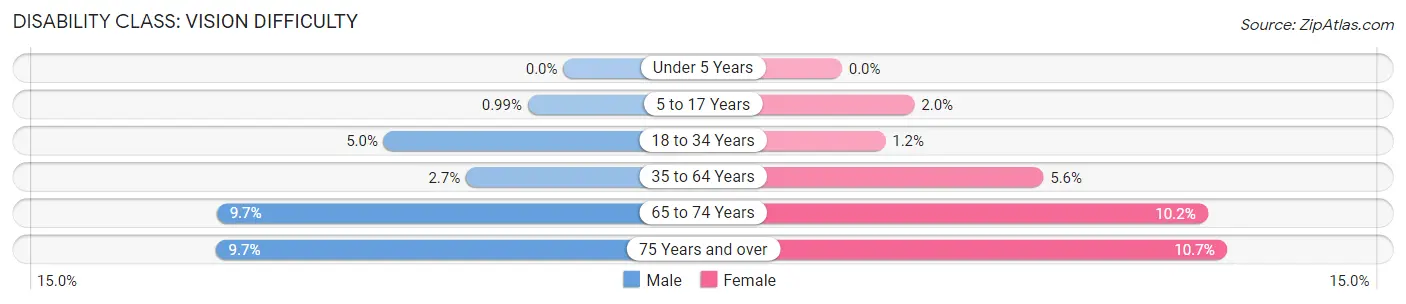
| Age Bracket | Male | Female |
| Under 5 Years | 0 (0.0%) | 0 (0.0%) |
| 5 to 17 Years | 22 (1.0%) | 50 (2.0%) |
| 18 to 34 Years | 153 (5.0%) | 32 (1.2%) |
| 35 to 64 Years | 111 (2.7%) | 215 (5.6%) |
| 65 to 74 Years | 95 (9.7%) | 68 (10.2%) |
| 75 Years and over | 46 (9.7%) | 57 (10.7%) |
Disability Class: Cognitive Difficulty
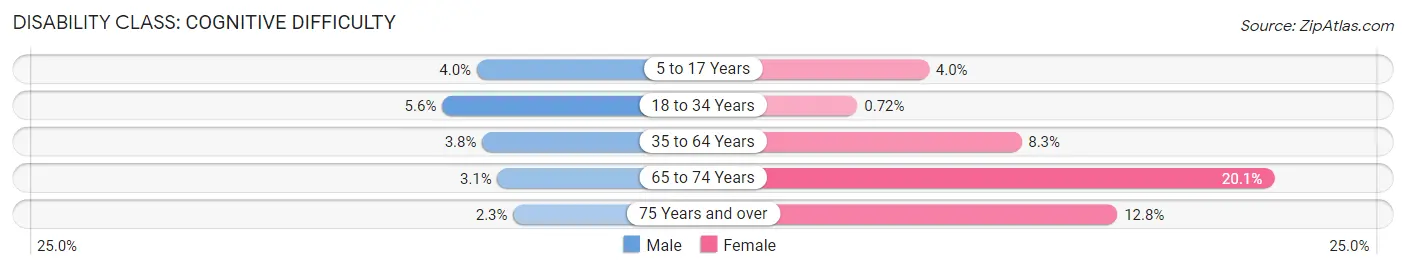
| Age Bracket | Male | Female |
| 5 to 17 Years | 89 (4.0%) | 100 (4.0%) |
| 18 to 34 Years | 172 (5.6%) | 19 (0.7%) |
| 35 to 64 Years | 154 (3.8%) | 319 (8.3%) |
| 65 to 74 Years | 30 (3.0%) | 134 (20.1%) |
| 75 Years and over | 11 (2.3%) | 68 (12.8%) |
Disability Class: Ambulatory Difficulty
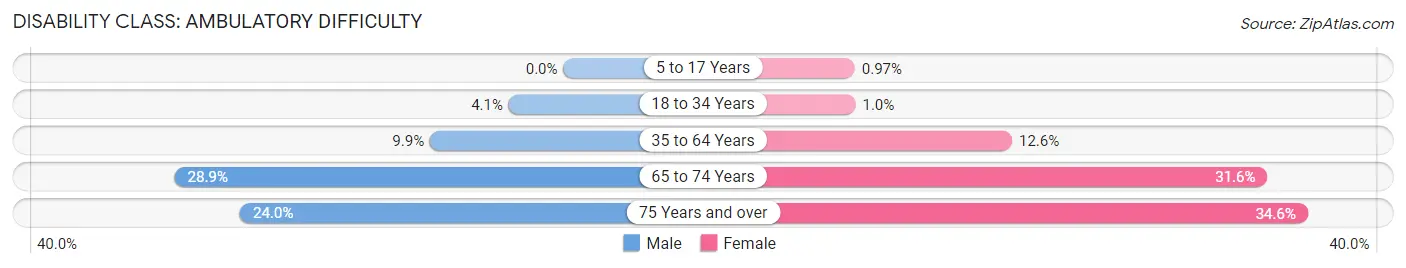
| Age Bracket | Male | Female |
| 5 to 17 Years | 0 (0.0%) | 24 (1.0%) |
| 18 to 34 Years | 124 (4.1%) | 27 (1.0%) |
| 35 to 64 Years | 406 (9.9%) | 484 (12.6%) |
| 65 to 74 Years | 284 (28.9%) | 211 (31.6%) |
| 75 Years and over | 114 (24.0%) | 184 (34.6%) |
Disability Class: Self-Care Difficulty
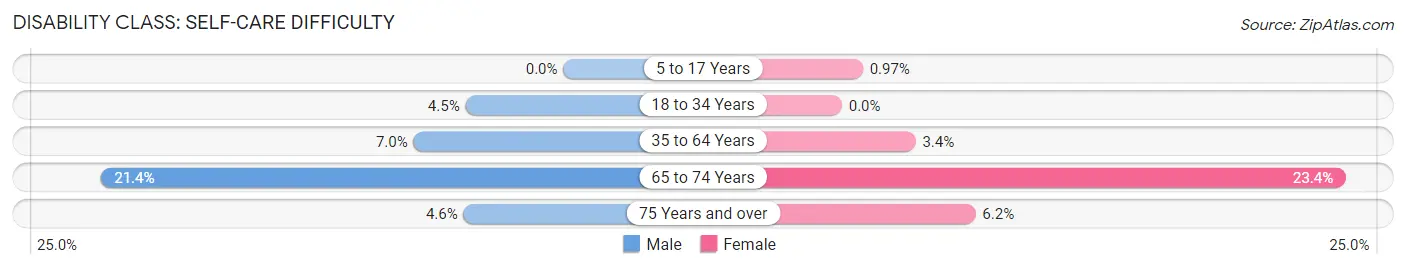
| Age Bracket | Male | Female |
| 5 to 17 Years | 0 (0.0%) | 24 (1.0%) |
| 18 to 34 Years | 139 (4.5%) | 0 (0.0%) |
| 35 to 64 Years | 285 (7.0%) | 131 (3.4%) |
| 65 to 74 Years | 211 (21.4%) | 156 (23.4%) |
| 75 Years and over | 22 (4.6%) | 33 (6.2%) |
Technology Access in Sun Valley
Computing Device Access in Sun Valley
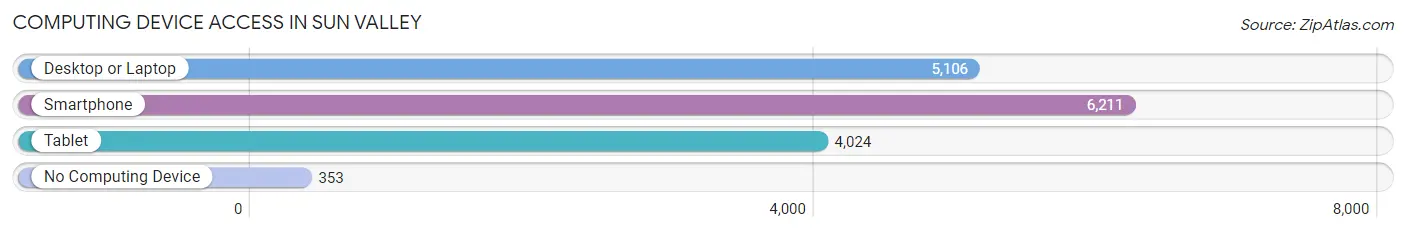
| Device Type | # Households | % Households |
| Desktop or Laptop | 5,106 | 73.8% |
| Smartphone | 6,211 | 89.7% |
| Tablet | 4,024 | 58.2% |
| No Computing Device | 353 | 5.1% |
| Total | 6,920 | 100.0% |
Internet Access in Sun Valley
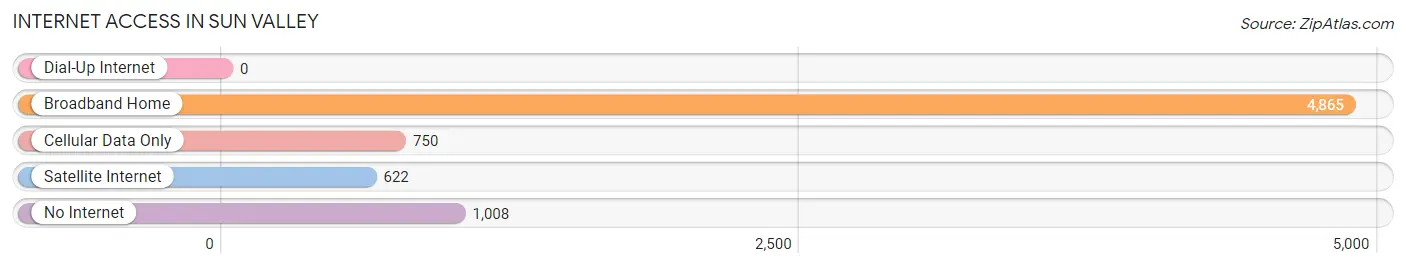
| Internet Type | # Households | % Households |
| Dial-Up Internet | 0 | 0.0% |
| Broadband Home | 4,865 | 70.3% |
| Cellular Data Only | 750 | 10.8% |
| Satellite Internet | 622 | 9.0% |
| No Internet | 1,008 | 14.6% |
| Total | 6,920 | 100.0% |
Sun Valley Summary
History
Sun Valley is a census-designated place (CDP) located in Washoe County, Nevada. It is a suburb of Reno, located about 10 miles east of the city. The area was first settled in the late 19th century by ranchers and farmers. The first post office was established in 1891 and the town was officially incorporated in 1950.
The area was originally known as "Sun Valley Ranch" and was home to a number of ranches and farms. The area was also home to a number of Native American tribes, including the Washoe, Paiute, and Shoshone.
The area was also home to a number of mining operations, including the Sun Valley Mine, which was in operation from the late 19th century until the early 20th century. The mine was one of the largest producers of silver and gold in the area.
Geography
Sun Valley is located in Washoe County, Nevada, about 10 miles east of Reno. The area is located in the Sierra Nevada mountain range and is surrounded by the Truckee Meadows. The area has an elevation of 4,890 feet and is located in the Great Basin Desert.
The area has a semi-arid climate, with hot summers and cold winters. The average annual temperature is around 50 degrees Fahrenheit. The area receives an average of 8 inches of precipitation per year.
Economy
Sun Valley is primarily a residential area, with a few small businesses. The area is home to a number of retail stores, restaurants, and other services. The area is also home to a number of industrial and manufacturing businesses.
The area is home to a number of casinos, including the Sun Valley Casino, which is located in the area. The casino is one of the largest in the area and is a popular destination for tourists and locals alike.
Demographics
As of the 2010 census, Sun Valley had a population of 8,845. The population is primarily white (83.3%), with a small percentage of African Americans (2.2%), Asians (2.1%), and Native Americans (1.2%). The median household income is $50,945, and the median home value is $212,000.
Conclusion
Sun Valley is a small suburb of Reno, located in Washoe County, Nevada. The area was first settled in the late 19th century and was home to a number of ranches and farms. The area is now primarily residential, with a few small businesses. The area is home to a number of casinos, and is a popular destination for tourists and locals alike. The population is primarily white, with a small percentage of African Americans, Asians, and Native Americans. The median household income is $50,945, and the median home value is $212,000.
Common Questions
What is Per Capita Income in Sun Valley?
Per Capita income in Sun Valley is $25,807.
What is the Median Family Income in Sun Valley?
Median Family Income in Sun Valley is $74,914.
What is the Median Household income in Sun Valley?
Median Household Income in Sun Valley is $71,471.
What is Income or Wage Gap in Sun Valley?
Income or Wage Gap in Sun Valley is 20.5%.
Women in Sun Valley earn 79.5 cents for every dollar earned by a man.
What is Family Income Deficit in Sun Valley?
Family Income Deficit in Sun Valley is $7,789.
Families that are below poverty line in Sun Valley earn $7,789 less on average than the poverty threshold level.
What is Inequality or Gini Index in Sun Valley?
Inequality or Gini Index in Sun Valley is 0.39.
What is the Total Population of Sun Valley?
Total Population of Sun Valley is 22,775.
What is the Total Male Population of Sun Valley?
Total Male Population of Sun Valley is 11,780.
What is the Total Female Population of Sun Valley?
Total Female Population of Sun Valley is 10,995.
What is the Ratio of Males per 100 Females in Sun Valley?
There are 107.14 Males per 100 Females in Sun Valley.
What is the Ratio of Females per 100 Males in Sun Valley?
There are 93.34 Females per 100 Males in Sun Valley.
What is the Median Population Age in Sun Valley?
Median Population Age in Sun Valley is 32.5 Years.
What is the Average Family Size in Sun Valley
Average Family Size in Sun Valley is 3.7 People.
What is the Average Household Size in Sun Valley
Average Household Size in Sun Valley is 3.3 People.
How Large is the Labor Force in Sun Valley?
There are 10,966 People in the Labor Forcein in Sun Valley.
What is the Percentage of People in the Labor Force in Sun Valley?
64.4% of People are in the Labor Force in Sun Valley.
What is the Unemployment Rate in Sun Valley?
Unemployment Rate in Sun Valley is 5.1%.