Zip Codes with the Highest Percentage of Households with Income Below $10,000 in Omaha, NE
RELATED REPORTS & OPTIONS
Household Income | $0-10k
Omaha
Compare Zip Codes
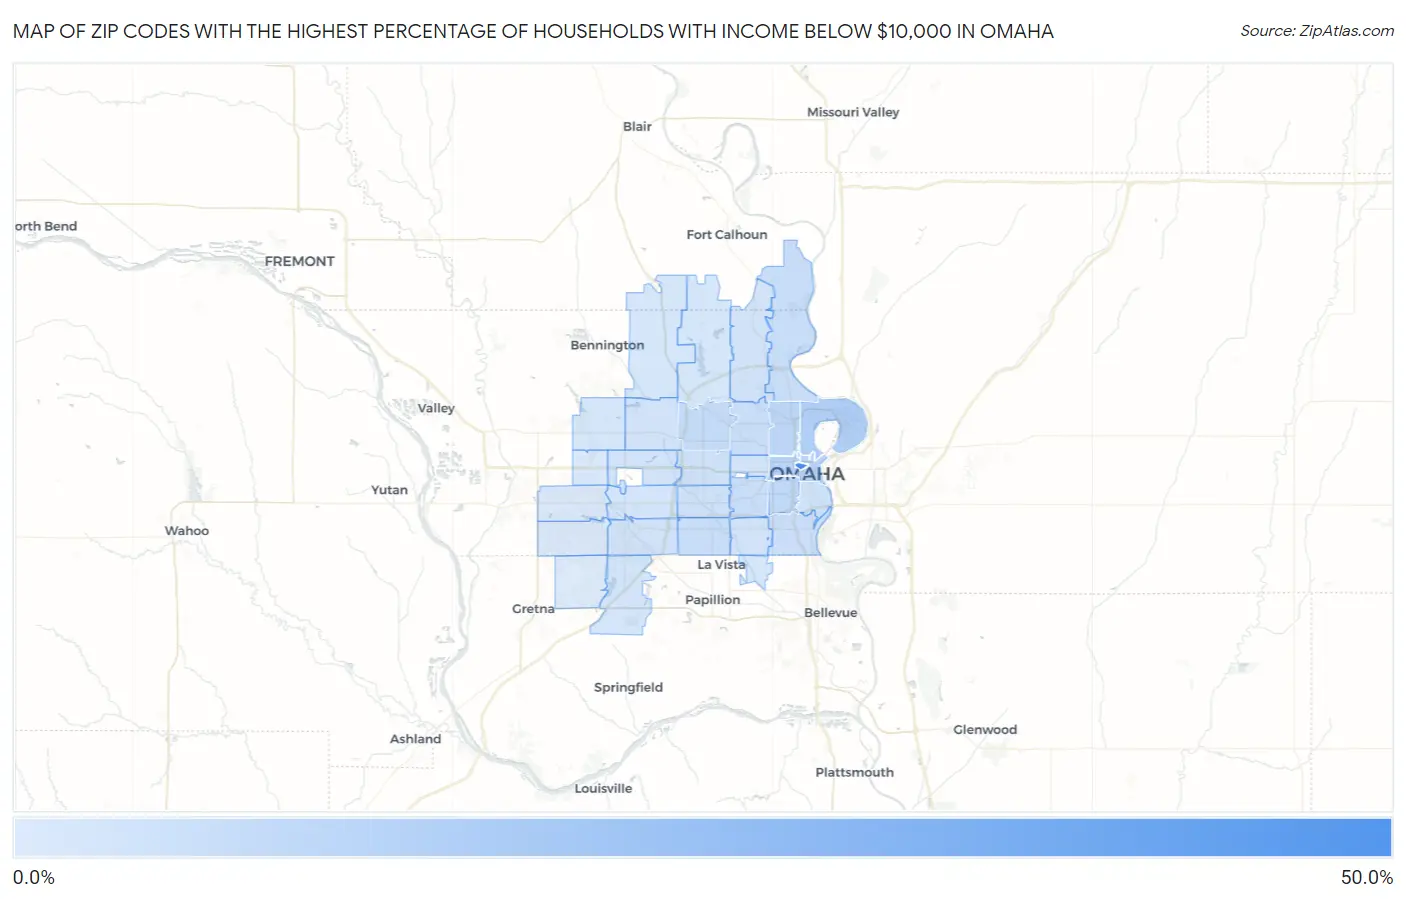
Map of Zip Codes with the Highest Percentage of Households with Income Below $10,000 in Omaha
0.80%
44.9%
Zip Codes with the Highest Percentage of Households with Income Below $10,000 in Omaha, NE
| Zip Code | Households with Income < $10k | vs State | vs National | |
| 1. | 68178 | 44.9% | 4.2%(+40.7)#1 | 4.9%(+40.0)#137 |
| 2. | 68110 | 11.8% | 4.2%(+7.60)#18 | 4.9%(+6.90)#2,547 |
| 3. | 68131 | 10.1% | 4.2%(+5.90)#28 | 4.9%(+5.20)#3,505 |
| 4. | 68102 | 10.1% | 4.2%(+5.90)#29 | 4.9%(+5.20)#3,508 |
| 5. | 68111 | 8.9% | 4.2%(+4.70)#39 | 4.9%(+4.00)#4,512 |
| 6. | 68105 | 8.5% | 4.2%(+4.30)#43 | 4.9%(+3.60)#4,930 |
| 7. | 68134 | 7.1% | 4.2%(+2.90)#66 | 4.9%(+2.20)#6,786 |
| 8. | 68106 | 6.2% | 4.2%(+2.00)#89 | 4.9%(+1.30)#8,555 |
| 9. | 68104 | 5.9% | 4.2%(+1.70)#99 | 4.9%(+1.00)#9,211 |
| 10. | 68112 | 5.8% | 4.2%(+1.60)#103 | 4.9%(+0.900)#9,532 |
| 11. | 68127 | 5.7% | 4.2%(+1.50)#111 | 4.9%(+0.800)#9,740 |
| 12. | 68107 | 5.3% | 4.2%(+1.10)#121 | 4.9%(+0.400)#10,754 |
| 13. | 68124 | 4.5% | 4.2%(+0.300)#165 | 4.9%(-0.400)#13,424 |
| 14. | 68108 | 4.5% | 4.2%(+0.300)#166 | 4.9%(-0.400)#13,427 |
| 15. | 68114 | 4.2% | 4.2%(=0.000)#190 | 4.9%(-0.700)#14,543 |
| 16. | 68152 | 3.8% | 4.2%(-0.400)#226 | 4.9%(-1.10)#16,157 |
| 17. | 68132 | 3.5% | 4.2%(-0.700)#252 | 4.9%(-1.40)#17,323 |
| 18. | 68164 | 3.4% | 4.2%(-0.800)#258 | 4.9%(-1.50)#17,669 |
| 19. | 68137 | 3.4% | 4.2%(-0.800)#259 | 4.9%(-1.50)#17,694 |
| 20. | 68154 | 3.4% | 4.2%(-0.800)#260 | 4.9%(-1.50)#17,701 |
| 21. | 68117 | 3.4% | 4.2%(-0.800)#262 | 4.9%(-1.50)#17,785 |
| 22. | 68138 | 3.0% | 4.2%(-1.20)#291 | 4.9%(-1.90)#19,458 |
| 23. | 68144 | 2.8% | 4.2%(-1.40)#304 | 4.9%(-2.10)#20,302 |
| 24. | 68157 | 2.7% | 4.2%(-1.50)#315 | 4.9%(-2.20)#20,848 |
| 25. | 68142 | 2.6% | 4.2%(-1.60)#318 | 4.9%(-2.30)#21,292 |
| 26. | 68116 | 2.3% | 4.2%(-1.90)#339 | 4.9%(-2.60)#22,443 |
| 27. | 68122 | 2.3% | 4.2%(-1.90)#340 | 4.9%(-2.60)#22,522 |
| 28. | 68130 | 1.6% | 4.2%(-2.60)#395 | 4.9%(-3.30)#25,109 |
| 29. | 68135 | 1.5% | 4.2%(-2.70)#401 | 4.9%(-3.40)#25,414 |
| 30. | 68118 | 1.2% | 4.2%(-3.00)#419 | 4.9%(-3.70)#26,349 |
| 31. | 68136 | 0.80% | 4.2%(-3.40)#449 | 4.9%(-4.10)#27,253 |
1
Common Questions
What are the Top 10 Zip Codes with the Highest Percentage of Households with Income Below $10,000 in Omaha, NE?
Top 10 Zip Codes with the Highest Percentage of Households with Income Below $10,000 in Omaha, NE are:
What zip code has the Highest Percentage of Households with Income Below $10,000 in Omaha, NE?
68178 has the Highest Percentage of Households with Income Below $10,000 in Omaha, NE with 44.9%.
What is the Percentage of Households with Income Below $10,000 in Omaha, NE?
Percentage of Households with Income Below $10,000 in Omaha is 5.1%.
What is the Percentage of Households with Income Below $10,000 in Nebraska?
Percentage of Households with Income Below $10,000 in Nebraska is 4.2%.
What is the Percentage of Households with Income Below $10,000 in the United States?
Percentage of Households with Income Below $10,000 in the United States is 4.9%.