Zip Codes with the Highest Percentage of Households with Income Below $10,000 in North Dakota
RELATED REPORTS & OPTIONS
Household Income | $0-10k
North Dakota
Compare Zip Codes
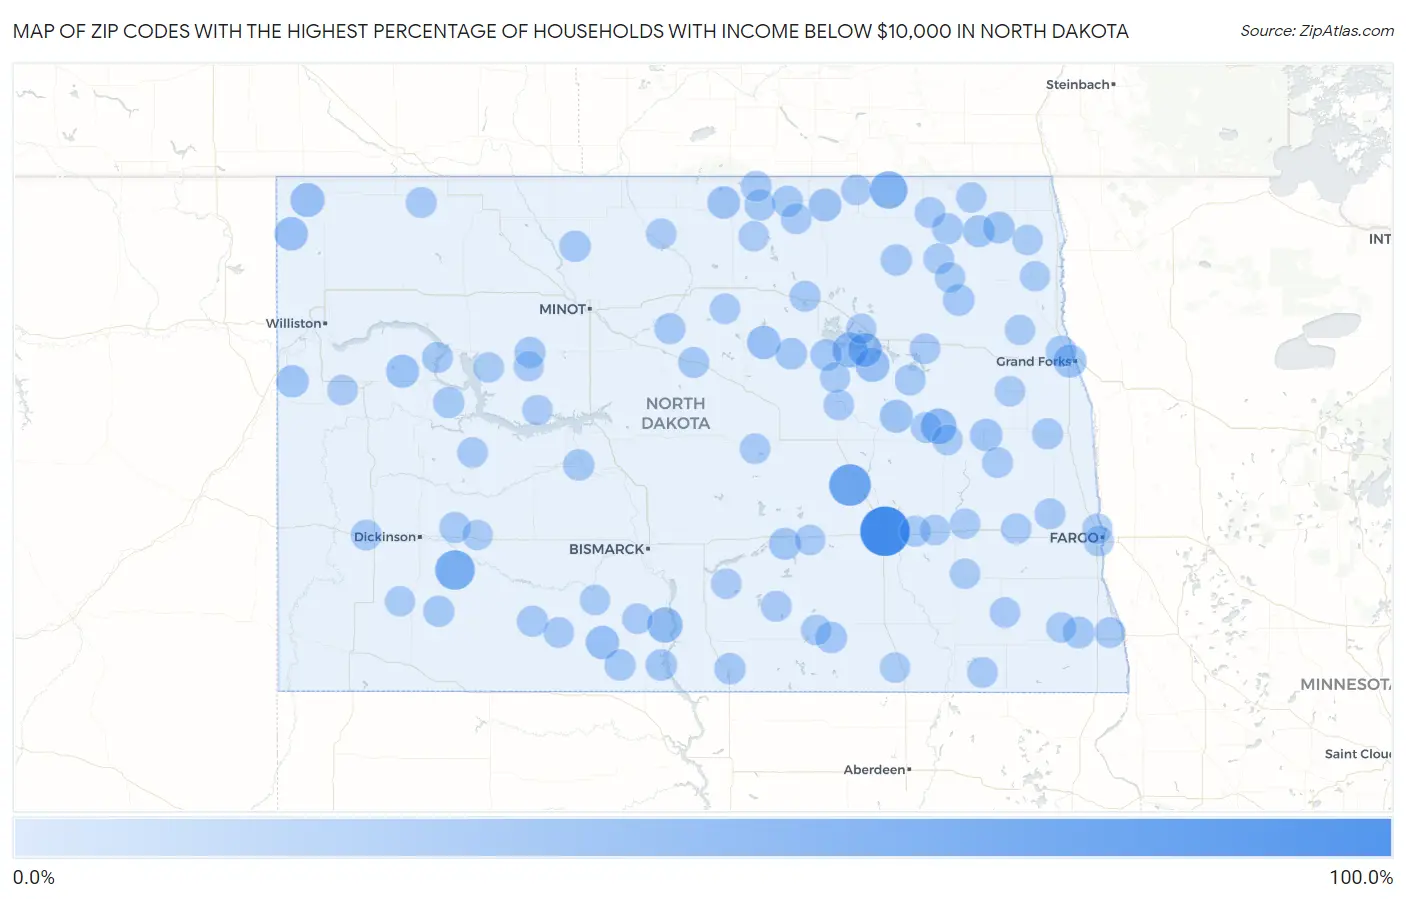
Map of Zip Codes with the Highest Percentage of Households with Income Below $10,000 in North Dakota
0.0%
100.0%
Zip Codes with the Highest Percentage of Households with Income Below $10,000 in North Dakota
| Zip Code | Households with Income < $10k | vs State | vs National | |
| 1. | 58405 | 100.0% | 4.6%(+95.4)#1 | 4.9%(+95.1)#9 |
| 2. | 58476 | 60.5% | 4.6%(+55.9)#2 | 4.9%(+55.6)#75 |
| 3. | 58641 | 50.0% | 4.6%(+45.4)#3 | 4.9%(+45.1)#113 |
| 4. | 58239 | 40.0% | 4.6%(+35.4)#4 | 4.9%(+35.1)#176 |
| 5. | 58452 | 30.8% | 4.6%(+26.2)#5 | 4.9%(+25.9)#312 |
| 6. | 58528 | 29.4% | 4.6%(+24.8)#6 | 4.9%(+24.5)#338 |
| 7. | 58335 | 28.4% | 4.6%(+23.8)#7 | 4.9%(+23.5)#362 |
| 8. | 58844 | 23.6% | 4.6%(+19.0)#8 | 4.9%(+18.7)#555 |
| 9. | 58379 | 23.1% | 4.6%(+18.5)#9 | 4.9%(+18.2)#590 |
| 10. | 58370 | 22.1% | 4.6%(+17.5)#10 | 4.9%(+17.2)#632 |
| 11. | 58845 | 20.8% | 4.6%(+16.2)#11 | 4.9%(+15.9)#718 |
| 12. | 58332 | 20.5% | 4.6%(+15.9)#12 | 4.9%(+15.6)#752 |
| 13. | 58569 | 20.5% | 4.6%(+15.9)#13 | 4.9%(+15.6)#756 |
| 14. | 58847 | 19.4% | 4.6%(+14.8)#14 | 4.9%(+14.5)#861 |
| 15. | 58464 | 18.9% | 4.6%(+14.3)#15 | 4.9%(+14.0)#913 |
| 16. | 58202 | 18.4% | 4.6%(+13.8)#16 | 4.9%(+13.5)#957 |
| 17. | 58365 | 17.8% | 4.6%(+13.2)#17 | 4.9%(+12.9)#1,052 |
| 18. | 58329 | 16.8% | 4.6%(+12.2)#18 | 4.9%(+11.9)#1,188 |
| 19. | 58230 | 16.0% | 4.6%(+11.4)#19 | 4.9%(+11.1)#1,343 |
| 20. | 58838 | 15.6% | 4.6%(+11.0)#20 | 4.9%(+10.7)#1,419 |
| 21. | 58262 | 13.0% | 4.6%(+8.40)#21 | 4.9%(+8.10)#2,104 |
| 22. | 58487 | 12.9% | 4.6%(+8.30)#22 | 4.9%(+8.00)#2,140 |
| 23. | 58241 | 12.7% | 4.6%(+8.10)#23 | 4.9%(+7.80)#2,221 |
| 24. | 58250 | 12.2% | 4.6%(+7.60)#24 | 4.9%(+7.30)#2,397 |
| 25. | 58008 | 12.1% | 4.6%(+7.50)#25 | 4.9%(+7.20)#2,448 |
| 26. | 58357 | 11.7% | 4.6%(+7.10)#26 | 4.9%(+6.80)#2,609 |
| 27. | 58538 | 11.6% | 4.6%(+7.00)#27 | 4.9%(+6.70)#2,646 |
| 28. | 58348 | 11.6% | 4.6%(+7.00)#28 | 4.9%(+6.70)#2,656 |
| 29. | 58440 | 11.4% | 4.6%(+6.80)#29 | 4.9%(+6.50)#2,780 |
| 30. | 58338 | 11.3% | 4.6%(+6.70)#30 | 4.9%(+6.40)#2,834 |
| 31. | 58750 | 10.7% | 4.6%(+6.10)#31 | 4.9%(+5.80)#3,155 |
| 32. | 58542 | 10.7% | 4.6%(+6.10)#32 | 4.9%(+5.80)#3,162 |
| 33. | 58568 | 10.5% | 4.6%(+5.90)#33 | 4.9%(+5.60)#3,276 |
| 34. | 58571 | 10.4% | 4.6%(+5.80)#34 | 4.9%(+5.50)#3,341 |
| 35. | 58656 | 10.2% | 4.6%(+5.60)#35 | 4.9%(+5.30)#3,482 |
| 36. | 58367 | 10.0% | 4.6%(+5.40)#36 | 4.9%(+5.10)#3,608 |
| 37. | 58757 | 10.0% | 4.6%(+5.40)#37 | 4.9%(+5.10)#3,611 |
| 38. | 58203 | 9.8% | 4.6%(+5.20)#38 | 4.9%(+4.90)#3,719 |
| 39. | 58650 | 9.8% | 4.6%(+5.20)#39 | 4.9%(+4.90)#3,784 |
| 40. | 58269 | 9.8% | 4.6%(+5.20)#40 | 4.9%(+4.90)#3,789 |
| 41. | 58756 | 9.6% | 4.6%(+5.00)#41 | 4.9%(+4.70)#3,943 |
| 42. | 58533 | 9.5% | 4.6%(+4.90)#42 | 4.9%(+4.60)#4,000 |
| 43. | 58316 | 9.3% | 4.6%(+4.70)#43 | 4.9%(+4.40)#4,127 |
| 44. | 58744 | 9.3% | 4.6%(+4.70)#44 | 4.9%(+4.40)#4,191 |
| 45. | 58257 | 9.2% | 4.6%(+4.60)#45 | 4.9%(+4.30)#4,249 |
| 46. | 58346 | 8.9% | 4.6%(+4.30)#46 | 4.9%(+4.00)#4,583 |
| 47. | 58763 | 8.8% | 4.6%(+4.20)#47 | 4.9%(+3.90)#4,650 |
| 48. | 58736 | 8.8% | 4.6%(+4.20)#48 | 4.9%(+3.90)#4,696 |
| 49. | 58380 | 8.8% | 4.6%(+4.20)#49 | 4.9%(+3.90)#4,698 |
| 50. | 58561 | 8.7% | 4.6%(+4.10)#50 | 4.9%(+3.80)#4,789 |
| 51. | 58369 | 8.5% | 4.6%(+3.90)#51 | 4.9%(+3.60)#4,990 |
| 52. | 58416 | 8.4% | 4.6%(+3.80)#52 | 4.9%(+3.50)#5,135 |
| 53. | 58004 | 8.4% | 4.6%(+3.80)#53 | 4.9%(+3.50)#5,139 |
| 54. | 58075 | 8.3% | 4.6%(+3.70)#54 | 4.9%(+3.40)#5,194 |
| 55. | 58622 | 8.3% | 4.6%(+3.70)#55 | 4.9%(+3.40)#5,233 |
| 56. | 58229 | 8.3% | 4.6%(+3.70)#56 | 4.9%(+3.40)#5,282 |
| 57. | 58727 | 8.1% | 4.6%(+3.50)#57 | 4.9%(+3.20)#5,539 |
| 58. | 58481 | 8.0% | 4.6%(+3.40)#58 | 4.9%(+3.10)#5,659 |
| 59. | 58249 | 7.9% | 4.6%(+3.30)#59 | 4.9%(+3.00)#5,743 |
| 60. | 58046 | 7.9% | 4.6%(+3.30)#60 | 4.9%(+3.00)#5,774 |
| 61. | 58363 | 7.7% | 4.6%(+3.10)#61 | 4.9%(+2.80)#6,046 |
| 62. | 58356 | 7.5% | 4.6%(+2.90)#62 | 4.9%(+2.60)#6,286 |
| 63. | 58017 | 7.5% | 4.6%(+2.90)#63 | 4.9%(+2.60)#6,318 |
| 64. | 58344 | 7.4% | 4.6%(+2.80)#64 | 4.9%(+2.50)#6,446 |
| 65. | 58529 | 7.4% | 4.6%(+2.80)#65 | 4.9%(+2.50)#6,456 |
| 66. | 58570 | 7.3% | 4.6%(+2.70)#66 | 4.9%(+2.40)#6,590 |
| 67. | 58425 | 7.1% | 4.6%(+2.50)#67 | 4.9%(+2.20)#6,891 |
| 68. | 58011 | 7.1% | 4.6%(+2.50)#68 | 4.9%(+2.20)#6,916 |
| 69. | 58276 | 7.1% | 4.6%(+2.50)#69 | 4.9%(+2.20)#6,918 |
| 70. | 58423 | 7.1% | 4.6%(+2.50)#70 | 4.9%(+2.20)#6,937 |
| 71. | 58636 | 7.0% | 4.6%(+2.40)#71 | 4.9%(+2.10)#7,062 |
| 72. | 58054 | 6.9% | 4.6%(+2.30)#72 | 4.9%(+2.00)#7,207 |
| 73. | 58467 | 6.9% | 4.6%(+2.30)#73 | 4.9%(+2.00)#7,267 |
| 74. | 58460 | 6.9% | 4.6%(+2.30)#74 | 4.9%(+2.00)#7,287 |
| 75. | 58049 | 6.8% | 4.6%(+2.20)#75 | 4.9%(+1.90)#7,507 |
| 76. | 58368 | 6.7% | 4.6%(+2.10)#76 | 4.9%(+1.80)#7,614 |
| 77. | 58770 | 6.7% | 4.6%(+2.10)#77 | 4.9%(+1.80)#7,637 |
| 78. | 58535 | 6.7% | 4.6%(+2.10)#78 | 4.9%(+1.80)#7,673 |
| 79. | 58267 | 6.6% | 4.6%(+2.00)#79 | 4.9%(+1.70)#7,842 |
| 80. | 58210 | 6.6% | 4.6%(+2.00)#80 | 4.9%(+1.70)#7,878 |
| 81. | 58480 | 6.6% | 4.6%(+2.00)#81 | 4.9%(+1.70)#7,881 |
| 82. | 58072 | 6.5% | 4.6%(+1.90)#82 | 4.9%(+1.60)#7,966 |
| 83. | 58524 | 6.5% | 4.6%(+1.90)#83 | 4.9%(+1.60)#8,083 |
| 84. | 58103 | 6.4% | 4.6%(+1.80)#84 | 4.9%(+1.50)#8,092 |
| 85. | 58436 | 6.4% | 4.6%(+1.80)#85 | 4.9%(+1.50)#8,243 |
| 86. | 58652 | 6.3% | 4.6%(+1.70)#86 | 4.9%(+1.40)#8,449 |
| 87. | 58374 | 6.3% | 4.6%(+1.70)#87 | 4.9%(+1.40)#8,482 |
| 88. | 58748 | 6.3% | 4.6%(+1.70)#88 | 4.9%(+1.40)#8,500 |
| 89. | 58835 | 6.2% | 4.6%(+1.60)#89 | 4.9%(+1.30)#8,685 |
| 90. | 58366 | 6.2% | 4.6%(+1.60)#90 | 4.9%(+1.30)#8,687 |
| 91. | 58081 | 6.2% | 4.6%(+1.60)#91 | 4.9%(+1.30)#8,691 |
| 92. | 58282 | 6.1% | 4.6%(+1.50)#92 | 4.9%(+1.20)#8,899 |
| 93. | 58235 | 6.1% | 4.6%(+1.50)#93 | 4.9%(+1.20)#8,930 |
| 94. | 58779 | 6.1% | 4.6%(+1.50)#94 | 4.9%(+1.20)#8,941 |
| 95. | 58372 | 6.1% | 4.6%(+1.50)#95 | 4.9%(+1.20)#8,951 |
| 96. | 58102 | 6.0% | 4.6%(+1.40)#96 | 4.9%(+1.10)#8,985 |
| 97. | 58301 | 6.0% | 4.6%(+1.40)#97 | 4.9%(+1.10)#9,043 |
| 98. | 58237 | 5.9% | 4.6%(+1.30)#98 | 4.9%(+1.00)#9,306 |
| 99. | 58540 | 5.9% | 4.6%(+1.30)#99 | 4.9%(+1.00)#9,331 |
| 100. | 58647 | 5.9% | 4.6%(+1.30)#100 | 4.9%(+1.00)#9,376 |
Common Questions
What are the Top 10 Zip Codes with the Highest Percentage of Households with Income Below $10,000 in North Dakota?
Top 10 Zip Codes with the Highest Percentage of Households with Income Below $10,000 in North Dakota are:
What zip code has the Highest Percentage of Households with Income Below $10,000 in North Dakota?
58405 has the Highest Percentage of Households with Income Below $10,000 in North Dakota with 100.0%.
What is the Percentage of Households with Income Below $10,000 in the State of North Dakota?
Percentage of Households with Income Below $10,000 in North Dakota is 4.6%.
What is the Percentage of Households with Income Below $10,000 in the United States?
Percentage of Households with Income Below $10,000 in the United States is 4.9%.