Zip Codes with the Highest Percentage of Population Employed in Firefighting & Prevention in Omaha, NE

RELATED REPORTS & OPTIONS

Firefighting & Prevention
Population
Families and Households
Female Fertility
Female Fertility (Unmarried)
Race (Community Size)
Race (Percentage)
Ancestry (Community Size)
AfghanAfricanAlbanianAleutAmericanApacheArabArapahoArgentineanArmenianAustralianAustrianBangladeshiBasqueBelgianBhutaneseBlackfeetBolivianBrazilianBritishBulgarianBurmeseCajunCambodianCanadianCarpatho RusynCentral AmericanCentral American IndianCherokeeChickasawChileanChineseChippewaChoctawColombianComancheCosta RicanCreekCroatianCubanCzechCzechoslovakianDanishDominicanDutchEastern EuropeanEcuadorianEgyptianEnglishEthiopianEuropeanFilipinoFinnishFrenchFrench American IndianFrench CanadianGermanGerman RussianGhanaianGreekGuamanian / ChamorroGuatemalanGuyaneseHaitianHonduranHungarianIcelanderIndian (Asian)IndonesianInupiatIranianIraqiIrishIroquoisIsraeliItalianJamaicanJapaneseJordanianKenyanKiowaKoreanLaotianLatvianLebaneseLithuanianLuxembourgerMacedonianMalaysianMexicanMexican American IndianMoroccanNative HawaiianNavajoNicaraguanNigerianNorthern EuropeanNorwegianPakistaniPalestinianPanamanianPennsylvania GermanPeruvianPolishPortuguesePotawatomiPuebloPuerto RicanRomanianRussianSalvadoranSamoanScandinavianScotch-IrishScottishSeminoleSerbianSiouxSlavicSlovakSloveneSomaliSouth AfricanSouth AmericanSpaniardSpanishSri LankanSubsaharan AfricanSudaneseSwedishSwissSyrianThaiTlingit-HaidaTrinidadian and TobagonianTurkishUkrainianVenezuelanVietnameseWelshWest IndianYugoslavianZimbabwean
Ancestry (Percentage)
AfghanAfricanAlbanianAleutAmericanApacheArabArapahoArgentineanArmenianAustralianAustrianBangladeshiBasqueBelgianBhutaneseBlackfeetBolivianBrazilianBritishBulgarianBurmeseCajunCambodianCanadianCarpatho RusynCentral AmericanCentral American IndianCherokeeChickasawChileanChineseChippewaChoctawColombianComancheCosta RicanCreekCroatianCubanCzechCzechoslovakianDanishDominicanDutchEastern EuropeanEcuadorianEgyptianEnglishEthiopianEuropeanFilipinoFinnishFrenchFrench American IndianFrench CanadianGermanGerman RussianGhanaianGreekGuamanian / ChamorroGuatemalanGuyaneseHaitianHonduranHungarianIcelanderIndian (Asian)IndonesianInupiatIranianIraqiIrishIroquoisIsraeliItalianJamaicanJapaneseJordanianKenyanKiowaKoreanLaotianLatvianLebaneseLithuanianLuxembourgerMacedonianMalaysianMexicanMexican American IndianMoroccanNative HawaiianNavajoNicaraguanNigerianNorthern EuropeanNorwegianPakistaniPalestinianPanamanianPennsylvania GermanPeruvianPolishPortuguesePotawatomiPuebloPuerto RicanRomanianRussianSalvadoranSamoanScandinavianScotch-IrishScottishSeminoleSerbianSiouxSlavicSlovakSloveneSomaliSouth AfricanSouth AmericanSpaniardSpanishSri LankanSubsaharan AfricanSudaneseSwedishSwissSyrianThaiTlingit-HaidaTrinidadian and TobagonianTurkishUkrainianVenezuelanVietnameseWelshWest IndianYugoslavianZimbabwean
Immigrant Origin (Total)
AfghanistanAfricaArgentinaAsiaAustraliaBangladeshBarbadosBelarusBosnia and HerzegovinaBrazilBurma / MyanmarCameroonCanadaCaribbeanCentral AmericaChileChinaColombiaCongoCosta RicaCroatiaCubaCzechoslovakiaDominican RepublicEastern AfricaEastern AsiaEastern EuropeEgyptEl SalvadorEnglandEthiopiaEuropeFranceGermanyGhanaGreeceGuatemalaHondurasHong KongHungaryIndiaIndonesiaIranIraqIrelandIsraelItalyJamaicaJapanJordanKazakhstanKenyaKoreaKuwaitLaosLatin AmericaLatviaLithuaniaMalaysiaMexicoMiddle AfricaMoroccoNepalNetherlandsNicaraguaNigeriaNorthern AfricaNorthern EuropeOceaniaPakistanPanamaPeruPhilippinesPolandPortugalRomaniaRussiaSaudi ArabiaScotlandSierra LeoneSomaliaSouth AfricaSouth AmericaSouth Central AsiaSouth Eastern AsiaSouthern EuropeSpainSri LankaSudanSyriaTaiwanThailandTrinidad and TobagoTurkeyUgandaUkraineVenezuelaVietnamWestern AfricaWestern AsiaWestern EuropeZaireZimbabwe
Immigrant Origin (Percentage)
AfghanistanAfricaArgentinaAsiaAustraliaBangladeshBarbadosBelarusBosnia and HerzegovinaBrazilBurma / MyanmarCameroonCanadaCaribbeanCentral AmericaChileChinaColombiaCongoCosta RicaCroatiaCubaCzechoslovakiaDominican RepublicEastern AfricaEastern AsiaEastern EuropeEgyptEl SalvadorEnglandEthiopiaEuropeFranceGermanyGhanaGreeceGuatemalaHondurasHong KongHungaryIndiaIndonesiaIranIraqIrelandIsraelItalyJamaicaJapanJordanKazakhstanKenyaKoreaKuwaitLaosLatin AmericaLatviaLithuaniaMalaysiaMexicoMiddle AfricaMoroccoNepalNetherlandsNicaraguaNigeriaNorthern AfricaNorthern EuropeOceaniaPakistanPanamaPeruPhilippinesPolandPortugalRomaniaRussiaSaudi ArabiaScotlandSierra LeoneSomaliaSouth AfricaSouth AmericaSouth Central AsiaSouth Eastern AsiaSouthern EuropeSpainSri LankaSudanSyriaTaiwanThailandTrinidad and TobagoTurkeyUgandaUkraineVenezuelaVietnamWestern AfricaWestern AsiaWestern EuropeZaireZimbabwe
Income
Income (Families)
Income (Households)
Poverty
Poverty (Families)
Unemployment
Employment Occupations
Employment Industries
Employer Class
Commute Time
Commute Means
School Enrollment
Education by Degree Field
Occupancy
Finances
Physical Characteristics
Omaha
Compare Zip Codes
Comparison Subject

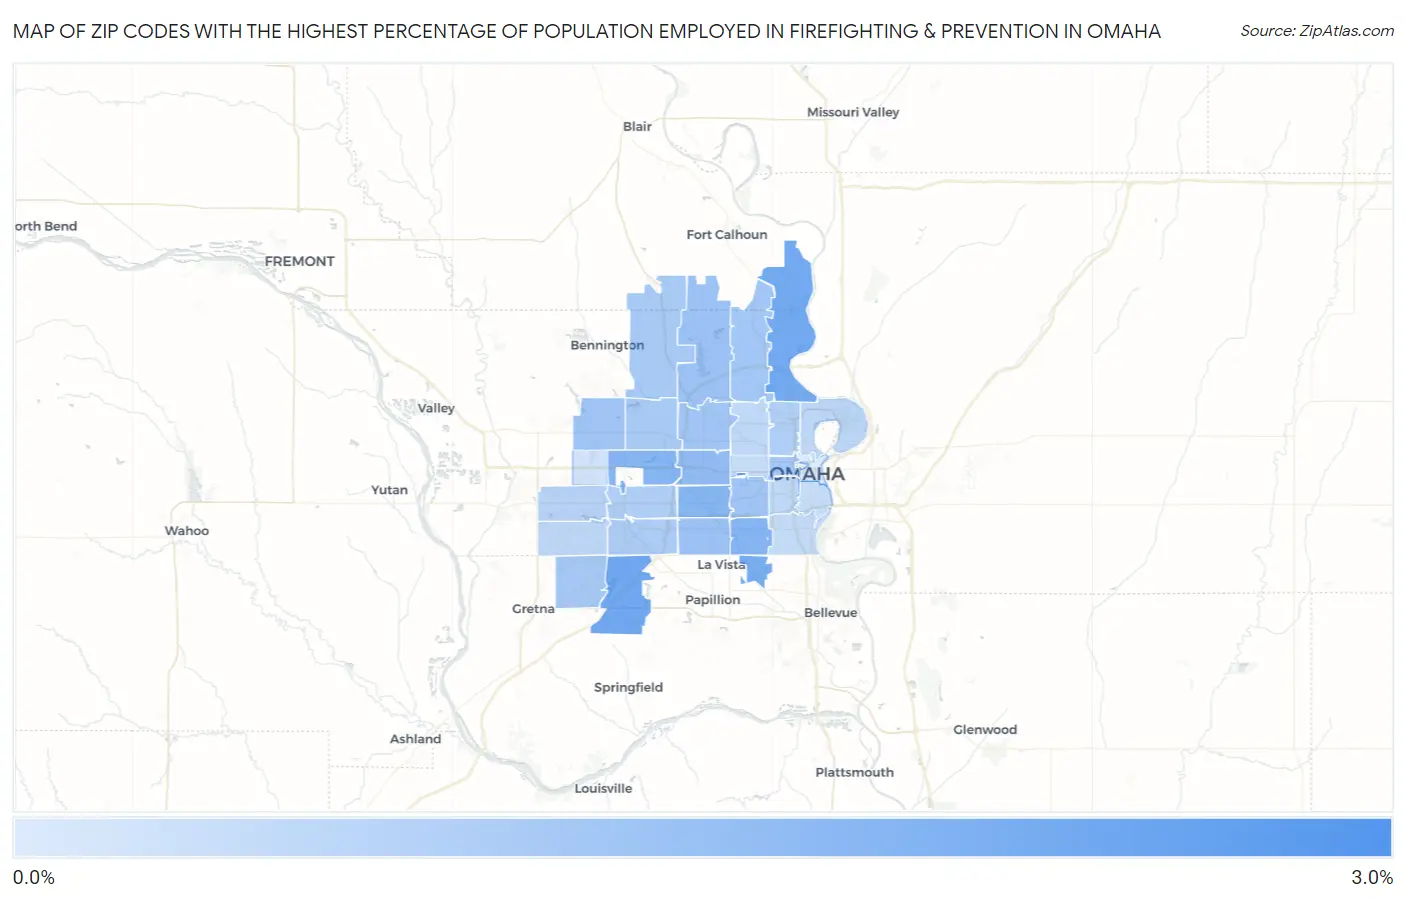
Map of Zip Codes with the Highest Percentage of Population Employed in Firefighting & Prevention in Omaha

0.0%
3.0%
Zip Codes with the Highest Percentage of Population Employed in Firefighting & Prevention in Omaha Map

Zip Codes with the Highest Percentage of Population Employed in Firefighting & Prevention in Omaha, NE

Zip Code % Employed vs State vs National
1.681822.9%0.88%(+2.05)#251.2%(+1.74)#2,342
2.681382.1%0.88%(+1.25)#401.2%(+0.936)#4,089
3.681122.1%0.88%(+1.21)#411.2%(+0.902)#4,190
4.681572.0%0.88%(+1.11)#421.2%(+0.797)#4,572
5.681171.7%0.88%(+0.843)#551.2%(+0.533)#5,741
6.681541.7%0.88%(+0.829)#571.2%(+0.518)#5,818
7.681241.7%0.88%(+0.778)#621.2%(+0.468)#6,071
8.681141.5%0.88%(+0.616)#651.2%(+0.306)#7,031
9.681271.3%0.88%(+0.415)#771.2%(+0.104)#8,421
10.681221.3%0.88%(+0.391)#801.2%(+0.081)#8,611
11.681161.2%0.88%(+0.329)#871.2%(+0.018)#9,120
12.681341.2%0.88%(+0.291)#911.2%(-0.019)#9,442
13.681061.2%0.88%(+0.291)#921.2%(-0.019)#9,446
14.681521.1%0.88%(+0.243)#961.2%(-0.067)#9,930
15.681361.1%0.88%(+0.228)#981.2%(-0.082)#10,072
16.681311.1%0.88%(+0.197)#1051.2%(-0.113)#10,353
17.681421.1%0.88%(+0.195)#1061.2%(-0.115)#10,375
18.681641.1%0.88%(+0.176)#1101.2%(-0.134)#10,586
19.681370.98%0.88%(+0.099)#1271.2%(-0.211)#11,365
20.681440.93%0.88%(+0.055)#1321.2%(-0.255)#11,831
21.681110.86%0.88%(-0.011)#1431.2%(-0.321)#12,526
22.681300.73%0.88%(-0.147)#1581.2%(-0.457)#14,001
23.681100.66%0.88%(-0.215)#1691.2%(-0.525)#14,781
24.681350.63%0.88%(-0.248)#1731.2%(-0.558)#15,129
25.681040.63%0.88%(-0.250)#1741.2%(-0.560)#15,142
26.681050.59%0.88%(-0.283)#1791.2%(-0.594)#15,504
27.681070.52%0.88%(-0.353)#1811.2%(-0.663)#16,289
28.681080.49%0.88%(-0.383)#1881.2%(-0.693)#16,634
29.681320.49%0.88%(-0.386)#1891.2%(-0.696)#16,676
30.681180.24%0.88%(-0.633)#2381.2%(-0.944)#19,308
31.681020.037%0.88%(-0.839)#2571.2%(-1.15)#20,531

Common Questions

What are the Top 10 Zip Codes with the Highest Percentage of Population Employed in Firefighting & Prevention in Omaha, NE?
Top 10 Zip Codes with the Highest Percentage of Population Employed in Firefighting & Prevention in Omaha, NE are:
#1
2.9%
#2
2.1%
#3
2.1%
#4
2.0%
#5
1.7%
#6
1.7%
#7
1.7%
#8
1.5%
#9
1.3%
#10
1.3%
What zip code has the Highest Percentage of Population Employed in Firefighting & Prevention in Omaha, NE?
68182 has the Highest Percentage of Population Employed in Firefighting & Prevention in Omaha, NE with 2.9%.
What is the Percentage of Population Employed in Firefighting & Prevention in Omaha, NE?
Percentage of Population Employed in Firefighting & Prevention in Omaha is 0.96%.
What is the Percentage of Population Employed in Firefighting & Prevention in Nebraska?
Percentage of Population Employed in Firefighting & Prevention in Nebraska is 0.88%.
What is the Percentage of Population Employed in Firefighting & Prevention in the United States?
Percentage of Population Employed in Firefighting & Prevention in the United States is 1.2%.