Zip Codes with the Highest Percentage of Population Employed in Security & Protection in Omaha, NE

RELATED REPORTS & OPTIONS

Security & Protection
Population
Families and Households
Female Fertility
Female Fertility (Unmarried)
Race (Community Size)
Race (Percentage)
Ancestry (Community Size)
AfghanAfricanAlbanianAleutAmericanApacheArabArapahoArgentineanArmenianAustralianAustrianBangladeshiBasqueBelgianBhutaneseBlackfeetBolivianBrazilianBritishBulgarianBurmeseCajunCambodianCanadianCarpatho RusynCentral AmericanCentral American IndianCherokeeChickasawChileanChineseChippewaChoctawColombianComancheCosta RicanCreekCroatianCubanCzechCzechoslovakianDanishDominicanDutchEastern EuropeanEcuadorianEgyptianEnglishEthiopianEuropeanFilipinoFinnishFrenchFrench American IndianFrench CanadianGermanGerman RussianGhanaianGreekGuamanian / ChamorroGuatemalanGuyaneseHaitianHonduranHungarianIcelanderIndian (Asian)IndonesianInupiatIranianIraqiIrishIroquoisIsraeliItalianJamaicanJapaneseJordanianKenyanKiowaKoreanLaotianLatvianLebaneseLithuanianLuxembourgerMacedonianMalaysianMexicanMexican American IndianMoroccanNative HawaiianNavajoNicaraguanNigerianNorthern EuropeanNorwegianPakistaniPalestinianPanamanianPennsylvania GermanPeruvianPolishPortuguesePotawatomiPuebloPuerto RicanRomanianRussianSalvadoranSamoanScandinavianScotch-IrishScottishSeminoleSerbianSiouxSlavicSlovakSloveneSomaliSouth AfricanSouth AmericanSpaniardSpanishSri LankanSubsaharan AfricanSudaneseSwedishSwissSyrianThaiTlingit-HaidaTrinidadian and TobagonianTurkishUkrainianVenezuelanVietnameseWelshWest IndianYugoslavianZimbabwean
Ancestry (Percentage)
AfghanAfricanAlbanianAleutAmericanApacheArabArapahoArgentineanArmenianAustralianAustrianBangladeshiBasqueBelgianBhutaneseBlackfeetBolivianBrazilianBritishBulgarianBurmeseCajunCambodianCanadianCarpatho RusynCentral AmericanCentral American IndianCherokeeChickasawChileanChineseChippewaChoctawColombianComancheCosta RicanCreekCroatianCubanCzechCzechoslovakianDanishDominicanDutchEastern EuropeanEcuadorianEgyptianEnglishEthiopianEuropeanFilipinoFinnishFrenchFrench American IndianFrench CanadianGermanGerman RussianGhanaianGreekGuamanian / ChamorroGuatemalanGuyaneseHaitianHonduranHungarianIcelanderIndian (Asian)IndonesianInupiatIranianIraqiIrishIroquoisIsraeliItalianJamaicanJapaneseJordanianKenyanKiowaKoreanLaotianLatvianLebaneseLithuanianLuxembourgerMacedonianMalaysianMexicanMexican American IndianMoroccanNative HawaiianNavajoNicaraguanNigerianNorthern EuropeanNorwegianPakistaniPalestinianPanamanianPennsylvania GermanPeruvianPolishPortuguesePotawatomiPuebloPuerto RicanRomanianRussianSalvadoranSamoanScandinavianScotch-IrishScottishSeminoleSerbianSiouxSlavicSlovakSloveneSomaliSouth AfricanSouth AmericanSpaniardSpanishSri LankanSubsaharan AfricanSudaneseSwedishSwissSyrianThaiTlingit-HaidaTrinidadian and TobagonianTurkishUkrainianVenezuelanVietnameseWelshWest IndianYugoslavianZimbabwean
Immigrant Origin (Total)
AfghanistanAfricaArgentinaAsiaAustraliaBangladeshBarbadosBelarusBosnia and HerzegovinaBrazilBurma / MyanmarCameroonCanadaCaribbeanCentral AmericaChileChinaColombiaCongoCosta RicaCroatiaCubaCzechoslovakiaDominican RepublicEastern AfricaEastern AsiaEastern EuropeEgyptEl SalvadorEnglandEthiopiaEuropeFranceGermanyGhanaGreeceGuatemalaHondurasHong KongHungaryIndiaIndonesiaIranIraqIrelandIsraelItalyJamaicaJapanJordanKazakhstanKenyaKoreaKuwaitLaosLatin AmericaLatviaLithuaniaMalaysiaMexicoMiddle AfricaMoroccoNepalNetherlandsNicaraguaNigeriaNorthern AfricaNorthern EuropeOceaniaPakistanPanamaPeruPhilippinesPolandPortugalRomaniaRussiaSaudi ArabiaScotlandSierra LeoneSomaliaSouth AfricaSouth AmericaSouth Central AsiaSouth Eastern AsiaSouthern EuropeSpainSri LankaSudanSyriaTaiwanThailandTrinidad and TobagoTurkeyUgandaUkraineVenezuelaVietnamWestern AfricaWestern AsiaWestern EuropeZaireZimbabwe
Immigrant Origin (Percentage)
AfghanistanAfricaArgentinaAsiaAustraliaBangladeshBarbadosBelarusBosnia and HerzegovinaBrazilBurma / MyanmarCameroonCanadaCaribbeanCentral AmericaChileChinaColombiaCongoCosta RicaCroatiaCubaCzechoslovakiaDominican RepublicEastern AfricaEastern AsiaEastern EuropeEgyptEl SalvadorEnglandEthiopiaEuropeFranceGermanyGhanaGreeceGuatemalaHondurasHong KongHungaryIndiaIndonesiaIranIraqIrelandIsraelItalyJamaicaJapanJordanKazakhstanKenyaKoreaKuwaitLaosLatin AmericaLatviaLithuaniaMalaysiaMexicoMiddle AfricaMoroccoNepalNetherlandsNicaraguaNigeriaNorthern AfricaNorthern EuropeOceaniaPakistanPanamaPeruPhilippinesPolandPortugalRomaniaRussiaSaudi ArabiaScotlandSierra LeoneSomaliaSouth AfricaSouth AmericaSouth Central AsiaSouth Eastern AsiaSouthern EuropeSpainSri LankaSudanSyriaTaiwanThailandTrinidad and TobagoTurkeyUgandaUkraineVenezuelaVietnamWestern AfricaWestern AsiaWestern EuropeZaireZimbabwe
Income
Income (Families)
Income (Households)
Poverty
Poverty (Families)
Unemployment
Employment Occupations
Employment Industries
Employer Class
Commute Time
Commute Means
School Enrollment
Education by Degree Field
Occupancy
Finances
Physical Characteristics
Omaha
Compare Zip Codes
Comparison Subject

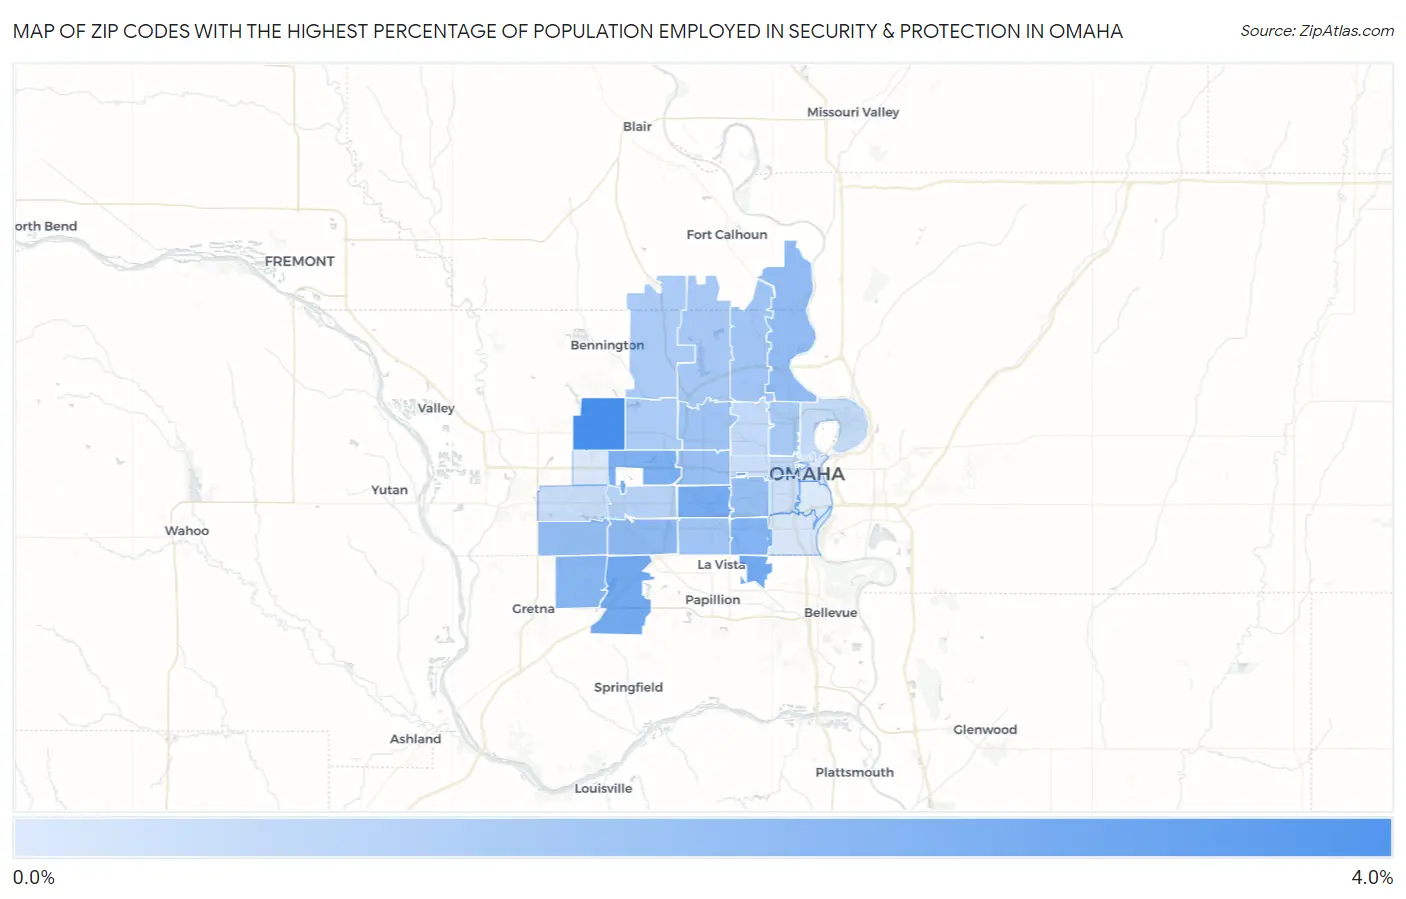
Map of Zip Codes with the Highest Percentage of Population Employed in Security & Protection in Omaha

0.0%
4.0%
Zip Codes with the Highest Percentage of Population Employed in Security & Protection in Omaha Map

Zip Codes with the Highest Percentage of Population Employed in Security & Protection in Omaha, NE

Zip Code % Employed vs State vs National
1.681163.7%1.7%(+2.02)#362.1%(+1.55)#5,155
2.681822.9%1.7%(+1.25)#652.1%(+0.777)#7,531
3.681572.8%1.7%(+1.09)#692.1%(+0.621)#8,242
4.681382.7%1.7%(+1.07)#702.1%(+0.596)#8,332
5.681242.7%1.7%(+1.01)#722.1%(+0.541)#8,585
6.681542.6%1.7%(+0.882)#802.1%(+0.412)#9,202
7.681172.5%1.7%(+0.778)#842.1%(+0.307)#9,754
8.681362.3%1.7%(+0.611)#982.1%(+0.140)#10,713
9.681372.2%1.7%(+0.514)#1082.1%(+0.043)#11,309
10.681122.1%1.7%(+0.410)#1142.1%(-0.061)#11,996
11.681352.1%1.7%(+0.400)#1152.1%(-0.071)#12,069
12.681062.0%1.7%(+0.312)#1182.1%(-0.159)#12,621
13.681142.0%1.7%(+0.275)#1202.1%(-0.196)#12,868
14.681341.8%1.7%(+0.138)#1382.1%(-0.332)#13,811
15.681521.8%1.7%(+0.094)#1452.1%(-0.377)#14,149
16.681271.7%1.7%(+0.067)#1492.1%(-0.403)#14,346
17.681221.7%1.7%(-0.011)#1662.1%(-0.482)#14,934
18.681111.6%1.7%(-0.057)#1712.1%(-0.528)#15,255
19.681421.6%1.7%(-0.103)#1772.1%(-0.574)#15,610
20.681641.6%1.7%(-0.109)#1782.1%(-0.580)#15,651
21.681441.3%1.7%(-0.364)#2102.1%(-0.835)#17,627
22.681311.2%1.7%(-0.514)#2282.1%(-0.985)#18,786
23.681041.1%1.7%(-0.615)#2482.1%(-1.09)#19,562
24.681101.0%1.7%(-0.659)#2532.1%(-1.13)#19,891
25.681300.93%1.7%(-0.749)#2662.1%(-1.22)#20,579
26.681320.89%1.7%(-0.790)#2722.1%(-1.26)#20,865
27.681050.84%1.7%(-0.834)#2782.1%(-1.30)#21,149
28.681070.58%1.7%(-1.10)#3142.1%(-1.57)#22,804
29.681180.54%1.7%(-1.13)#3212.1%(-1.60)#22,990
30.681020.54%1.7%(-1.14)#3232.1%(-1.61)#23,038
31.681080.49%1.7%(-1.19)#3292.1%(-1.66)#23,277

Common Questions

What are the Top 10 Zip Codes with the Highest Percentage of Population Employed in Security & Protection in Omaha, NE?
Top 10 Zip Codes with the Highest Percentage of Population Employed in Security & Protection in Omaha, NE are:
#1
3.7%
#2
2.9%
#3
2.8%
#4
2.7%
#5
2.7%
#6
2.6%
#7
2.5%
#8
2.3%
#9
2.2%
#10
2.1%
What zip code has the Highest Percentage of Population Employed in Security & Protection in Omaha, NE?
68116 has the Highest Percentage of Population Employed in Security & Protection in Omaha, NE with 3.7%.
What is the Percentage of Population Employed in Security & Protection in Omaha, NE?
Percentage of Population Employed in Security & Protection in Omaha is 1.6%.
What is the Percentage of Population Employed in Security & Protection in Nebraska?
Percentage of Population Employed in Security & Protection in Nebraska is 1.7%.
What is the Percentage of Population Employed in Security & Protection in the United States?
Percentage of Population Employed in Security & Protection in the United States is 2.1%.