Zip Codes with the Highest Percentage of Population with a Degree in Social Sciences in Omaha, NE

RELATED REPORTS & OPTIONS

Social Sciences
Population
Families and Households
Female Fertility
Female Fertility (Unmarried)
Race (Community Size)
Race (Percentage)
Ancestry (Community Size)
AfghanAfricanAlbanianAleutAmericanApacheArabArapahoArgentineanArmenianAustralianAustrianBangladeshiBasqueBelgianBhutaneseBlackfeetBolivianBrazilianBritishBulgarianBurmeseCajunCambodianCanadianCarpatho RusynCentral AmericanCentral American IndianCherokeeChickasawChileanChineseChippewaChoctawColombianComancheCosta RicanCreekCroatianCubanCzechCzechoslovakianDanishDominicanDutchEastern EuropeanEcuadorianEgyptianEnglishEthiopianEuropeanFilipinoFinnishFrenchFrench American IndianFrench CanadianGermanGerman RussianGhanaianGreekGuamanian / ChamorroGuatemalanGuyaneseHaitianHonduranHungarianIcelanderIndian (Asian)IndonesianInupiatIranianIraqiIrishIroquoisIsraeliItalianJamaicanJapaneseJordanianKenyanKiowaKoreanLaotianLatvianLebaneseLithuanianLuxembourgerMacedonianMalaysianMexicanMexican American IndianMoroccanNative HawaiianNavajoNicaraguanNigerianNorthern EuropeanNorwegianPakistaniPalestinianPanamanianPennsylvania GermanPeruvianPolishPortuguesePotawatomiPuebloPuerto RicanRomanianRussianSalvadoranSamoanScandinavianScotch-IrishScottishSeminoleSerbianSiouxSlavicSlovakSloveneSomaliSouth AfricanSouth AmericanSpaniardSpanishSri LankanSubsaharan AfricanSudaneseSwedishSwissSyrianThaiTlingit-HaidaTrinidadian and TobagonianTurkishUkrainianVenezuelanVietnameseWelshWest IndianYugoslavianZimbabwean
Ancestry (Percentage)
AfghanAfricanAlbanianAleutAmericanApacheArabArapahoArgentineanArmenianAustralianAustrianBangladeshiBasqueBelgianBhutaneseBlackfeetBolivianBrazilianBritishBulgarianBurmeseCajunCambodianCanadianCarpatho RusynCentral AmericanCentral American IndianCherokeeChickasawChileanChineseChippewaChoctawColombianComancheCosta RicanCreekCroatianCubanCzechCzechoslovakianDanishDominicanDutchEastern EuropeanEcuadorianEgyptianEnglishEthiopianEuropeanFilipinoFinnishFrenchFrench American IndianFrench CanadianGermanGerman RussianGhanaianGreekGuamanian / ChamorroGuatemalanGuyaneseHaitianHonduranHungarianIcelanderIndian (Asian)IndonesianInupiatIranianIraqiIrishIroquoisIsraeliItalianJamaicanJapaneseJordanianKenyanKiowaKoreanLaotianLatvianLebaneseLithuanianLuxembourgerMacedonianMalaysianMexicanMexican American IndianMoroccanNative HawaiianNavajoNicaraguanNigerianNorthern EuropeanNorwegianPakistaniPalestinianPanamanianPennsylvania GermanPeruvianPolishPortuguesePotawatomiPuebloPuerto RicanRomanianRussianSalvadoranSamoanScandinavianScotch-IrishScottishSeminoleSerbianSiouxSlavicSlovakSloveneSomaliSouth AfricanSouth AmericanSpaniardSpanishSri LankanSubsaharan AfricanSudaneseSwedishSwissSyrianThaiTlingit-HaidaTrinidadian and TobagonianTurkishUkrainianVenezuelanVietnameseWelshWest IndianYugoslavianZimbabwean
Immigrant Origin (Total)
AfghanistanAfricaArgentinaAsiaAustraliaBangladeshBarbadosBelarusBosnia and HerzegovinaBrazilBurma / MyanmarCameroonCanadaCaribbeanCentral AmericaChileChinaColombiaCongoCosta RicaCroatiaCubaCzechoslovakiaDominican RepublicEastern AfricaEastern AsiaEastern EuropeEgyptEl SalvadorEnglandEthiopiaEuropeFranceGermanyGhanaGreeceGuatemalaHondurasHong KongHungaryIndiaIndonesiaIranIraqIrelandIsraelItalyJamaicaJapanJordanKazakhstanKenyaKoreaKuwaitLaosLatin AmericaLatviaLithuaniaMalaysiaMexicoMiddle AfricaMoroccoNepalNetherlandsNicaraguaNigeriaNorthern AfricaNorthern EuropeOceaniaPakistanPanamaPeruPhilippinesPolandPortugalRomaniaRussiaSaudi ArabiaScotlandSierra LeoneSomaliaSouth AfricaSouth AmericaSouth Central AsiaSouth Eastern AsiaSouthern EuropeSpainSri LankaSudanSyriaTaiwanThailandTrinidad and TobagoTurkeyUgandaUkraineVenezuelaVietnamWestern AfricaWestern AsiaWestern EuropeZaireZimbabwe
Immigrant Origin (Percentage)
AfghanistanAfricaArgentinaAsiaAustraliaBangladeshBarbadosBelarusBosnia and HerzegovinaBrazilBurma / MyanmarCameroonCanadaCaribbeanCentral AmericaChileChinaColombiaCongoCosta RicaCroatiaCubaCzechoslovakiaDominican RepublicEastern AfricaEastern AsiaEastern EuropeEgyptEl SalvadorEnglandEthiopiaEuropeFranceGermanyGhanaGreeceGuatemalaHondurasHong KongHungaryIndiaIndonesiaIranIraqIrelandIsraelItalyJamaicaJapanJordanKazakhstanKenyaKoreaKuwaitLaosLatin AmericaLatviaLithuaniaMalaysiaMexicoMiddle AfricaMoroccoNepalNetherlandsNicaraguaNigeriaNorthern AfricaNorthern EuropeOceaniaPakistanPanamaPeruPhilippinesPolandPortugalRomaniaRussiaSaudi ArabiaScotlandSierra LeoneSomaliaSouth AfricaSouth AmericaSouth Central AsiaSouth Eastern AsiaSouthern EuropeSpainSri LankaSudanSyriaTaiwanThailandTrinidad and TobagoTurkeyUgandaUkraineVenezuelaVietnamWestern AfricaWestern AsiaWestern EuropeZaireZimbabwe
Income
Income (Families)
Income (Households)
Poverty
Poverty (Families)
Unemployment
Employment Occupations
Employment Industries
Employer Class
Commute Time
Commute Means
School Enrollment
Education by Degree Field
Occupancy
Finances
Physical Characteristics
Omaha
Compare Zip Codes
Comparison Subject

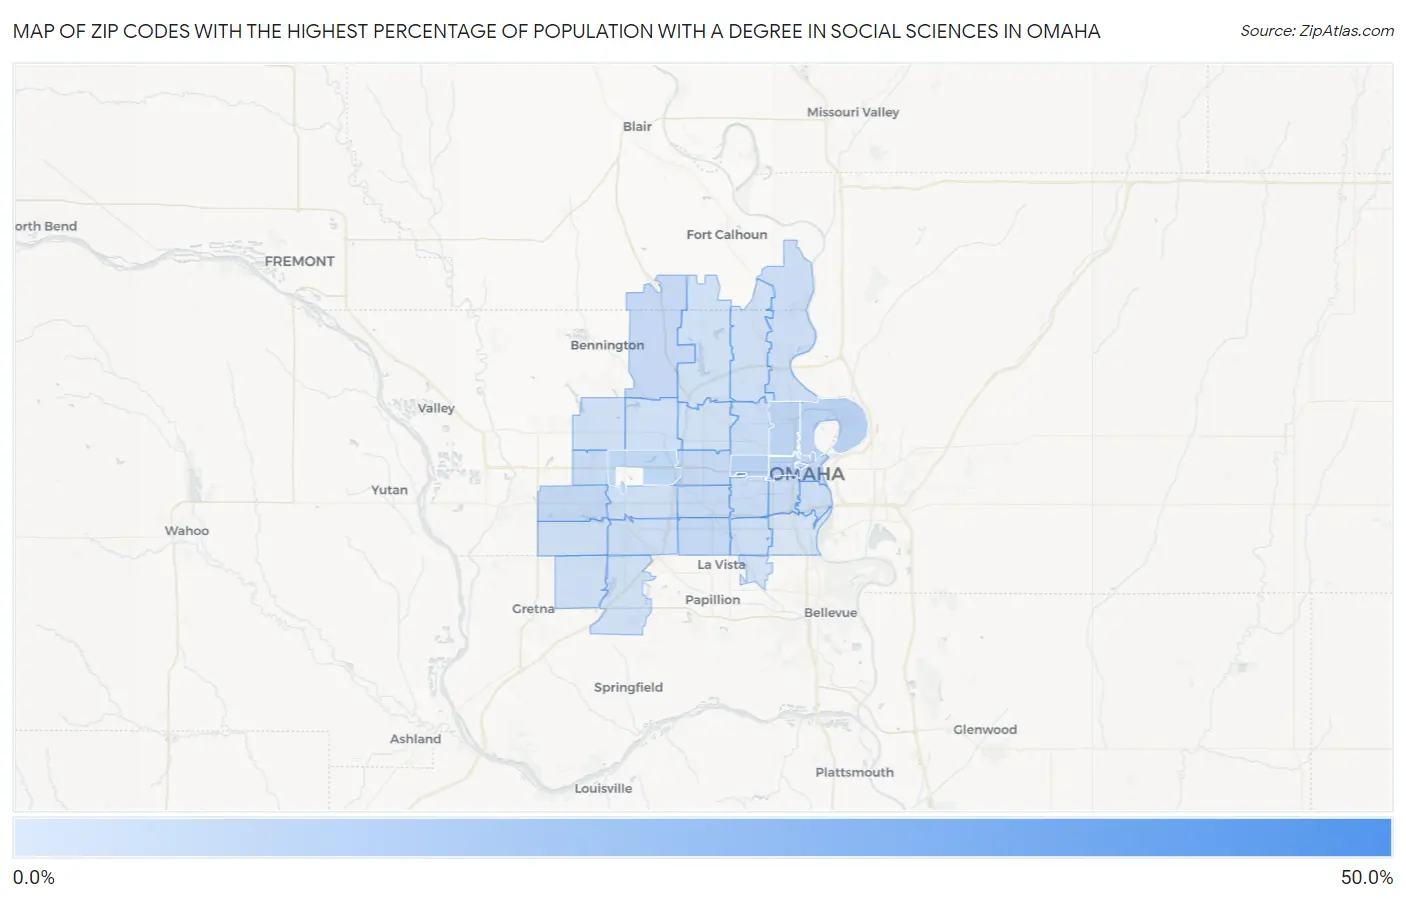
Map of Zip Codes with the Highest Percentage of Population with a Degree in Social Sciences in Omaha

0.0%
50.0%
Zip Codes with the Highest Percentage of Population with a Degree in Social Sciences in Omaha Map

Zip Codes with the Highest Percentage of Population with a Degree in Social Sciences in Omaha, NE

Zip Code % Graduates vs State vs National
1.6818250.0%4.9%(+45.1)#18.1%(+41.9)#140
2.6813110.6%4.9%(+5.73)#378.1%(+2.56)#4,778
3.6813210.6%4.9%(+5.69)#388.1%(+2.52)#4,817
4.6811010.0%4.9%(+5.12)#448.1%(+1.96)#5,534
5.681789.3%4.9%(+4.43)#498.1%(+1.26)#6,440
6.681119.3%4.9%(+4.43)#508.1%(+1.26)#6,449
7.681548.7%4.9%(+3.79)#548.1%(+0.627)#7,426
8.681307.3%4.9%(+2.42)#698.1%(-0.745)#10,156
9.681027.1%4.9%(+2.21)#738.1%(-0.962)#10,672
10.681427.1%4.9%(+2.15)#758.1%(-1.02)#10,794
11.681276.9%4.9%(+2.01)#818.1%(-1.16)#11,128
12.681146.6%4.9%(+1.72)#888.1%(-1.44)#11,793
13.681186.4%4.9%(+1.53)#928.1%(-1.64)#12,287
14.681246.3%4.9%(+1.35)#1008.1%(-1.82)#12,734
15.681045.8%4.9%(+0.879)#1098.1%(-2.29)#13,866
16.681055.7%4.9%(+0.788)#1128.1%(-2.38)#14,092
17.681065.5%4.9%(+0.556)#1208.1%(-2.61)#14,654
18.681375.1%4.9%(+0.165)#1358.1%(-3.00)#15,662
19.681174.9%4.9%(+0.016)#1438.1%(-3.15)#16,019
20.681084.7%4.9%(-0.196)#1518.1%(-3.36)#16,512
21.681124.6%4.9%(-0.291)#1558.1%(-3.46)#16,758
22.681524.4%4.9%(-0.549)#1708.1%(-3.72)#17,361
23.681364.3%4.9%(-0.636)#1748.1%(-3.80)#17,587
24.681164.1%4.9%(-0.829)#1798.1%(-4.00)#18,051
25.681444.0%4.9%(-0.865)#1838.1%(-4.03)#18,120
26.681644.0%4.9%(-0.917)#1868.1%(-4.08)#18,240
27.681353.9%4.9%(-0.967)#1878.1%(-4.13)#18,349
28.681223.9%4.9%(-0.991)#1898.1%(-4.16)#18,411
29.681343.8%4.9%(-1.15)#1958.1%(-4.31)#18,753
30.681383.7%4.9%(-1.20)#1978.1%(-4.37)#18,915
31.681573.2%4.9%(-1.74)#2258.1%(-4.91)#20,006
32.681071.8%4.9%(-3.12)#2868.1%(-6.29)#22,503

Common Questions

What are the Top 10 Zip Codes with the Highest Percentage of Population with a Degree in Social Sciences in Omaha, NE?
Top 10 Zip Codes with the Highest Percentage of Population with a Degree in Social Sciences in Omaha, NE are:
#1
50.0%
#2
10.6%
#3
10.6%
#4
10.0%
#5
9.3%
#6
9.3%
#7
8.7%
#8
7.3%
#9
7.1%
#10
7.1%
What zip code has the Highest Percentage of Population with a Degree in Social Sciences in Omaha, NE?
68182 has the Highest Percentage of Population with a Degree in Social Sciences in Omaha, NE with 50.0%.
What is the Percentage of Population with a Degree in Social Sciences in Omaha, NE?
Percentage of Population with a Degree in Social Sciences in Omaha is 5.9%.
What is the Percentage of Population with a Degree in Social Sciences in Nebraska?
Percentage of Population with a Degree in Social Sciences in Nebraska is 4.9%.
What is the Percentage of Population with a Degree in Social Sciences in the United States?
Percentage of Population with a Degree in Social Sciences in the United States is 8.1%.