Zip Codes with the Highest Percentage of Families with Income Above $200,000 in Omaha, NE

RELATED REPORTS & OPTIONS

Family Income | $200k+
Population
Families and Households
Female Fertility
Female Fertility (Unmarried)
Race (Community Size)
Race (Percentage)
Ancestry (Community Size)
AfghanAfricanAlbanianAleutAmericanApacheArabArapahoArgentineanArmenianAustralianAustrianBangladeshiBasqueBelgianBhutaneseBlackfeetBolivianBrazilianBritishBulgarianBurmeseCajunCambodianCanadianCarpatho RusynCentral AmericanCentral American IndianCherokeeChickasawChileanChineseChippewaChoctawColombianComancheCosta RicanCreekCroatianCubanCzechCzechoslovakianDanishDominicanDutchEastern EuropeanEcuadorianEgyptianEnglishEthiopianEuropeanFilipinoFinnishFrenchFrench American IndianFrench CanadianGermanGerman RussianGhanaianGreekGuamanian / ChamorroGuatemalanGuyaneseHaitianHonduranHungarianIcelanderIndian (Asian)IndonesianInupiatIranianIraqiIrishIroquoisIsraeliItalianJamaicanJapaneseJordanianKenyanKiowaKoreanLaotianLatvianLebaneseLithuanianLuxembourgerMacedonianMalaysianMexicanMexican American IndianMoroccanNative HawaiianNavajoNicaraguanNigerianNorthern EuropeanNorwegianPakistaniPalestinianPanamanianPennsylvania GermanPeruvianPolishPortuguesePotawatomiPuebloPuerto RicanRomanianRussianSalvadoranSamoanScandinavianScotch-IrishScottishSeminoleSerbianSiouxSlavicSlovakSloveneSomaliSouth AfricanSouth AmericanSpaniardSpanishSri LankanSubsaharan AfricanSudaneseSwedishSwissSyrianThaiTlingit-HaidaTrinidadian and TobagonianTurkishUkrainianVenezuelanVietnameseWelshWest IndianYugoslavianZimbabwean
Ancestry (Percentage)
AfghanAfricanAlbanianAleutAmericanApacheArabArapahoArgentineanArmenianAustralianAustrianBangladeshiBasqueBelgianBhutaneseBlackfeetBolivianBrazilianBritishBulgarianBurmeseCajunCambodianCanadianCarpatho RusynCentral AmericanCentral American IndianCherokeeChickasawChileanChineseChippewaChoctawColombianComancheCosta RicanCreekCroatianCubanCzechCzechoslovakianDanishDominicanDutchEastern EuropeanEcuadorianEgyptianEnglishEthiopianEuropeanFilipinoFinnishFrenchFrench American IndianFrench CanadianGermanGerman RussianGhanaianGreekGuamanian / ChamorroGuatemalanGuyaneseHaitianHonduranHungarianIcelanderIndian (Asian)IndonesianInupiatIranianIraqiIrishIroquoisIsraeliItalianJamaicanJapaneseJordanianKenyanKiowaKoreanLaotianLatvianLebaneseLithuanianLuxembourgerMacedonianMalaysianMexicanMexican American IndianMoroccanNative HawaiianNavajoNicaraguanNigerianNorthern EuropeanNorwegianPakistaniPalestinianPanamanianPennsylvania GermanPeruvianPolishPortuguesePotawatomiPuebloPuerto RicanRomanianRussianSalvadoranSamoanScandinavianScotch-IrishScottishSeminoleSerbianSiouxSlavicSlovakSloveneSomaliSouth AfricanSouth AmericanSpaniardSpanishSri LankanSubsaharan AfricanSudaneseSwedishSwissSyrianThaiTlingit-HaidaTrinidadian and TobagonianTurkishUkrainianVenezuelanVietnameseWelshWest IndianYugoslavianZimbabwean
Immigrant Origin (Total)
AfghanistanAfricaArgentinaAsiaAustraliaBangladeshBarbadosBelarusBosnia and HerzegovinaBrazilBurma / MyanmarCameroonCanadaCaribbeanCentral AmericaChileChinaColombiaCongoCosta RicaCroatiaCubaCzechoslovakiaDominican RepublicEastern AfricaEastern AsiaEastern EuropeEgyptEl SalvadorEnglandEthiopiaEuropeFranceGermanyGhanaGreeceGuatemalaHondurasHong KongHungaryIndiaIndonesiaIranIraqIrelandIsraelItalyJamaicaJapanJordanKazakhstanKenyaKoreaKuwaitLaosLatin AmericaLatviaLithuaniaMalaysiaMexicoMiddle AfricaMoroccoNepalNetherlandsNicaraguaNigeriaNorthern AfricaNorthern EuropeOceaniaPakistanPanamaPeruPhilippinesPolandPortugalRomaniaRussiaSaudi ArabiaScotlandSierra LeoneSomaliaSouth AfricaSouth AmericaSouth Central AsiaSouth Eastern AsiaSouthern EuropeSpainSri LankaSudanSyriaTaiwanThailandTrinidad and TobagoTurkeyUgandaUkraineVenezuelaVietnamWestern AfricaWestern AsiaWestern EuropeZaireZimbabwe
Immigrant Origin (Percentage)
AfghanistanAfricaArgentinaAsiaAustraliaBangladeshBarbadosBelarusBosnia and HerzegovinaBrazilBurma / MyanmarCameroonCanadaCaribbeanCentral AmericaChileChinaColombiaCongoCosta RicaCroatiaCubaCzechoslovakiaDominican RepublicEastern AfricaEastern AsiaEastern EuropeEgyptEl SalvadorEnglandEthiopiaEuropeFranceGermanyGhanaGreeceGuatemalaHondurasHong KongHungaryIndiaIndonesiaIranIraqIrelandIsraelItalyJamaicaJapanJordanKazakhstanKenyaKoreaKuwaitLaosLatin AmericaLatviaLithuaniaMalaysiaMexicoMiddle AfricaMoroccoNepalNetherlandsNicaraguaNigeriaNorthern AfricaNorthern EuropeOceaniaPakistanPanamaPeruPhilippinesPolandPortugalRomaniaRussiaSaudi ArabiaScotlandSierra LeoneSomaliaSouth AfricaSouth AmericaSouth Central AsiaSouth Eastern AsiaSouthern EuropeSpainSri LankaSudanSyriaTaiwanThailandTrinidad and TobagoTurkeyUgandaUkraineVenezuelaVietnamWestern AfricaWestern AsiaWestern EuropeZaireZimbabwe
Income
Income (Families)
Income (Households)
Poverty
Poverty (Families)
Unemployment
Employment Occupations
Employment Industries
Employer Class
Commute Time
Commute Means
School Enrollment
Education by Degree Field
Occupancy
Finances
Physical Characteristics
Omaha
Compare Zip Codes
Comparison Subject

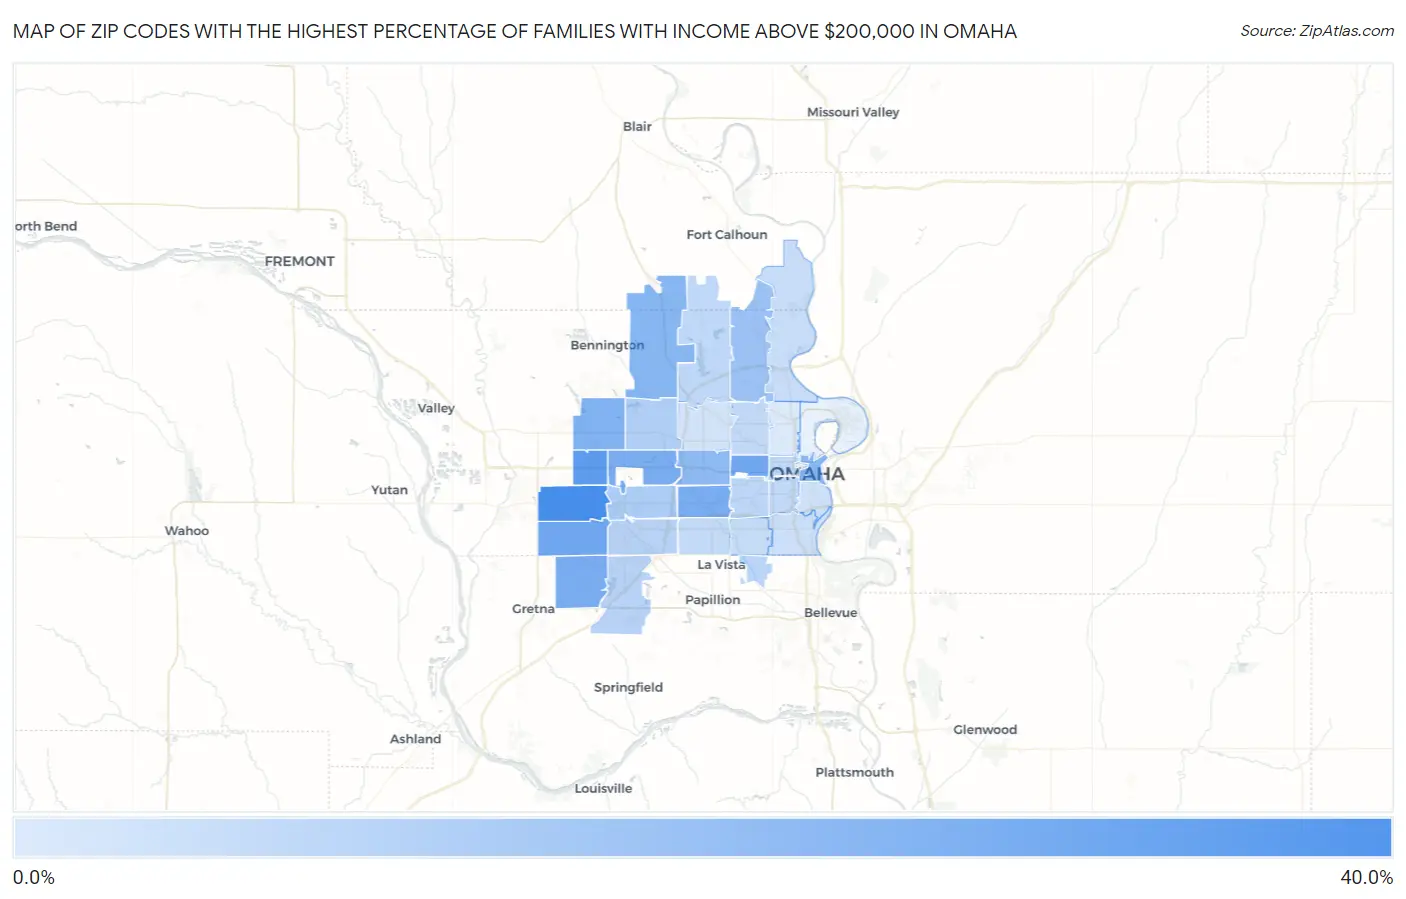
Map of Zip Codes with the Highest Percentage of Families with Income Above $200,000 in Omaha

0.0%
40.0%
Zip Codes with the Highest Percentage of Families with Income Above $200,000 in Omaha Map

Zip Codes with the Highest Percentage of Families with Income Above $200,000 in Omaha, NE

Zip Code Families with Income > $200k vs State vs National
1.6813037.3%10.9%(+26.4)#514.8%(+22.5)#1,573
2.6811831.1%10.9%(+20.2)#1114.8%(+16.3)#2,354
3.6813525.9%10.9%(+15.0)#2314.8%(+11.1)#3,263
4.6813225.9%10.9%(+15.0)#2414.8%(+11.1)#3,270
5.6815423.6%10.9%(+12.7)#2914.8%(+8.80)#3,810
6.6812423.4%10.9%(+12.5)#3014.8%(+8.60)#3,858
7.6813623.2%10.9%(+12.3)#3214.8%(+8.40)#3,894
8.6811621.4%10.9%(+10.5)#4014.8%(+6.60)#4,376
9.6810220.2%10.9%(+9.30)#4614.8%(+5.40)#4,754
10.6814220.2%10.9%(+9.30)#4714.8%(+5.40)#4,759
11.6811418.3%10.9%(+7.40)#5414.8%(+3.50)#5,454
12.6815215.1%10.9%(+4.20)#6814.8%(+0.300)#6,940
13.6814411.0%10.9%(+0.100)#10714.8%(-3.80)#9,816
14.6816410.0%10.9%(-0.900)#12914.8%(-4.80)#10,785
15.681388.6%10.9%(-2.30)#17214.8%(-6.20)#12,415
16.681378.2%10.9%(-2.70)#18714.8%(-6.60)#12,918
17.681577.8%10.9%(-3.10)#20414.8%(-7.00)#13,494
18.681067.5%10.9%(-3.40)#21414.8%(-7.30)#13,876
19.681316.8%10.9%(-4.10)#23714.8%(-8.00)#15,047
20.681226.7%10.9%(-4.20)#24314.8%(-8.10)#15,220
21.681056.2%10.9%(-4.70)#27014.8%(-8.60)#16,094
22.681046.1%10.9%(-4.80)#27214.8%(-8.70)#16,252
23.681275.8%10.9%(-5.10)#28714.8%(-9.00)#16,802
24.681175.3%10.9%(-5.60)#30414.8%(-9.50)#17,840
25.681124.6%10.9%(-6.30)#32714.8%(-10.2)#19,217
26.681073.8%10.9%(-7.10)#35314.8%(-11.0)#20,840
27.681083.4%10.9%(-7.50)#36814.8%(-11.4)#21,680
28.681343.0%10.9%(-7.90)#38414.8%(-11.8)#22,464
29.681110.30%10.9%(-10.6)#47414.8%(-14.5)#26,882

Common Questions

What are the Top 10 Zip Codes with the Highest Percentage of Families with Income Above $200,000 in Omaha, NE?
Top 10 Zip Codes with the Highest Percentage of Families with Income Above $200,000 in Omaha, NE are:
#1
37.3%
#2
31.1%
#3
25.9%
#4
25.9%
#5
23.6%
#6
23.4%
#7
23.2%
#8
21.4%
#9
20.2%
#10
20.2%
What zip code has the Highest Percentage of Families with Income Above $200,000 in Omaha, NE?
68130 has the Highest Percentage of Families with Income Above $200,000 in Omaha, NE with 37.3%.
What is the Percentage of Families with Income Above $200,000 in Omaha, NE?
Percentage of Families with Income Above $200,000 in Omaha is 13.0%.
What is the Percentage of Families with Income Above $200,000 in Nebraska?
Percentage of Families with Income Above $200,000 in Nebraska is 10.9%.
What is the Percentage of Families with Income Above $200,000 in the United States?
Percentage of Families with Income Above $200,000 in the United States is 14.8%.