Zip Codes with the Highest Percentage of Households with Income Below $10,000 in Kentucky
RELATED REPORTS & OPTIONS
Household Income | $0-10k
Kentucky
Compare Zip Codes
Map of Zip Codes with the Highest Percentage of Households with Income Below $10,000 in Kentucky
0.0%
100.0%
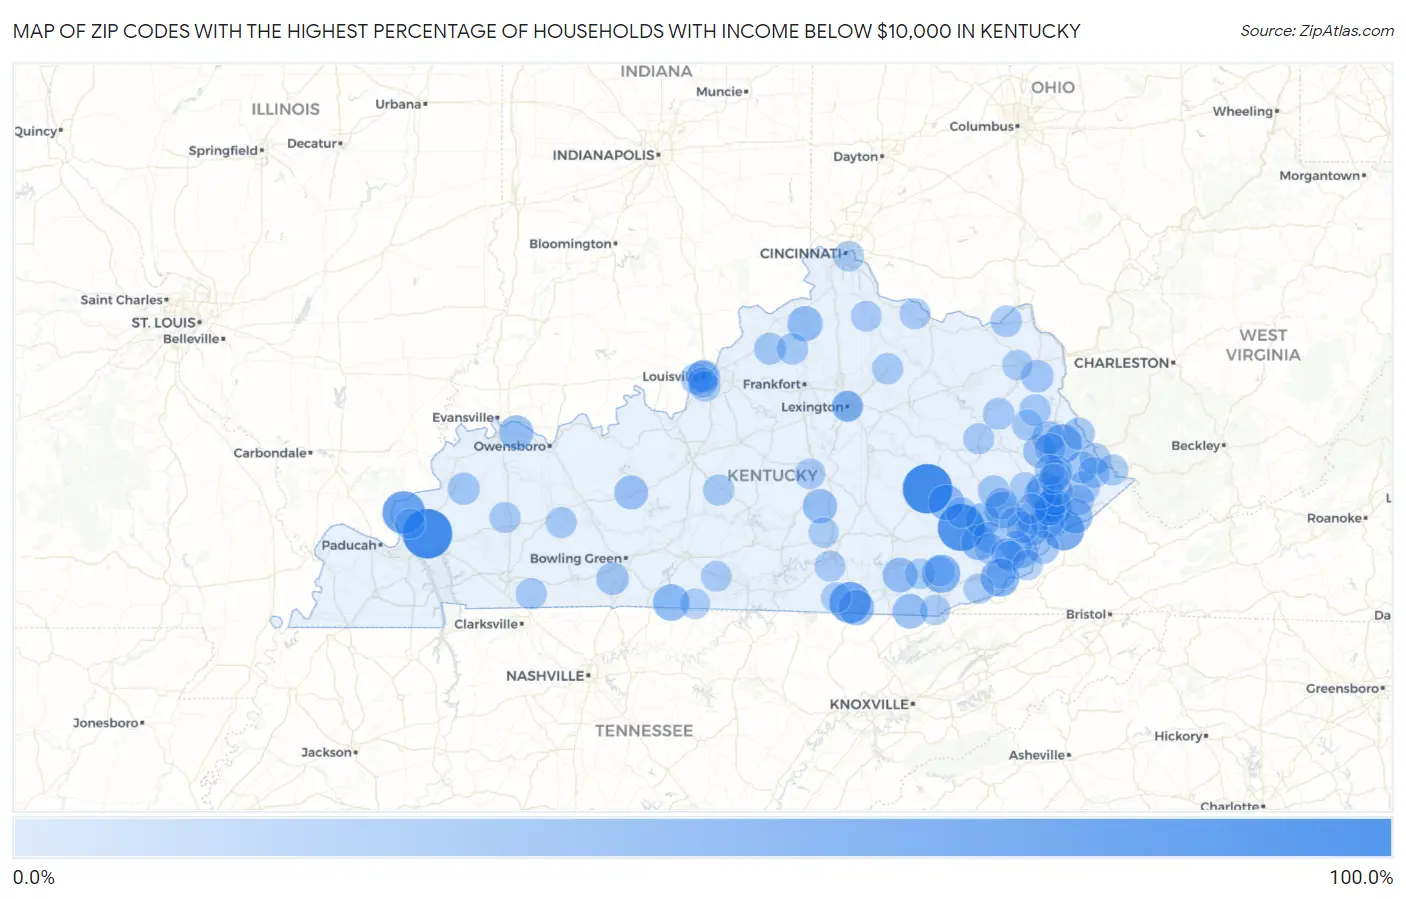
Zip Codes with the Highest Percentage of Households with Income Below $10,000 in Kentucky
| Zip Code | Households with Income < $10k | vs State | vs National | |
| 1. | 42037 | 100.0% | 6.1%(+93.9)#1 | 4.9%(+95.1)#27 |
| 2. | 41386 | 100.0% | 6.1%(+93.9)#2 | 4.9%(+95.1)#32 |
| 3. | 41762 | 88.6% | 6.1%(+82.5)#3 | 4.9%(+83.7)#40 |
| 4. | 42047 | 68.8% | 6.1%(+62.7)#4 | 4.9%(+63.9)#59 |
| 5. | 42638 | 61.8% | 6.1%(+55.7)#5 | 4.9%(+56.9)#71 |
| 6. | 41517 | 60.0% | 6.1%(+53.9)#6 | 4.9%(+55.1)#78 |
| 7. | 41214 | 50.6% | 6.1%(+44.5)#7 | 4.9%(+45.7)#109 |
| 8. | 40847 | 48.6% | 6.1%(+42.5)#8 | 4.9%(+43.7)#120 |
| 9. | 40997 | 47.6% | 6.1%(+41.5)#9 | 4.9%(+42.7)#125 |
| 10. | 41650 | 40.8% | 6.1%(+34.7)#10 | 4.9%(+35.9)#167 |
| 11. | 42153 | 40.6% | 6.1%(+34.5)#11 | 4.9%(+35.7)#170 |
| 12. | 41739 | 38.1% | 6.1%(+32.0)#12 | 4.9%(+33.2)#188 |
| 13. | 41364 | 37.3% | 6.1%(+31.2)#13 | 4.9%(+32.4)#195 |
| 14. | 41651 | 36.7% | 6.1%(+30.6)#14 | 4.9%(+31.8)#200 |
| 15. | 42649 | 36.6% | 6.1%(+30.5)#15 | 4.9%(+31.7)#201 |
| 16. | 41775 | 35.5% | 6.1%(+29.4)#16 | 4.9%(+30.6)#214 |
| 17. | 40355 | 34.4% | 6.1%(+28.3)#17 | 4.9%(+29.5)#228 |
| 18. | 40771 | 33.3% | 6.1%(+27.2)#18 | 4.9%(+28.4)#244 |
| 19. | 41534 | 33.3% | 6.1%(+27.2)#19 | 4.9%(+28.4)#247 |
| 20. | 40940 | 32.9% | 6.1%(+26.8)#20 | 4.9%(+28.0)#273 |
| 21. | 41606 | 31.5% | 6.1%(+25.4)#21 | 4.9%(+26.6)#295 |
| 22. | 42451 | 31.1% | 6.1%(+25.0)#22 | 4.9%(+26.2)#301 |
| 23. | 40442 | 30.8% | 6.1%(+24.7)#23 | 4.9%(+25.9)#309 |
| 24. | 41723 | 30.4% | 6.1%(+24.3)#24 | 4.9%(+25.5)#319 |
| 25. | 41843 | 30.3% | 6.1%(+24.2)#25 | 4.9%(+25.4)#323 |
| 26. | 41812 | 28.8% | 6.1%(+22.7)#26 | 4.9%(+23.9)#354 |
| 27. | 42762 | 28.6% | 6.1%(+22.5)#27 | 4.9%(+23.7)#359 |
| 28. | 41833 | 27.8% | 6.1%(+21.7)#28 | 4.9%(+22.9)#378 |
| 29. | 41216 | 27.7% | 6.1%(+21.6)#29 | 4.9%(+22.8)#380 |
| 30. | 40826 | 26.0% | 6.1%(+19.9)#30 | 4.9%(+21.1)#441 |
| 31. | 41271 | 26.0% | 6.1%(+19.9)#31 | 4.9%(+21.1)#442 |
| 32. | 40202 | 24.2% | 6.1%(+18.1)#32 | 4.9%(+19.3)#524 |
| 33. | 42170 | 23.0% | 6.1%(+16.9)#33 | 4.9%(+18.1)#594 |
| 34. | 41132 | 22.2% | 6.1%(+16.1)#34 | 4.9%(+17.3)#625 |
| 35. | 41557 | 22.0% | 6.1%(+15.9)#35 | 4.9%(+17.1)#637 |
| 36. | 41203 | 21.5% | 6.1%(+15.4)#36 | 4.9%(+16.6)#673 |
| 37. | 42463 | 21.5% | 6.1%(+15.4)#37 | 4.9%(+16.6)#679 |
| 38. | 41824 | 21.2% | 6.1%(+15.1)#38 | 4.9%(+16.3)#693 |
| 39. | 41317 | 20.0% | 6.1%(+13.9)#39 | 4.9%(+15.1)#794 |
| 40. | 40050 | 19.8% | 6.1%(+13.7)#40 | 4.9%(+14.9)#812 |
| 41. | 41571 | 19.8% | 6.1%(+13.7)#41 | 4.9%(+14.9)#815 |
| 42. | 41712 | 19.5% | 6.1%(+13.4)#42 | 4.9%(+14.6)#845 |
| 43. | 41612 | 19.5% | 6.1%(+13.4)#43 | 4.9%(+14.6)#847 |
| 44. | 41421 | 19.1% | 6.1%(+13.0)#44 | 4.9%(+14.2)#897 |
| 45. | 41124 | 18.8% | 6.1%(+12.7)#45 | 4.9%(+13.9)#920 |
| 46. | 41847 | 18.7% | 6.1%(+12.6)#46 | 4.9%(+13.8)#932 |
| 47. | 41514 | 18.4% | 6.1%(+12.3)#47 | 4.9%(+13.5)#959 |
| 48. | 40036 | 18.4% | 6.1%(+12.3)#48 | 4.9%(+13.5)#966 |
| 49. | 41166 | 18.3% | 6.1%(+12.2)#49 | 4.9%(+13.4)#979 |
| 50. | 41764 | 18.1% | 6.1%(+12.0)#50 | 4.9%(+13.2)#1,017 |
| 51. | 41519 | 17.5% | 6.1%(+11.4)#51 | 4.9%(+12.6)#1,092 |
| 52. | 40348 | 17.5% | 6.1%(+11.4)#52 | 4.9%(+12.6)#1,093 |
| 53. | 40508 | 17.4% | 6.1%(+11.3)#53 | 4.9%(+12.5)#1,099 |
| 54. | 40211 | 17.4% | 6.1%(+11.3)#54 | 4.9%(+12.5)#1,100 |
| 55. | 40203 | 17.1% | 6.1%(+11.0)#55 | 4.9%(+12.2)#1,136 |
| 56. | 42286 | 17.1% | 6.1%(+11.0)#56 | 4.9%(+12.2)#1,139 |
| 57. | 42716 | 17.1% | 6.1%(+11.0)#57 | 4.9%(+12.2)#1,143 |
| 58. | 41821 | 17.1% | 6.1%(+11.0)#58 | 4.9%(+12.2)#1,151 |
| 59. | 41773 | 16.9% | 6.1%(+10.8)#59 | 4.9%(+12.0)#1,173 |
| 60. | 41669 | 16.8% | 6.1%(+10.7)#60 | 4.9%(+11.9)#1,194 |
| 61. | 41544 | 16.8% | 6.1%(+10.7)#61 | 4.9%(+11.9)#1,198 |
| 62. | 41219 | 16.7% | 6.1%(+10.6)#62 | 4.9%(+11.8)#1,205 |
| 63. | 42326 | 16.7% | 6.1%(+10.6)#63 | 4.9%(+11.8)#1,216 |
| 64. | 41642 | 16.4% | 6.1%(+10.3)#64 | 4.9%(+11.5)#1,267 |
| 65. | 41604 | 16.4% | 6.1%(+10.3)#65 | 4.9%(+11.5)#1,273 |
| 66. | 41562 | 16.2% | 6.1%(+10.1)#66 | 4.9%(+11.3)#1,300 |
| 67. | 42410 | 16.2% | 6.1%(+10.1)#67 | 4.9%(+11.3)#1,304 |
| 68. | 41265 | 16.1% | 6.1%(+10.00)#68 | 4.9%(+11.2)#1,324 |
| 69. | 41721 | 16.1% | 6.1%(+10.00)#69 | 4.9%(+11.2)#1,328 |
| 70. | 41352 | 16.1% | 6.1%(+10.00)#70 | 4.9%(+11.2)#1,329 |
| 71. | 41666 | 16.0% | 6.1%(+9.90)#71 | 4.9%(+11.1)#1,340 |
| 72. | 41034 | 15.8% | 6.1%(+9.70)#72 | 4.9%(+10.9)#1,382 |
| 73. | 41040 | 15.2% | 6.1%(+9.10)#73 | 4.9%(+10.3)#1,479 |
| 74. | 41777 | 15.2% | 6.1%(+9.10)#74 | 4.9%(+10.3)#1,486 |
| 75. | 41735 | 15.1% | 6.1%(+9.00)#75 | 4.9%(+10.2)#1,512 |
| 76. | 41631 | 15.0% | 6.1%(+8.90)#76 | 4.9%(+10.1)#1,526 |
| 77. | 40209 | 15.0% | 6.1%(+8.90)#77 | 4.9%(+10.1)#1,528 |
| 78. | 42124 | 14.7% | 6.1%(+8.60)#78 | 4.9%(+9.80)#1,611 |
| 79. | 42518 | 14.6% | 6.1%(+8.50)#79 | 4.9%(+9.70)#1,622 |
| 80. | 41663 | 14.6% | 6.1%(+8.50)#80 | 4.9%(+9.70)#1,640 |
| 81. | 41819 | 14.6% | 6.1%(+8.50)#81 | 4.9%(+9.70)#1,641 |
| 82. | 41640 | 14.5% | 6.1%(+8.40)#82 | 4.9%(+9.60)#1,655 |
| 83. | 41601 | 14.5% | 6.1%(+8.40)#83 | 4.9%(+9.60)#1,659 |
| 84. | 41071 | 14.3% | 6.1%(+8.20)#84 | 4.9%(+9.40)#1,687 |
| 85. | 41143 | 14.3% | 6.1%(+8.20)#85 | 4.9%(+9.40)#1,689 |
| 86. | 40440 | 14.3% | 6.1%(+8.20)#86 | 4.9%(+9.40)#1,695 |
| 87. | 40828 | 13.9% | 6.1%(+7.80)#87 | 4.9%(+9.00)#1,801 |
| 88. | 42647 | 13.9% | 6.1%(+7.80)#88 | 4.9%(+9.00)#1,802 |
| 89. | 40906 | 13.8% | 6.1%(+7.70)#89 | 4.9%(+8.90)#1,822 |
| 90. | 42140 | 13.8% | 6.1%(+7.70)#90 | 4.9%(+8.90)#1,828 |
| 91. | 42028 | 13.8% | 6.1%(+7.70)#91 | 4.9%(+8.90)#1,831 |
| 92. | 40208 | 13.7% | 6.1%(+7.60)#92 | 4.9%(+8.80)#1,847 |
| 93. | 40965 | 13.7% | 6.1%(+7.60)#93 | 4.9%(+8.80)#1,852 |
| 94. | 40507 | 13.7% | 6.1%(+7.60)#94 | 4.9%(+8.80)#1,858 |
| 95. | 40855 | 13.7% | 6.1%(+7.60)#95 | 4.9%(+8.80)#1,864 |
| 96. | 40831 | 13.6% | 6.1%(+7.50)#96 | 4.9%(+8.70)#1,882 |
| 97. | 40935 | 13.6% | 6.1%(+7.50)#97 | 4.9%(+8.70)#1,890 |
| 98. | 41844 | 13.6% | 6.1%(+7.50)#98 | 4.9%(+8.70)#1,893 |
| 99. | 42553 | 13.4% | 6.1%(+7.30)#99 | 4.9%(+8.50)#1,948 |
| 100. | 41615 | 13.4% | 6.1%(+7.30)#100 | 4.9%(+8.50)#1,960 |
Common Questions
What are the Top 10 Zip Codes with the Highest Percentage of Households with Income Below $10,000 in Kentucky?
Top 10 Zip Codes with the Highest Percentage of Households with Income Below $10,000 in Kentucky are:
What zip code has the Highest Percentage of Households with Income Below $10,000 in Kentucky?
42037 has the Highest Percentage of Households with Income Below $10,000 in Kentucky with 100.0%.
What is the Percentage of Households with Income Below $10,000 in the State of Kentucky?
Percentage of Households with Income Below $10,000 in Kentucky is 6.1%.
What is the Percentage of Households with Income Below $10,000 in the United States?
Percentage of Households with Income Below $10,000 in the United States is 4.9%.