Zip Codes with the Highest Percentage of Households with Income Above $200,000 in Omaha, NE

RELATED REPORTS & OPTIONS

Household Income | $200k+
Population
Families and Households
Female Fertility
Female Fertility (Unmarried)
Race (Community Size)
Race (Percentage)
Ancestry (Community Size)
AfghanAfricanAlbanianAleutAmericanApacheArabArapahoArgentineanArmenianAustralianAustrianBangladeshiBasqueBelgianBhutaneseBlackfeetBolivianBrazilianBritishBulgarianBurmeseCajunCambodianCanadianCarpatho RusynCentral AmericanCentral American IndianCherokeeChickasawChileanChineseChippewaChoctawColombianComancheCosta RicanCreekCroatianCubanCzechCzechoslovakianDanishDominicanDutchEastern EuropeanEcuadorianEgyptianEnglishEthiopianEuropeanFilipinoFinnishFrenchFrench American IndianFrench CanadianGermanGerman RussianGhanaianGreekGuamanian / ChamorroGuatemalanGuyaneseHaitianHonduranHungarianIcelanderIndian (Asian)IndonesianInupiatIranianIraqiIrishIroquoisIsraeliItalianJamaicanJapaneseJordanianKenyanKiowaKoreanLaotianLatvianLebaneseLithuanianLuxembourgerMacedonianMalaysianMexicanMexican American IndianMoroccanNative HawaiianNavajoNicaraguanNigerianNorthern EuropeanNorwegianPakistaniPalestinianPanamanianPennsylvania GermanPeruvianPolishPortuguesePotawatomiPuebloPuerto RicanRomanianRussianSalvadoranSamoanScandinavianScotch-IrishScottishSeminoleSerbianSiouxSlavicSlovakSloveneSomaliSouth AfricanSouth AmericanSpaniardSpanishSri LankanSubsaharan AfricanSudaneseSwedishSwissSyrianThaiTlingit-HaidaTrinidadian and TobagonianTurkishUkrainianVenezuelanVietnameseWelshWest IndianYugoslavianZimbabwean
Ancestry (Percentage)
AfghanAfricanAlbanianAleutAmericanApacheArabArapahoArgentineanArmenianAustralianAustrianBangladeshiBasqueBelgianBhutaneseBlackfeetBolivianBrazilianBritishBulgarianBurmeseCajunCambodianCanadianCarpatho RusynCentral AmericanCentral American IndianCherokeeChickasawChileanChineseChippewaChoctawColombianComancheCosta RicanCreekCroatianCubanCzechCzechoslovakianDanishDominicanDutchEastern EuropeanEcuadorianEgyptianEnglishEthiopianEuropeanFilipinoFinnishFrenchFrench American IndianFrench CanadianGermanGerman RussianGhanaianGreekGuamanian / ChamorroGuatemalanGuyaneseHaitianHonduranHungarianIcelanderIndian (Asian)IndonesianInupiatIranianIraqiIrishIroquoisIsraeliItalianJamaicanJapaneseJordanianKenyanKiowaKoreanLaotianLatvianLebaneseLithuanianLuxembourgerMacedonianMalaysianMexicanMexican American IndianMoroccanNative HawaiianNavajoNicaraguanNigerianNorthern EuropeanNorwegianPakistaniPalestinianPanamanianPennsylvania GermanPeruvianPolishPortuguesePotawatomiPuebloPuerto RicanRomanianRussianSalvadoranSamoanScandinavianScotch-IrishScottishSeminoleSerbianSiouxSlavicSlovakSloveneSomaliSouth AfricanSouth AmericanSpaniardSpanishSri LankanSubsaharan AfricanSudaneseSwedishSwissSyrianThaiTlingit-HaidaTrinidadian and TobagonianTurkishUkrainianVenezuelanVietnameseWelshWest IndianYugoslavianZimbabwean
Immigrant Origin (Total)
AfghanistanAfricaArgentinaAsiaAustraliaBangladeshBarbadosBelarusBosnia and HerzegovinaBrazilBurma / MyanmarCameroonCanadaCaribbeanCentral AmericaChileChinaColombiaCongoCosta RicaCroatiaCubaCzechoslovakiaDominican RepublicEastern AfricaEastern AsiaEastern EuropeEgyptEl SalvadorEnglandEthiopiaEuropeFranceGermanyGhanaGreeceGuatemalaHondurasHong KongHungaryIndiaIndonesiaIranIraqIrelandIsraelItalyJamaicaJapanJordanKazakhstanKenyaKoreaKuwaitLaosLatin AmericaLatviaLithuaniaMalaysiaMexicoMiddle AfricaMoroccoNepalNetherlandsNicaraguaNigeriaNorthern AfricaNorthern EuropeOceaniaPakistanPanamaPeruPhilippinesPolandPortugalRomaniaRussiaSaudi ArabiaScotlandSierra LeoneSomaliaSouth AfricaSouth AmericaSouth Central AsiaSouth Eastern AsiaSouthern EuropeSpainSri LankaSudanSyriaTaiwanThailandTrinidad and TobagoTurkeyUgandaUkraineVenezuelaVietnamWestern AfricaWestern AsiaWestern EuropeZaireZimbabwe
Immigrant Origin (Percentage)
AfghanistanAfricaArgentinaAsiaAustraliaBangladeshBarbadosBelarusBosnia and HerzegovinaBrazilBurma / MyanmarCameroonCanadaCaribbeanCentral AmericaChileChinaColombiaCongoCosta RicaCroatiaCubaCzechoslovakiaDominican RepublicEastern AfricaEastern AsiaEastern EuropeEgyptEl SalvadorEnglandEthiopiaEuropeFranceGermanyGhanaGreeceGuatemalaHondurasHong KongHungaryIndiaIndonesiaIranIraqIrelandIsraelItalyJamaicaJapanJordanKazakhstanKenyaKoreaKuwaitLaosLatin AmericaLatviaLithuaniaMalaysiaMexicoMiddle AfricaMoroccoNepalNetherlandsNicaraguaNigeriaNorthern AfricaNorthern EuropeOceaniaPakistanPanamaPeruPhilippinesPolandPortugalRomaniaRussiaSaudi ArabiaScotlandSierra LeoneSomaliaSouth AfricaSouth AmericaSouth Central AsiaSouth Eastern AsiaSouthern EuropeSpainSri LankaSudanSyriaTaiwanThailandTrinidad and TobagoTurkeyUgandaUkraineVenezuelaVietnamWestern AfricaWestern AsiaWestern EuropeZaireZimbabwe
Income
Income (Families)
Income (Households)
Poverty
Poverty (Families)
Unemployment
Employment Occupations
Employment Industries
Employer Class
Commute Time
Commute Means
School Enrollment
Education by Degree Field
Occupancy
Finances
Physical Characteristics
Omaha
Compare Zip Codes
Comparison Subject

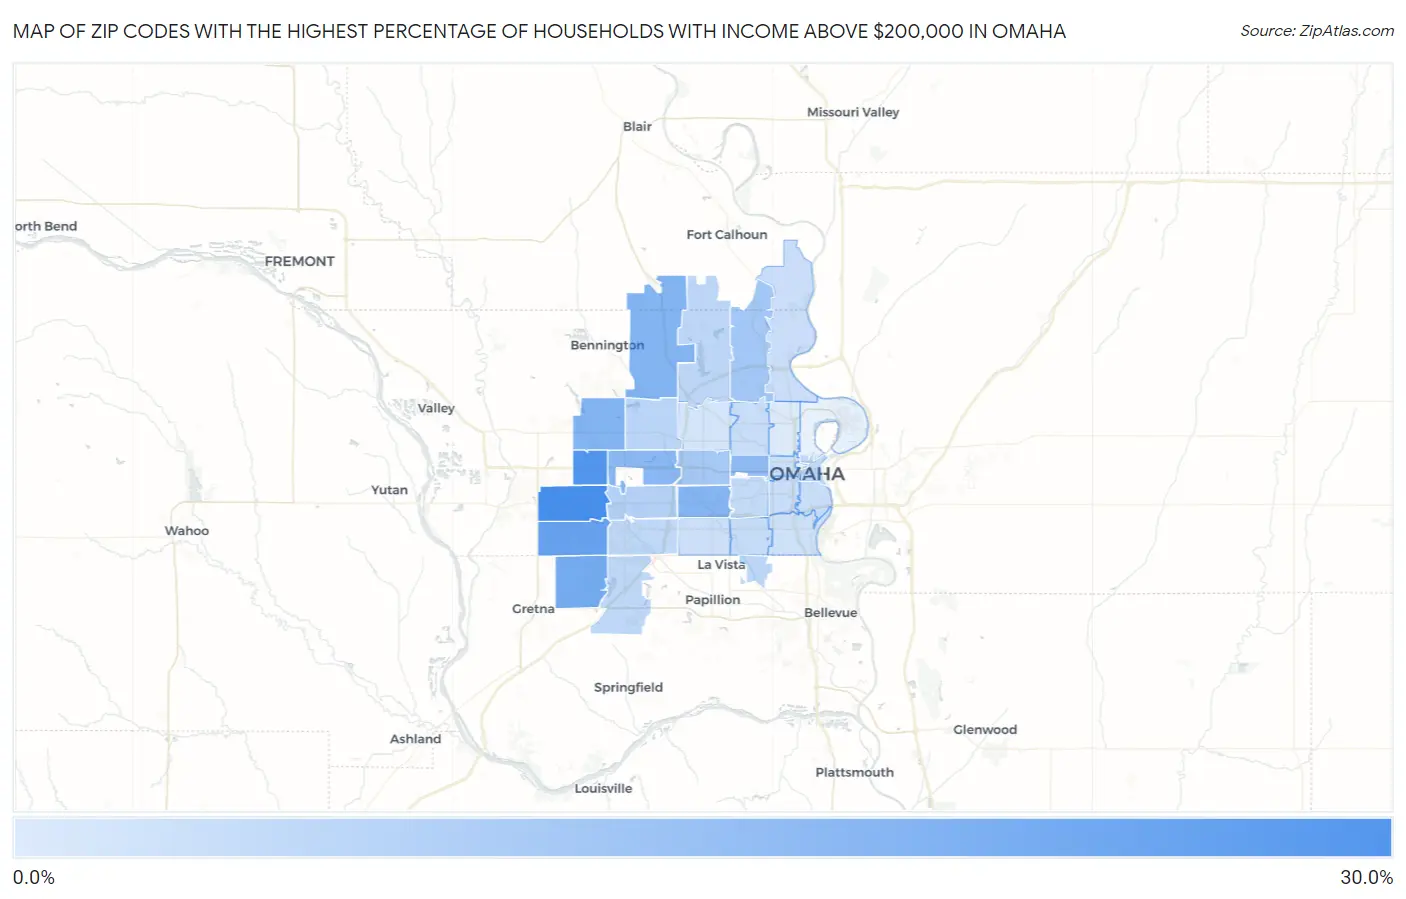
Map of Zip Codes with the Highest Percentage of Households with Income Above $200,000 in Omaha

0.0%
30.0%
Zip Codes with the Highest Percentage of Households with Income Above $200,000 in Omaha Map

Zip Codes with the Highest Percentage of Households with Income Above $200,000 in Omaha, NE

Zip Code Households with Income > $200k vs State vs National
1.6813029.8%7.8%(+22.0)#411.4%(+18.4)#1,484
2.6811827.1%7.8%(+19.3)#911.4%(+15.7)#1,864
3.6813522.8%7.8%(+15.0)#1711.4%(+11.4)#2,599
4.6813620.1%7.8%(+12.3)#2511.4%(+8.70)#3,255
5.6811617.3%7.8%(+9.50)#3111.4%(+5.90)#4,065
6.6814217.1%7.8%(+9.30)#3311.4%(+5.70)#4,162
7.6812416.7%7.8%(+8.90)#3611.4%(+5.30)#4,293
8.6815415.8%7.8%(+8.00)#4211.4%(+4.40)#4,647
9.6813215.2%7.8%(+7.40)#4611.4%(+3.80)#4,896
10.6815211.2%7.8%(+3.40)#7311.4%(-0.200)#7,249
11.6811410.5%7.8%(+2.70)#8211.4%(-0.900)#7,790
12.681448.2%7.8%(+0.400)#10711.4%(-3.20)#10,114
13.681646.6%7.8%(-1.20)#15811.4%(-4.80)#12,406
14.681226.3%7.8%(-1.50)#17111.4%(-5.10)#12,940
15.681576.3%7.8%(-1.50)#17211.4%(-5.10)#12,956
16.681026.0%7.8%(-1.80)#18311.4%(-5.40)#13,499
17.681375.8%7.8%(-2.00)#19411.4%(-5.60)#13,850
18.681385.8%7.8%(-2.00)#19511.4%(-5.60)#13,879
19.681065.3%7.8%(-2.50)#22111.4%(-6.10)#14,892
20.681174.7%7.8%(-3.10)#25411.4%(-6.70)#16,344
21.681084.5%7.8%(-3.30)#26711.4%(-6.90)#16,807
22.681044.2%7.8%(-3.60)#28611.4%(-7.20)#17,545
23.681054.1%7.8%(-3.70)#29011.4%(-7.30)#17,841
24.681123.9%7.8%(-3.90)#30411.4%(-7.50)#18,389
25.681273.5%7.8%(-4.30)#33511.4%(-7.90)#19,459
26.681313.3%7.8%(-4.50)#34611.4%(-8.10)#20,055
27.681073.0%7.8%(-4.80)#35711.4%(-8.40)#20,888
28.681342.3%7.8%(-5.50)#39411.4%(-9.10)#22,900
29.681110.70%7.8%(-7.10)#47311.4%(-10.7)#26,733

Common Questions

What are the Top 10 Zip Codes with the Highest Percentage of Households with Income Above $200,000 in Omaha, NE?
Top 10 Zip Codes with the Highest Percentage of Households with Income Above $200,000 in Omaha, NE are:
#1
29.8%
#2
27.1%
#3
22.8%
#4
20.1%
#5
17.3%
#6
17.1%
#7
16.7%
#8
15.8%
#9
15.2%
#10
11.2%
What zip code has the Highest Percentage of Households with Income Above $200,000 in Omaha, NE?
68130 has the Highest Percentage of Households with Income Above $200,000 in Omaha, NE with 29.8%.
What is the Percentage of Households with Income Above $200,000 in Omaha, NE?
Percentage of Households with Income Above $200,000 in Omaha is 8.8%.
What is the Percentage of Households with Income Above $200,000 in Nebraska?
Percentage of Households with Income Above $200,000 in Nebraska is 7.8%.
What is the Percentage of Households with Income Above $200,000 in the United States?
Percentage of Households with Income Above $200,000 in the United States is 11.4%.