Zip Codes with the Highest Percentage of Households with Income Below $10,000 in District Of Columbia
RELATED REPORTS & OPTIONS
Household Income | $0-10k
District Of Columbia
Compare Zip Codes
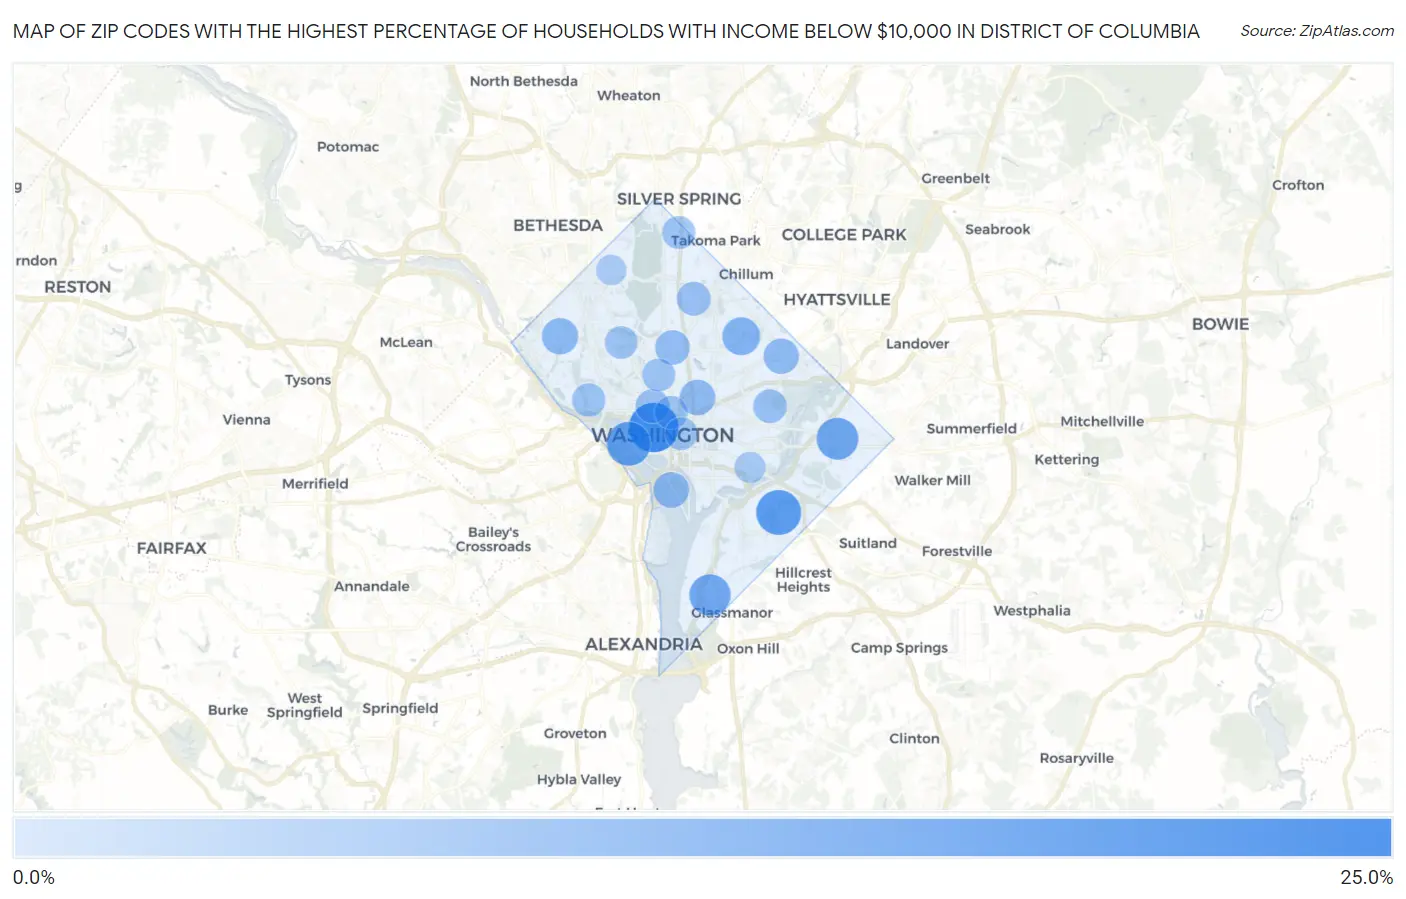
Map of Zip Codes with the Highest Percentage of Households with Income Below $10,000 in District Of Columbia
0.0%
25.0%
Zip Codes with the Highest Percentage of Households with Income Below $10,000 in District Of Columbia
| Zip Code | Households with Income < $10k | vs State | vs National | |
| 1. | 20006 | 20.3% | 7.4%(+12.9)#1 | 4.9%(+15.4)#774 |
| 2. | 20020 | 15.8% | 7.4%(+8.40)#2 | 4.9%(+10.9)#1,373 |
| 3. | 20037 | 14.7% | 7.4%(+7.30)#3 | 4.9%(+9.80)#1,593 |
| 4. | 20019 | 12.8% | 7.4%(+5.40)#4 | 4.9%(+7.90)#2,151 |
| 5. | 20032 | 12.4% | 7.4%(+5.00)#5 | 4.9%(+7.50)#2,291 |
| 6. | 20017 | 9.0% | 7.4%(+1.60)#6 | 4.9%(+4.10)#4,410 |
| 7. | 20016 | 7.6% | 7.4%(+0.200)#7 | 4.9%(+2.70)#6,062 |
| 8. | 20001 | 7.0% | 7.4%(-0.400)#8 | 4.9%(+2.10)#6,946 |
| 9. | 20024 | 7.0% | 7.4%(-0.400)#9 | 4.9%(+2.10)#6,983 |
| 10. | 20018 | 6.7% | 7.4%(-0.700)#10 | 4.9%(+1.80)#7,549 |
| 11. | 20010 | 6.0% | 7.4%(-1.40)#11 | 4.9%(+1.10)#8,986 |
| 12. | 20036 | 5.4% | 7.4%(-2.00)#12 | 4.9%(+0.500)#10,579 |
| 13. | 20011 | 5.3% | 7.4%(-2.10)#13 | 4.9%(+0.400)#10,709 |
| 14. | 20002 | 5.1% | 7.4%(-2.30)#14 | 4.9%(+0.200)#11,320 |
| 15. | 20007 | 4.8% | 7.4%(-2.60)#15 | 4.9%(-0.100)#12,343 |
| 16. | 20005 | 4.7% | 7.4%(-2.70)#16 | 4.9%(-0.200)#12,735 |
| 17. | 20009 | 4.5% | 7.4%(-2.90)#17 | 4.9%(-0.400)#13,319 |
| 18. | 20012 | 4.5% | 7.4%(-2.90)#18 | 4.9%(-0.400)#13,408 |
| 19. | 20008 | 4.2% | 7.4%(-3.20)#19 | 4.9%(-0.700)#14,493 |
| 20. | 20004 | 4.1% | 7.4%(-3.30)#20 | 4.9%(-0.800)#15,091 |
| 21. | 20003 | 2.7% | 7.4%(-4.70)#21 | 4.9%(-2.20)#20,689 |
| 22. | 20015 | 2.1% | 7.4%(-5.30)#22 | 4.9%(-2.80)#23,293 |
1
Common Questions
What are the Top 10 Zip Codes with the Highest Percentage of Households with Income Below $10,000 in District Of Columbia?
Top 10 Zip Codes with the Highest Percentage of Households with Income Below $10,000 in District Of Columbia are:
What zip code has the Highest Percentage of Households with Income Below $10,000 in District Of Columbia?
20006 has the Highest Percentage of Households with Income Below $10,000 in District Of Columbia with 20.3%.
What is the Percentage of Households with Income Below $10,000 in the State of District Of Columbia?
Percentage of Households with Income Below $10,000 in District Of Columbia is 7.4%.
What is the Percentage of Households with Income Below $10,000 in the United States?
Percentage of Households with Income Below $10,000 in the United States is 4.9%.