Zip Codes with the Highest Percentage of Population Employed in Education Instruction & Library in Omaha, NE

RELATED REPORTS & OPTIONS

Education Instruction & Library
Population
Families and Households
Female Fertility
Female Fertility (Unmarried)
Race (Community Size)
Race (Percentage)
Ancestry (Community Size)
AfghanAfricanAlbanianAleutAmericanApacheArabArapahoArgentineanArmenianAustralianAustrianBangladeshiBasqueBelgianBhutaneseBlackfeetBolivianBrazilianBritishBulgarianBurmeseCajunCambodianCanadianCarpatho RusynCentral AmericanCentral American IndianCherokeeChickasawChileanChineseChippewaChoctawColombianComancheCosta RicanCreekCroatianCubanCzechCzechoslovakianDanishDominicanDutchEastern EuropeanEcuadorianEgyptianEnglishEthiopianEuropeanFilipinoFinnishFrenchFrench American IndianFrench CanadianGermanGerman RussianGhanaianGreekGuamanian / ChamorroGuatemalanGuyaneseHaitianHonduranHungarianIcelanderIndian (Asian)IndonesianInupiatIranianIraqiIrishIroquoisIsraeliItalianJamaicanJapaneseJordanianKenyanKiowaKoreanLaotianLatvianLebaneseLithuanianLuxembourgerMacedonianMalaysianMexicanMexican American IndianMoroccanNative HawaiianNavajoNicaraguanNigerianNorthern EuropeanNorwegianPakistaniPalestinianPanamanianPennsylvania GermanPeruvianPolishPortuguesePotawatomiPuebloPuerto RicanRomanianRussianSalvadoranSamoanScandinavianScotch-IrishScottishSeminoleSerbianSiouxSlavicSlovakSloveneSomaliSouth AfricanSouth AmericanSpaniardSpanishSri LankanSubsaharan AfricanSudaneseSwedishSwissSyrianThaiTlingit-HaidaTrinidadian and TobagonianTurkishUkrainianVenezuelanVietnameseWelshWest IndianYugoslavianZimbabwean
Ancestry (Percentage)
AfghanAfricanAlbanianAleutAmericanApacheArabArapahoArgentineanArmenianAustralianAustrianBangladeshiBasqueBelgianBhutaneseBlackfeetBolivianBrazilianBritishBulgarianBurmeseCajunCambodianCanadianCarpatho RusynCentral AmericanCentral American IndianCherokeeChickasawChileanChineseChippewaChoctawColombianComancheCosta RicanCreekCroatianCubanCzechCzechoslovakianDanishDominicanDutchEastern EuropeanEcuadorianEgyptianEnglishEthiopianEuropeanFilipinoFinnishFrenchFrench American IndianFrench CanadianGermanGerman RussianGhanaianGreekGuamanian / ChamorroGuatemalanGuyaneseHaitianHonduranHungarianIcelanderIndian (Asian)IndonesianInupiatIranianIraqiIrishIroquoisIsraeliItalianJamaicanJapaneseJordanianKenyanKiowaKoreanLaotianLatvianLebaneseLithuanianLuxembourgerMacedonianMalaysianMexicanMexican American IndianMoroccanNative HawaiianNavajoNicaraguanNigerianNorthern EuropeanNorwegianPakistaniPalestinianPanamanianPennsylvania GermanPeruvianPolishPortuguesePotawatomiPuebloPuerto RicanRomanianRussianSalvadoranSamoanScandinavianScotch-IrishScottishSeminoleSerbianSiouxSlavicSlovakSloveneSomaliSouth AfricanSouth AmericanSpaniardSpanishSri LankanSubsaharan AfricanSudaneseSwedishSwissSyrianThaiTlingit-HaidaTrinidadian and TobagonianTurkishUkrainianVenezuelanVietnameseWelshWest IndianYugoslavianZimbabwean
Immigrant Origin (Total)
AfghanistanAfricaArgentinaAsiaAustraliaBangladeshBarbadosBelarusBosnia and HerzegovinaBrazilBurma / MyanmarCameroonCanadaCaribbeanCentral AmericaChileChinaColombiaCongoCosta RicaCroatiaCubaCzechoslovakiaDominican RepublicEastern AfricaEastern AsiaEastern EuropeEgyptEl SalvadorEnglandEthiopiaEuropeFranceGermanyGhanaGreeceGuatemalaHondurasHong KongHungaryIndiaIndonesiaIranIraqIrelandIsraelItalyJamaicaJapanJordanKazakhstanKenyaKoreaKuwaitLaosLatin AmericaLatviaLithuaniaMalaysiaMexicoMiddle AfricaMoroccoNepalNetherlandsNicaraguaNigeriaNorthern AfricaNorthern EuropeOceaniaPakistanPanamaPeruPhilippinesPolandPortugalRomaniaRussiaSaudi ArabiaScotlandSierra LeoneSomaliaSouth AfricaSouth AmericaSouth Central AsiaSouth Eastern AsiaSouthern EuropeSpainSri LankaSudanSyriaTaiwanThailandTrinidad and TobagoTurkeyUgandaUkraineVenezuelaVietnamWestern AfricaWestern AsiaWestern EuropeZaireZimbabwe
Immigrant Origin (Percentage)
AfghanistanAfricaArgentinaAsiaAustraliaBangladeshBarbadosBelarusBosnia and HerzegovinaBrazilBurma / MyanmarCameroonCanadaCaribbeanCentral AmericaChileChinaColombiaCongoCosta RicaCroatiaCubaCzechoslovakiaDominican RepublicEastern AfricaEastern AsiaEastern EuropeEgyptEl SalvadorEnglandEthiopiaEuropeFranceGermanyGhanaGreeceGuatemalaHondurasHong KongHungaryIndiaIndonesiaIranIraqIrelandIsraelItalyJamaicaJapanJordanKazakhstanKenyaKoreaKuwaitLaosLatin AmericaLatviaLithuaniaMalaysiaMexicoMiddle AfricaMoroccoNepalNetherlandsNicaraguaNigeriaNorthern AfricaNorthern EuropeOceaniaPakistanPanamaPeruPhilippinesPolandPortugalRomaniaRussiaSaudi ArabiaScotlandSierra LeoneSomaliaSouth AfricaSouth AmericaSouth Central AsiaSouth Eastern AsiaSouthern EuropeSpainSri LankaSudanSyriaTaiwanThailandTrinidad and TobagoTurkeyUgandaUkraineVenezuelaVietnamWestern AfricaWestern AsiaWestern EuropeZaireZimbabwe
Income
Income (Families)
Income (Households)
Poverty
Poverty (Families)
Unemployment
Employment Occupations
Employment Industries
Employer Class
Commute Time
Commute Means
School Enrollment
Education by Degree Field
Occupancy
Finances
Physical Characteristics
Omaha
Compare Zip Codes
Comparison Subject

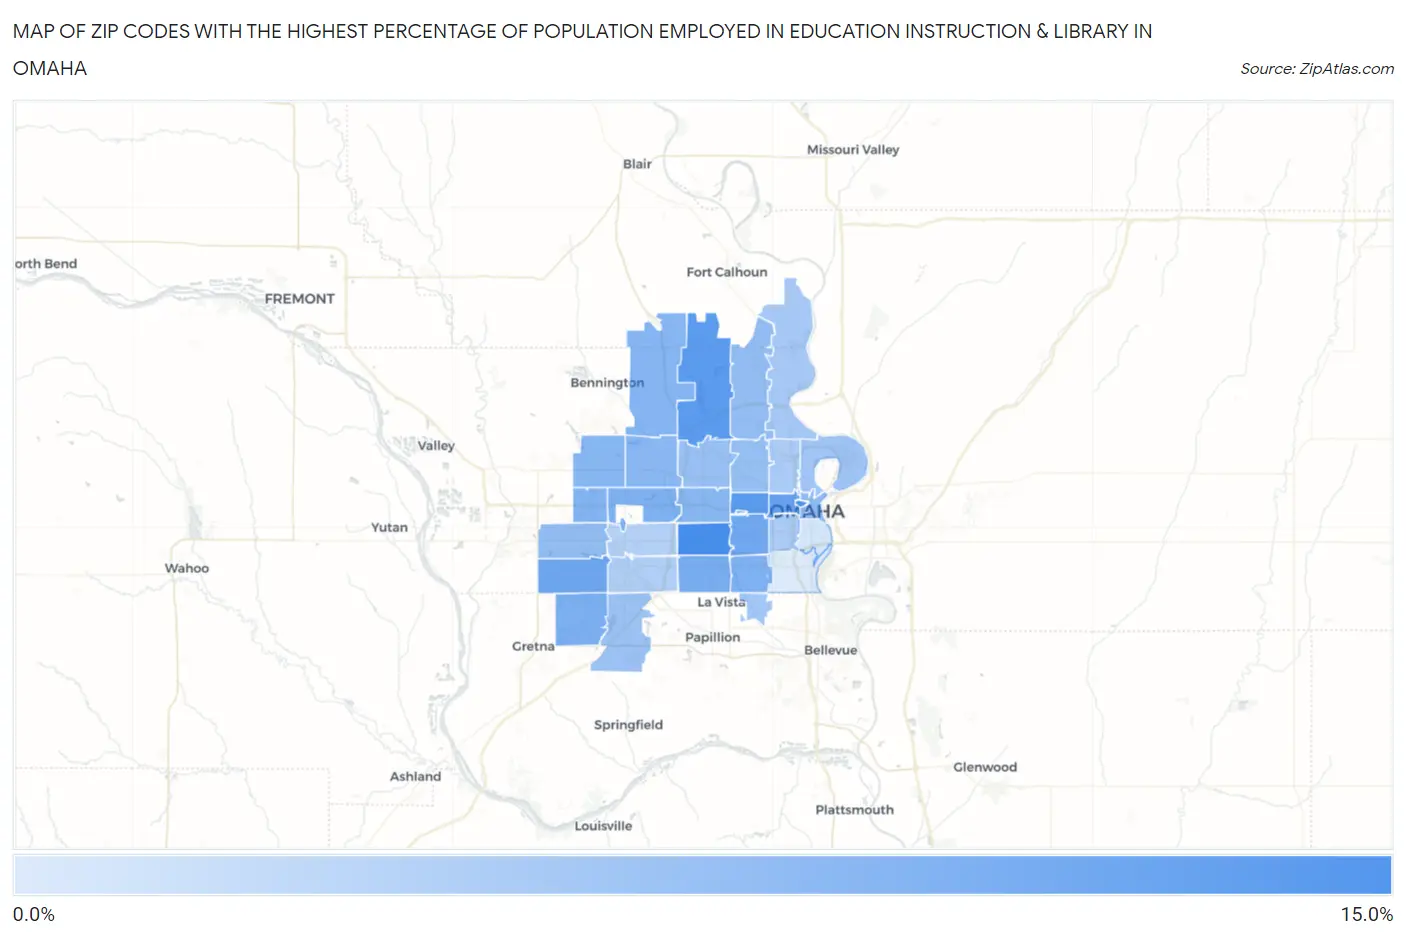
Map of Zip Codes with the Highest Percentage of Population Employed in Education Instruction & Library in Omaha

0.0%
15.0%
Zip Codes with the Highest Percentage of Population Employed in Education Instruction & Library in Omaha Map

Zip Codes with the Highest Percentage of Population Employed in Education Instruction & Library in Omaha, NE

Zip Code % Employed vs State vs National
1.6812410.2%6.9%(+3.30)#776.2%(+4.04)#3,708
2.681789.8%6.9%(+2.89)#886.2%(+3.63)#4,163
3.681329.2%6.9%(+2.26)#1146.2%(+3.00)#4,954
4.681229.2%6.9%(+2.23)#1176.2%(+2.98)#4,993
5.681318.5%6.9%(+1.61)#1396.2%(+2.35)#6,030
6.681828.2%6.9%(+1.32)#1496.2%(+2.06)#6,626
7.681358.2%6.9%(+1.25)#1516.2%(+1.99)#6,781
8.681068.0%6.9%(+1.12)#1576.2%(+1.86)#7,061
9.681277.6%6.9%(+0.685)#1786.2%(+1.43)#8,153
10.681367.3%6.9%(+0.426)#1926.2%(+1.17)#8,848
11.681547.3%6.9%(+0.372)#2016.2%(+1.11)#9,006
12.681177.3%6.9%(+0.345)#2056.2%(+1.09)#9,095
13.681187.0%6.9%(+0.078)#2216.2%(+0.818)#9,897
14.681426.9%6.9%(+0.005)#2246.2%(+0.746)#10,139
15.681166.8%6.9%(-0.123)#2366.2%(+0.618)#10,572
16.681146.7%6.9%(-0.175)#2426.2%(+0.565)#10,736
17.681646.7%6.9%(-0.232)#2456.2%(+0.509)#10,930
18.681026.4%6.9%(-0.549)#2676.2%(+0.192)#12,080
19.681526.2%6.9%(-0.707)#2796.2%(+0.034)#12,705
20.681306.1%6.9%(-0.776)#2816.2%(-0.036)#12,953
21.681046.0%6.9%(-0.892)#2886.2%(-0.151)#13,363
22.681345.9%6.9%(-0.977)#2946.2%(-0.237)#13,713
23.681385.8%6.9%(-1.09)#3036.2%(-0.354)#14,199
24.681105.4%6.9%(-1.50)#3316.2%(-0.759)#15,882
25.681575.4%6.9%(-1.56)#3366.2%(-0.816)#16,120
26.681125.3%6.9%(-1.66)#3396.2%(-0.915)#16,513
27.681055.1%6.9%(-1.87)#3526.2%(-1.13)#17,415
28.681115.0%6.9%(-1.91)#3546.2%(-1.17)#17,583
29.681374.6%6.9%(-2.30)#3786.2%(-1.56)#19,227
30.681444.6%6.9%(-2.35)#3806.2%(-1.61)#19,438
31.681082.9%6.9%(-4.04)#4476.2%(-3.30)#25,112
32.681072.4%6.9%(-4.49)#4706.2%(-3.75)#26,155

Common Questions

What are the Top 10 Zip Codes with the Highest Percentage of Population Employed in Education Instruction & Library in Omaha, NE?
Top 10 Zip Codes with the Highest Percentage of Population Employed in Education Instruction & Library in Omaha, NE are:
#1
10.2%
#2
9.8%
#3
9.2%
#4
9.2%
#5
8.5%
#6
8.2%
#7
8.2%
#8
8.0%
#9
7.6%
#10
7.3%
What zip code has the Highest Percentage of Population Employed in Education Instruction & Library in Omaha, NE?
68124 has the Highest Percentage of Population Employed in Education Instruction & Library in Omaha, NE with 10.2%.
What is the Percentage of Population Employed in Education Instruction & Library in Omaha, NE?
Percentage of Population Employed in Education Instruction & Library in Omaha is 6.4%.
What is the Percentage of Population Employed in Education Instruction & Library in Nebraska?
Percentage of Population Employed in Education Instruction & Library in Nebraska is 6.9%.
What is the Percentage of Population Employed in Education Instruction & Library in the United States?
Percentage of Population Employed in Education Instruction & Library in the United States is 6.2%.