Zip Codes with the Highest Percentage of Population with a Degree in Physical and Health Sciences in Omaha, NE

RELATED REPORTS & OPTIONS

Physical and Health Sciences
Population
Families and Households
Female Fertility
Female Fertility (Unmarried)
Race (Community Size)
Race (Percentage)
Ancestry (Community Size)
AfghanAfricanAlbanianAleutAmericanApacheArabArapahoArgentineanArmenianAustralianAustrianBangladeshiBasqueBelgianBhutaneseBlackfeetBolivianBrazilianBritishBulgarianBurmeseCajunCambodianCanadianCarpatho RusynCentral AmericanCentral American IndianCherokeeChickasawChileanChineseChippewaChoctawColombianComancheCosta RicanCreekCroatianCubanCzechCzechoslovakianDanishDominicanDutchEastern EuropeanEcuadorianEgyptianEnglishEthiopianEuropeanFilipinoFinnishFrenchFrench American IndianFrench CanadianGermanGerman RussianGhanaianGreekGuamanian / ChamorroGuatemalanGuyaneseHaitianHonduranHungarianIcelanderIndian (Asian)IndonesianInupiatIranianIraqiIrishIroquoisIsraeliItalianJamaicanJapaneseJordanianKenyanKiowaKoreanLaotianLatvianLebaneseLithuanianLuxembourgerMacedonianMalaysianMexicanMexican American IndianMoroccanNative HawaiianNavajoNicaraguanNigerianNorthern EuropeanNorwegianPakistaniPalestinianPanamanianPennsylvania GermanPeruvianPolishPortuguesePotawatomiPuebloPuerto RicanRomanianRussianSalvadoranSamoanScandinavianScotch-IrishScottishSeminoleSerbianSiouxSlavicSlovakSloveneSomaliSouth AfricanSouth AmericanSpaniardSpanishSri LankanSubsaharan AfricanSudaneseSwedishSwissSyrianThaiTlingit-HaidaTrinidadian and TobagonianTurkishUkrainianVenezuelanVietnameseWelshWest IndianYugoslavianZimbabwean
Ancestry (Percentage)
AfghanAfricanAlbanianAleutAmericanApacheArabArapahoArgentineanArmenianAustralianAustrianBangladeshiBasqueBelgianBhutaneseBlackfeetBolivianBrazilianBritishBulgarianBurmeseCajunCambodianCanadianCarpatho RusynCentral AmericanCentral American IndianCherokeeChickasawChileanChineseChippewaChoctawColombianComancheCosta RicanCreekCroatianCubanCzechCzechoslovakianDanishDominicanDutchEastern EuropeanEcuadorianEgyptianEnglishEthiopianEuropeanFilipinoFinnishFrenchFrench American IndianFrench CanadianGermanGerman RussianGhanaianGreekGuamanian / ChamorroGuatemalanGuyaneseHaitianHonduranHungarianIcelanderIndian (Asian)IndonesianInupiatIranianIraqiIrishIroquoisIsraeliItalianJamaicanJapaneseJordanianKenyanKiowaKoreanLaotianLatvianLebaneseLithuanianLuxembourgerMacedonianMalaysianMexicanMexican American IndianMoroccanNative HawaiianNavajoNicaraguanNigerianNorthern EuropeanNorwegianPakistaniPalestinianPanamanianPennsylvania GermanPeruvianPolishPortuguesePotawatomiPuebloPuerto RicanRomanianRussianSalvadoranSamoanScandinavianScotch-IrishScottishSeminoleSerbianSiouxSlavicSlovakSloveneSomaliSouth AfricanSouth AmericanSpaniardSpanishSri LankanSubsaharan AfricanSudaneseSwedishSwissSyrianThaiTlingit-HaidaTrinidadian and TobagonianTurkishUkrainianVenezuelanVietnameseWelshWest IndianYugoslavianZimbabwean
Immigrant Origin (Total)
AfghanistanAfricaArgentinaAsiaAustraliaBangladeshBarbadosBelarusBosnia and HerzegovinaBrazilBurma / MyanmarCameroonCanadaCaribbeanCentral AmericaChileChinaColombiaCongoCosta RicaCroatiaCubaCzechoslovakiaDominican RepublicEastern AfricaEastern AsiaEastern EuropeEgyptEl SalvadorEnglandEthiopiaEuropeFranceGermanyGhanaGreeceGuatemalaHondurasHong KongHungaryIndiaIndonesiaIranIraqIrelandIsraelItalyJamaicaJapanJordanKazakhstanKenyaKoreaKuwaitLaosLatin AmericaLatviaLithuaniaMalaysiaMexicoMiddle AfricaMoroccoNepalNetherlandsNicaraguaNigeriaNorthern AfricaNorthern EuropeOceaniaPakistanPanamaPeruPhilippinesPolandPortugalRomaniaRussiaSaudi ArabiaScotlandSierra LeoneSomaliaSouth AfricaSouth AmericaSouth Central AsiaSouth Eastern AsiaSouthern EuropeSpainSri LankaSudanSyriaTaiwanThailandTrinidad and TobagoTurkeyUgandaUkraineVenezuelaVietnamWestern AfricaWestern AsiaWestern EuropeZaireZimbabwe
Immigrant Origin (Percentage)
AfghanistanAfricaArgentinaAsiaAustraliaBangladeshBarbadosBelarusBosnia and HerzegovinaBrazilBurma / MyanmarCameroonCanadaCaribbeanCentral AmericaChileChinaColombiaCongoCosta RicaCroatiaCubaCzechoslovakiaDominican RepublicEastern AfricaEastern AsiaEastern EuropeEgyptEl SalvadorEnglandEthiopiaEuropeFranceGermanyGhanaGreeceGuatemalaHondurasHong KongHungaryIndiaIndonesiaIranIraqIrelandIsraelItalyJamaicaJapanJordanKazakhstanKenyaKoreaKuwaitLaosLatin AmericaLatviaLithuaniaMalaysiaMexicoMiddle AfricaMoroccoNepalNetherlandsNicaraguaNigeriaNorthern AfricaNorthern EuropeOceaniaPakistanPanamaPeruPhilippinesPolandPortugalRomaniaRussiaSaudi ArabiaScotlandSierra LeoneSomaliaSouth AfricaSouth AmericaSouth Central AsiaSouth Eastern AsiaSouthern EuropeSpainSri LankaSudanSyriaTaiwanThailandTrinidad and TobagoTurkeyUgandaUkraineVenezuelaVietnamWestern AfricaWestern AsiaWestern EuropeZaireZimbabwe
Income
Income (Families)
Income (Households)
Poverty
Poverty (Families)
Unemployment
Employment Occupations
Employment Industries
Employer Class
Commute Time
Commute Means
School Enrollment
Education by Degree Field
Occupancy
Finances
Physical Characteristics
Omaha
Compare Zip Codes
Comparison Subject

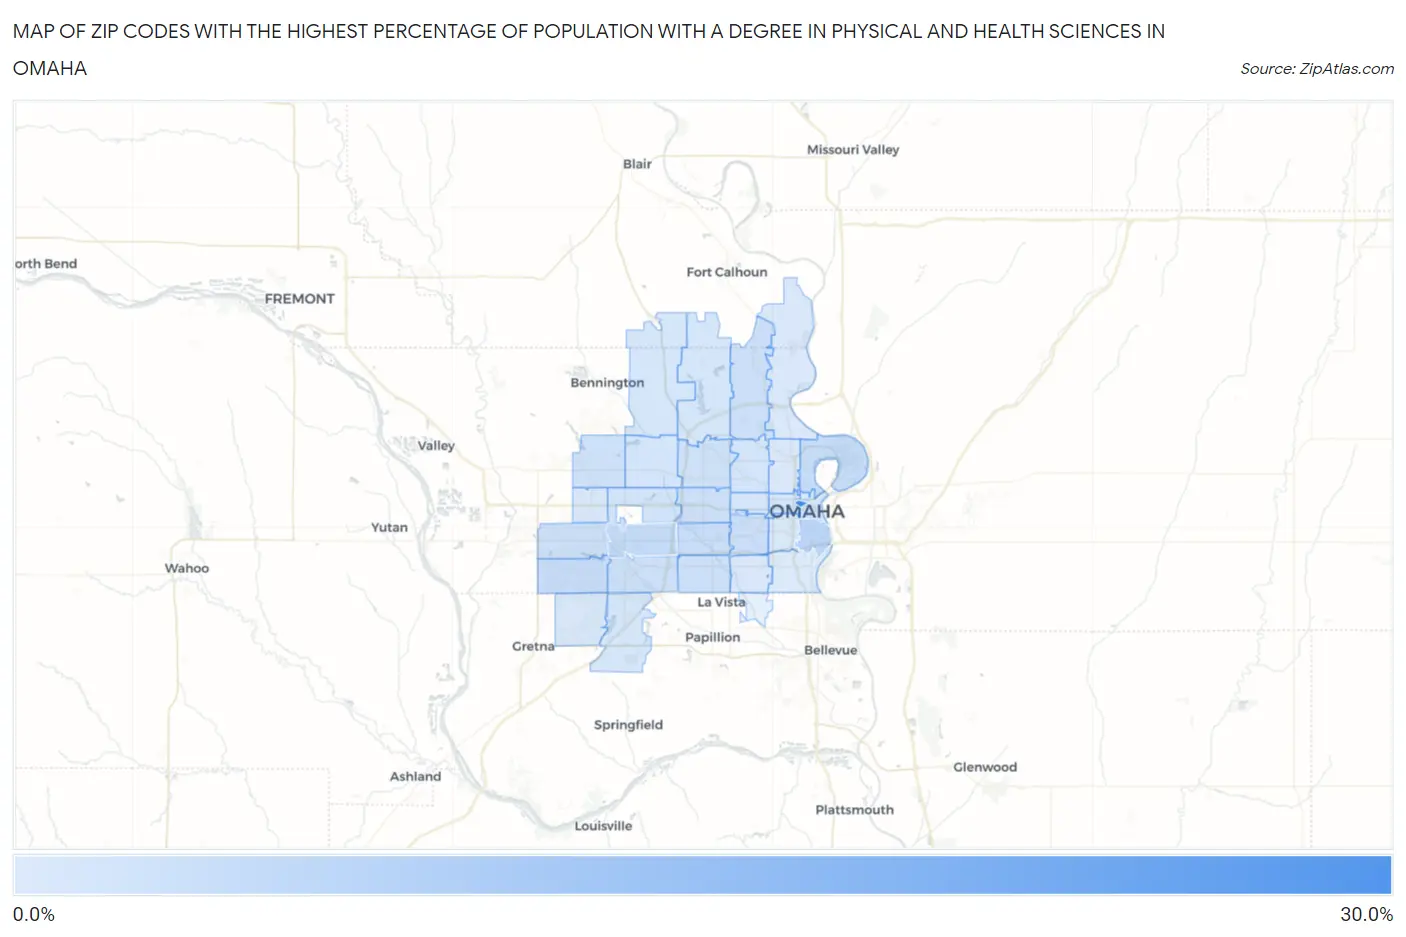
Map of Zip Codes with the Highest Percentage of Population with a Degree in Physical and Health Sciences in Omaha

0.0%
30.0%
Zip Codes with the Highest Percentage of Population with a Degree in Physical and Health Sciences in Omaha Map

Zip Codes with the Highest Percentage of Population with a Degree in Physical and Health Sciences in Omaha, NE

Zip Code % Graduates vs State vs National
1.6817828.0%2.7%(+25.3)#63.1%(+24.9)#214
2.681086.1%2.7%(+3.40)#633.1%(+2.98)#3,191
3.681444.5%2.7%(+1.85)#923.1%(+1.42)#5,484
4.681104.1%2.7%(+1.44)#1043.1%(+1.02)#6,406
5.681353.9%2.7%(+1.19)#1143.1%(+0.762)#7,157
6.681243.8%2.7%(+1.11)#1153.1%(+0.686)#7,418
7.681063.6%2.7%(+0.905)#1233.1%(+0.482)#8,125
8.681373.1%2.7%(+0.409)#1363.1%(-0.014)#10,039
9.681303.1%2.7%(+0.394)#1373.1%(-0.029)#10,113
10.681523.0%2.7%(+0.314)#1423.1%(-0.109)#10,465
11.681273.0%2.7%(+0.310)#1433.1%(-0.113)#10,478
12.681142.9%2.7%(+0.246)#1463.1%(-0.176)#10,770
13.681162.8%2.7%(+0.087)#1553.1%(-0.336)#11,494
14.681342.6%2.7%(-0.052)#1603.1%(-0.475)#12,119
15.681542.2%2.7%(-0.519)#1883.1%(-0.942)#14,335
16.681642.1%2.7%(-0.579)#1903.1%(-1.00)#14,647
17.681042.1%2.7%(-0.609)#1923.1%(-1.03)#14,806
18.681312.1%2.7%(-0.619)#1933.1%(-1.04)#14,855
19.681321.8%2.7%(-0.866)#2053.1%(-1.29)#15,950
20.681421.7%2.7%(-1.03)#2163.1%(-1.45)#16,641
21.681021.6%2.7%(-1.12)#2223.1%(-1.55)#17,072
22.681381.5%2.7%(-1.22)#2303.1%(-1.64)#17,470
23.681221.4%2.7%(-1.29)#2363.1%(-1.71)#17,778
24.681051.3%2.7%(-1.39)#2463.1%(-1.81)#18,180
25.681361.2%2.7%(-1.48)#2573.1%(-1.90)#18,537
26.681171.1%2.7%(-1.57)#2653.1%(-1.99)#18,853
27.681181.0%2.7%(-1.68)#2743.1%(-2.10)#19,254
28.681110.91%2.7%(-1.77)#2773.1%(-2.19)#19,530
29.681120.64%2.7%(-2.03)#2913.1%(-2.45)#20,299
30.681070.42%2.7%(-2.26)#3013.1%(-2.68)#20,770

Common Questions

What are the Top 10 Zip Codes with the Highest Percentage of Population with a Degree in Physical and Health Sciences in Omaha, NE?
Top 10 Zip Codes with the Highest Percentage of Population with a Degree in Physical and Health Sciences in Omaha, NE are:
#1
28.0%
#2
6.1%
#3
4.5%
#4
4.1%
#5
3.9%
#6
3.8%
#7
3.6%
#8
3.1%
#9
3.1%
#10
3.0%
What zip code has the Highest Percentage of Population with a Degree in Physical and Health Sciences in Omaha, NE?
68178 has the Highest Percentage of Population with a Degree in Physical and Health Sciences in Omaha, NE with 28.0%.
What is the Percentage of Population with a Degree in Physical and Health Sciences in Omaha, NE?
Percentage of Population with a Degree in Physical and Health Sciences in Omaha is 2.7%.
What is the Percentage of Population with a Degree in Physical and Health Sciences in Nebraska?
Percentage of Population with a Degree in Physical and Health Sciences in Nebraska is 2.7%.
What is the Percentage of Population with a Degree in Physical and Health Sciences in the United States?
Percentage of Population with a Degree in Physical and Health Sciences in the United States is 3.1%.