Zip Codes with the Highest Percentage of Households with Income Below $10,000 in Puerto Rico
RELATED REPORTS & OPTIONS
Household Income | $0-10k
Puerto Rico
Compare Zip Codes
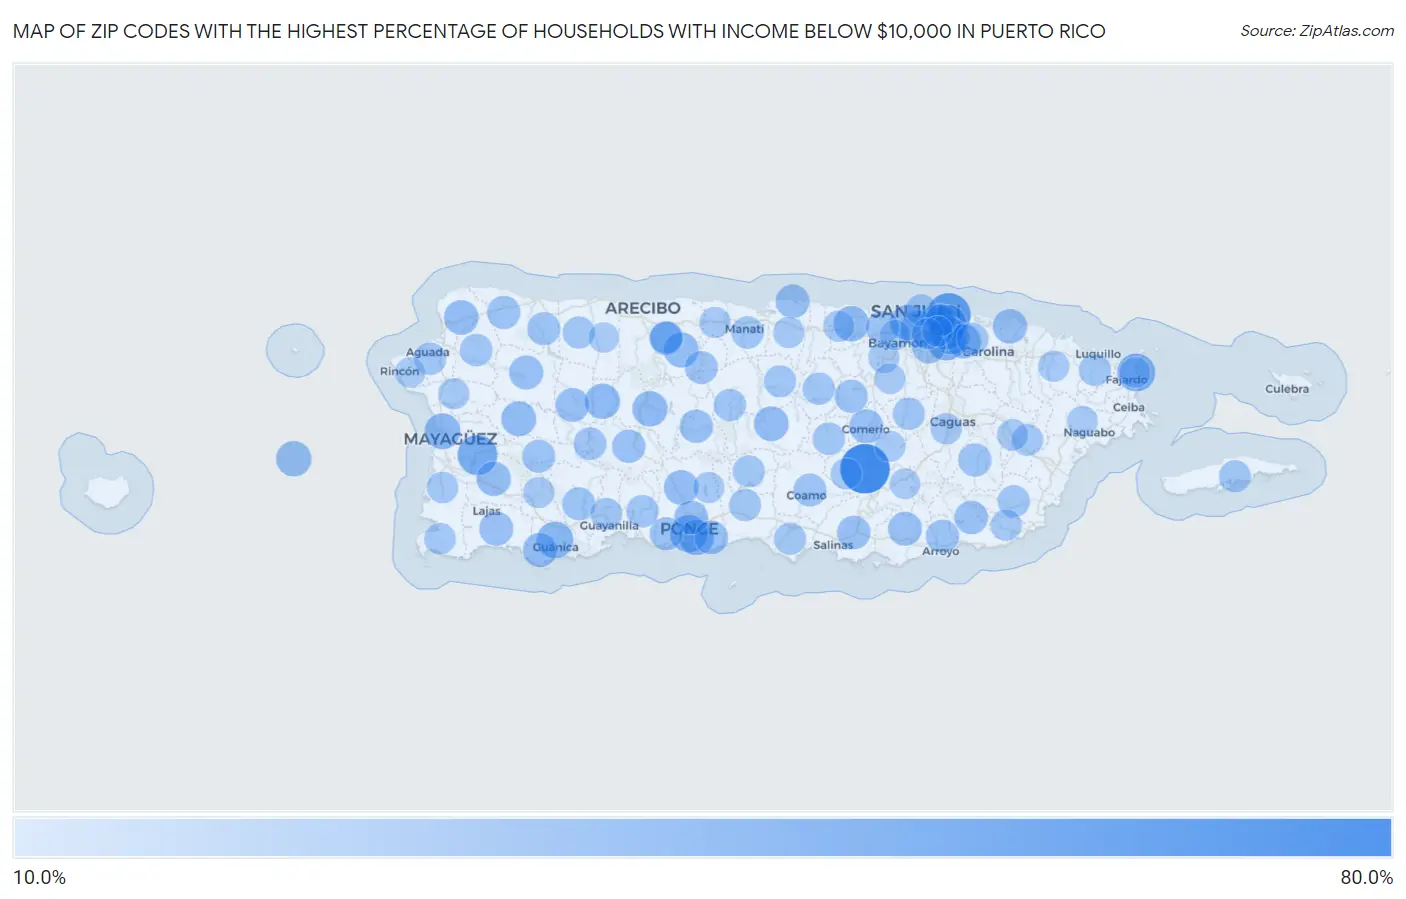
Map of Zip Codes with the Highest Percentage of Households with Income Below $10,000 in Puerto Rico
10.0%
80.0%
Zip Codes with the Highest Percentage of Households with Income Below $10,000 in Puerto Rico
| Zip Code | Households with Income < $10k | vs State | vs National | |
| 1. | 00786 | 76.7% | 22.7%(+54.0)#1 | 4.9%(+71.8)#47 |
| 2. | 00913 | 59.0% | 22.7%(+36.3)#2 | 4.9%(+54.1)#80 |
| 3. | 00636 | 46.6% | 22.7%(+23.9)#3 | 4.9%(+41.7)#130 |
| 4. | 00925 | 42.9% | 22.7%(+20.2)#4 | 4.9%(+38.0)#151 |
| 5. | 00915 | 41.2% | 22.7%(+18.5)#5 | 4.9%(+36.3)#164 |
| 6. | 00740 | 41.1% | 22.7%(+18.4)#6 | 4.9%(+36.2)#165 |
| 7. | 00717 | 38.5% | 22.7%(+15.8)#7 | 4.9%(+33.6)#182 |
| 8. | 00965 | 37.5% | 22.7%(+14.8)#8 | 4.9%(+32.6)#192 |
| 9. | 00653 | 37.2% | 22.7%(+14.5)#9 | 4.9%(+32.3)#196 |
| 10. | 00923 | 36.4% | 22.7%(+13.7)#10 | 4.9%(+31.5)#205 |
| 11. | 00682 | 34.8% | 22.7%(+12.1)#11 | 4.9%(+29.9)#221 |
| 12. | 00680 | 33.3% | 22.7%(+10.6)#12 | 4.9%(+28.4)#243 |
| 13. | 00951 | 33.3% | 22.7%(+10.6)#13 | 4.9%(+28.4)#245 |
| 14. | 00962 | 33.2% | 22.7%(+10.5)#14 | 4.9%(+28.3)#260 |
| 15. | 00716 | 33.1% | 22.7%(+10.4)#15 | 4.9%(+28.2)#261 |
| 16. | 00641 | 33.0% | 22.7%(+10.3)#16 | 4.9%(+28.1)#266 |
| 17. | 00611 | 32.9% | 22.7%(+10.2)#17 | 4.9%(+28.0)#270 |
| 18. | 00688 | 32.0% | 22.7%(+9.30)#18 | 4.9%(+27.1)#287 |
| 19. | 00670 | 31.8% | 22.7%(+9.10)#19 | 4.9%(+26.9)#289 |
| 20. | 00720 | 31.4% | 22.7%(+8.70)#20 | 4.9%(+26.5)#297 |
| 21. | 00603 | 31.0% | 22.7%(+8.30)#21 | 4.9%(+26.1)#304 |
| 22. | 00731 | 31.0% | 22.7%(+8.30)#22 | 4.9%(+26.1)#305 |
| 23. | 00917 | 30.8% | 22.7%(+8.10)#23 | 4.9%(+25.9)#308 |
| 24. | 00924 | 30.5% | 22.7%(+7.80)#24 | 4.9%(+25.6)#316 |
| 25. | 00772 | 30.4% | 22.7%(+7.70)#25 | 4.9%(+25.5)#317 |
| 26. | 00683 | 30.1% | 22.7%(+7.40)#26 | 4.9%(+25.2)#327 |
| 27. | 00909 | 29.6% | 22.7%(+6.90)#27 | 4.9%(+24.7)#333 |
| 28. | 00647 | 29.6% | 22.7%(+6.90)#28 | 4.9%(+24.7)#334 |
| 29. | 00685 | 29.3% | 22.7%(+6.60)#29 | 4.9%(+24.4)#340 |
| 30. | 00921 | 29.2% | 22.7%(+6.50)#30 | 4.9%(+24.3)#344 |
| 31. | 00782 | 29.2% | 22.7%(+6.50)#31 | 4.9%(+24.3)#345 |
| 32. | 00784 | 28.9% | 22.7%(+6.20)#32 | 4.9%(+24.0)#350 |
| 33. | 00667 | 28.9% | 22.7%(+6.20)#33 | 4.9%(+24.0)#351 |
| 34. | 00694 | 28.8% | 22.7%(+6.10)#34 | 4.9%(+23.9)#356 |
| 35. | 00730 | 28.3% | 22.7%(+5.60)#35 | 4.9%(+23.4)#363 |
| 36. | 00669 | 28.3% | 22.7%(+5.60)#36 | 4.9%(+23.4)#364 |
| 37. | 00715 | 27.9% | 22.7%(+5.20)#37 | 4.9%(+23.0)#373 |
| 38. | 00664 | 27.6% | 22.7%(+4.90)#38 | 4.9%(+22.7)#384 |
| 39. | 00612 | 27.5% | 22.7%(+4.80)#39 | 4.9%(+22.6)#388 |
| 40. | 00751 | 27.5% | 22.7%(+4.80)#40 | 4.9%(+22.6)#389 |
| 41. | 00723 | 27.2% | 22.7%(+4.50)#41 | 4.9%(+22.3)#395 |
| 42. | 00601 | 27.1% | 22.7%(+4.40)#42 | 4.9%(+22.2)#397 |
| 43. | 00662 | 26.8% | 22.7%(+4.10)#43 | 4.9%(+21.9)#405 |
| 44. | 00719 | 26.8% | 22.7%(+4.10)#44 | 4.9%(+21.9)#406 |
| 45. | 00714 | 26.8% | 22.7%(+4.10)#45 | 4.9%(+21.9)#407 |
| 46. | 00754 | 26.5% | 22.7%(+3.80)#46 | 4.9%(+21.6)#419 |
| 47. | 00952 | 26.5% | 22.7%(+3.80)#47 | 4.9%(+21.6)#420 |
| 48. | 00678 | 26.3% | 22.7%(+3.60)#48 | 4.9%(+21.4)#426 |
| 49. | 00728 | 26.0% | 22.7%(+3.30)#49 | 4.9%(+21.1)#438 |
| 50. | 00698 | 25.9% | 22.7%(+3.20)#50 | 4.9%(+21.0)#443 |
| 51. | 00606 | 25.9% | 22.7%(+3.20)#51 | 4.9%(+21.0)#445 |
| 52. | 00650 | 25.8% | 22.7%(+3.10)#52 | 4.9%(+20.9)#446 |
| 53. | 00769 | 25.6% | 22.7%(+2.90)#53 | 4.9%(+20.7)#457 |
| 54. | 00631 | 25.4% | 22.7%(+2.70)#54 | 4.9%(+20.5)#464 |
| 55. | 00616 | 25.2% | 22.7%(+2.50)#55 | 4.9%(+20.3)#476 |
| 56. | 00676 | 24.6% | 22.7%(+1.90)#56 | 4.9%(+19.7)#502 |
| 57. | 00794 | 24.4% | 22.7%(+1.70)#57 | 4.9%(+19.5)#512 |
| 58. | 00602 | 24.3% | 22.7%(+1.60)#58 | 4.9%(+19.4)#516 |
| 59. | 00674 | 24.2% | 22.7%(+1.50)#59 | 4.9%(+19.3)#522 |
| 60. | 00624 | 24.2% | 22.7%(+1.50)#60 | 4.9%(+19.3)#523 |
| 61. | 00703 | 23.9% | 22.7%(+1.20)#61 | 4.9%(+19.0)#536 |
| 62. | 00638 | 23.8% | 22.7%(+1.10)#62 | 4.9%(+18.9)#542 |
| 63. | 00783 | 23.7% | 22.7%(+1.00)#63 | 4.9%(+18.8)#546 |
| 64. | 00795 | 23.4% | 22.7%(+0.700)#64 | 4.9%(+18.5)#566 |
| 65. | 00627 | 23.4% | 22.7%(+0.700)#65 | 4.9%(+18.5)#567 |
| 66. | 00767 | 23.4% | 22.7%(+0.700)#66 | 4.9%(+18.5)#568 |
| 67. | 00757 | 23.4% | 22.7%(+0.700)#67 | 4.9%(+18.5)#569 |
| 68. | 00687 | 23.3% | 22.7%(+0.600)#68 | 4.9%(+18.4)#571 |
| 69. | 00765 | 23.2% | 22.7%(+0.500)#69 | 4.9%(+18.3)#580 |
| 70. | 00773 | 23.0% | 22.7%(+0.300)#70 | 4.9%(+18.1)#592 |
| 71. | 00766 | 22.9% | 22.7%(+0.200)#71 | 4.9%(+18.0)#595 |
| 72. | 00982 | 22.5% | 22.7%(-0.200)#72 | 4.9%(+17.6)#608 |
| 73. | 00656 | 22.4% | 22.7%(-0.300)#73 | 4.9%(+17.5)#612 |
| 74. | 00771 | 21.9% | 22.7%(-0.800)#74 | 4.9%(+17.0)#640 |
| 75. | 00901 | 21.7% | 22.7%(-1.000)#75 | 4.9%(+16.8)#651 |
| 76. | 00622 | 21.7% | 22.7%(-1.000)#76 | 4.9%(+16.8)#652 |
| 77. | 00623 | 21.5% | 22.7%(-1.20)#77 | 4.9%(+16.6)#666 |
| 78. | 00912 | 21.5% | 22.7%(-1.20)#78 | 4.9%(+16.6)#667 |
| 79. | 00725 | 21.0% | 22.7%(-1.70)#79 | 4.9%(+16.1)#705 |
| 80. | 00920 | 21.0% | 22.7%(-1.70)#80 | 4.9%(+16.1)#706 |
| 81. | 00777 | 20.7% | 22.7%(-2.00)#81 | 4.9%(+15.8)#725 |
| 82. | 00637 | 20.7% | 22.7%(-2.00)#82 | 4.9%(+15.8)#727 |
| 83. | 00780 | 20.7% | 22.7%(-2.00)#83 | 4.9%(+15.8)#730 |
| 84. | 00693 | 20.6% | 22.7%(-2.10)#84 | 4.9%(+15.7)#737 |
| 85. | 00646 | 20.5% | 22.7%(-2.20)#85 | 4.9%(+15.6)#742 |
| 86. | 00707 | 20.5% | 22.7%(-2.20)#86 | 4.9%(+15.6)#744 |
| 87. | 00957 | 20.4% | 22.7%(-2.30)#87 | 4.9%(+15.5)#757 |
| 88. | 00705 | 20.4% | 22.7%(-2.30)#88 | 4.9%(+15.5)#758 |
| 89. | 00745 | 20.3% | 22.7%(-2.40)#89 | 4.9%(+15.4)#769 |
| 90. | 00610 | 20.3% | 22.7%(-2.40)#90 | 4.9%(+15.4)#770 |
| 91. | 00617 | 20.2% | 22.7%(-2.50)#91 | 4.9%(+15.3)#781 |
| 92. | 00739 | 19.8% | 22.7%(-2.90)#92 | 4.9%(+14.9)#811 |
| 93. | 00718 | 19.3% | 22.7%(-3.40)#93 | 4.9%(+14.4)#865 |
| 94. | 00956 | 19.2% | 22.7%(-3.50)#94 | 4.9%(+14.3)#875 |
| 95. | 00738 | 19.2% | 22.7%(-3.50)#95 | 4.9%(+14.3)#877 |
| 96. | 00918 | 19.2% | 22.7%(-3.50)#96 | 4.9%(+14.3)#879 |
| 97. | 00736 | 19.1% | 22.7%(-3.60)#97 | 4.9%(+14.2)#892 |
| 98. | 00659 | 18.3% | 22.7%(-4.40)#98 | 4.9%(+13.4)#971 |
| 99. | 00961 | 18.3% | 22.7%(-4.40)#99 | 4.9%(+13.4)#972 |
| 100. | 00677 | 18.2% | 22.7%(-4.50)#100 | 4.9%(+13.3)#990 |
1
2Common Questions
What are the Top 10 Zip Codes with the Highest Percentage of Households with Income Below $10,000 in Puerto Rico?
Top 10 Zip Codes with the Highest Percentage of Households with Income Below $10,000 in Puerto Rico are:
What zip code has the Highest Percentage of Households with Income Below $10,000 in Puerto Rico?
00786 has the Highest Percentage of Households with Income Below $10,000 in Puerto Rico with 76.7%.
What is the Percentage of Households with Income Below $10,000 in the State of Puerto Rico?
Percentage of Households with Income Below $10,000 in Puerto Rico is 22.7%.
What is the Percentage of Households with Income Below $10,000 in the United States?
Percentage of Households with Income Below $10,000 in the United States is 4.9%.