Zip Codes with the Highest Percentage of Households with Income Below $10,000 in Colorado
RELATED REPORTS & OPTIONS
Household Income | $0-10k
Colorado
Compare Zip Codes
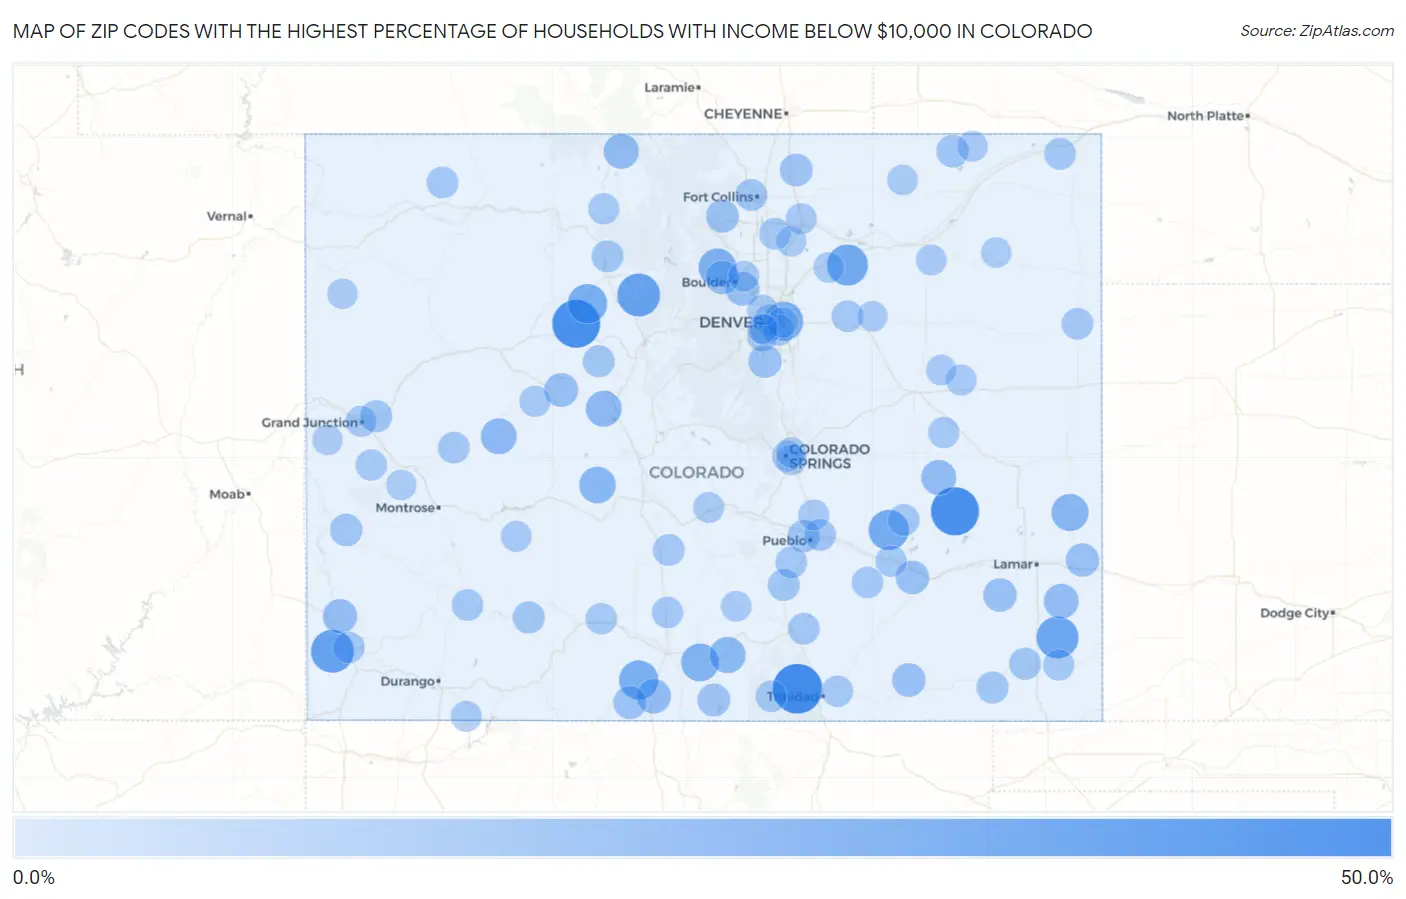
Map of Zip Codes with the Highest Percentage of Households with Income Below $10,000 in Colorado
0.0%
50.0%
Zip Codes with the Highest Percentage of Households with Income Below $10,000 in Colorado
| Zip Code | Households with Income < $10k | vs State | vs National | |
| 1. | 81024 | 47.7% | 3.9%(+43.8)#1 | 4.9%(+42.8)#123 |
| 2. | 81021 | 44.4% | 3.9%(+40.5)#2 | 4.9%(+39.5)#140 |
| 3. | 81655 | 44.2% | 3.9%(+40.3)#3 | 4.9%(+39.3)#142 |
| 4. | 81331 | 33.3% | 3.9%(+29.4)#4 | 4.9%(+28.4)#246 |
| 5. | 80468 | 32.9% | 3.9%(+29.0)#5 | 4.9%(+28.0)#272 |
| 6. | 81084 | 31.0% | 3.9%(+27.1)#6 | 4.9%(+26.1)#306 |
| 7. | 80652 | 28.7% | 3.9%(+24.8)#7 | 4.9%(+23.8)#357 |
| 8. | 81062 | 27.2% | 3.9%(+23.3)#8 | 4.9%(+22.3)#396 |
| 9. | 80423 | 25.3% | 3.9%(+21.4)#9 | 4.9%(+20.4)#475 |
| 10. | 81124 | 25.0% | 3.9%(+21.1)#10 | 4.9%(+20.1)#488 |
| 11. | 80045 | 24.7% | 3.9%(+20.8)#11 | 4.9%(+19.8)#500 |
| 12. | 80455 | 22.1% | 3.9%(+18.2)#12 | 4.9%(+17.2)#634 |
| 13. | 81123 | 22.0% | 3.9%(+18.1)#13 | 4.9%(+17.1)#639 |
| 14. | 81071 | 20.2% | 3.9%(+16.3)#14 | 4.9%(+15.3)#787 |
| 15. | 81241 | 19.4% | 3.9%(+15.5)#15 | 4.9%(+14.5)#862 |
| 16. | 81133 | 18.3% | 3.9%(+14.4)#16 | 4.9%(+13.4)#978 |
| 17. | 81251 | 17.8% | 3.9%(+13.9)#17 | 4.9%(+12.9)#1,051 |
| 18. | 81434 | 17.7% | 3.9%(+13.8)#18 | 4.9%(+12.8)#1,065 |
| 19. | 80434 | 16.0% | 3.9%(+12.1)#19 | 4.9%(+11.1)#1,354 |
| 20. | 80823 | 15.9% | 3.9%(+12.0)#20 | 4.9%(+11.0)#1,371 |
| 21. | 81041 | 15.5% | 3.9%(+11.6)#21 | 4.9%(+10.6)#1,435 |
| 22. | 81148 | 15.0% | 3.9%(+11.1)#22 | 4.9%(+10.1)#1,529 |
| 23. | 81320 | 14.6% | 3.9%(+10.7)#23 | 4.9%(+9.70)#1,636 |
| 24. | 80303 | 13.6% | 3.9%(+9.70)#24 | 4.9%(+8.70)#1,875 |
| 25. | 81656 | 13.3% | 3.9%(+9.40)#25 | 4.9%(+8.40)#1,991 |
| 26. | 80302 | 13.0% | 3.9%(+9.10)#26 | 4.9%(+8.10)#2,063 |
| 27. | 81027 | 13.0% | 3.9%(+9.10)#27 | 4.9%(+8.10)#2,103 |
| 28. | 81067 | 12.8% | 3.9%(+8.90)#28 | 4.9%(+7.90)#2,167 |
| 29. | 81044 | 12.7% | 3.9%(+8.80)#29 | 4.9%(+7.80)#2,224 |
| 30. | 81043 | 12.5% | 3.9%(+8.60)#30 | 4.9%(+7.60)#2,288 |
| 31. | 81120 | 12.2% | 3.9%(+8.30)#31 | 4.9%(+7.30)#2,385 |
| 32. | 80131 | 12.0% | 3.9%(+8.10)#32 | 4.9%(+7.10)#2,492 |
| 33. | 81152 | 11.4% | 3.9%(+7.50)#33 | 4.9%(+6.50)#2,767 |
| 34. | 80648 | 11.2% | 3.9%(+7.30)#34 | 4.9%(+6.30)#2,867 |
| 35. | 80515 | 11.2% | 3.9%(+7.30)#35 | 4.9%(+6.30)#2,869 |
| 36. | 81422 | 10.4% | 3.9%(+6.50)#36 | 4.9%(+5.50)#3,346 |
| 37. | 80745 | 10.3% | 3.9%(+6.40)#37 | 4.9%(+5.40)#3,421 |
| 38. | 81003 | 9.8% | 3.9%(+5.90)#38 | 4.9%(+4.90)#3,724 |
| 39. | 81520 | 9.6% | 3.9%(+5.70)#39 | 4.9%(+4.70)#3,885 |
| 40. | 81130 | 9.6% | 3.9%(+5.70)#40 | 4.9%(+4.70)#3,926 |
| 41. | 81064 | 9.6% | 3.9%(+5.70)#41 | 4.9%(+4.70)#3,940 |
| 42. | 81073 | 9.3% | 3.9%(+5.40)#42 | 4.9%(+4.40)#4,148 |
| 43. | 81645 | 9.3% | 3.9%(+5.40)#43 | 4.9%(+4.40)#4,165 |
| 44. | 80521 | 9.2% | 3.9%(+5.30)#44 | 4.9%(+4.30)#4,200 |
| 45. | 81019 | 9.2% | 3.9%(+5.30)#45 | 4.9%(+4.30)#4,265 |
| 46. | 81001 | 9.1% | 3.9%(+5.20)#46 | 4.9%(+4.20)#4,298 |
| 47. | 80459 | 9.1% | 3.9%(+5.20)#47 | 4.9%(+4.20)#4,342 |
| 48. | 81143 | 9.0% | 3.9%(+5.10)#48 | 4.9%(+4.10)#4,471 |
| 49. | 80744 | 9.0% | 3.9%(+5.10)#49 | 4.9%(+4.10)#4,480 |
| 50. | 81625 | 8.9% | 3.9%(+5.00)#50 | 4.9%(+4.00)#4,525 |
| 51. | 81004 | 8.8% | 3.9%(+4.90)#51 | 4.9%(+3.90)#4,614 |
| 52. | 80136 | 8.8% | 3.9%(+4.90)#52 | 4.9%(+3.90)#4,639 |
| 53. | 80534 | 8.7% | 3.9%(+4.80)#53 | 4.9%(+3.80)#4,734 |
| 54. | 81089 | 8.7% | 3.9%(+4.80)#54 | 4.9%(+3.80)#4,759 |
| 55. | 81419 | 8.7% | 3.9%(+4.80)#55 | 4.9%(+3.80)#4,770 |
| 56. | 80735 | 8.6% | 3.9%(+4.70)#56 | 4.9%(+3.70)#4,902 |
| 57. | 81063 | 8.5% | 3.9%(+4.60)#57 | 4.9%(+3.60)#4,966 |
| 58. | 81433 | 8.5% | 3.9%(+4.60)#58 | 4.9%(+3.60)#5,000 |
| 59. | 81091 | 8.3% | 3.9%(+4.40)#59 | 4.9%(+3.40)#5,248 |
| 60. | 81327 | 8.3% | 3.9%(+4.40)#60 | 4.9%(+3.40)#5,272 |
| 61. | 81039 | 8.2% | 3.9%(+4.30)#61 | 4.9%(+3.30)#5,361 |
| 62. | 81136 | 8.2% | 3.9%(+4.30)#62 | 4.9%(+3.30)#5,389 |
| 63. | 81082 | 8.1% | 3.9%(+4.20)#63 | 4.9%(+3.20)#5,441 |
| 64. | 81132 | 8.0% | 3.9%(+4.10)#64 | 4.9%(+3.10)#5,606 |
| 65. | 81527 | 8.0% | 3.9%(+4.10)#65 | 4.9%(+3.10)#5,625 |
| 66. | 80205 | 7.8% | 3.9%(+3.90)#66 | 4.9%(+2.90)#5,801 |
| 67. | 80430 | 7.8% | 3.9%(+3.90)#67 | 4.9%(+2.90)#5,927 |
| 68. | 81501 | 7.7% | 3.9%(+3.80)#68 | 4.9%(+2.80)#5,945 |
| 69. | 80821 | 7.7% | 3.9%(+3.80)#69 | 4.9%(+2.80)#6,005 |
| 70. | 81058 | 7.7% | 3.9%(+3.80)#70 | 4.9%(+2.80)#6,011 |
| 71. | 81087 | 7.7% | 3.9%(+3.80)#71 | 4.9%(+2.80)#6,043 |
| 72. | 81654 | 7.6% | 3.9%(+3.70)#72 | 4.9%(+2.70)#6,147 |
| 73. | 80247 | 7.5% | 3.9%(+3.60)#73 | 4.9%(+2.60)#6,206 |
| 74. | 80301 | 7.3% | 3.9%(+3.40)#74 | 4.9%(+2.40)#6,491 |
| 75. | 81243 | 7.3% | 3.9%(+3.40)#75 | 4.9%(+2.40)#6,607 |
| 76. | 80631 | 7.2% | 3.9%(+3.30)#76 | 4.9%(+2.30)#6,613 |
| 77. | 81008 | 7.2% | 3.9%(+3.30)#77 | 4.9%(+2.30)#6,670 |
| 78. | 81212 | 7.1% | 3.9%(+3.20)#78 | 4.9%(+2.20)#6,782 |
| 79. | 80723 | 7.1% | 3.9%(+3.20)#79 | 4.9%(+2.20)#6,838 |
| 80. | 80804 | 7.1% | 3.9%(+3.20)#80 | 4.9%(+2.20)#6,927 |
| 81. | 81137 | 7.0% | 3.9%(+3.10)#81 | 4.9%(+2.10)#7,018 |
| 82. | 80903 | 6.9% | 3.9%(+3.00)#82 | 4.9%(+2.00)#7,133 |
| 83. | 80236 | 6.8% | 3.9%(+2.90)#83 | 4.9%(+1.90)#7,357 |
| 84. | 81040 | 6.8% | 3.9%(+2.90)#84 | 4.9%(+1.90)#7,508 |
| 85. | 80747 | 6.7% | 3.9%(+2.80)#85 | 4.9%(+1.80)#7,672 |
| 86. | 80742 | 6.7% | 3.9%(+2.80)#86 | 4.9%(+1.80)#7,682 |
| 87. | 80223 | 6.5% | 3.9%(+2.60)#87 | 4.9%(+1.60)#7,923 |
| 88. | 80030 | 6.5% | 3.9%(+2.60)#88 | 4.9%(+1.60)#7,931 |
| 89. | 81416 | 6.5% | 3.9%(+2.60)#89 | 4.9%(+1.60)#7,942 |
| 90. | 80643 | 6.5% | 3.9%(+2.60)#90 | 4.9%(+1.60)#7,995 |
| 91. | 80818 | 6.5% | 3.9%(+2.60)#91 | 4.9%(+1.60)#8,072 |
| 92. | 80010 | 6.4% | 3.9%(+2.50)#92 | 4.9%(+1.50)#8,097 |
| 93. | 80910 | 6.4% | 3.9%(+2.50)#93 | 4.9%(+1.50)#8,111 |
| 94. | 80103 | 6.4% | 3.9%(+2.50)#94 | 4.9%(+1.50)#8,212 |
| 95. | 80623 | 6.3% | 3.9%(+2.40)#95 | 4.9%(+1.40)#8,455 |
| 96. | 80743 | 6.2% | 3.9%(+2.30)#96 | 4.9%(+1.30)#8,672 |
| 97. | 81523 | 6.2% | 3.9%(+2.30)#97 | 4.9%(+1.30)#8,693 |
| 98. | 80219 | 6.1% | 3.9%(+2.20)#98 | 4.9%(+1.20)#8,715 |
| 99. | 80909 | 6.1% | 3.9%(+2.20)#99 | 4.9%(+1.20)#8,733 |
| 100. | 81648 | 6.1% | 3.9%(+2.20)#100 | 4.9%(+1.20)#8,868 |
Common Questions
What are the Top 10 Zip Codes with the Highest Percentage of Households with Income Below $10,000 in Colorado?
Top 10 Zip Codes with the Highest Percentage of Households with Income Below $10,000 in Colorado are:
What zip code has the Highest Percentage of Households with Income Below $10,000 in Colorado?
81024 has the Highest Percentage of Households with Income Below $10,000 in Colorado with 47.7%.
What is the Percentage of Households with Income Below $10,000 in the State of Colorado?
Percentage of Households with Income Below $10,000 in Colorado is 3.9%.
What is the Percentage of Households with Income Below $10,000 in the United States?
Percentage of Households with Income Below $10,000 in the United States is 4.9%.