Zip Codes with the Highest Percentage of Households with Income Below $10,000 in Florida
RELATED REPORTS & OPTIONS
Household Income | $0-10k
Florida
Compare Zip Codes
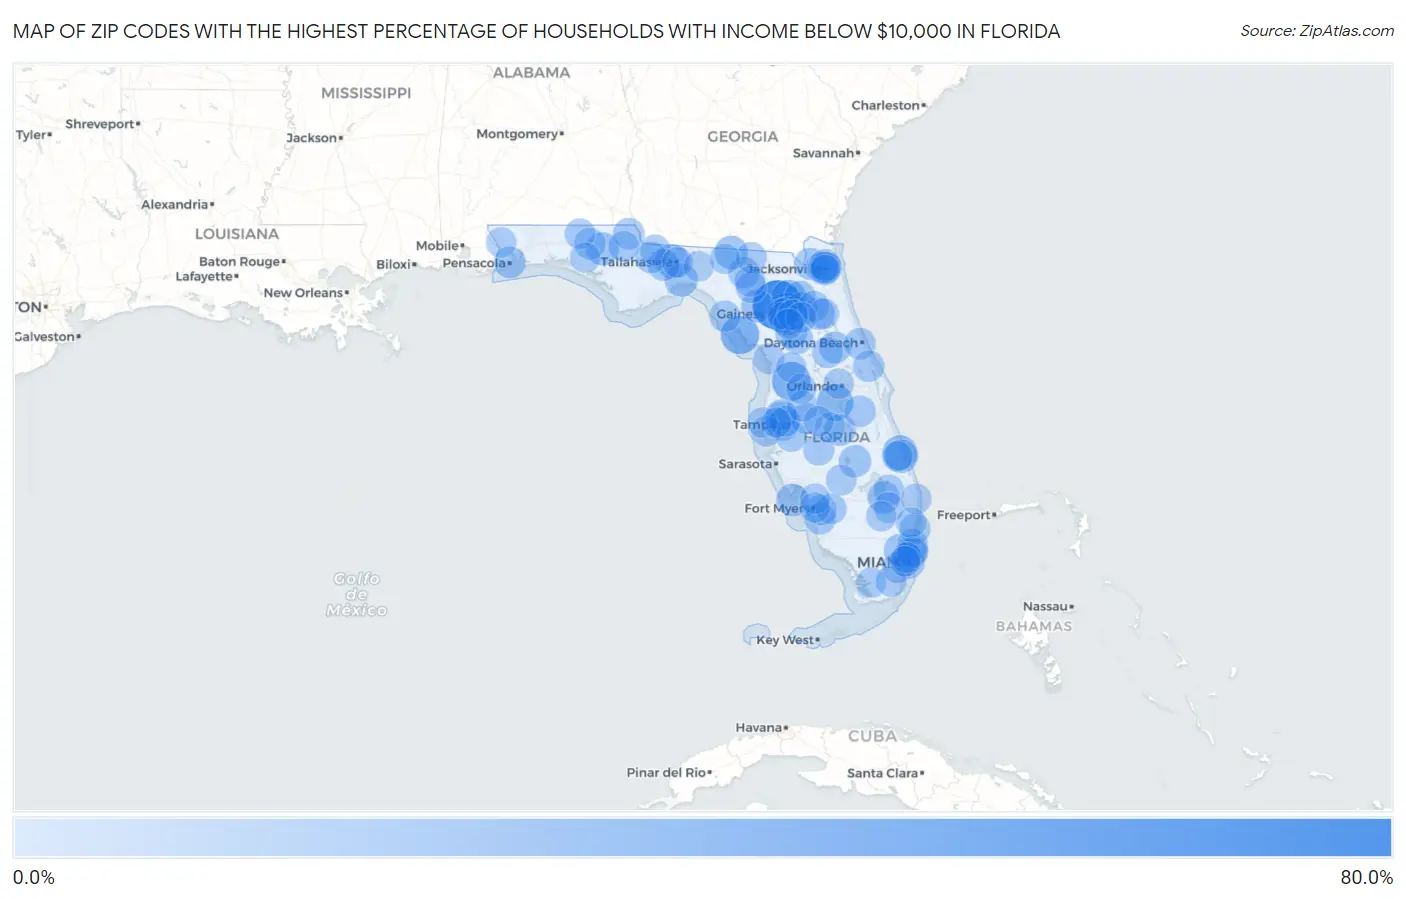
Map of Zip Codes with the Highest Percentage of Households with Income Below $10,000 in Florida
0.0%
80.0%
Zip Codes with the Highest Percentage of Households with Income Below $10,000 in Florida
| Zip Code | Households with Income < $10k | vs State | vs National | |
| 1. | 32616 | 67.6% | 5.2%(+62.4)#1 | 4.9%(+62.7)#62 |
| 2. | 32603 | 44.6% | 5.2%(+39.4)#2 | 4.9%(+39.7)#138 |
| 3. | 34661 | 34.6% | 5.2%(+29.4)#3 | 4.9%(+29.7)#226 |
| 4. | 32692 | 33.3% | 5.2%(+28.1)#4 | 4.9%(+28.4)#251 |
| 5. | 33848 | 27.7% | 5.2%(+22.5)#5 | 4.9%(+22.8)#381 |
| 6. | 32622 | 23.1% | 5.2%(+17.9)#6 | 4.9%(+18.2)#586 |
| 7. | 34946 | 21.9% | 5.2%(+16.7)#7 | 4.9%(+17.0)#641 |
| 8. | 32601 | 20.7% | 5.2%(+15.5)#8 | 4.9%(+15.8)#728 |
| 9. | 32304 | 20.0% | 5.2%(+14.8)#9 | 4.9%(+15.1)#791 |
| 10. | 34950 | 18.6% | 5.2%(+13.4)#10 | 4.9%(+13.7)#935 |
| 11. | 32350 | 18.3% | 5.2%(+13.1)#11 | 4.9%(+13.4)#976 |
| 12. | 32355 | 17.6% | 5.2%(+12.4)#12 | 4.9%(+12.7)#1,083 |
| 13. | 32463 | 17.4% | 5.2%(+12.2)#13 | 4.9%(+12.5)#1,112 |
| 14. | 32631 | 16.9% | 5.2%(+11.7)#14 | 4.9%(+12.0)#1,179 |
| 15. | 32619 | 15.9% | 5.2%(+10.7)#15 | 4.9%(+11.0)#1,359 |
| 16. | 33921 | 15.7% | 5.2%(+10.5)#16 | 4.9%(+10.8)#1,401 |
| 17. | 33027 | 15.1% | 5.2%(+9.90)#17 | 4.9%(+10.2)#1,496 |
| 18. | 33857 | 15.1% | 5.2%(+9.90)#18 | 4.9%(+10.2)#1,507 |
| 19. | 32147 | 14.7% | 5.2%(+9.50)#19 | 4.9%(+9.80)#1,601 |
| 20. | 33476 | 14.6% | 5.2%(+9.40)#20 | 4.9%(+9.70)#1,621 |
| 21. | 33136 | 14.3% | 5.2%(+9.10)#21 | 4.9%(+9.40)#1,688 |
| 22. | 32686 | 14.0% | 5.2%(+8.80)#22 | 4.9%(+9.10)#1,763 |
| 23. | 32310 | 13.7% | 5.2%(+8.50)#23 | 4.9%(+8.80)#1,849 |
| 24. | 32009 | 13.5% | 5.2%(+8.30)#24 | 4.9%(+8.60)#1,921 |
| 25. | 33854 | 13.3% | 5.2%(+8.10)#25 | 4.9%(+8.40)#1,992 |
| 26. | 32254 | 13.2% | 5.2%(+8.00)#26 | 4.9%(+8.30)#2,001 |
| 27. | 32102 | 13.2% | 5.2%(+8.00)#27 | 4.9%(+8.30)#2,011 |
| 28. | 32501 | 13.1% | 5.2%(+7.90)#28 | 4.9%(+8.20)#2,032 |
| 29. | 32427 | 12.9% | 5.2%(+7.70)#29 | 4.9%(+8.00)#2,133 |
| 30. | 32351 | 12.8% | 5.2%(+7.60)#30 | 4.9%(+7.90)#2,159 |
| 31. | 32064 | 12.7% | 5.2%(+7.50)#31 | 4.9%(+7.80)#2,197 |
| 32. | 32443 | 12.7% | 5.2%(+7.50)#32 | 4.9%(+7.80)#2,205 |
| 33. | 32209 | 12.6% | 5.2%(+7.40)#33 | 4.9%(+7.70)#2,227 |
| 34. | 32114 | 12.6% | 5.2%(+7.40)#34 | 4.9%(+7.70)#2,228 |
| 35. | 32208 | 12.4% | 5.2%(+7.20)#35 | 4.9%(+7.50)#2,294 |
| 36. | 33605 | 12.4% | 5.2%(+7.20)#36 | 4.9%(+7.50)#2,297 |
| 37. | 34773 | 12.4% | 5.2%(+7.20)#37 | 4.9%(+7.50)#2,303 |
| 38. | 32759 | 12.3% | 5.2%(+7.10)#38 | 4.9%(+7.40)#2,344 |
| 39. | 33004 | 12.2% | 5.2%(+7.00)#39 | 4.9%(+7.30)#2,373 |
| 40. | 33009 | 12.1% | 5.2%(+6.90)#40 | 4.9%(+7.20)#2,405 |
| 41. | 33965 | 12.1% | 5.2%(+6.90)#41 | 4.9%(+7.20)#2,423 |
| 42. | 33150 | 12.0% | 5.2%(+6.80)#42 | 4.9%(+7.10)#2,455 |
| 43. | 32206 | 12.0% | 5.2%(+6.80)#43 | 4.9%(+7.10)#2,457 |
| 44. | 32359 | 11.9% | 5.2%(+6.70)#44 | 4.9%(+7.00)#2,533 |
| 45. | 33612 | 11.6% | 5.2%(+6.40)#45 | 4.9%(+6.70)#2,618 |
| 46. | 33503 | 11.5% | 5.2%(+6.30)#46 | 4.9%(+6.60)#2,713 |
| 47. | 32608 | 11.4% | 5.2%(+6.20)#47 | 4.9%(+6.50)#2,721 |
| 48. | 32071 | 11.3% | 5.2%(+6.10)#48 | 4.9%(+6.40)#2,801 |
| 49. | 32091 | 11.1% | 5.2%(+5.90)#49 | 4.9%(+6.20)#2,887 |
| 50. | 33815 | 11.1% | 5.2%(+5.90)#50 | 4.9%(+6.20)#2,890 |
| 51. | 32702 | 11.1% | 5.2%(+5.90)#51 | 4.9%(+6.20)#2,906 |
| 52. | 33613 | 11.0% | 5.2%(+5.80)#52 | 4.9%(+6.10)#2,944 |
| 53. | 33441 | 11.0% | 5.2%(+5.80)#53 | 4.9%(+6.10)#2,949 |
| 54. | 32448 | 11.0% | 5.2%(+5.80)#54 | 4.9%(+6.10)#2,966 |
| 55. | 33610 | 10.9% | 5.2%(+5.70)#55 | 4.9%(+6.00)#2,996 |
| 56. | 33183 | 10.9% | 5.2%(+5.70)#56 | 4.9%(+6.00)#2,998 |
| 57. | 32607 | 10.9% | 5.2%(+5.70)#57 | 4.9%(+6.00)#2,999 |
| 58. | 33873 | 10.9% | 5.2%(+5.70)#58 | 4.9%(+6.00)#3,010 |
| 59. | 34475 | 10.8% | 5.2%(+5.60)#59 | 4.9%(+5.90)#3,070 |
| 60. | 32140 | 10.8% | 5.2%(+5.60)#60 | 4.9%(+5.90)#3,089 |
| 61. | 33030 | 10.7% | 5.2%(+5.50)#61 | 4.9%(+5.80)#3,114 |
| 62. | 34428 | 10.7% | 5.2%(+5.50)#62 | 4.9%(+5.80)#3,128 |
| 63. | 32052 | 10.7% | 5.2%(+5.50)#63 | 4.9%(+5.80)#3,131 |
| 64. | 32062 | 10.7% | 5.2%(+5.50)#64 | 4.9%(+5.80)#3,147 |
| 65. | 32332 | 10.7% | 5.2%(+5.50)#65 | 4.9%(+5.80)#3,151 |
| 66. | 33438 | 10.7% | 5.2%(+5.50)#66 | 4.9%(+5.80)#3,154 |
| 67. | 33960 | 10.6% | 5.2%(+5.40)#67 | 4.9%(+5.70)#3,213 |
| 68. | 32641 | 10.5% | 5.2%(+5.30)#68 | 4.9%(+5.60)#3,235 |
| 69. | 33973 | 10.4% | 5.2%(+5.20)#69 | 4.9%(+5.50)#3,300 |
| 70. | 33849 | 10.4% | 5.2%(+5.20)#70 | 4.9%(+5.50)#3,342 |
| 71. | 32301 | 10.3% | 5.2%(+5.10)#71 | 4.9%(+5.40)#3,358 |
| 72. | 33160 | 10.1% | 5.2%(+4.90)#72 | 4.9%(+5.20)#3,494 |
| 73. | 33147 | 10.0% | 5.2%(+4.80)#73 | 4.9%(+5.10)#3,563 |
| 74. | 33936 | 10.0% | 5.2%(+4.80)#74 | 4.9%(+5.10)#3,570 |
| 75. | 33142 | 9.9% | 5.2%(+4.70)#75 | 4.9%(+5.00)#3,638 |
| 76. | 33781 | 9.9% | 5.2%(+4.70)#76 | 4.9%(+5.00)#3,651 |
| 77. | 32177 | 9.9% | 5.2%(+4.70)#77 | 4.9%(+5.00)#3,652 |
| 78. | 33430 | 9.7% | 5.2%(+4.50)#78 | 4.9%(+4.80)#3,807 |
| 79. | 32464 | 9.7% | 5.2%(+4.50)#79 | 4.9%(+4.80)#3,830 |
| 80. | 32640 | 9.6% | 5.2%(+4.40)#80 | 4.9%(+4.70)#3,890 |
| 81. | 33917 | 9.5% | 5.2%(+4.30)#81 | 4.9%(+4.60)#3,955 |
| 82. | 34947 | 9.5% | 5.2%(+4.30)#82 | 4.9%(+4.60)#3,965 |
| 83. | 32204 | 9.5% | 5.2%(+4.30)#83 | 4.9%(+4.60)#3,972 |
| 84. | 33916 | 9.4% | 5.2%(+4.20)#84 | 4.9%(+4.50)#4,031 |
| 85. | 33404 | 9.3% | 5.2%(+4.10)#85 | 4.9%(+4.40)#4,098 |
| 86. | 33853 | 9.3% | 5.2%(+4.10)#86 | 4.9%(+4.40)#4,113 |
| 87. | 33496 | 9.2% | 5.2%(+4.00)#87 | 4.9%(+4.30)#4,209 |
| 88. | 32344 | 9.2% | 5.2%(+4.00)#88 | 4.9%(+4.30)#4,219 |
| 89. | 33597 | 9.2% | 5.2%(+4.00)#89 | 4.9%(+4.30)#4,226 |
| 90. | 32577 | 9.2% | 5.2%(+4.00)#90 | 4.9%(+4.30)#4,238 |
| 91. | 32808 | 9.1% | 5.2%(+3.90)#91 | 4.9%(+4.20)#4,293 |
| 92. | 33880 | 9.1% | 5.2%(+3.90)#92 | 4.9%(+4.20)#4,296 |
| 93. | 33755 | 9.1% | 5.2%(+3.90)#93 | 4.9%(+4.20)#4,302 |
| 94. | 32340 | 9.1% | 5.2%(+3.90)#94 | 4.9%(+4.20)#4,323 |
| 95. | 34450 | 9.1% | 5.2%(+3.90)#95 | 4.9%(+4.20)#4,324 |
| 96. | 33493 | 9.1% | 5.2%(+3.90)#96 | 4.9%(+4.20)#4,329 |
| 97. | 32667 | 9.1% | 5.2%(+3.90)#97 | 4.9%(+4.20)#4,333 |
| 98. | 32462 | 9.1% | 5.2%(+3.90)#98 | 4.9%(+4.20)#4,337 |
| 99. | 33607 | 9.0% | 5.2%(+3.80)#99 | 4.9%(+4.10)#4,406 |
| 100. | 33034 | 9.0% | 5.2%(+3.80)#100 | 4.9%(+4.10)#4,407 |
Common Questions
What are the Top 10 Zip Codes with the Highest Percentage of Households with Income Below $10,000 in Florida?
Top 10 Zip Codes with the Highest Percentage of Households with Income Below $10,000 in Florida are:
What zip code has the Highest Percentage of Households with Income Below $10,000 in Florida?
32616 has the Highest Percentage of Households with Income Below $10,000 in Florida with 67.6%.
What is the Percentage of Households with Income Below $10,000 in the State of Florida?
Percentage of Households with Income Below $10,000 in Florida is 5.2%.
What is the Percentage of Households with Income Below $10,000 in the United States?
Percentage of Households with Income Below $10,000 in the United States is 4.9%.