Zip Codes with the Lowest Unemployment Rate in Omaha, NE
RELATED REPORTS & OPTIONS
Lowest Unemployment
Omaha
Compare Zip Codes
Map of Zip Codes with the Lowest Unemployment Rate in Omaha
10.8%
0.20%
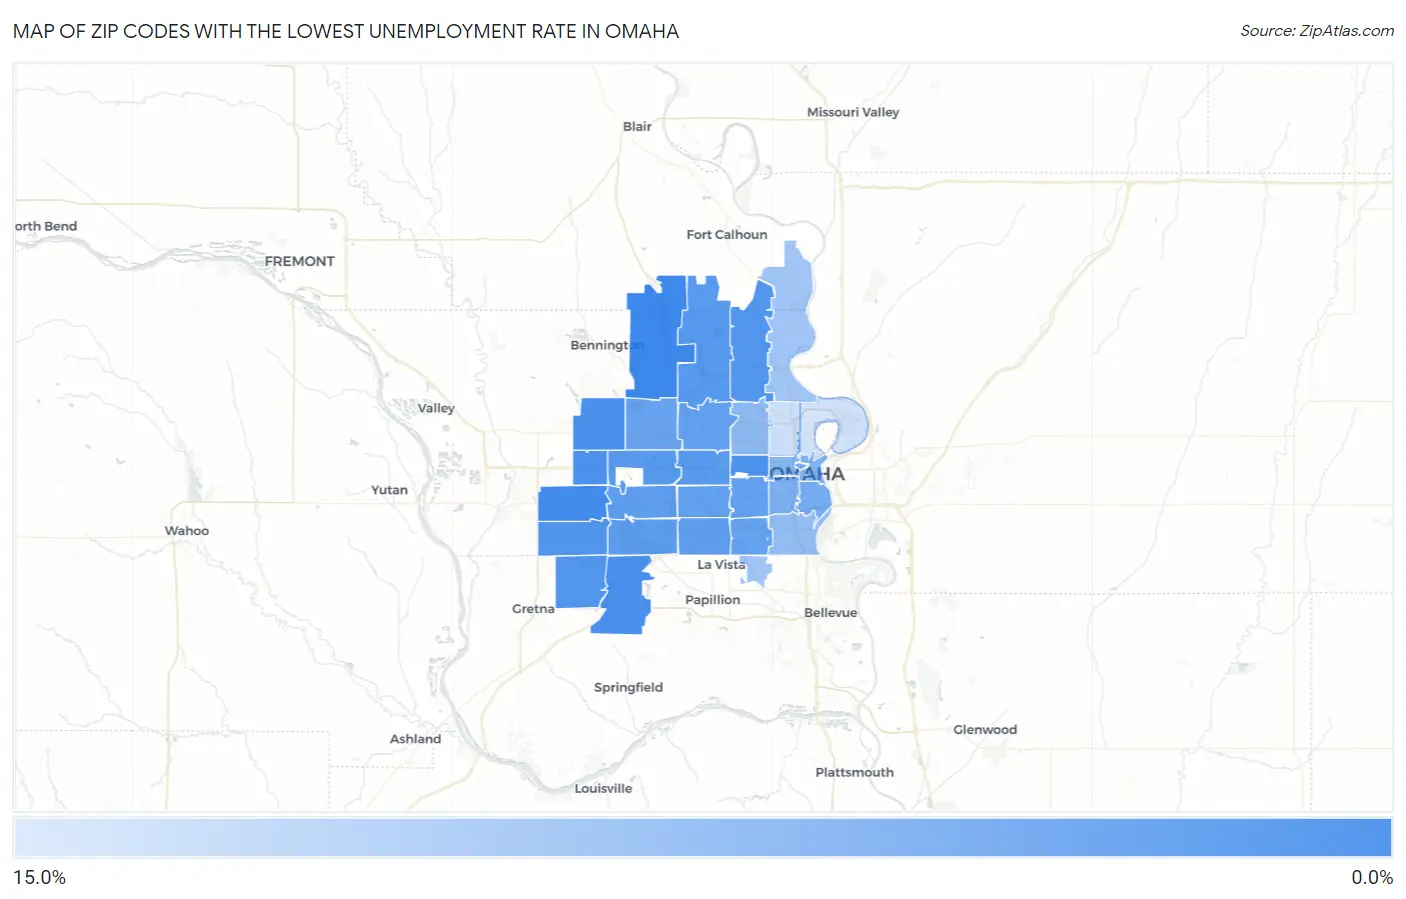
Zip Codes with the Lowest Unemployment Rate in Omaha, NE
| Zip Code | Unemployment Rate | vs State | vs National | |
| 1. | 68142 | 0.20% | 2.7%(-2.50)#5 | 5.0%(-4.80)#39 |
| 2. | 68130 | 0.70% | 2.7%(-2.00)#53 | 5.0%(-4.30)#674 |
| 3. | 68138 | 1.1% | 2.7%(-1.60)#92 | 5.0%(-3.90)#1,539 |
| 4. | 68116 | 1.2% | 2.7%(-1.50)#104 | 5.0%(-3.80)#1,765 |
| 5. | 68132 | 1.3% | 2.7%(-1.40)#119 | 5.0%(-3.70)#2,034 |
| 6. | 68118 | 1.3% | 2.7%(-1.40)#121 | 5.0%(-3.70)#2,056 |
| 7. | 68136 | 1.7% | 2.7%(-1.00)#154 | 5.0%(-3.30)#3,076 |
| 8. | 68152 | 1.7% | 2.7%(-1.00)#156 | 5.0%(-3.30)#3,145 |
| 9. | 68135 | 1.8% | 2.7%(-0.900)#161 | 5.0%(-3.20)#3,341 |
| 10. | 68154 | 2.0% | 2.7%(-0.700)#181 | 5.0%(-3.00)#3,976 |
| 11. | 68122 | 2.1% | 2.7%(-0.600)#194 | 5.0%(-2.90)#4,356 |
| 12. | 68114 | 2.3% | 2.7%(-0.400)#215 | 5.0%(-2.70)#5,032 |
| 13. | 68137 | 2.4% | 2.7%(-0.300)#223 | 5.0%(-2.60)#5,402 |
| 14. | 68144 | 2.5% | 2.7%(-0.200)#234 | 5.0%(-2.50)#5,785 |
| 15. | 68127 | 2.6% | 2.7%(-0.100)#247 | 5.0%(-2.40)#6,206 |
| 16. | 68134 | 2.8% | 2.7%(+0.100)#261 | 5.0%(-2.20)#6,963 |
| 17. | 68106 | 2.9% | 2.7%(+0.200)#268 | 5.0%(-2.10)#7,365 |
| 18. | 68124 | 2.9% | 2.7%(+0.200)#269 | 5.0%(-2.10)#7,410 |
| 19. | 68117 | 3.0% | 2.7%(+0.300)#278 | 5.0%(-2.00)#7,882 |
| 20. | 68164 | 3.2% | 2.7%(+0.500)#287 | 5.0%(-1.80)#8,558 |
| 21. | 68108 | 4.2% | 2.7%(+1.50)#331 | 5.0%(-0.800)#12,807 |
| 22. | 68105 | 4.7% | 2.7%(+2.00)#340 | 5.0%(-0.300)#14,620 |
| 23. | 68178 | 4.8% | 2.7%(+2.10)#345 | 5.0%(-0.200)#15,133 |
| 24. | 68102 | 5.0% | 2.7%(+2.30)#349 | 5.0%(=0.000)#15,752 |
| 25. | 68131 | 5.5% | 2.7%(+2.80)#356 | 5.0%(+0.500)#17,275 |
| 26. | 68104 | 5.7% | 2.7%(+3.00)#362 | 5.0%(+0.700)#17,767 |
| 27. | 68107 | 6.3% | 2.7%(+3.60)#371 | 5.0%(+1.30)#19,263 |
| 28. | 68112 | 7.2% | 2.7%(+4.50)#380 | 5.0%(+2.20)#21,072 |
| 29. | 68157 | 7.2% | 2.7%(+4.50)#381 | 5.0%(+2.20)#21,087 |
| 30. | 68111 | 10.4% | 2.7%(+7.70)#397 | 5.0%(+5.40)#24,329 |
| 31. | 68110 | 10.8% | 2.7%(+8.10)#399 | 5.0%(+5.80)#24,560 |
1
Common Questions
What are the Top 10 Zip Codes with the Lowest Unemployment Rate in Omaha, NE?
Top 10 Zip Codes with the Lowest Unemployment Rate in Omaha, NE are:
What zip code has the Lowest Unemployment Rate in Omaha, NE?
68142 has the Lowest Unemployment Rate in Omaha, NE with 0.20%.
What is the Unemployment Rate in Omaha, NE?
Unemployment Rate in Omaha is 3.6%.
What is the Unemployment Rate in Nebraska?
Unemployment Rate in Nebraska is 2.7%.
What is the Unemployment Rate in the United States?
Unemployment Rate in the United States is 5.0%.