Zip Codes with the Highest Percentage of Households with Income Below $10,000 in Iowa
RELATED REPORTS & OPTIONS
Household Income | $0-10k
Iowa
Compare Zip Codes
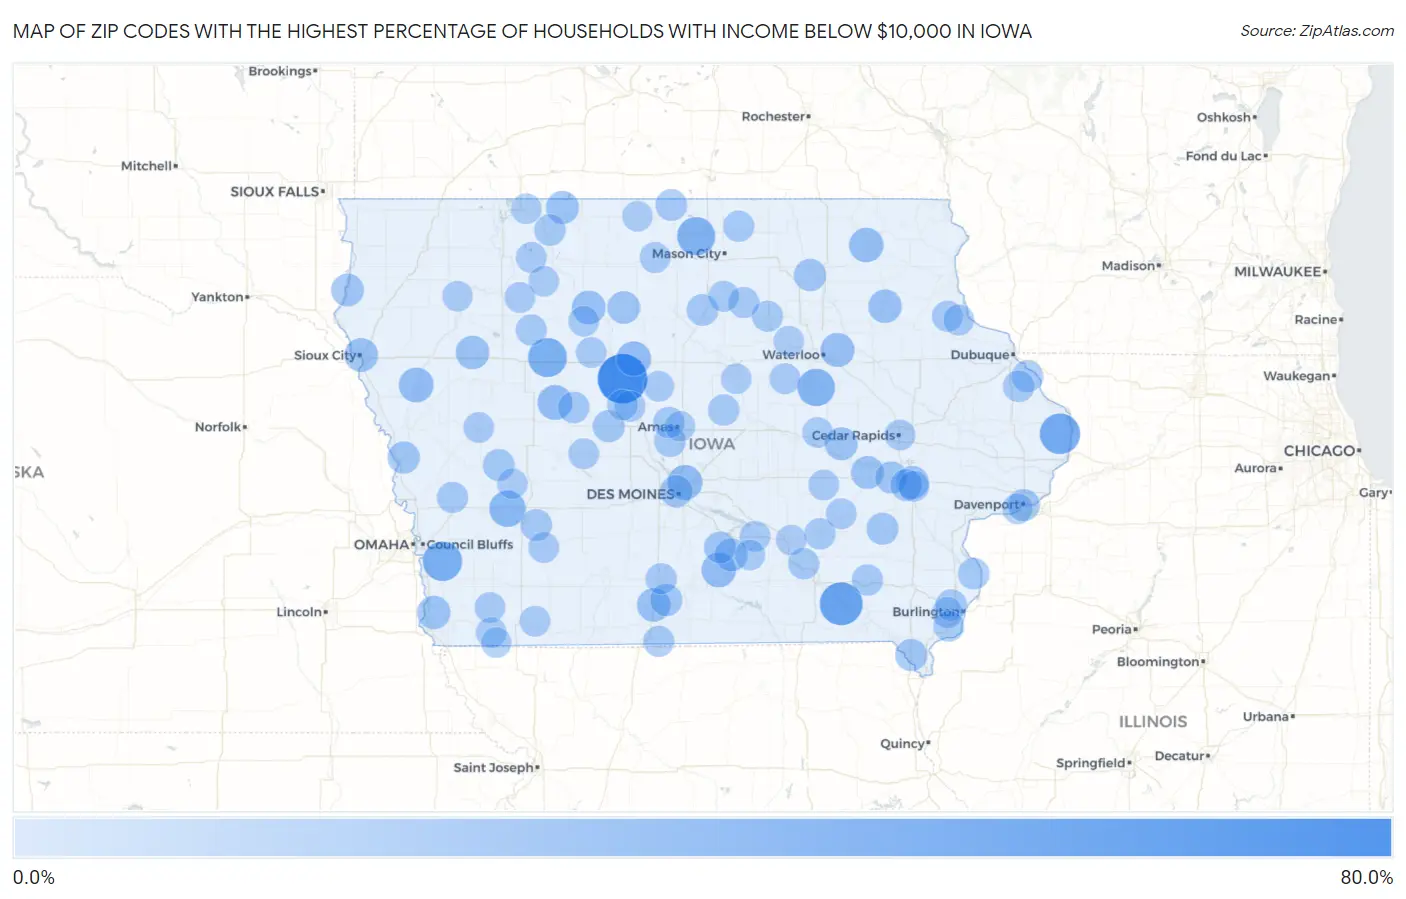
Map of Zip Codes with the Highest Percentage of Households with Income Below $10,000 in Iowa
0.0%
80.0%
Zip Codes with the Highest Percentage of Households with Income Below $10,000 in Iowa
| Zip Code | Households with Income < $10k | vs State | vs National | |
| 1. | 50521 | 76.5% | 4.2%(+72.3)#1 | 4.9%(+71.6)#48 |
| 2. | 52588 | 52.4% | 4.2%(+48.2)#2 | 4.9%(+47.5)#101 |
| 3. | 52701 | 43.5% | 4.2%(+39.3)#3 | 4.9%(+38.6)#148 |
| 4. | 51554 | 39.3% | 4.2%(+35.1)#4 | 4.9%(+34.4)#178 |
| 5. | 50551 | 37.9% | 4.2%(+33.7)#5 | 4.9%(+33.0)#190 |
| 6. | 50434 | 35.2% | 4.2%(+31.0)#6 | 4.9%(+30.3)#215 |
| 7. | 50612 | 32.6% | 4.2%(+28.4)#7 | 4.9%(+27.7)#278 |
| 8. | 51552 | 28.8% | 4.2%(+24.6)#8 | 4.9%(+23.9)#353 |
| 9. | 50032 | 23.8% | 4.2%(+19.6)#9 | 4.9%(+18.9)#544 |
| 10. | 51451 | 23.5% | 4.2%(+19.3)#10 | 4.9%(+18.6)#563 |
| 11. | 50532 | 23.2% | 4.2%(+19.0)#11 | 4.9%(+18.3)#581 |
| 12. | 51044 | 23.2% | 4.2%(+19.0)#12 | 4.9%(+18.3)#583 |
| 13. | 50272 | 22.6% | 4.2%(+18.4)#13 | 4.9%(+17.7)#606 |
| 14. | 52168 | 22.1% | 4.2%(+17.9)#14 | 4.9%(+17.2)#635 |
| 15. | 50623 | 20.5% | 4.2%(+16.3)#15 | 4.9%(+15.6)#753 |
| 16. | 51101 | 19.4% | 4.2%(+15.2)#16 | 4.9%(+14.5)#855 |
| 17. | 50520 | 19.4% | 4.2%(+15.2)#17 | 4.9%(+14.5)#863 |
| 18. | 50262 | 18.9% | 4.2%(+14.7)#18 | 4.9%(+14.0)#915 |
| 19. | 51020 | 18.8% | 4.2%(+14.6)#19 | 4.9%(+13.9)#921 |
| 20. | 52142 | 18.3% | 4.2%(+14.1)#20 | 4.9%(+13.4)#975 |
| 21. | 51654 | 18.1% | 4.2%(+13.9)#21 | 4.9%(+13.2)#1,019 |
| 22. | 52334 | 17.2% | 4.2%(+13.0)#22 | 4.9%(+12.3)#1,133 |
| 23. | 52242 | 17.1% | 4.2%(+12.9)#23 | 4.9%(+12.2)#1,138 |
| 24. | 50531 | 17.1% | 4.2%(+12.9)#24 | 4.9%(+12.2)#1,149 |
| 25. | 50057 | 16.7% | 4.2%(+12.5)#25 | 4.9%(+11.8)#1,217 |
| 26. | 52257 | 16.7% | 4.2%(+12.5)#26 | 4.9%(+11.8)#1,218 |
| 27. | 51011 | 15.6% | 4.2%(+11.4)#27 | 4.9%(+10.7)#1,420 |
| 28. | 50545 | 15.5% | 4.2%(+11.3)#28 | 4.9%(+10.6)#1,437 |
| 29. | 50645 | 14.6% | 4.2%(+10.4)#29 | 4.9%(+9.70)#1,628 |
| 30. | 50314 | 14.5% | 4.2%(+10.3)#30 | 4.9%(+9.60)#1,645 |
| 31. | 50264 | 14.4% | 4.2%(+10.2)#31 | 4.9%(+9.50)#1,681 |
| 32. | 51545 | 14.2% | 4.2%(+10.00)#32 | 4.9%(+9.30)#1,736 |
| 33. | 52619 | 14.1% | 4.2%(+9.90)#33 | 4.9%(+9.20)#1,756 |
| 34. | 50107 | 13.7% | 4.2%(+9.50)#34 | 4.9%(+8.80)#1,863 |
| 35. | 52801 | 13.6% | 4.2%(+9.40)#35 | 4.9%(+8.70)#1,892 |
| 36. | 52322 | 13.5% | 4.2%(+9.30)#36 | 4.9%(+8.60)#1,929 |
| 37. | 50062 | 13.3% | 4.2%(+9.10)#37 | 4.9%(+8.40)#1,989 |
| 38. | 52359 | 13.3% | 4.2%(+9.10)#38 | 4.9%(+8.40)#1,993 |
| 39. | 52246 | 12.9% | 4.2%(+8.70)#39 | 4.9%(+8.00)#2,111 |
| 40. | 51446 | 12.8% | 4.2%(+8.60)#40 | 4.9%(+7.90)#2,181 |
| 41. | 50274 | 12.6% | 4.2%(+8.40)#41 | 4.9%(+7.70)#2,249 |
| 42. | 50452 | 12.5% | 4.2%(+8.30)#42 | 4.9%(+7.60)#2,268 |
| 43. | 52071 | 12.2% | 4.2%(+8.00)#43 | 4.9%(+7.30)#2,401 |
| 44. | 50473 | 12.0% | 4.2%(+7.80)#44 | 4.9%(+7.10)#2,494 |
| 45. | 50134 | 11.8% | 4.2%(+7.60)#45 | 4.9%(+6.90)#2,565 |
| 46. | 50050 | 11.7% | 4.2%(+7.50)#46 | 4.9%(+6.80)#2,608 |
| 47. | 52054 | 11.3% | 4.2%(+7.10)#47 | 4.9%(+6.40)#2,815 |
| 48. | 51365 | 11.3% | 4.2%(+7.10)#48 | 4.9%(+6.40)#2,821 |
| 49. | 50239 | 11.3% | 4.2%(+7.10)#49 | 4.9%(+6.40)#2,830 |
| 50. | 52646 | 11.2% | 4.2%(+7.00)#50 | 4.9%(+6.30)#2,878 |
| 51. | 52655 | 11.1% | 4.2%(+6.90)#51 | 4.9%(+6.20)#2,903 |
| 52. | 52550 | 10.9% | 4.2%(+6.70)#52 | 4.9%(+6.00)#3,040 |
| 53. | 50014 | 10.8% | 4.2%(+6.60)#53 | 4.9%(+5.90)#3,058 |
| 54. | 52556 | 10.7% | 4.2%(+6.50)#54 | 4.9%(+5.80)#3,123 |
| 55. | 52566 | 10.7% | 4.2%(+6.50)#55 | 4.9%(+5.80)#3,161 |
| 56. | 51563 | 10.5% | 4.2%(+6.30)#56 | 4.9%(+5.60)#3,271 |
| 57. | 50440 | 10.4% | 4.2%(+6.20)#57 | 4.9%(+5.50)#3,350 |
| 58. | 50213 | 10.3% | 4.2%(+6.10)#58 | 4.9%(+5.40)#3,375 |
| 59. | 50065 | 10.2% | 4.2%(+6.00)#59 | 4.9%(+5.30)#3,478 |
| 60. | 52048 | 10.2% | 4.2%(+6.00)#60 | 4.9%(+5.30)#3,483 |
| 61. | 50602 | 10.1% | 4.2%(+5.90)#61 | 4.9%(+5.20)#3,541 |
| 62. | 50605 | 10.1% | 4.2%(+5.90)#62 | 4.9%(+5.20)#3,562 |
| 63. | 50593 | 10.0% | 4.2%(+5.80)#63 | 4.9%(+5.10)#3,636 |
| 64. | 50423 | 9.8% | 4.2%(+5.60)#64 | 4.9%(+4.90)#3,760 |
| 65. | 50475 | 9.8% | 4.2%(+5.60)#65 | 4.9%(+4.90)#3,768 |
| 66. | 52052 | 9.6% | 4.2%(+5.40)#66 | 4.9%(+4.70)#3,912 |
| 67. | 50853 | 9.6% | 4.2%(+5.40)#67 | 4.9%(+4.70)#3,929 |
| 68. | 50223 | 9.6% | 4.2%(+5.40)#68 | 4.9%(+4.70)#3,938 |
| 69. | 50657 | 9.6% | 4.2%(+5.40)#69 | 4.9%(+4.70)#3,944 |
| 70. | 52240 | 9.3% | 4.2%(+5.10)#70 | 4.9%(+4.40)#4,093 |
| 71. | 51358 | 9.2% | 4.2%(+5.00)#71 | 4.9%(+4.30)#4,268 |
| 72. | 52638 | 9.2% | 4.2%(+5.00)#72 | 4.9%(+4.30)#4,285 |
| 73. | 52355 | 9.2% | 4.2%(+5.00)#73 | 4.9%(+4.30)#4,289 |
| 74. | 50040 | 9.2% | 4.2%(+5.00)#74 | 4.9%(+4.30)#4,292 |
| 75. | 51442 | 9.1% | 4.2%(+4.90)#75 | 4.9%(+4.20)#4,325 |
| 76. | 50541 | 9.0% | 4.2%(+4.80)#76 | 4.9%(+4.10)#4,465 |
| 77. | 50246 | 9.0% | 4.2%(+4.80)#77 | 4.9%(+4.10)#4,473 |
| 78. | 50026 | 9.0% | 4.2%(+4.80)#78 | 4.9%(+4.10)#4,481 |
| 79. | 52401 | 8.9% | 4.2%(+4.70)#79 | 4.9%(+4.00)#4,554 |
| 80. | 50565 | 8.9% | 4.2%(+4.70)#80 | 4.9%(+4.00)#4,587 |
| 81. | 52221 | 8.9% | 4.2%(+4.70)#81 | 4.9%(+4.00)#4,588 |
| 82. | 50119 | 8.9% | 4.2%(+4.70)#82 | 4.9%(+4.00)#4,589 |
| 83. | 50518 | 8.9% | 4.2%(+4.70)#83 | 4.9%(+4.00)#4,591 |
| 84. | 52658 | 8.8% | 4.2%(+4.60)#84 | 4.9%(+3.90)#4,684 |
| 85. | 51638 | 8.7% | 4.2%(+4.50)#85 | 4.9%(+3.80)#4,782 |
| 86. | 51646 | 8.7% | 4.2%(+4.50)#86 | 4.9%(+3.80)#4,794 |
| 87. | 50527 | 8.7% | 4.2%(+4.50)#87 | 4.9%(+3.80)#4,810 |
| 88. | 52802 | 8.5% | 4.2%(+4.30)#88 | 4.9%(+3.60)#4,944 |
| 89. | 51543 | 8.5% | 4.2%(+4.30)#89 | 4.9%(+3.60)#5,005 |
| 90. | 50627 | 8.3% | 4.2%(+4.10)#90 | 4.9%(+3.40)#5,213 |
| 91. | 52595 | 8.3% | 4.2%(+4.10)#91 | 4.9%(+3.40)#5,267 |
| 92. | 50424 | 8.1% | 4.2%(+3.90)#92 | 4.9%(+3.20)#5,504 |
| 93. | 50660 | 8.1% | 4.2%(+3.90)#93 | 4.9%(+3.20)#5,508 |
| 94. | 51636 | 8.1% | 4.2%(+3.90)#94 | 4.9%(+3.20)#5,522 |
| 95. | 50116 | 8.1% | 4.2%(+3.90)#95 | 4.9%(+3.20)#5,535 |
| 96. | 52348 | 8.1% | 4.2%(+3.90)#96 | 4.9%(+3.20)#5,540 |
| 97. | 50010 | 8.0% | 4.2%(+3.80)#97 | 4.9%(+3.10)#5,553 |
| 98. | 51029 | 8.0% | 4.2%(+3.80)#98 | 4.9%(+3.10)#5,655 |
| 99. | 51630 | 8.0% | 4.2%(+3.80)#99 | 4.9%(+3.10)#5,661 |
| 100. | 51363 | 7.9% | 4.2%(+3.70)#100 | 4.9%(+3.00)#5,786 |
Common Questions
What are the Top 10 Zip Codes with the Highest Percentage of Households with Income Below $10,000 in Iowa?
Top 10 Zip Codes with the Highest Percentage of Households with Income Below $10,000 in Iowa are:
What zip code has the Highest Percentage of Households with Income Below $10,000 in Iowa?
50521 has the Highest Percentage of Households with Income Below $10,000 in Iowa with 76.5%.
What is the Percentage of Households with Income Below $10,000 in the State of Iowa?
Percentage of Households with Income Below $10,000 in Iowa is 4.2%.
What is the Percentage of Households with Income Below $10,000 in the United States?
Percentage of Households with Income Below $10,000 in the United States is 4.9%.