Zip Codes with the Highest Percentage of Population with a Degree in Engineering in Omaha, NE

RELATED REPORTS & OPTIONS

Engineering
Population
Families and Households
Female Fertility
Female Fertility (Unmarried)
Race (Community Size)
Race (Percentage)
Ancestry (Community Size)
AfghanAfricanAlbanianAleutAmericanApacheArabArapahoArgentineanArmenianAustralianAustrianBangladeshiBasqueBelgianBhutaneseBlackfeetBolivianBrazilianBritishBulgarianBurmeseCajunCambodianCanadianCarpatho RusynCentral AmericanCentral American IndianCherokeeChickasawChileanChineseChippewaChoctawColombianComancheCosta RicanCreekCroatianCubanCzechCzechoslovakianDanishDominicanDutchEastern EuropeanEcuadorianEgyptianEnglishEthiopianEuropeanFilipinoFinnishFrenchFrench American IndianFrench CanadianGermanGerman RussianGhanaianGreekGuamanian / ChamorroGuatemalanGuyaneseHaitianHonduranHungarianIcelanderIndian (Asian)IndonesianInupiatIranianIraqiIrishIroquoisIsraeliItalianJamaicanJapaneseJordanianKenyanKiowaKoreanLaotianLatvianLebaneseLithuanianLuxembourgerMacedonianMalaysianMexicanMexican American IndianMoroccanNative HawaiianNavajoNicaraguanNigerianNorthern EuropeanNorwegianPakistaniPalestinianPanamanianPennsylvania GermanPeruvianPolishPortuguesePotawatomiPuebloPuerto RicanRomanianRussianSalvadoranSamoanScandinavianScotch-IrishScottishSeminoleSerbianSiouxSlavicSlovakSloveneSomaliSouth AfricanSouth AmericanSpaniardSpanishSri LankanSubsaharan AfricanSudaneseSwedishSwissSyrianThaiTlingit-HaidaTrinidadian and TobagonianTurkishUkrainianVenezuelanVietnameseWelshWest IndianYugoslavianZimbabwean
Ancestry (Percentage)
AfghanAfricanAlbanianAleutAmericanApacheArabArapahoArgentineanArmenianAustralianAustrianBangladeshiBasqueBelgianBhutaneseBlackfeetBolivianBrazilianBritishBulgarianBurmeseCajunCambodianCanadianCarpatho RusynCentral AmericanCentral American IndianCherokeeChickasawChileanChineseChippewaChoctawColombianComancheCosta RicanCreekCroatianCubanCzechCzechoslovakianDanishDominicanDutchEastern EuropeanEcuadorianEgyptianEnglishEthiopianEuropeanFilipinoFinnishFrenchFrench American IndianFrench CanadianGermanGerman RussianGhanaianGreekGuamanian / ChamorroGuatemalanGuyaneseHaitianHonduranHungarianIcelanderIndian (Asian)IndonesianInupiatIranianIraqiIrishIroquoisIsraeliItalianJamaicanJapaneseJordanianKenyanKiowaKoreanLaotianLatvianLebaneseLithuanianLuxembourgerMacedonianMalaysianMexicanMexican American IndianMoroccanNative HawaiianNavajoNicaraguanNigerianNorthern EuropeanNorwegianPakistaniPalestinianPanamanianPennsylvania GermanPeruvianPolishPortuguesePotawatomiPuebloPuerto RicanRomanianRussianSalvadoranSamoanScandinavianScotch-IrishScottishSeminoleSerbianSiouxSlavicSlovakSloveneSomaliSouth AfricanSouth AmericanSpaniardSpanishSri LankanSubsaharan AfricanSudaneseSwedishSwissSyrianThaiTlingit-HaidaTrinidadian and TobagonianTurkishUkrainianVenezuelanVietnameseWelshWest IndianYugoslavianZimbabwean
Immigrant Origin (Total)
AfghanistanAfricaArgentinaAsiaAustraliaBangladeshBarbadosBelarusBosnia and HerzegovinaBrazilBurma / MyanmarCameroonCanadaCaribbeanCentral AmericaChileChinaColombiaCongoCosta RicaCroatiaCubaCzechoslovakiaDominican RepublicEastern AfricaEastern AsiaEastern EuropeEgyptEl SalvadorEnglandEthiopiaEuropeFranceGermanyGhanaGreeceGuatemalaHondurasHong KongHungaryIndiaIndonesiaIranIraqIrelandIsraelItalyJamaicaJapanJordanKazakhstanKenyaKoreaKuwaitLaosLatin AmericaLatviaLithuaniaMalaysiaMexicoMiddle AfricaMoroccoNepalNetherlandsNicaraguaNigeriaNorthern AfricaNorthern EuropeOceaniaPakistanPanamaPeruPhilippinesPolandPortugalRomaniaRussiaSaudi ArabiaScotlandSierra LeoneSomaliaSouth AfricaSouth AmericaSouth Central AsiaSouth Eastern AsiaSouthern EuropeSpainSri LankaSudanSyriaTaiwanThailandTrinidad and TobagoTurkeyUgandaUkraineVenezuelaVietnamWestern AfricaWestern AsiaWestern EuropeZaireZimbabwe
Immigrant Origin (Percentage)
AfghanistanAfricaArgentinaAsiaAustraliaBangladeshBarbadosBelarusBosnia and HerzegovinaBrazilBurma / MyanmarCameroonCanadaCaribbeanCentral AmericaChileChinaColombiaCongoCosta RicaCroatiaCubaCzechoslovakiaDominican RepublicEastern AfricaEastern AsiaEastern EuropeEgyptEl SalvadorEnglandEthiopiaEuropeFranceGermanyGhanaGreeceGuatemalaHondurasHong KongHungaryIndiaIndonesiaIranIraqIrelandIsraelItalyJamaicaJapanJordanKazakhstanKenyaKoreaKuwaitLaosLatin AmericaLatviaLithuaniaMalaysiaMexicoMiddle AfricaMoroccoNepalNetherlandsNicaraguaNigeriaNorthern AfricaNorthern EuropeOceaniaPakistanPanamaPeruPhilippinesPolandPortugalRomaniaRussiaSaudi ArabiaScotlandSierra LeoneSomaliaSouth AfricaSouth AmericaSouth Central AsiaSouth Eastern AsiaSouthern EuropeSpainSri LankaSudanSyriaTaiwanThailandTrinidad and TobagoTurkeyUgandaUkraineVenezuelaVietnamWestern AfricaWestern AsiaWestern EuropeZaireZimbabwe
Income
Income (Families)
Income (Households)
Poverty
Poverty (Families)
Unemployment
Employment Occupations
Employment Industries
Employer Class
Commute Time
Commute Means
School Enrollment
Education by Degree Field
Occupancy
Finances
Physical Characteristics
Omaha
Compare Zip Codes
Comparison Subject

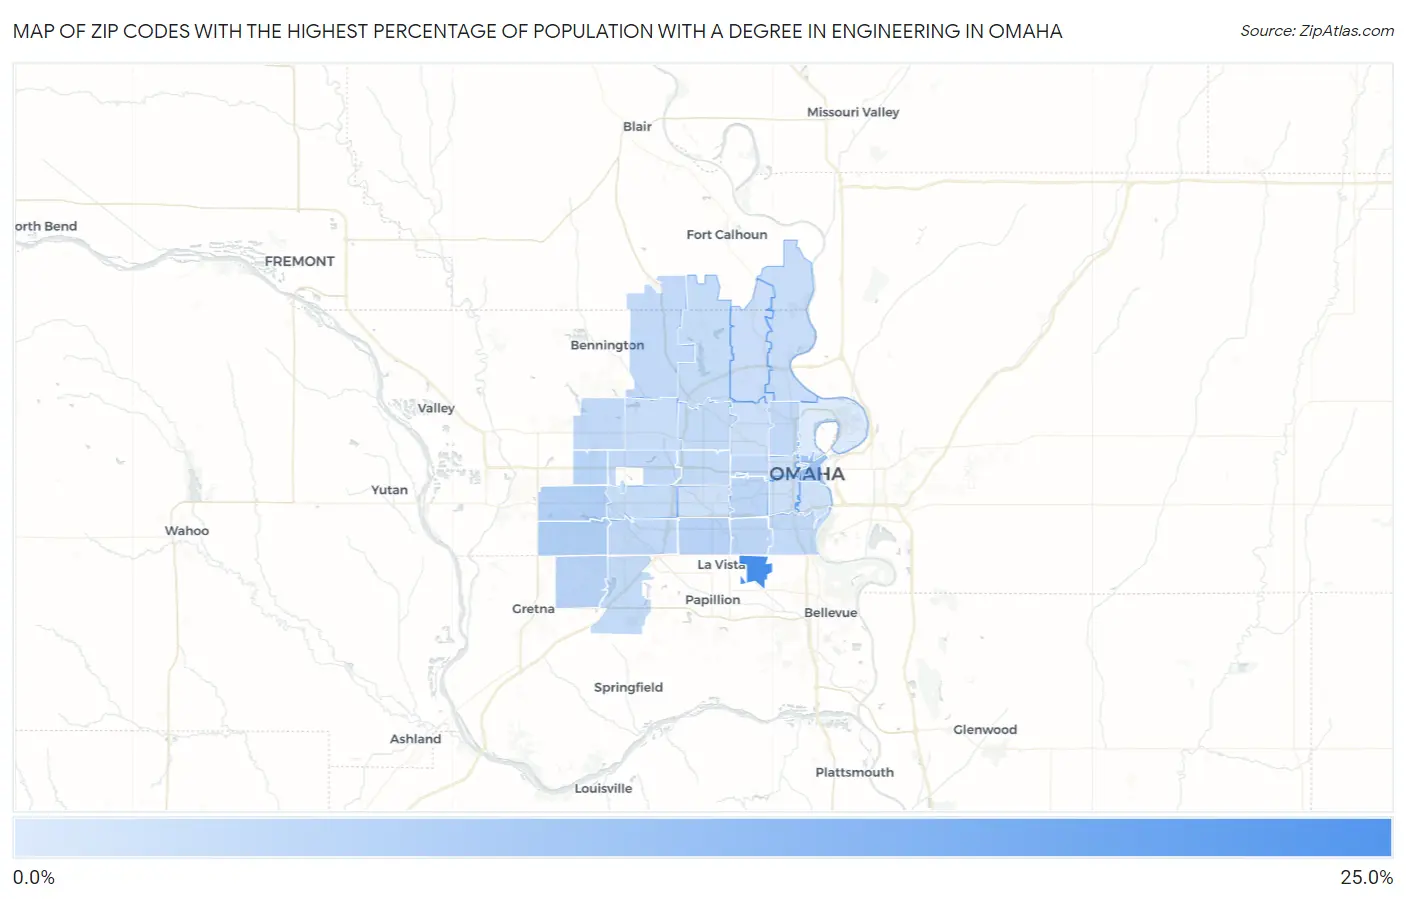
Map of Zip Codes with the Highest Percentage of Population with a Degree in Engineering in Omaha

0.0%
25.0%
Zip Codes with the Highest Percentage of Population with a Degree in Engineering in Omaha Map

Zip Codes with the Highest Percentage of Population with a Degree in Engineering in Omaha, NE

Zip Code % Graduates vs State vs National
1.6815721.6%4.2%(+17.4)#107.6%(+13.9)#753
2.681028.5%4.2%(+4.30)#467.6%(+0.857)#6,274
3.681356.4%4.2%(+2.19)#767.6%(-1.26)#10,254
4.681306.1%4.2%(+1.87)#827.6%(-1.58)#11,015
5.681275.7%4.2%(+1.48)#897.6%(-1.97)#11,998
6.681365.6%4.2%(+1.37)#917.6%(-2.08)#12,277
7.681185.3%4.2%(+1.14)#977.6%(-2.31)#12,833
8.681065.1%4.2%(+0.900)#1027.6%(-2.55)#13,438
9.681175.0%4.2%(+0.843)#1037.6%(-2.60)#13,567
10.681544.5%4.2%(+0.282)#1247.6%(-3.17)#15,095
11.681074.5%4.2%(+0.265)#1257.6%(-3.18)#15,148
12.681164.5%4.2%(+0.253)#1267.6%(-3.19)#15,181
13.681114.4%4.2%(+0.237)#1277.6%(-3.21)#15,227
14.681374.3%4.2%(+0.120)#1317.6%(-3.33)#15,519
15.681424.3%4.2%(+0.052)#1357.6%(-3.40)#15,678
16.681324.2%4.2%(+0.021)#1377.6%(-3.43)#15,758
17.681144.0%4.2%(-0.191)#1477.6%(-3.64)#16,323
18.681384.0%4.2%(-0.193)#1487.6%(-3.64)#16,326
19.681344.0%4.2%(-0.233)#1507.6%(-3.68)#16,439
20.681443.7%4.2%(-0.515)#1577.6%(-3.96)#17,201
21.681223.7%4.2%(-0.534)#1607.6%(-3.98)#17,244
22.681123.6%4.2%(-0.628)#1647.6%(-4.08)#17,465
23.681643.5%4.2%(-0.717)#1677.6%(-4.16)#17,690
24.681523.0%4.2%(-1.16)#1887.6%(-4.60)#18,791
25.681052.9%4.2%(-1.25)#1977.6%(-4.70)#19,027
26.681312.8%4.2%(-1.36)#1997.6%(-4.81)#19,210
27.681042.8%4.2%(-1.40)#2037.6%(-4.85)#19,308
28.681242.6%4.2%(-1.56)#2097.6%(-5.01)#19,663
29.681082.5%4.2%(-1.73)#2177.6%(-5.18)#20,026
30.681100.82%4.2%(-3.38)#2957.6%(-6.82)#22,850

Common Questions

What are the Top 10 Zip Codes with the Highest Percentage of Population with a Degree in Engineering in Omaha, NE?
Top 10 Zip Codes with the Highest Percentage of Population with a Degree in Engineering in Omaha, NE are:
#1
21.6%
#2
8.5%
#3
6.4%
#4
6.1%
#5
5.7%
#6
5.6%
#7
5.3%
#8
5.1%
#9
5.0%
#10
4.5%
What zip code has the Highest Percentage of Population with a Degree in Engineering in Omaha, NE?
68157 has the Highest Percentage of Population with a Degree in Engineering in Omaha, NE with 21.6%.
What is the Percentage of Population with a Degree in Engineering in Omaha, NE?
Percentage of Population with a Degree in Engineering in Omaha is 4.3%.
What is the Percentage of Population with a Degree in Engineering in Nebraska?
Percentage of Population with a Degree in Engineering in Nebraska is 4.2%.
What is the Percentage of Population with a Degree in Engineering in the United States?
Percentage of Population with a Degree in Engineering in the United States is 7.6%.