Zip Codes with the Largest Scotch-Irish Community in Omaha, NE

RELATED REPORTS & OPTIONS

Scotch-Irish
Population
Families and Households
Female Fertility
Female Fertility (Unmarried)
Race (Community Size)
Race (Percentage)
Ancestry (Community Size)
AfghanAfricanAlbanianAleutAmericanApacheArabArapahoArgentineanArmenianAustralianAustrianBangladeshiBasqueBelgianBhutaneseBlackfeetBolivianBrazilianBritishBulgarianBurmeseCajunCambodianCanadianCarpatho RusynCentral AmericanCentral American IndianCherokeeChickasawChileanChineseChippewaChoctawColombianComancheCosta RicanCreekCroatianCubanCzechCzechoslovakianDanishDominicanDutchEastern EuropeanEcuadorianEgyptianEnglishEthiopianEuropeanFilipinoFinnishFrenchFrench American IndianFrench CanadianGermanGerman RussianGhanaianGreekGuamanian / ChamorroGuatemalanGuyaneseHaitianHonduranHungarianIcelanderIndian (Asian)IndonesianInupiatIranianIraqiIrishIroquoisIsraeliItalianJamaicanJapaneseJordanianKenyanKiowaKoreanLaotianLatvianLebaneseLithuanianLuxembourgerMacedonianMalaysianMexicanMexican American IndianMoroccanNative HawaiianNavajoNicaraguanNigerianNorthern EuropeanNorwegianPakistaniPalestinianPanamanianPennsylvania GermanPeruvianPolishPortuguesePotawatomiPuebloPuerto RicanRomanianRussianSalvadoranSamoanScandinavianScotch-IrishScottishSeminoleSerbianSiouxSlavicSlovakSloveneSomaliSouth AfricanSouth AmericanSpaniardSpanishSri LankanSubsaharan AfricanSudaneseSwedishSwissSyrianThaiTlingit-HaidaTrinidadian and TobagonianTurkishUkrainianVenezuelanVietnameseWelshWest IndianYugoslavianZimbabwean
Ancestry (Percentage)
AfghanAfricanAlbanianAleutAmericanApacheArabArapahoArgentineanArmenianAustralianAustrianBangladeshiBasqueBelgianBhutaneseBlackfeetBolivianBrazilianBritishBulgarianBurmeseCajunCambodianCanadianCarpatho RusynCentral AmericanCentral American IndianCherokeeChickasawChileanChineseChippewaChoctawColombianComancheCosta RicanCreekCroatianCubanCzechCzechoslovakianDanishDominicanDutchEastern EuropeanEcuadorianEgyptianEnglishEthiopianEuropeanFilipinoFinnishFrenchFrench American IndianFrench CanadianGermanGerman RussianGhanaianGreekGuamanian / ChamorroGuatemalanGuyaneseHaitianHonduranHungarianIcelanderIndian (Asian)IndonesianInupiatIranianIraqiIrishIroquoisIsraeliItalianJamaicanJapaneseJordanianKenyanKiowaKoreanLaotianLatvianLebaneseLithuanianLuxembourgerMacedonianMalaysianMexicanMexican American IndianMoroccanNative HawaiianNavajoNicaraguanNigerianNorthern EuropeanNorwegianPakistaniPalestinianPanamanianPennsylvania GermanPeruvianPolishPortuguesePotawatomiPuebloPuerto RicanRomanianRussianSalvadoranSamoanScandinavianScotch-IrishScottishSeminoleSerbianSiouxSlavicSlovakSloveneSomaliSouth AfricanSouth AmericanSpaniardSpanishSri LankanSubsaharan AfricanSudaneseSwedishSwissSyrianThaiTlingit-HaidaTrinidadian and TobagonianTurkishUkrainianVenezuelanVietnameseWelshWest IndianYugoslavianZimbabwean
Immigrant Origin (Total)
AfghanistanAfricaArgentinaAsiaAustraliaBangladeshBarbadosBelarusBosnia and HerzegovinaBrazilBurma / MyanmarCameroonCanadaCaribbeanCentral AmericaChileChinaColombiaCongoCosta RicaCroatiaCubaCzechoslovakiaDominican RepublicEastern AfricaEastern AsiaEastern EuropeEgyptEl SalvadorEnglandEthiopiaEuropeFranceGermanyGhanaGreeceGuatemalaHondurasHong KongHungaryIndiaIndonesiaIranIraqIrelandIsraelItalyJamaicaJapanJordanKazakhstanKenyaKoreaKuwaitLaosLatin AmericaLatviaLithuaniaMalaysiaMexicoMiddle AfricaMoroccoNepalNetherlandsNicaraguaNigeriaNorthern AfricaNorthern EuropeOceaniaPakistanPanamaPeruPhilippinesPolandPortugalRomaniaRussiaSaudi ArabiaScotlandSierra LeoneSomaliaSouth AfricaSouth AmericaSouth Central AsiaSouth Eastern AsiaSouthern EuropeSpainSri LankaSudanSyriaTaiwanThailandTrinidad and TobagoTurkeyUgandaUkraineVenezuelaVietnamWestern AfricaWestern AsiaWestern EuropeZaireZimbabwe
Immigrant Origin (Percentage)
AfghanistanAfricaArgentinaAsiaAustraliaBangladeshBarbadosBelarusBosnia and HerzegovinaBrazilBurma / MyanmarCameroonCanadaCaribbeanCentral AmericaChileChinaColombiaCongoCosta RicaCroatiaCubaCzechoslovakiaDominican RepublicEastern AfricaEastern AsiaEastern EuropeEgyptEl SalvadorEnglandEthiopiaEuropeFranceGermanyGhanaGreeceGuatemalaHondurasHong KongHungaryIndiaIndonesiaIranIraqIrelandIsraelItalyJamaicaJapanJordanKazakhstanKenyaKoreaKuwaitLaosLatin AmericaLatviaLithuaniaMalaysiaMexicoMiddle AfricaMoroccoNepalNetherlandsNicaraguaNigeriaNorthern AfricaNorthern EuropeOceaniaPakistanPanamaPeruPhilippinesPolandPortugalRomaniaRussiaSaudi ArabiaScotlandSierra LeoneSomaliaSouth AfricaSouth AmericaSouth Central AsiaSouth Eastern AsiaSouthern EuropeSpainSri LankaSudanSyriaTaiwanThailandTrinidad and TobagoTurkeyUgandaUkraineVenezuelaVietnamWestern AfricaWestern AsiaWestern EuropeZaireZimbabwe
Income
Income (Families)
Income (Households)
Poverty
Poverty (Families)
Unemployment
Employment Occupations
Employment Industries
Employer Class
Commute Time
Commute Means
School Enrollment
Education by Degree Field
Occupancy
Finances
Physical Characteristics
Omaha
Compare Zip Codes
Comparison Subject

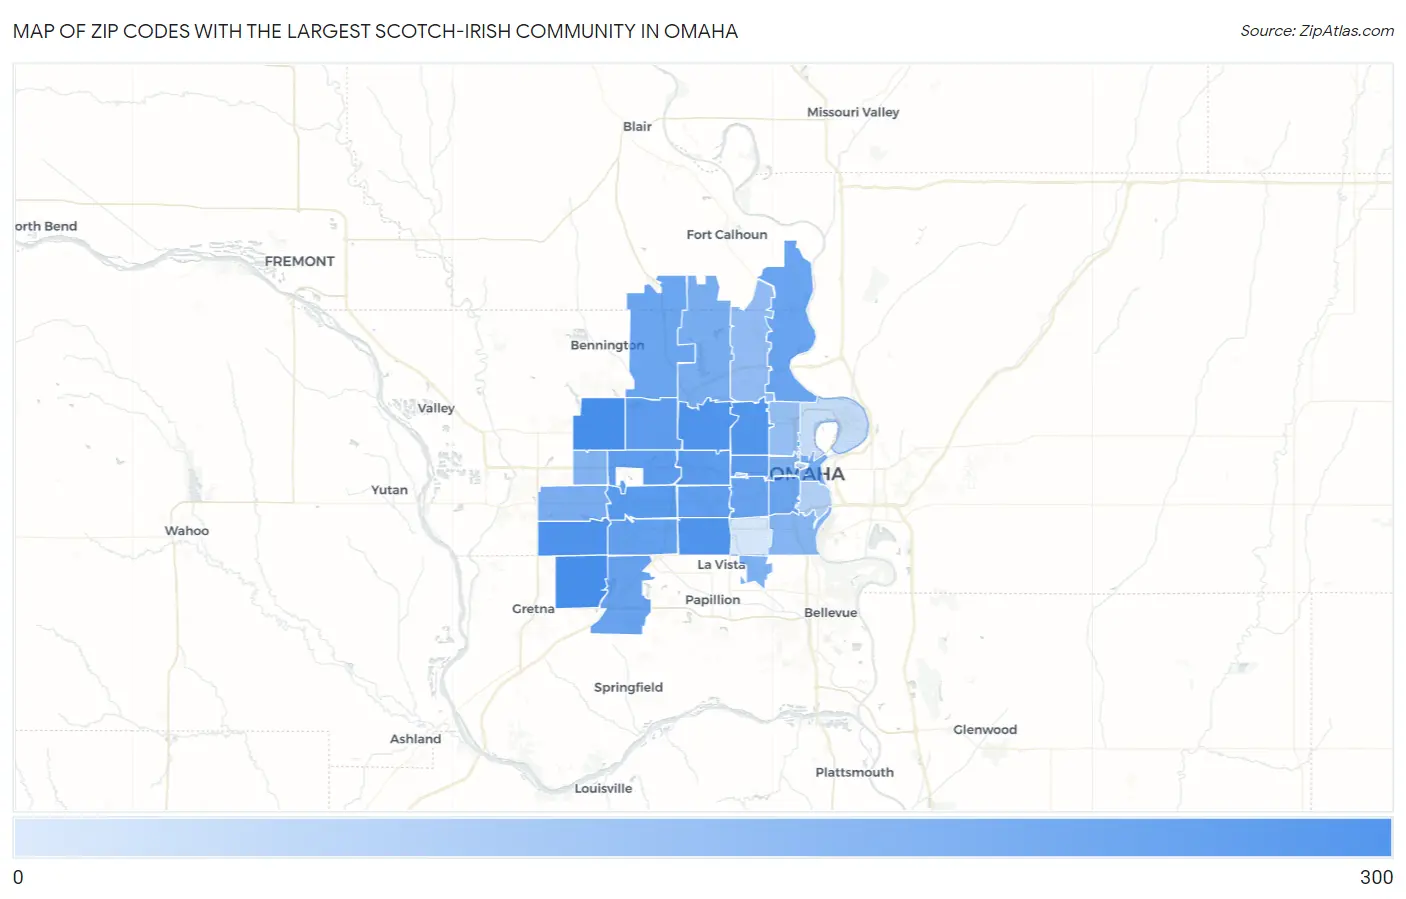
Map of Zip Codes with the Largest Scotch-Irish Community in Omaha

0
300
Zip Codes with the Largest Scotch-Irish Community in Omaha Map

Zip Codes with the Largest Scotch-Irish Community in Omaha, NE

Zip Code Scotch-Irish vs State vs National
1.6811629413,392(2.20%)#52,707,911(0.01%)#2,617
2.6813628613,392(2.14%)#62,707,911(0.01%)#2,714
3.6813523813,392(1.78%)#92,707,911(0.01%)#3,468
4.6813422413,392(1.67%)#112,707,911(0.01%)#3,779
5.6812722213,392(1.66%)#132,707,911(0.01%)#3,831
6.6810421013,392(1.57%)#152,707,911(0.01%)#4,054
7.6814417913,392(1.34%)#172,707,911(0.01%)#4,817
8.6811417013,392(1.27%)#212,707,911(0.01%)#5,080
9.6815415313,392(1.14%)#252,707,911(0.01%)#5,612
10.6816415013,392(1.12%)#262,707,911(0.01%)#5,719
11.6813215013,392(1.12%)#272,707,911(0.01%)#5,732
12.6812413913,392(1.04%)#302,707,911(0.01%)#6,127
13.6813713413,392(1.00%)#322,707,911(0.00%)#6,325
14.6810611813,392(0.88%)#352,707,911(0.00%)#6,929
15.6813811313,392(0.84%)#372,707,911(0.00%)#7,127
16.6811210613,392(0.79%)#402,707,911(0.00%)#7,441
17.6810510413,392(0.78%)#412,707,911(0.00%)#7,527
18.6814210013,392(0.75%)#432,707,911(0.00%)#7,731
19.681227513,392(0.56%)#582,707,911(0.00%)#9,202
20.681027213,392(0.54%)#602,707,911(0.00%)#9,412
21.681307013,392(0.52%)#612,707,911(0.00%)#9,528
22.681575813,392(0.43%)#622,707,911(0.00%)#10,523
23.681315513,392(0.41%)#632,707,911(0.00%)#10,765
24.681185213,392(0.39%)#702,707,911(0.00%)#11,038
25.681074813,392(0.36%)#732,707,911(0.00%)#11,401
26.681523513,392(0.26%)#852,707,911(0.00%)#13,005
27.681113113,392(0.23%)#912,707,911(0.00%)#13,530
28.681081313,392(0.10%)#1492,707,911(0.00%)#17,570
29.681781113,392(0.08%)#1702,707,911(0.00%)#18,387
30.68110713,392(0.05%)#2082,707,911(0.00%)#20,000
31.68117413,392(0.03%)#2642,707,911(0.00%)#21,502
32.68182313,392(0.02%)#3002,707,911(0.00%)#22,473

Common Questions

What are the Top 10 Zip Codes with the Largest Scotch-Irish Community in Omaha, NE?
Top 10 Zip Codes with the Largest Scotch-Irish Community in Omaha, NE are:
#1
294
#2
286
#3
238
#4
224
#5
222
#6
210
#7
179
#8
170
#9
153
#10
150
What zip code has the Largest Scotch-Irish Community in Omaha, NE?
68116 has the Largest Scotch-Irish Community in Omaha, NE with 294.
What is the Total Scotch-Irish Population in Omaha, NE?
Total Scotch-Irish Population in Omaha is 2,967.
What is the Total Scotch-Irish Population in Nebraska?
Total Scotch-Irish Population in Nebraska is 13,392.
What is the Total Scotch-Irish Population in the United States?
Total Scotch-Irish Population in the United States is 2,707,911.