Zip Codes with the Highest Percentage of Households with Income Below $10,000 in Alabama
RELATED REPORTS & OPTIONS
Household Income | $0-10k
Alabama
Compare Zip Codes
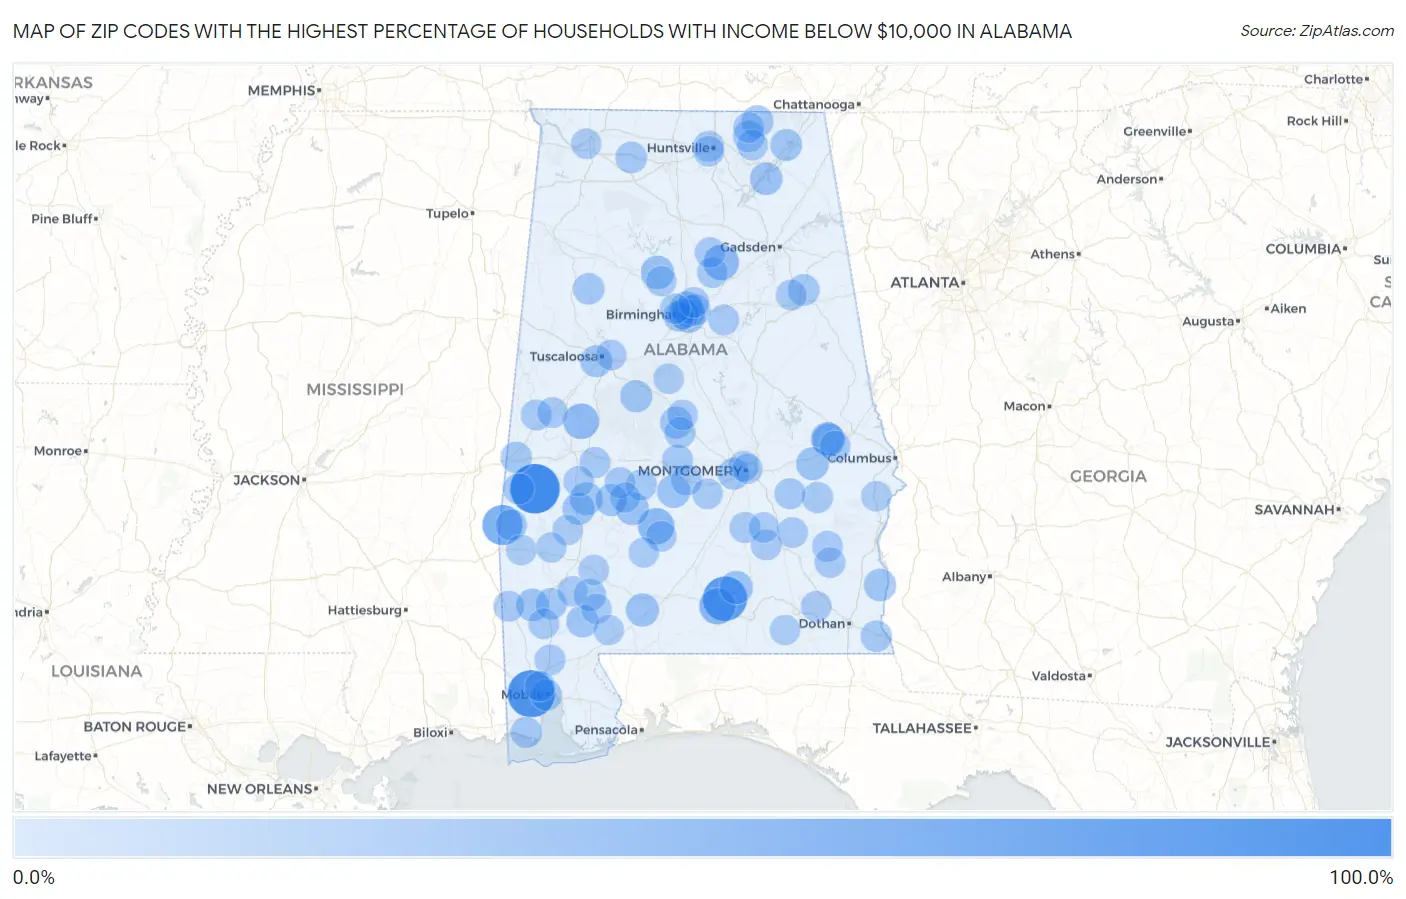
Map of Zip Codes with the Highest Percentage of Households with Income Below $10,000 in Alabama
0.0%
100.0%
Zip Codes with the Highest Percentage of Households with Income Below $10,000 in Alabama
| Zip Code | Households with Income < $10k | vs State | vs National | |
| 1. | 36910 | 100.0% | 6.5%(+93.5)#1 | 4.9%(+95.1)#28 |
| 2. | 36688 | 89.3% | 6.5%(+82.8)#2 | 4.9%(+84.4)#38 |
| 3. | 36038 | 76.0% | 6.5%(+69.5)#3 | 4.9%(+71.1)#49 |
| 4. | 36913 | 56.0% | 6.5%(+49.5)#4 | 4.9%(+51.1)#87 |
| 5. | 36476 | 38.9% | 6.5%(+32.4)#5 | 4.9%(+34.0)#181 |
| 6. | 36766 | 38.5% | 6.5%(+32.0)#6 | 4.9%(+33.6)#183 |
| 7. | 36776 | 35.1% | 6.5%(+28.6)#7 | 4.9%(+30.2)#217 |
| 8. | 35013 | 34.8% | 6.5%(+28.3)#8 | 4.9%(+29.9)#223 |
| 9. | 35584 | 25.8% | 6.5%(+19.3)#9 | 4.9%(+20.9)#452 |
| 10. | 36473 | 24.6% | 6.5%(+18.1)#10 | 4.9%(+19.7)#505 |
| 11. | 35233 | 24.5% | 6.5%(+18.0)#11 | 4.9%(+19.6)#506 |
| 12. | 36028 | 24.5% | 6.5%(+18.0)#12 | 4.9%(+19.6)#507 |
| 13. | 36775 | 24.3% | 6.5%(+17.8)#13 | 4.9%(+19.4)#519 |
| 14. | 36832 | 23.5% | 6.5%(+17.0)#14 | 4.9%(+18.6)#556 |
| 15. | 36865 | 23.5% | 6.5%(+17.0)#15 | 4.9%(+18.6)#564 |
| 16. | 36754 | 23.2% | 6.5%(+16.7)#16 | 4.9%(+18.3)#582 |
| 17. | 36723 | 23.1% | 6.5%(+16.6)#17 | 4.9%(+18.2)#588 |
| 18. | 36088 | 22.6% | 6.5%(+16.1)#18 | 4.9%(+17.7)#603 |
| 19. | 36583 | 21.6% | 6.5%(+15.1)#19 | 4.9%(+16.7)#659 |
| 20. | 35755 | 21.3% | 6.5%(+14.8)#20 | 4.9%(+16.4)#689 |
| 21. | 36736 | 20.3% | 6.5%(+13.8)#21 | 4.9%(+15.4)#773 |
| 22. | 36550 | 20.0% | 6.5%(+13.5)#22 | 4.9%(+15.1)#797 |
| 23. | 36373 | 19.9% | 6.5%(+13.4)#23 | 4.9%(+15.0)#808 |
| 24. | 35234 | 19.6% | 6.5%(+13.1)#24 | 4.9%(+14.7)#832 |
| 25. | 36790 | 19.6% | 6.5%(+13.1)#25 | 4.9%(+14.7)#836 |
| 26. | 35034 | 19.4% | 6.5%(+12.9)#26 | 4.9%(+14.5)#852 |
| 27. | 35401 | 19.2% | 6.5%(+12.7)#27 | 4.9%(+14.3)#876 |
| 28. | 36540 | 19.2% | 6.5%(+12.7)#28 | 4.9%(+14.3)#885 |
| 29. | 35207 | 18.9% | 6.5%(+12.4)#29 | 4.9%(+14.0)#907 |
| 30. | 36728 | 18.4% | 6.5%(+11.9)#30 | 4.9%(+13.5)#963 |
| 31. | 36108 | 18.0% | 6.5%(+11.5)#31 | 4.9%(+13.1)#1,022 |
| 32. | 35745 | 18.0% | 6.5%(+11.5)#32 | 4.9%(+13.1)#1,031 |
| 33. | 35752 | 17.7% | 6.5%(+11.2)#33 | 4.9%(+12.8)#1,059 |
| 34. | 36205 | 17.4% | 6.5%(+10.9)#34 | 4.9%(+12.5)#1,102 |
| 35. | 36907 | 17.1% | 6.5%(+10.6)#35 | 4.9%(+12.2)#1,141 |
| 36. | 35751 | 17.1% | 6.5%(+10.6)#36 | 4.9%(+12.2)#1,148 |
| 37. | 35618 | 17.0% | 6.5%(+10.5)#37 | 4.9%(+12.1)#1,164 |
| 38. | 35542 | 16.6% | 6.5%(+10.1)#38 | 4.9%(+11.7)#1,237 |
| 39. | 36581 | 16.6% | 6.5%(+10.1)#39 | 4.9%(+11.7)#1,240 |
| 40. | 36603 | 16.5% | 6.5%(+10.00)#40 | 4.9%(+11.6)#1,247 |
| 41. | 35212 | 16.2% | 6.5%(+9.70)#41 | 4.9%(+11.3)#1,292 |
| 42. | 36915 | 16.1% | 6.5%(+9.60)#42 | 4.9%(+11.2)#1,327 |
| 43. | 36370 | 15.8% | 6.5%(+9.30)#43 | 4.9%(+10.9)#1,383 |
| 44. | 36758 | 15.1% | 6.5%(+8.60)#44 | 4.9%(+10.2)#1,505 |
| 45. | 36912 | 14.9% | 6.5%(+8.40)#45 | 4.9%(+10.00)#1,549 |
| 46. | 36703 | 14.8% | 6.5%(+8.30)#46 | 4.9%(+9.90)#1,566 |
| 47. | 36509 | 14.7% | 6.5%(+8.20)#47 | 4.9%(+9.80)#1,600 |
| 48. | 36089 | 14.6% | 6.5%(+8.10)#48 | 4.9%(+9.70)#1,620 |
| 49. | 36785 | 14.6% | 6.5%(+8.10)#49 | 4.9%(+9.70)#1,633 |
| 50. | 35204 | 14.5% | 6.5%(+8.00)#50 | 4.9%(+9.60)#1,646 |
| 51. | 36830 | 14.4% | 6.5%(+7.90)#51 | 4.9%(+9.50)#1,664 |
| 52. | 36738 | 14.4% | 6.5%(+7.90)#52 | 4.9%(+9.50)#1,678 |
| 53. | 36029 | 14.3% | 6.5%(+7.80)#53 | 4.9%(+9.40)#1,700 |
| 54. | 36767 | 14.2% | 6.5%(+7.70)#54 | 4.9%(+9.30)#1,723 |
| 55. | 36041 | 14.0% | 6.5%(+7.50)#55 | 4.9%(+9.10)#1,773 |
| 56. | 35176 | 14.0% | 6.5%(+7.50)#56 | 4.9%(+9.10)#1,782 |
| 57. | 35816 | 13.9% | 6.5%(+7.40)#57 | 4.9%(+9.00)#1,797 |
| 58. | 35133 | 13.9% | 6.5%(+7.40)#58 | 4.9%(+9.00)#1,803 |
| 59. | 35464 | 13.9% | 6.5%(+7.40)#59 | 4.9%(+9.00)#1,814 |
| 60. | 36505 | 13.7% | 6.5%(+7.20)#60 | 4.9%(+8.80)#1,860 |
| 61. | 36773 | 13.7% | 6.5%(+7.20)#61 | 4.9%(+8.80)#1,867 |
| 62. | 36201 | 13.6% | 6.5%(+7.10)#62 | 4.9%(+8.70)#1,877 |
| 63. | 36081 | 13.5% | 6.5%(+7.00)#63 | 4.9%(+8.60)#1,911 |
| 64. | 36048 | 13.4% | 6.5%(+6.90)#64 | 4.9%(+8.50)#1,955 |
| 65. | 35774 | 13.3% | 6.5%(+6.80)#65 | 4.9%(+8.40)#1,995 |
| 66. | 36035 | 13.1% | 6.5%(+6.60)#66 | 4.9%(+8.20)#2,044 |
| 67. | 35443 | 13.1% | 6.5%(+6.60)#67 | 4.9%(+8.20)#2,049 |
| 68. | 35218 | 13.0% | 6.5%(+6.50)#68 | 4.9%(+8.10)#2,074 |
| 69. | 36553 | 13.0% | 6.5%(+6.50)#69 | 4.9%(+8.10)#2,077 |
| 70. | 36017 | 13.0% | 6.5%(+6.50)#70 | 4.9%(+8.10)#2,080 |
| 71. | 36768 | 13.0% | 6.5%(+6.50)#71 | 4.9%(+8.10)#2,089 |
| 72. | 36539 | 13.0% | 6.5%(+6.50)#72 | 4.9%(+8.10)#2,095 |
| 73. | 35404 | 12.9% | 6.5%(+6.40)#73 | 4.9%(+8.00)#2,110 |
| 74. | 35805 | 12.9% | 6.5%(+6.40)#74 | 4.9%(+8.00)#2,112 |
| 75. | 35217 | 12.9% | 6.5%(+6.40)#75 | 4.9%(+8.00)#2,117 |
| 76. | 35766 | 12.9% | 6.5%(+6.40)#76 | 4.9%(+8.00)#2,146 |
| 77. | 36362 | 12.6% | 6.5%(+6.10)#77 | 4.9%(+7.70)#2,233 |
| 78. | 35049 | 12.6% | 6.5%(+6.10)#78 | 4.9%(+7.70)#2,236 |
| 79. | 36040 | 12.6% | 6.5%(+6.10)#79 | 4.9%(+7.70)#2,237 |
| 80. | 36104 | 12.4% | 6.5%(+5.90)#80 | 4.9%(+7.50)#2,300 |
| 81. | 36748 | 12.4% | 6.5%(+5.90)#81 | 4.9%(+7.50)#2,306 |
| 82. | 35660 | 12.3% | 6.5%(+5.80)#82 | 4.9%(+7.40)#2,335 |
| 83. | 36919 | 12.3% | 6.5%(+5.80)#83 | 4.9%(+7.40)#2,345 |
| 84. | 35060 | 12.2% | 6.5%(+5.70)#84 | 4.9%(+7.30)#2,396 |
| 85. | 36036 | 12.1% | 6.5%(+5.60)#85 | 4.9%(+7.20)#2,429 |
| 86. | 36480 | 12.1% | 6.5%(+5.60)#86 | 4.9%(+7.20)#2,431 |
| 87. | 36482 | 12.1% | 6.5%(+5.60)#87 | 4.9%(+7.20)#2,436 |
| 88. | 36545 | 12.0% | 6.5%(+5.50)#88 | 4.9%(+7.10)#2,461 |
| 89. | 36612 | 12.0% | 6.5%(+5.50)#89 | 4.9%(+7.10)#2,466 |
| 90. | 36871 | 12.0% | 6.5%(+5.50)#90 | 4.9%(+7.10)#2,478 |
| 91. | 36502 | 11.9% | 6.5%(+5.40)#91 | 4.9%(+7.00)#2,507 |
| 92. | 36750 | 11.9% | 6.5%(+5.40)#92 | 4.9%(+7.00)#2,521 |
| 93. | 36720 | 11.9% | 6.5%(+5.40)#93 | 4.9%(+7.00)#2,534 |
| 94. | 35035 | 11.8% | 6.5%(+5.30)#94 | 4.9%(+6.90)#2,567 |
| 95. | 36784 | 11.6% | 6.5%(+5.10)#95 | 4.9%(+6.70)#2,636 |
| 96. | 35148 | 11.5% | 6.5%(+5.00)#96 | 4.9%(+6.60)#2,694 |
| 97. | 36524 | 11.5% | 6.5%(+5.00)#97 | 4.9%(+6.60)#2,701 |
| 98. | 36425 | 11.5% | 6.5%(+5.00)#98 | 4.9%(+6.60)#2,706 |
| 99. | 36107 | 11.4% | 6.5%(+4.90)#99 | 4.9%(+6.50)#2,737 |
| 100. | 36318 | 11.4% | 6.5%(+4.90)#100 | 4.9%(+6.50)#2,764 |
Common Questions
What are the Top 10 Zip Codes with the Highest Percentage of Households with Income Below $10,000 in Alabama?
Top 10 Zip Codes with the Highest Percentage of Households with Income Below $10,000 in Alabama are:
What zip code has the Highest Percentage of Households with Income Below $10,000 in Alabama?
36910 has the Highest Percentage of Households with Income Below $10,000 in Alabama with 100.0%.
What is the Percentage of Households with Income Below $10,000 in the State of Alabama?
Percentage of Households with Income Below $10,000 in Alabama is 6.5%.
What is the Percentage of Households with Income Below $10,000 in the United States?
Percentage of Households with Income Below $10,000 in the United States is 4.9%.