Zip Codes with the Highest Percentage of Households with Income Below $10,000 in Arizona
RELATED REPORTS & OPTIONS
Household Income | $0-10k
Arizona
Compare Zip Codes
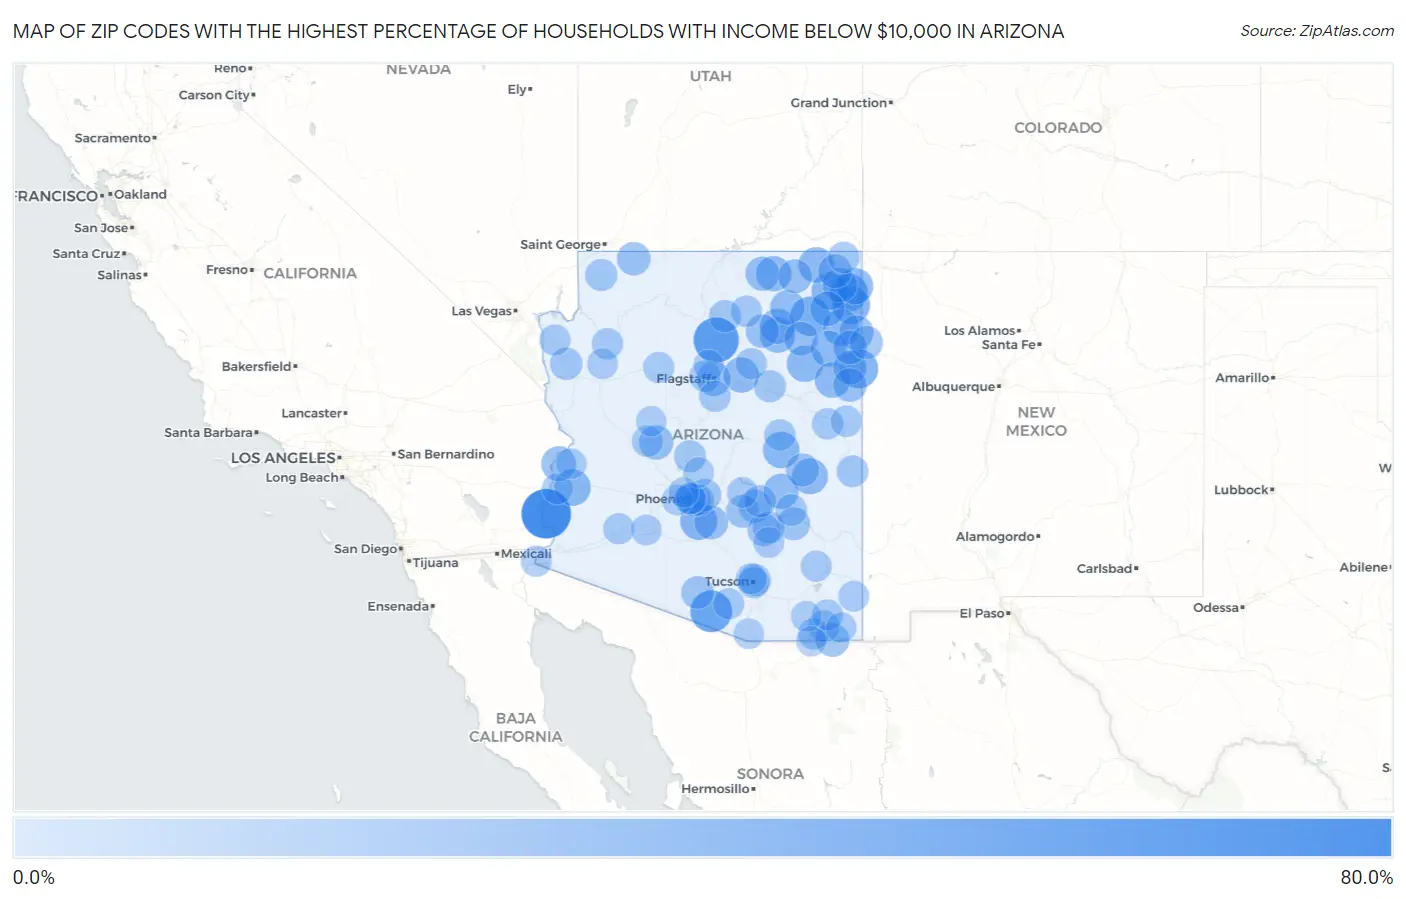
Map of Zip Codes with the Highest Percentage of Households with Income Below $10,000 in Arizona
0.0%
80.0%
Zip Codes with the Highest Percentage of Households with Income Below $10,000 in Arizona
| Zip Code | Households with Income < $10k | vs State | vs National | |
| 1. | 85328 | 62.5% | 4.9%(+57.6)#1 | 4.9%(+57.6)#69 |
| 2. | 86016 | 50.0% | 4.9%(+45.1)#2 | 4.9%(+45.1)#116 |
| 3. | 85639 | 40.7% | 4.9%(+35.8)#3 | 4.9%(+35.8)#169 |
| 4. | 86520 | 33.1% | 4.9%(+28.2)#4 | 4.9%(+28.2)#262 |
| 5. | 86508 | 32.1% | 4.9%(+27.2)#5 | 4.9%(+27.2)#286 |
| 6. | 86507 | 29.8% | 4.9%(+24.9)#6 | 4.9%(+24.9)#332 |
| 7. | 86556 | 29.0% | 4.9%(+24.1)#7 | 4.9%(+24.1)#349 |
| 8. | 85121 | 27.6% | 4.9%(+22.7)#8 | 4.9%(+22.7)#386 |
| 9. | 86538 | 26.8% | 4.9%(+21.9)#9 | 4.9%(+21.9)#408 |
| 10. | 85346 | 25.8% | 4.9%(+20.9)#10 | 4.9%(+20.9)#447 |
| 11. | 86540 | 25.8% | 4.9%(+20.9)#11 | 4.9%(+20.9)#450 |
| 12. | 85911 | 25.4% | 4.9%(+20.5)#12 | 4.9%(+20.5)#463 |
| 13. | 86031 | 25.2% | 4.9%(+20.3)#13 | 4.9%(+20.3)#478 |
| 14. | 86544 | 25.2% | 4.9%(+20.3)#14 | 4.9%(+20.3)#479 |
| 15. | 86505 | 24.4% | 4.9%(+19.5)#15 | 4.9%(+19.5)#515 |
| 16. | 85926 | 24.1% | 4.9%(+19.2)#16 | 4.9%(+19.2)#528 |
| 17. | 86535 | 23.5% | 4.9%(+18.6)#17 | 4.9%(+18.6)#557 |
| 18. | 86502 | 23.1% | 4.9%(+18.2)#18 | 4.9%(+18.2)#587 |
| 19. | 86043 | 23.0% | 4.9%(+18.1)#19 | 4.9%(+18.1)#593 |
| 20. | 86003 | 22.7% | 4.9%(+17.8)#20 | 4.9%(+17.8)#602 |
| 21. | 86054 | 22.3% | 4.9%(+17.4)#21 | 4.9%(+17.4)#619 |
| 22. | 86039 | 22.1% | 4.9%(+17.2)#22 | 4.9%(+17.2)#630 |
| 23. | 85550 | 21.8% | 4.9%(+16.9)#23 | 4.9%(+16.9)#647 |
| 24. | 85371 | 21.1% | 4.9%(+16.2)#24 | 4.9%(+16.2)#702 |
| 25. | 86547 | 20.6% | 4.9%(+15.7)#25 | 4.9%(+15.7)#738 |
| 26. | 86510 | 20.5% | 4.9%(+15.6)#26 | 4.9%(+15.6)#746 |
| 27. | 86503 | 20.3% | 4.9%(+15.4)#27 | 4.9%(+15.4)#771 |
| 28. | 86011 | 20.0% | 4.9%(+15.1)#28 | 4.9%(+15.1)#793 |
| 29. | 86332 | 19.7% | 4.9%(+14.8)#29 | 4.9%(+14.8)#824 |
| 30. | 86504 | 19.6% | 4.9%(+14.7)#30 | 4.9%(+14.7)#831 |
| 31. | 86044 | 19.0% | 4.9%(+14.1)#31 | 4.9%(+14.1)#900 |
| 32. | 86033 | 18.6% | 4.9%(+13.7)#32 | 4.9%(+13.7)#938 |
| 33. | 86034 | 18.6% | 4.9%(+13.7)#33 | 4.9%(+13.7)#940 |
| 34. | 85147 | 18.2% | 4.9%(+13.3)#34 | 4.9%(+13.3)#994 |
| 35. | 86506 | 18.2% | 4.9%(+13.3)#35 | 4.9%(+13.3)#999 |
| 36. | 86545 | 18.2% | 4.9%(+13.3)#36 | 4.9%(+13.3)#1,000 |
| 37. | 86511 | 18.0% | 4.9%(+13.1)#37 | 4.9%(+13.1)#1,024 |
| 38. | 86512 | 17.7% | 4.9%(+12.8)#38 | 4.9%(+12.8)#1,057 |
| 39. | 85626 | 17.6% | 4.9%(+12.7)#39 | 4.9%(+12.7)#1,076 |
| 40. | 86021 | 17.3% | 4.9%(+12.4)#40 | 4.9%(+12.4)#1,115 |
| 41. | 86030 | 17.1% | 4.9%(+12.2)#41 | 4.9%(+12.2)#1,144 |
| 42. | 86515 | 16.6% | 4.9%(+11.7)#42 | 4.9%(+11.7)#1,235 |
| 43. | 85941 | 16.3% | 4.9%(+11.4)#43 | 4.9%(+11.4)#1,282 |
| 44. | 85539 | 16.1% | 4.9%(+11.2)#44 | 4.9%(+11.2)#1,321 |
| 45. | 85530 | 16.0% | 4.9%(+11.1)#45 | 4.9%(+11.1)#1,338 |
| 46. | 85034 | 15.9% | 4.9%(+11.0)#46 | 4.9%(+11.0)#1,360 |
| 47. | 85173 | 15.8% | 4.9%(+10.9)#47 | 4.9%(+10.9)#1,378 |
| 48. | 85634 | 15.1% | 4.9%(+10.2)#48 | 4.9%(+10.2)#1,501 |
| 49. | 85135 | 14.9% | 4.9%(+10.00)#49 | 4.9%(+10.00)#1,553 |
| 50. | 86431 | 14.6% | 4.9%(+9.70)#50 | 4.9%(+9.70)#1,639 |
| 51. | 85256 | 14.5% | 4.9%(+9.60)#51 | 4.9%(+9.60)#1,649 |
| 52. | 85192 | 13.6% | 4.9%(+8.70)#52 | 4.9%(+8.70)#1,889 |
| 53. | 86020 | 13.5% | 4.9%(+8.60)#53 | 4.9%(+8.60)#1,928 |
| 54. | 85532 | 13.5% | 4.9%(+8.60)#54 | 4.9%(+8.60)#1,936 |
| 55. | 86432 | 13.3% | 4.9%(+8.40)#55 | 4.9%(+8.40)#1,985 |
| 56. | 86047 | 13.2% | 4.9%(+8.30)#56 | 4.9%(+8.30)#2,000 |
| 57. | 85719 | 13.1% | 4.9%(+8.20)#57 | 4.9%(+8.20)#2,020 |
| 58. | 85324 | 13.1% | 4.9%(+8.20)#58 | 4.9%(+8.20)#2,042 |
| 59. | 85920 | 12.6% | 4.9%(+7.70)#59 | 4.9%(+7.70)#2,244 |
| 60. | 86514 | 12.3% | 4.9%(+7.40)#60 | 4.9%(+7.40)#2,343 |
| 61. | 85542 | 12.0% | 4.9%(+7.10)#61 | 4.9%(+7.10)#2,470 |
| 62. | 85617 | 12.0% | 4.9%(+7.10)#62 | 4.9%(+7.10)#2,477 |
| 63. | 86045 | 11.9% | 4.9%(+7.00)#63 | 4.9%(+7.00)#2,510 |
| 64. | 86015 | 11.9% | 4.9%(+7.00)#64 | 4.9%(+7.00)#2,530 |
| 65. | 85933 | 11.8% | 4.9%(+6.90)#65 | 4.9%(+6.90)#2,551 |
| 66. | 85701 | 11.6% | 4.9%(+6.70)#66 | 4.9%(+6.70)#2,640 |
| 67. | 86017 | 11.6% | 4.9%(+6.70)#67 | 4.9%(+6.70)#2,653 |
| 68. | 86434 | 11.5% | 4.9%(+6.60)#68 | 4.9%(+6.60)#2,699 |
| 69. | 85362 | 11.5% | 4.9%(+6.60)#69 | 4.9%(+6.60)#2,710 |
| 70. | 85281 | 11.4% | 4.9%(+6.50)#70 | 4.9%(+6.50)#2,720 |
| 71. | 86035 | 11.4% | 4.9%(+6.50)#71 | 4.9%(+6.50)#2,759 |
| 72. | 85924 | 11.4% | 4.9%(+6.50)#72 | 4.9%(+6.50)#2,761 |
| 73. | 85936 | 11.2% | 4.9%(+6.30)#73 | 4.9%(+6.30)#2,856 |
| 74. | 85603 | 11.0% | 4.9%(+6.10)#74 | 4.9%(+6.10)#2,967 |
| 75. | 85004 | 10.9% | 4.9%(+6.00)#75 | 4.9%(+6.00)#3,013 |
| 76. | 85705 | 10.8% | 4.9%(+5.90)#76 | 4.9%(+5.90)#3,053 |
| 77. | 85334 | 10.8% | 4.9%(+5.90)#77 | 4.9%(+5.90)#3,092 |
| 78. | 85610 | 10.8% | 4.9%(+5.90)#78 | 4.9%(+5.90)#3,096 |
| 79. | 85333 | 10.8% | 4.9%(+5.90)#79 | 4.9%(+5.90)#3,100 |
| 80. | 86320 | 10.7% | 4.9%(+5.80)#80 | 4.9%(+5.80)#3,140 |
| 81. | 86445 | 10.7% | 4.9%(+5.80)#81 | 4.9%(+5.80)#3,160 |
| 82. | 85003 | 10.6% | 4.9%(+5.70)#82 | 4.9%(+5.70)#3,183 |
| 83. | 85736 | 10.6% | 4.9%(+5.70)#83 | 4.9%(+5.70)#3,192 |
| 84. | 85643 | 10.4% | 4.9%(+5.50)#84 | 4.9%(+5.50)#3,307 |
| 85. | 85545 | 10.3% | 4.9%(+5.40)#85 | 4.9%(+5.40)#3,406 |
| 86. | 85336 | 10.1% | 4.9%(+5.20)#86 | 4.9%(+5.20)#3,507 |
| 87. | 85618 | 10.1% | 4.9%(+5.20)#87 | 4.9%(+5.20)#3,544 |
| 88. | 86437 | 10.0% | 4.9%(+5.10)#88 | 4.9%(+5.10)#3,635 |
| 89. | 85329 | 9.9% | 4.9%(+5.00)#89 | 4.9%(+5.00)#3,675 |
| 90. | 85337 | 9.7% | 4.9%(+4.80)#90 | 4.9%(+4.80)#3,838 |
| 91. | 85632 | 9.6% | 4.9%(+4.70)#91 | 4.9%(+4.70)#3,925 |
| 92. | 85344 | 9.3% | 4.9%(+4.40)#92 | 4.9%(+4.40)#4,118 |
| 93. | 85377 | 9.2% | 4.9%(+4.30)#93 | 4.9%(+4.30)#4,243 |
| 94. | 85638 | 9.2% | 4.9%(+4.30)#94 | 4.9%(+4.30)#4,262 |
| 95. | 85621 | 9.1% | 4.9%(+4.20)#95 | 4.9%(+4.20)#4,309 |
| 96. | 86001 | 8.9% | 4.9%(+4.00)#96 | 4.9%(+4.00)#4,505 |
| 97. | 85607 | 8.8% | 4.9%(+3.90)#97 | 4.9%(+3.90)#4,623 |
| 98. | 85620 | 8.8% | 4.9%(+3.90)#98 | 4.9%(+3.90)#4,678 |
| 99. | 85301 | 8.7% | 4.9%(+3.80)#99 | 4.9%(+3.80)#4,712 |
| 100. | 86338 | 8.7% | 4.9%(+3.80)#100 | 4.9%(+3.80)#4,799 |
Common Questions
What are the Top 10 Zip Codes with the Highest Percentage of Households with Income Below $10,000 in Arizona?
Top 10 Zip Codes with the Highest Percentage of Households with Income Below $10,000 in Arizona are:
What zip code has the Highest Percentage of Households with Income Below $10,000 in Arizona?
85328 has the Highest Percentage of Households with Income Below $10,000 in Arizona with 62.5%.
What is the Percentage of Households with Income Below $10,000 in the State of Arizona?
Percentage of Households with Income Below $10,000 in Arizona is 4.9%.
What is the Percentage of Households with Income Below $10,000 in the United States?
Percentage of Households with Income Below $10,000 in the United States is 4.9%.