Zip Codes with the Highest Wage/Income Gap (%) in Omaha, NE

RELATED REPORTS & OPTIONS

Highest Wage/Income Gap (%)
Population
Families and Households
Female Fertility
Female Fertility (Unmarried)
Race (Community Size)
Race (Percentage)
Ancestry (Community Size)
AfghanAfricanAlbanianAleutAmericanApacheArabArapahoArgentineanArmenianAustralianAustrianBangladeshiBasqueBelgianBhutaneseBlackfeetBolivianBrazilianBritishBulgarianBurmeseCajunCambodianCanadianCarpatho RusynCentral AmericanCentral American IndianCherokeeChickasawChileanChineseChippewaChoctawColombianComancheCosta RicanCreekCroatianCubanCzechCzechoslovakianDanishDominicanDutchEastern EuropeanEcuadorianEgyptianEnglishEthiopianEuropeanFilipinoFinnishFrenchFrench American IndianFrench CanadianGermanGerman RussianGhanaianGreekGuamanian / ChamorroGuatemalanGuyaneseHaitianHonduranHungarianIcelanderIndian (Asian)IndonesianInupiatIranianIraqiIrishIroquoisIsraeliItalianJamaicanJapaneseJordanianKenyanKiowaKoreanLaotianLatvianLebaneseLithuanianLuxembourgerMacedonianMalaysianMexicanMexican American IndianMoroccanNative HawaiianNavajoNicaraguanNigerianNorthern EuropeanNorwegianPakistaniPalestinianPanamanianPennsylvania GermanPeruvianPolishPortuguesePotawatomiPuebloPuerto RicanRomanianRussianSalvadoranSamoanScandinavianScotch-IrishScottishSeminoleSerbianSiouxSlavicSlovakSloveneSomaliSouth AfricanSouth AmericanSpaniardSpanishSri LankanSubsaharan AfricanSudaneseSwedishSwissSyrianThaiTlingit-HaidaTrinidadian and TobagonianTurkishUkrainianVenezuelanVietnameseWelshWest IndianYugoslavianZimbabwean
Ancestry (Percentage)
AfghanAfricanAlbanianAleutAmericanApacheArabArapahoArgentineanArmenianAustralianAustrianBangladeshiBasqueBelgianBhutaneseBlackfeetBolivianBrazilianBritishBulgarianBurmeseCajunCambodianCanadianCarpatho RusynCentral AmericanCentral American IndianCherokeeChickasawChileanChineseChippewaChoctawColombianComancheCosta RicanCreekCroatianCubanCzechCzechoslovakianDanishDominicanDutchEastern EuropeanEcuadorianEgyptianEnglishEthiopianEuropeanFilipinoFinnishFrenchFrench American IndianFrench CanadianGermanGerman RussianGhanaianGreekGuamanian / ChamorroGuatemalanGuyaneseHaitianHonduranHungarianIcelanderIndian (Asian)IndonesianInupiatIranianIraqiIrishIroquoisIsraeliItalianJamaicanJapaneseJordanianKenyanKiowaKoreanLaotianLatvianLebaneseLithuanianLuxembourgerMacedonianMalaysianMexicanMexican American IndianMoroccanNative HawaiianNavajoNicaraguanNigerianNorthern EuropeanNorwegianPakistaniPalestinianPanamanianPennsylvania GermanPeruvianPolishPortuguesePotawatomiPuebloPuerto RicanRomanianRussianSalvadoranSamoanScandinavianScotch-IrishScottishSeminoleSerbianSiouxSlavicSlovakSloveneSomaliSouth AfricanSouth AmericanSpaniardSpanishSri LankanSubsaharan AfricanSudaneseSwedishSwissSyrianThaiTlingit-HaidaTrinidadian and TobagonianTurkishUkrainianVenezuelanVietnameseWelshWest IndianYugoslavianZimbabwean
Immigrant Origin (Total)
AfghanistanAfricaArgentinaAsiaAustraliaBangladeshBarbadosBelarusBosnia and HerzegovinaBrazilBurma / MyanmarCameroonCanadaCaribbeanCentral AmericaChileChinaColombiaCongoCosta RicaCroatiaCubaCzechoslovakiaDominican RepublicEastern AfricaEastern AsiaEastern EuropeEgyptEl SalvadorEnglandEthiopiaEuropeFranceGermanyGhanaGreeceGuatemalaHondurasHong KongHungaryIndiaIndonesiaIranIraqIrelandIsraelItalyJamaicaJapanJordanKazakhstanKenyaKoreaKuwaitLaosLatin AmericaLatviaLithuaniaMalaysiaMexicoMiddle AfricaMoroccoNepalNetherlandsNicaraguaNigeriaNorthern AfricaNorthern EuropeOceaniaPakistanPanamaPeruPhilippinesPolandPortugalRomaniaRussiaSaudi ArabiaScotlandSierra LeoneSomaliaSouth AfricaSouth AmericaSouth Central AsiaSouth Eastern AsiaSouthern EuropeSpainSri LankaSudanSyriaTaiwanThailandTrinidad and TobagoTurkeyUgandaUkraineVenezuelaVietnamWestern AfricaWestern AsiaWestern EuropeZaireZimbabwe
Immigrant Origin (Percentage)
AfghanistanAfricaArgentinaAsiaAustraliaBangladeshBarbadosBelarusBosnia and HerzegovinaBrazilBurma / MyanmarCameroonCanadaCaribbeanCentral AmericaChileChinaColombiaCongoCosta RicaCroatiaCubaCzechoslovakiaDominican RepublicEastern AfricaEastern AsiaEastern EuropeEgyptEl SalvadorEnglandEthiopiaEuropeFranceGermanyGhanaGreeceGuatemalaHondurasHong KongHungaryIndiaIndonesiaIranIraqIrelandIsraelItalyJamaicaJapanJordanKazakhstanKenyaKoreaKuwaitLaosLatin AmericaLatviaLithuaniaMalaysiaMexicoMiddle AfricaMoroccoNepalNetherlandsNicaraguaNigeriaNorthern AfricaNorthern EuropeOceaniaPakistanPanamaPeruPhilippinesPolandPortugalRomaniaRussiaSaudi ArabiaScotlandSierra LeoneSomaliaSouth AfricaSouth AmericaSouth Central AsiaSouth Eastern AsiaSouthern EuropeSpainSri LankaSudanSyriaTaiwanThailandTrinidad and TobagoTurkeyUgandaUkraineVenezuelaVietnamWestern AfricaWestern AsiaWestern EuropeZaireZimbabwe
Income
Income (Families)
Income (Households)
Poverty
Poverty (Families)
Unemployment
Employment Occupations
Employment Industries
Employer Class
Commute Time
Commute Means
School Enrollment
Education by Degree Field
Occupancy
Finances
Physical Characteristics
Omaha
Compare Zip Codes
Comparison Subject

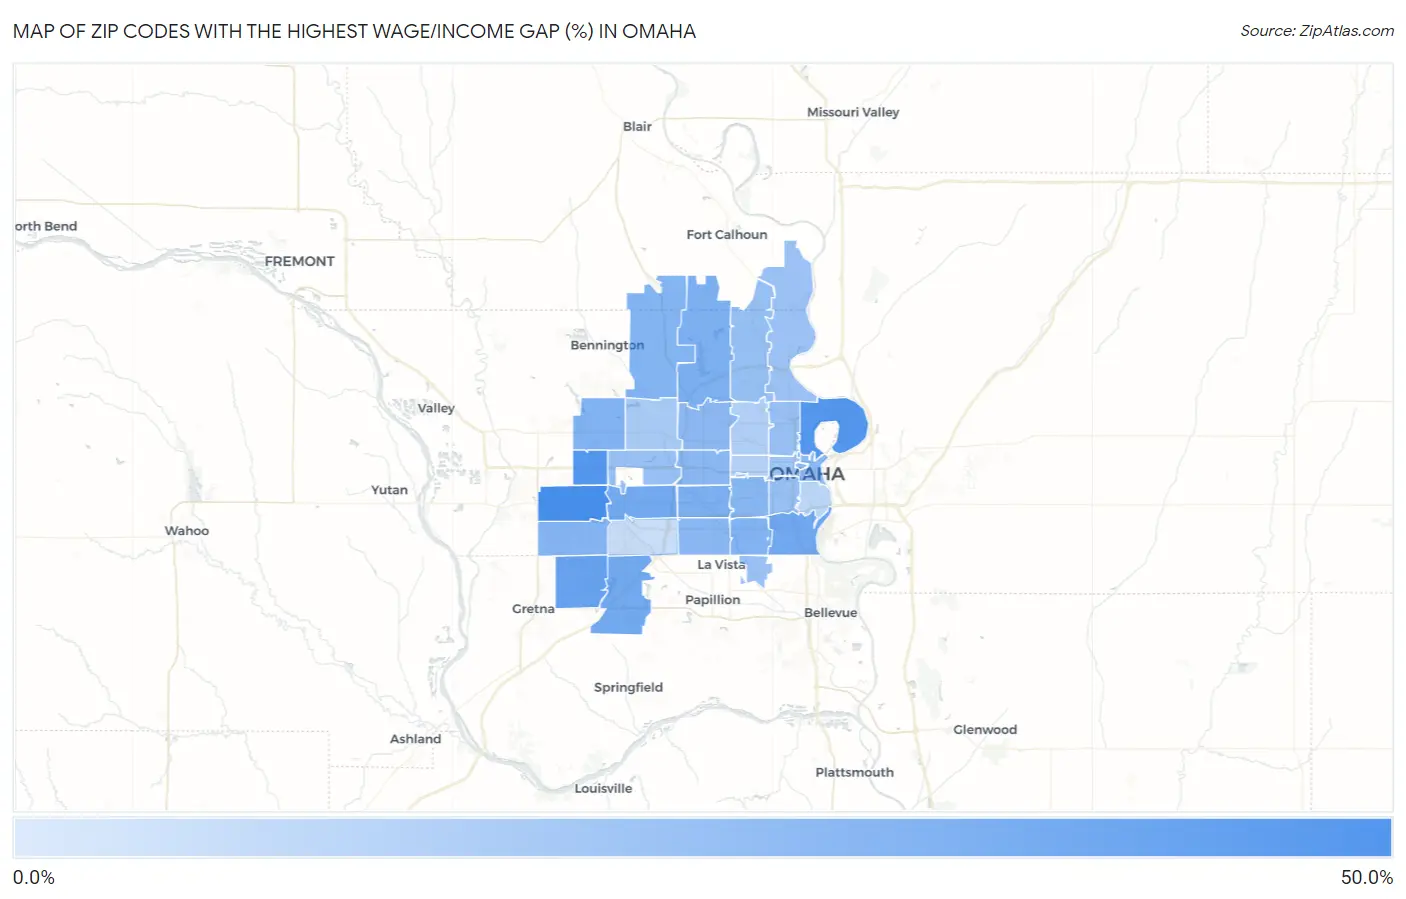
Map of Zip Codes with the Highest Wage/Income Gap (%) in Omaha

0.0%
50.0%
Zip Codes with the Highest Wage/Income Gap (%) in Omaha Map

Zip Codes with the Highest Wage/Income Gap (%) in Omaha, NE

Zip Code Wage/Income Gap (%) vs State vs National
1.6813047.7%29.0%(+0.186)#8328.0%(+0.197)#3,788
2.6811842.7%29.0%(+0.137)#13128.0%(+0.147)#5,809
3.6811042.4%29.0%(+0.134)#13428.0%(+0.144)#5,950
4.6813636.1%29.0%(+0.071)#19128.0%(+0.081)#9,553
5.6810733.4%29.0%(+0.044)#22528.0%(+0.054)#11,442
6.6813832.8%29.0%(+0.038)#23528.0%(+0.048)#11,863
7.6814432.4%29.0%(+0.033)#24328.0%(+0.044)#12,196
8.6812429.5%29.0%(+0.005)#28428.0%(+0.015)#14,142
9.6812229.3%29.0%(+0.003)#28628.0%(+0.014)#14,277
10.6811728.3%29.0%(-0.007)#30228.0%(+0.003)#15,025
11.6811628.1%29.0%(-0.009)#30328.0%(+0.002)#15,167
12.6814227.6%29.0%(-0.015)#31828.0%(-0.004)#15,624
13.6813526.4%29.0%(-0.027)#33528.0%(-0.016)#16,465
14.6810625.9%29.0%(-0.031)#34428.0%(-0.021)#16,812
15.6811425.0%29.0%(-0.040)#35728.0%(-0.030)#17,455
16.6812724.9%29.0%(-0.042)#35828.0%(-0.031)#17,532
17.6810224.7%29.0%(-0.044)#35928.0%(-0.033)#17,635
18.6813424.4%29.0%(-0.046)#36528.0%(-0.036)#17,806
19.6817822.7%29.0%(-0.063)#38828.0%(-0.053)#18,959
20.6815221.6%29.0%(-0.075)#39728.0%(-0.064)#19,726
21.6815420.9%29.0%(-0.081)#40728.0%(-0.071)#20,128
22.6810520.8%29.0%(-0.082)#40828.0%(-0.072)#20,197
23.6811120.7%29.0%(-0.084)#41028.0%(-0.073)#20,276
24.6815719.7%29.0%(-0.093)#41528.0%(-0.082)#20,867
25.6811219.3%29.0%(-0.098)#42128.0%(-0.087)#21,110
26.6813118.1%29.0%(-0.109)#43228.0%(-0.098)#21,722
27.6816416.4%29.0%(-0.127)#44428.0%(-0.116)#22,611
28.6810413.5%29.0%(-0.155)#46028.0%(-0.145)#23,777
29.6813213.1%29.0%(-0.159)#46428.0%(-0.149)#23,909
30.6810811.1%29.0%(-0.179)#47328.0%(-0.169)#24,656
31.681377.0%29.0%(-0.220)#48728.0%(-0.210)#25,968
32.681821.9%29.0%(-0.271)#50228.0%(-0.261)#27,367

Common Questions

What are the Top 10 Zip Codes with the Highest Wage/Income Gap (%) in Omaha, NE?
Top 10 Zip Codes with the Highest Wage/Income Gap (%) in Omaha, NE are:
#1
47.7%
#2
42.7%
#3
42.4%
#4
36.1%
#5
33.4%
#6
32.8%
#7
32.4%
#8
29.5%
#9
29.3%
#10
28.3%
What zip code has the Highest Wage/Income Gap (%) in Omaha, NE?
68130 has the Highest Wage/Income Gap (%) in Omaha, NE with 47.7%.
What is the Wage / Income Gap in Percentage Terms in Omaha, NE?
Wage / Income Gap in Percentage Terms in Omaha is 23.7%.
What is the Wage / Income Gap in Percentage Terms in Nebraska?
Wage / Income Gap in Percentage Terms in Nebraska is 29.0%.
What is the Wage / Income Gap in Percentage Terms in the United States?
Wage / Income Gap in Percentage Terms in the United States is 28.0%.