Zip Codes with the Highest Percentage of Population with a Degree in Literature and Languages in Omaha, NE

RELATED REPORTS & OPTIONS

Literature and Languages
Population
Families and Households
Female Fertility
Female Fertility (Unmarried)
Race (Community Size)
Race (Percentage)
Ancestry (Community Size)
AfghanAfricanAlbanianAleutAmericanApacheArabArapahoArgentineanArmenianAustralianAustrianBangladeshiBasqueBelgianBhutaneseBlackfeetBolivianBrazilianBritishBulgarianBurmeseCajunCambodianCanadianCarpatho RusynCentral AmericanCentral American IndianCherokeeChickasawChileanChineseChippewaChoctawColombianComancheCosta RicanCreekCroatianCubanCzechCzechoslovakianDanishDominicanDutchEastern EuropeanEcuadorianEgyptianEnglishEthiopianEuropeanFilipinoFinnishFrenchFrench American IndianFrench CanadianGermanGerman RussianGhanaianGreekGuamanian / ChamorroGuatemalanGuyaneseHaitianHonduranHungarianIcelanderIndian (Asian)IndonesianInupiatIranianIraqiIrishIroquoisIsraeliItalianJamaicanJapaneseJordanianKenyanKiowaKoreanLaotianLatvianLebaneseLithuanianLuxembourgerMacedonianMalaysianMexicanMexican American IndianMoroccanNative HawaiianNavajoNicaraguanNigerianNorthern EuropeanNorwegianPakistaniPalestinianPanamanianPennsylvania GermanPeruvianPolishPortuguesePotawatomiPuebloPuerto RicanRomanianRussianSalvadoranSamoanScandinavianScotch-IrishScottishSeminoleSerbianSiouxSlavicSlovakSloveneSomaliSouth AfricanSouth AmericanSpaniardSpanishSri LankanSubsaharan AfricanSudaneseSwedishSwissSyrianThaiTlingit-HaidaTrinidadian and TobagonianTurkishUkrainianVenezuelanVietnameseWelshWest IndianYugoslavianZimbabwean
Ancestry (Percentage)
AfghanAfricanAlbanianAleutAmericanApacheArabArapahoArgentineanArmenianAustralianAustrianBangladeshiBasqueBelgianBhutaneseBlackfeetBolivianBrazilianBritishBulgarianBurmeseCajunCambodianCanadianCarpatho RusynCentral AmericanCentral American IndianCherokeeChickasawChileanChineseChippewaChoctawColombianComancheCosta RicanCreekCroatianCubanCzechCzechoslovakianDanishDominicanDutchEastern EuropeanEcuadorianEgyptianEnglishEthiopianEuropeanFilipinoFinnishFrenchFrench American IndianFrench CanadianGermanGerman RussianGhanaianGreekGuamanian / ChamorroGuatemalanGuyaneseHaitianHonduranHungarianIcelanderIndian (Asian)IndonesianInupiatIranianIraqiIrishIroquoisIsraeliItalianJamaicanJapaneseJordanianKenyanKiowaKoreanLaotianLatvianLebaneseLithuanianLuxembourgerMacedonianMalaysianMexicanMexican American IndianMoroccanNative HawaiianNavajoNicaraguanNigerianNorthern EuropeanNorwegianPakistaniPalestinianPanamanianPennsylvania GermanPeruvianPolishPortuguesePotawatomiPuebloPuerto RicanRomanianRussianSalvadoranSamoanScandinavianScotch-IrishScottishSeminoleSerbianSiouxSlavicSlovakSloveneSomaliSouth AfricanSouth AmericanSpaniardSpanishSri LankanSubsaharan AfricanSudaneseSwedishSwissSyrianThaiTlingit-HaidaTrinidadian and TobagonianTurkishUkrainianVenezuelanVietnameseWelshWest IndianYugoslavianZimbabwean
Immigrant Origin (Total)
AfghanistanAfricaArgentinaAsiaAustraliaBangladeshBarbadosBelarusBosnia and HerzegovinaBrazilBurma / MyanmarCameroonCanadaCaribbeanCentral AmericaChileChinaColombiaCongoCosta RicaCroatiaCubaCzechoslovakiaDominican RepublicEastern AfricaEastern AsiaEastern EuropeEgyptEl SalvadorEnglandEthiopiaEuropeFranceGermanyGhanaGreeceGuatemalaHondurasHong KongHungaryIndiaIndonesiaIranIraqIrelandIsraelItalyJamaicaJapanJordanKazakhstanKenyaKoreaKuwaitLaosLatin AmericaLatviaLithuaniaMalaysiaMexicoMiddle AfricaMoroccoNepalNetherlandsNicaraguaNigeriaNorthern AfricaNorthern EuropeOceaniaPakistanPanamaPeruPhilippinesPolandPortugalRomaniaRussiaSaudi ArabiaScotlandSierra LeoneSomaliaSouth AfricaSouth AmericaSouth Central AsiaSouth Eastern AsiaSouthern EuropeSpainSri LankaSudanSyriaTaiwanThailandTrinidad and TobagoTurkeyUgandaUkraineVenezuelaVietnamWestern AfricaWestern AsiaWestern EuropeZaireZimbabwe
Immigrant Origin (Percentage)
AfghanistanAfricaArgentinaAsiaAustraliaBangladeshBarbadosBelarusBosnia and HerzegovinaBrazilBurma / MyanmarCameroonCanadaCaribbeanCentral AmericaChileChinaColombiaCongoCosta RicaCroatiaCubaCzechoslovakiaDominican RepublicEastern AfricaEastern AsiaEastern EuropeEgyptEl SalvadorEnglandEthiopiaEuropeFranceGermanyGhanaGreeceGuatemalaHondurasHong KongHungaryIndiaIndonesiaIranIraqIrelandIsraelItalyJamaicaJapanJordanKazakhstanKenyaKoreaKuwaitLaosLatin AmericaLatviaLithuaniaMalaysiaMexicoMiddle AfricaMoroccoNepalNetherlandsNicaraguaNigeriaNorthern AfricaNorthern EuropeOceaniaPakistanPanamaPeruPhilippinesPolandPortugalRomaniaRussiaSaudi ArabiaScotlandSierra LeoneSomaliaSouth AfricaSouth AmericaSouth Central AsiaSouth Eastern AsiaSouthern EuropeSpainSri LankaSudanSyriaTaiwanThailandTrinidad and TobagoTurkeyUgandaUkraineVenezuelaVietnamWestern AfricaWestern AsiaWestern EuropeZaireZimbabwe
Income
Income (Families)
Income (Households)
Poverty
Poverty (Families)
Unemployment
Employment Occupations
Employment Industries
Employer Class
Commute Time
Commute Means
School Enrollment
Education by Degree Field
Occupancy
Finances
Physical Characteristics
Omaha
Compare Zip Codes
Comparison Subject

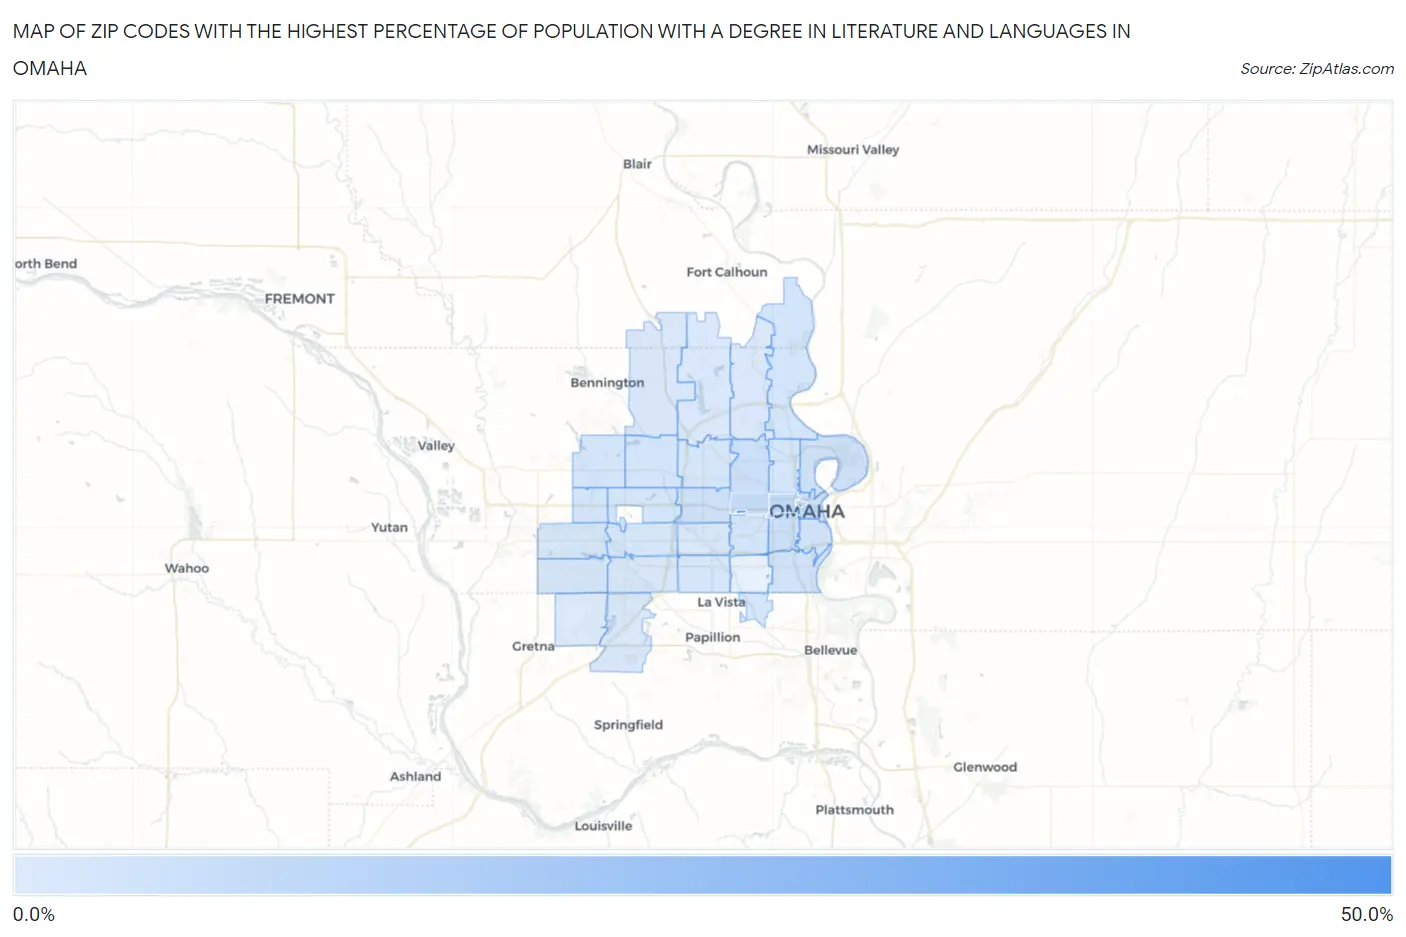
Map of Zip Codes with the Highest Percentage of Population with a Degree in Literature and Languages in Omaha

0.0%
50.0%
Zip Codes with the Highest Percentage of Population with a Degree in Literature and Languages in Omaha Map

Zip Codes with the Highest Percentage of Population with a Degree in Literature and Languages in Omaha, NE

Zip Code % Graduates vs State vs National
1.6818250.0%3.1%(+46.9)#24.4%(+45.6)#59
2.681789.3%3.1%(+6.22)#234.4%(+4.92)#2,130
3.681328.4%3.1%(+5.28)#274.4%(+3.99)#2,683
4.681318.1%3.1%(+5.02)#284.4%(+3.72)#2,876
5.681045.8%3.1%(+2.69)#474.4%(+1.40)#5,745
6.681025.7%3.1%(+2.55)#494.4%(+1.25)#6,009
7.681055.6%3.1%(+2.52)#504.4%(+1.23)#6,056
8.681145.1%3.1%(+1.99)#614.4%(+0.699)#7,110
9.681105.1%3.1%(+1.97)#634.4%(+0.673)#7,165
10.681074.2%3.1%(+1.05)#864.4%(-0.243)#9,703
11.681084.1%3.1%(+0.952)#884.4%(-0.342)#9,998
12.681063.9%3.1%(+0.746)#974.4%(-0.548)#10,627
13.681183.6%3.1%(+0.529)#1044.4%(-0.765)#11,345
14.681543.6%3.1%(+0.441)#1064.4%(-0.853)#11,646
15.681113.4%3.1%(+0.297)#1094.4%(-0.997)#12,138
16.681643.4%3.1%(+0.241)#1124.4%(-1.05)#12,318
17.681123.3%3.1%(+0.208)#1134.4%(-1.09)#12,452
18.681163.3%3.1%(+0.194)#1144.4%(-1.10)#12,494
19.681443.3%3.1%(+0.167)#1154.4%(-1.13)#12,598
20.681353.2%3.1%(+0.090)#1184.4%(-1.20)#12,894
21.681272.8%3.1%(-0.285)#1404.4%(-1.58)#14,155
22.681572.8%3.1%(-0.293)#1424.4%(-1.59)#14,190
23.681342.7%3.1%(-0.371)#1434.4%(-1.67)#14,469
24.681302.7%3.1%(-0.385)#1454.4%(-1.68)#14,521
25.681242.7%3.1%(-0.459)#1514.4%(-1.75)#14,751
26.681422.6%3.1%(-0.514)#1554.4%(-1.81)#14,961
27.681382.3%3.1%(-0.841)#1674.4%(-2.13)#16,130
28.681372.3%3.1%(-0.853)#1684.4%(-2.15)#16,176
29.681221.8%3.1%(-1.33)#1914.4%(-2.62)#17,736
30.681521.7%3.1%(-1.38)#1944.4%(-2.68)#17,920
31.681361.1%3.1%(-1.99)#2284.4%(-3.28)#19,793

Common Questions

What are the Top 10 Zip Codes with the Highest Percentage of Population with a Degree in Literature and Languages in Omaha, NE?
Top 10 Zip Codes with the Highest Percentage of Population with a Degree in Literature and Languages in Omaha, NE are:
#1
50.0%
#2
9.3%
#3
8.4%
#4
8.1%
#5
5.8%
#6
5.7%
#7
5.6%
#8
5.1%
#9
5.1%
#10
4.2%
What zip code has the Highest Percentage of Population with a Degree in Literature and Languages in Omaha, NE?
68182 has the Highest Percentage of Population with a Degree in Literature and Languages in Omaha, NE with 50.0%.
What is the Percentage of Population with a Degree in Literature and Languages in Omaha, NE?
Percentage of Population with a Degree in Literature and Languages in Omaha is 4.0%.
What is the Percentage of Population with a Degree in Literature and Languages in Nebraska?
Percentage of Population with a Degree in Literature and Languages in Nebraska is 3.1%.
What is the Percentage of Population with a Degree in Literature and Languages in the United States?
Percentage of Population with a Degree in Literature and Languages in the United States is 4.4%.