Zip Codes with the Youngest Female Population in Omaha, NE

RELATED REPORTS & OPTIONS

Youngest Population | Female
Population
Families and Households
Female Fertility
Female Fertility (Unmarried)
Race (Community Size)
Race (Percentage)
Ancestry (Community Size)
AfghanAfricanAlbanianAleutAmericanApacheArabArapahoArgentineanArmenianAustralianAustrianBangladeshiBasqueBelgianBhutaneseBlackfeetBolivianBrazilianBritishBulgarianBurmeseCajunCambodianCanadianCarpatho RusynCentral AmericanCentral American IndianCherokeeChickasawChileanChineseChippewaChoctawColombianComancheCosta RicanCreekCroatianCubanCzechCzechoslovakianDanishDominicanDutchEastern EuropeanEcuadorianEgyptianEnglishEthiopianEuropeanFilipinoFinnishFrenchFrench American IndianFrench CanadianGermanGerman RussianGhanaianGreekGuamanian / ChamorroGuatemalanGuyaneseHaitianHonduranHungarianIcelanderIndian (Asian)IndonesianInupiatIranianIraqiIrishIroquoisIsraeliItalianJamaicanJapaneseJordanianKenyanKiowaKoreanLaotianLatvianLebaneseLithuanianLuxembourgerMacedonianMalaysianMexicanMexican American IndianMoroccanNative HawaiianNavajoNicaraguanNigerianNorthern EuropeanNorwegianPakistaniPalestinianPanamanianPennsylvania GermanPeruvianPolishPortuguesePotawatomiPuebloPuerto RicanRomanianRussianSalvadoranSamoanScandinavianScotch-IrishScottishSeminoleSerbianSiouxSlavicSlovakSloveneSomaliSouth AfricanSouth AmericanSpaniardSpanishSri LankanSubsaharan AfricanSudaneseSwedishSwissSyrianThaiTlingit-HaidaTrinidadian and TobagonianTurkishUkrainianVenezuelanVietnameseWelshWest IndianYugoslavianZimbabwean
Ancestry (Percentage)
AfghanAfricanAlbanianAleutAmericanApacheArabArapahoArgentineanArmenianAustralianAustrianBangladeshiBasqueBelgianBhutaneseBlackfeetBolivianBrazilianBritishBulgarianBurmeseCajunCambodianCanadianCarpatho RusynCentral AmericanCentral American IndianCherokeeChickasawChileanChineseChippewaChoctawColombianComancheCosta RicanCreekCroatianCubanCzechCzechoslovakianDanishDominicanDutchEastern EuropeanEcuadorianEgyptianEnglishEthiopianEuropeanFilipinoFinnishFrenchFrench American IndianFrench CanadianGermanGerman RussianGhanaianGreekGuamanian / ChamorroGuatemalanGuyaneseHaitianHonduranHungarianIcelanderIndian (Asian)IndonesianInupiatIranianIraqiIrishIroquoisIsraeliItalianJamaicanJapaneseJordanianKenyanKiowaKoreanLaotianLatvianLebaneseLithuanianLuxembourgerMacedonianMalaysianMexicanMexican American IndianMoroccanNative HawaiianNavajoNicaraguanNigerianNorthern EuropeanNorwegianPakistaniPalestinianPanamanianPennsylvania GermanPeruvianPolishPortuguesePotawatomiPuebloPuerto RicanRomanianRussianSalvadoranSamoanScandinavianScotch-IrishScottishSeminoleSerbianSiouxSlavicSlovakSloveneSomaliSouth AfricanSouth AmericanSpaniardSpanishSri LankanSubsaharan AfricanSudaneseSwedishSwissSyrianThaiTlingit-HaidaTrinidadian and TobagonianTurkishUkrainianVenezuelanVietnameseWelshWest IndianYugoslavianZimbabwean
Immigrant Origin (Total)
AfghanistanAfricaArgentinaAsiaAustraliaBangladeshBarbadosBelarusBosnia and HerzegovinaBrazilBurma / MyanmarCameroonCanadaCaribbeanCentral AmericaChileChinaColombiaCongoCosta RicaCroatiaCubaCzechoslovakiaDominican RepublicEastern AfricaEastern AsiaEastern EuropeEgyptEl SalvadorEnglandEthiopiaEuropeFranceGermanyGhanaGreeceGuatemalaHondurasHong KongHungaryIndiaIndonesiaIranIraqIrelandIsraelItalyJamaicaJapanJordanKazakhstanKenyaKoreaKuwaitLaosLatin AmericaLatviaLithuaniaMalaysiaMexicoMiddle AfricaMoroccoNepalNetherlandsNicaraguaNigeriaNorthern AfricaNorthern EuropeOceaniaPakistanPanamaPeruPhilippinesPolandPortugalRomaniaRussiaSaudi ArabiaScotlandSierra LeoneSomaliaSouth AfricaSouth AmericaSouth Central AsiaSouth Eastern AsiaSouthern EuropeSpainSri LankaSudanSyriaTaiwanThailandTrinidad and TobagoTurkeyUgandaUkraineVenezuelaVietnamWestern AfricaWestern AsiaWestern EuropeZaireZimbabwe
Immigrant Origin (Percentage)
AfghanistanAfricaArgentinaAsiaAustraliaBangladeshBarbadosBelarusBosnia and HerzegovinaBrazilBurma / MyanmarCameroonCanadaCaribbeanCentral AmericaChileChinaColombiaCongoCosta RicaCroatiaCubaCzechoslovakiaDominican RepublicEastern AfricaEastern AsiaEastern EuropeEgyptEl SalvadorEnglandEthiopiaEuropeFranceGermanyGhanaGreeceGuatemalaHondurasHong KongHungaryIndiaIndonesiaIranIraqIrelandIsraelItalyJamaicaJapanJordanKazakhstanKenyaKoreaKuwaitLaosLatin AmericaLatviaLithuaniaMalaysiaMexicoMiddle AfricaMoroccoNepalNetherlandsNicaraguaNigeriaNorthern AfricaNorthern EuropeOceaniaPakistanPanamaPeruPhilippinesPolandPortugalRomaniaRussiaSaudi ArabiaScotlandSierra LeoneSomaliaSouth AfricaSouth AmericaSouth Central AsiaSouth Eastern AsiaSouthern EuropeSpainSri LankaSudanSyriaTaiwanThailandTrinidad and TobagoTurkeyUgandaUkraineVenezuelaVietnamWestern AfricaWestern AsiaWestern EuropeZaireZimbabwe
Income
Income (Families)
Income (Households)
Poverty
Poverty (Families)
Unemployment
Employment Occupations
Employment Industries
Employer Class
Commute Time
Commute Means
School Enrollment
Education by Degree Field
Occupancy
Finances
Physical Characteristics
Omaha
Compare Zip Codes
Comparison Subject

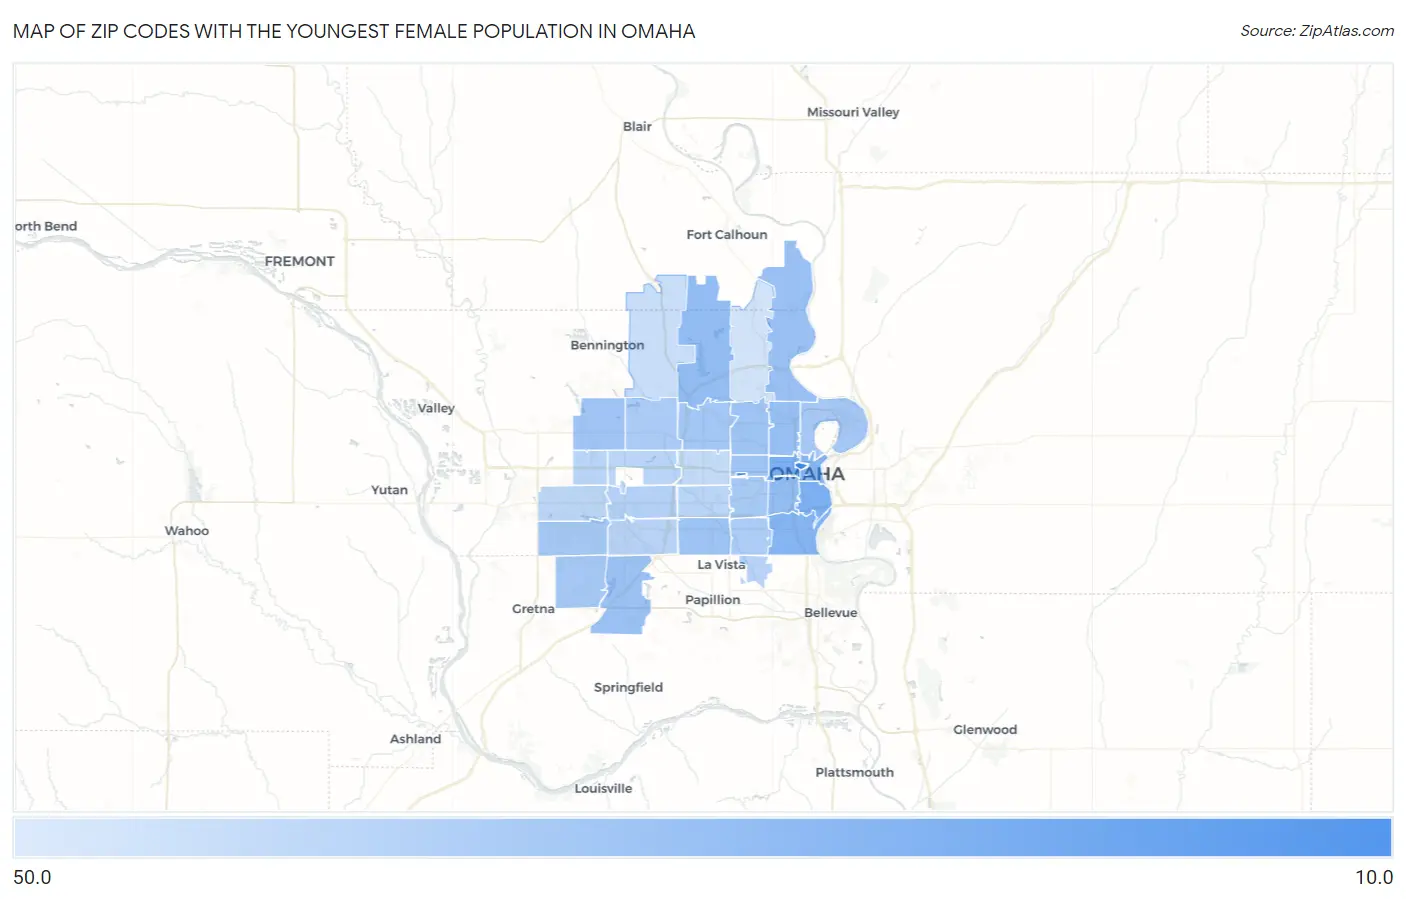
Map of Zip Codes with the Youngest Female Population in Omaha

50.0
0.0
Zip Codes with the Youngest Female Population in Omaha Map

Zip Codes with the Youngest Female Population in Omaha, NE

Zip Code Median Age vs State vs National
1.6818219.637.7(-18.1)#939.7(-20.1)#383
2.6817819.737.7(-18.0)#1039.7(-20.0)#394
3.6813128.637.7(-9.10)#3439.7(-11.1)#1,687
4.6810829.037.7(-8.70)#3539.7(-10.7)#1,802
5.6810730.237.7(-7.50)#4039.7(-9.50)#2,161
6.6810230.837.7(-6.90)#4639.7(-8.90)#2,416
7.6810532.637.7(-5.10)#6339.7(-7.10)#3,307
8.6812232.737.7(-5.00)#6539.7(-7.00)#3,362
9.6811133.737.7(-4.00)#7839.7(-6.00)#4,055
10.6811234.337.7(-3.40)#8539.7(-5.40)#4,525
11.6813834.437.7(-3.30)#9039.7(-5.30)#4,599
12.6810435.037.7(-2.70)#9739.7(-4.70)#5,093
13.6813235.037.7(-2.70)#9839.7(-4.70)#5,119
14.6812735.237.7(-2.50)#10239.7(-4.50)#5,287
15.6811635.337.7(-2.40)#10339.7(-4.40)#5,367
16.6813436.137.7(-1.60)#11539.7(-3.60)#6,233
17.6813636.337.7(-1.40)#12039.7(-3.40)#6,449
18.6813536.637.7(-1.10)#12539.7(-3.10)#6,780
19.6811036.737.7(-1.000)#12739.7(-3.00)#6,934
20.6810637.237.7(-0.500)#13739.7(-2.50)#7,468
21.6816437.437.7(-0.300)#14039.7(-2.30)#7,698
22.6811737.937.7(+0.200)#15539.7(-1.80)#8,408
23.6814439.437.7(+1.70)#19439.7(-0.300)#10,530
24.6815740.437.7(+2.70)#21839.7(+0.700)#12,097
25.6813740.637.7(+2.90)#22339.7(+0.900)#12,375
26.6811840.937.7(+3.20)#22539.7(+1.20)#12,897
27.6815441.337.7(+3.60)#23439.7(+1.60)#13,480
28.6812441.437.7(+3.70)#23939.7(+1.70)#13,656
29.6813041.637.7(+3.90)#24739.7(+1.90)#14,005
30.6811443.237.7(+5.50)#28439.7(+3.50)#16,417
31.6814244.737.7(+7.00)#32039.7(+5.00)#18,675
32.6815247.037.7(+9.30)#36339.7(+7.30)#21,587

Common Questions

What are the Top 10 Zip Codes with the Youngest Female Population in Omaha, NE?
Top 10 Zip Codes with the Youngest Female Population in Omaha, NE are:
#1
19.6
#2
19.7
#3
28.6
#4
29.0
#5
30.2
#6
30.8
#7
32.6
#8
32.7
#9
33.7
#10
34.3
What zip code has the Youngest Female Population in Omaha, NE?
68182 has the Youngest Female Population in Omaha, NE with 19.6.
What is the Median Female Age in Omaha, NE?
Median Female Age in Omaha is 36.0.
What is the Median Female Age in Nebraska?
Median Female Age in Nebraska is 37.7.
What is the Median Female Age in the United States?
Median Female Age in the United States is 39.7.