Zip Codes with the Highest Percentage of Households with Income Below $10,000 in Michigan
RELATED REPORTS & OPTIONS
Household Income | $0-10k
Michigan
Compare Zip Codes
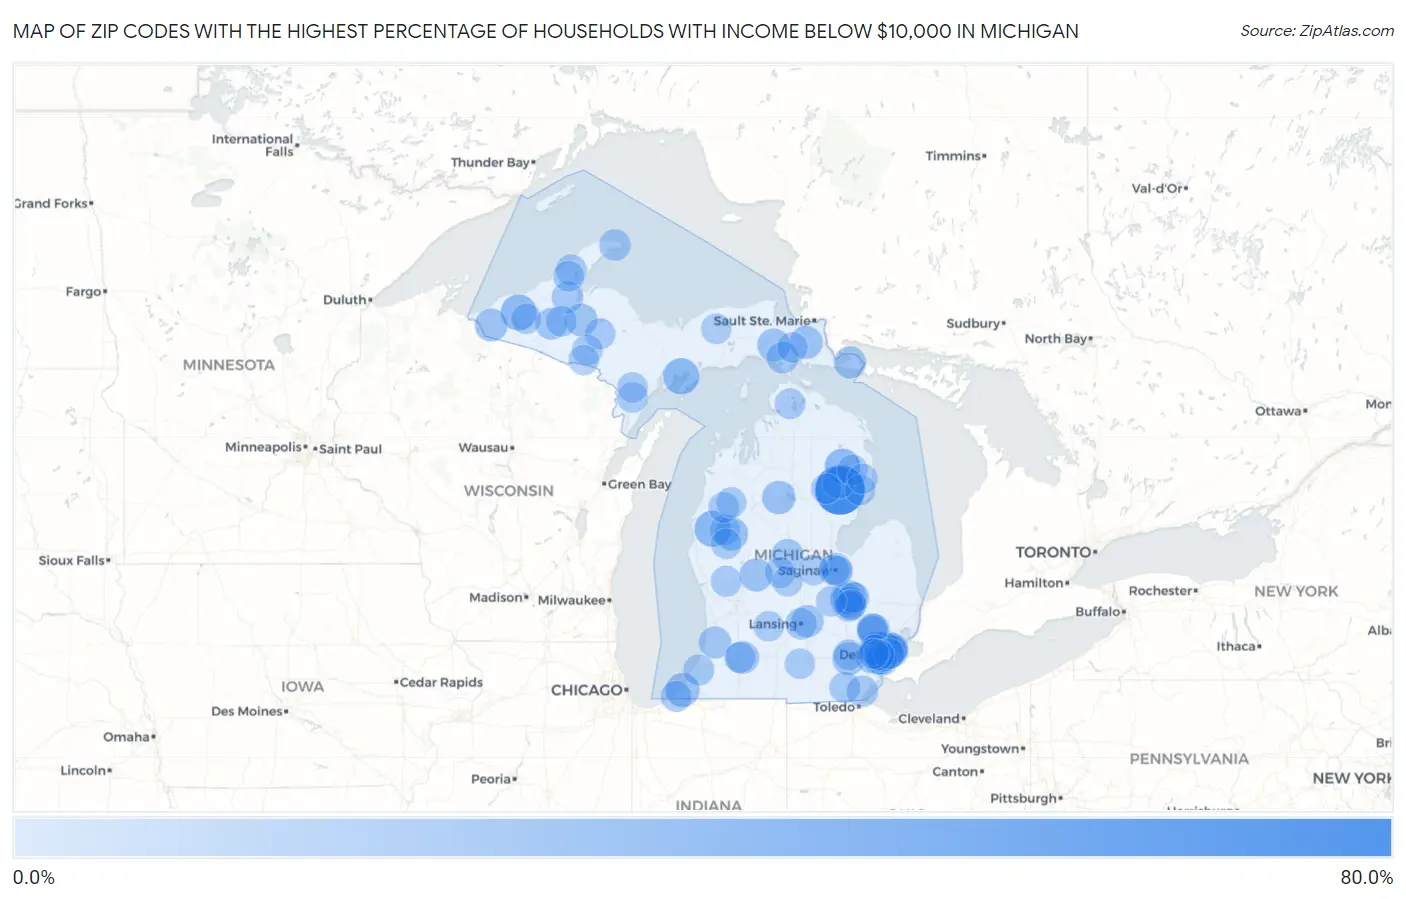
Map of Zip Codes with the Highest Percentage of Households with Income Below $10,000 in Michigan
0.0%
80.0%
Zip Codes with the Highest Percentage of Households with Income Below $10,000 in Michigan
| Zip Code | Households with Income < $10k | vs State | vs National | |
| 1. | 48743 | 68.4% | 5.0%(+63.4)#1 | 4.9%(+63.5)#60 |
| 2. | 49458 | 26.2% | 5.0%(+21.2)#2 | 4.9%(+21.3)#430 |
| 3. | 49864 | 26.1% | 5.0%(+21.1)#3 | 4.9%(+21.2)#437 |
| 4. | 49910 | 25.7% | 5.0%(+20.7)#4 | 4.9%(+20.8)#454 |
| 5. | 48728 | 23.6% | 5.0%(+18.6)#5 | 4.9%(+18.7)#553 |
| 6. | 49115 | 19.3% | 5.0%(+14.3)#6 | 4.9%(+14.4)#874 |
| 7. | 48505 | 18.6% | 5.0%(+13.6)#7 | 4.9%(+13.7)#934 |
| 8. | 49642 | 18.4% | 5.0%(+13.4)#8 | 4.9%(+13.5)#961 |
| 9. | 48238 | 18.3% | 5.0%(+13.3)#9 | 4.9%(+13.4)#973 |
| 10. | 48227 | 18.2% | 5.0%(+13.2)#10 | 4.9%(+13.3)#988 |
| 11. | 48208 | 17.6% | 5.0%(+12.6)#11 | 4.9%(+12.7)#1,070 |
| 12. | 48218 | 17.5% | 5.0%(+12.5)#12 | 4.9%(+12.6)#1,089 |
| 13. | 49667 | 17.4% | 5.0%(+12.4)#13 | 4.9%(+12.5)#1,104 |
| 14. | 48204 | 16.9% | 5.0%(+11.9)#14 | 4.9%(+12.0)#1,167 |
| 15. | 49322 | 16.8% | 5.0%(+11.8)#15 | 4.9%(+11.9)#1,193 |
| 16. | 48201 | 16.6% | 5.0%(+11.6)#16 | 4.9%(+11.7)#1,232 |
| 17. | 48206 | 16.4% | 5.0%(+11.4)#17 | 4.9%(+11.5)#1,256 |
| 18. | 49788 | 16.4% | 5.0%(+11.4)#18 | 4.9%(+11.5)#1,262 |
| 19. | 49793 | 16.4% | 5.0%(+11.4)#19 | 4.9%(+11.5)#1,274 |
| 20. | 48228 | 16.3% | 5.0%(+11.3)#20 | 4.9%(+11.4)#1,277 |
| 21. | 49007 | 16.0% | 5.0%(+11.0)#21 | 4.9%(+11.1)#1,334 |
| 22. | 49959 | 16.0% | 5.0%(+11.0)#22 | 4.9%(+11.1)#1,346 |
| 23. | 48202 | 15.7% | 5.0%(+10.7)#23 | 4.9%(+10.8)#1,393 |
| 24. | 48104 | 15.6% | 5.0%(+10.6)#24 | 4.9%(+10.7)#1,409 |
| 25. | 48213 | 15.4% | 5.0%(+10.4)#25 | 4.9%(+10.5)#1,439 |
| 26. | 49919 | 15.3% | 5.0%(+10.3)#26 | 4.9%(+10.4)#1,471 |
| 27. | 48234 | 14.7% | 5.0%(+9.70)#27 | 4.9%(+9.80)#1,590 |
| 28. | 48823 | 14.3% | 5.0%(+9.30)#28 | 4.9%(+9.40)#1,686 |
| 29. | 48504 | 14.2% | 5.0%(+9.20)#29 | 4.9%(+9.30)#1,716 |
| 30. | 49450 | 14.2% | 5.0%(+9.20)#30 | 4.9%(+9.30)#1,721 |
| 31. | 48761 | 14.2% | 5.0%(+9.20)#31 | 4.9%(+9.30)#1,731 |
| 32. | 49726 | 14.0% | 5.0%(+9.00)#32 | 4.9%(+9.10)#1,779 |
| 33. | 48122 | 13.8% | 5.0%(+8.80)#33 | 4.9%(+8.90)#1,821 |
| 34. | 48342 | 13.2% | 5.0%(+8.20)#34 | 4.9%(+8.30)#1,999 |
| 35. | 48503 | 13.1% | 5.0%(+8.10)#35 | 4.9%(+8.20)#2,026 |
| 36. | 48214 | 13.0% | 5.0%(+8.00)#36 | 4.9%(+8.10)#2,068 |
| 37. | 49760 | 13.0% | 5.0%(+8.00)#37 | 4.9%(+8.10)#2,092 |
| 38. | 48210 | 12.9% | 5.0%(+7.90)#38 | 4.9%(+8.00)#2,108 |
| 39. | 48858 | 12.7% | 5.0%(+7.70)#39 | 4.9%(+7.80)#2,188 |
| 40. | 49967 | 12.7% | 5.0%(+7.70)#40 | 4.9%(+7.80)#2,219 |
| 41. | 48235 | 12.3% | 5.0%(+7.30)#41 | 4.9%(+7.40)#2,325 |
| 42. | 48219 | 12.3% | 5.0%(+7.30)#42 | 4.9%(+7.40)#2,326 |
| 43. | 49958 | 12.3% | 5.0%(+7.30)#43 | 4.9%(+7.40)#2,353 |
| 44. | 49918 | 12.2% | 5.0%(+7.20)#44 | 4.9%(+7.30)#2,403 |
| 45. | 48120 | 12.1% | 5.0%(+7.10)#45 | 4.9%(+7.20)#2,413 |
| 46. | 48211 | 12.1% | 5.0%(+7.10)#46 | 4.9%(+7.20)#2,419 |
| 47. | 48933 | 12.0% | 5.0%(+7.00)#47 | 4.9%(+7.10)#2,469 |
| 48. | 48212 | 11.9% | 5.0%(+6.90)#48 | 4.9%(+7.00)#2,501 |
| 49. | 48203 | 11.9% | 5.0%(+6.90)#49 | 4.9%(+7.00)#2,506 |
| 50. | 48215 | 11.7% | 5.0%(+6.70)#50 | 4.9%(+6.80)#2,588 |
| 51. | 48607 | 11.7% | 5.0%(+6.70)#51 | 4.9%(+6.80)#2,600 |
| 52. | 48141 | 11.4% | 5.0%(+6.40)#52 | 4.9%(+6.50)#2,724 |
| 53. | 48216 | 11.4% | 5.0%(+6.40)#53 | 4.9%(+6.50)#2,742 |
| 54. | 48145 | 11.3% | 5.0%(+6.30)#54 | 4.9%(+6.40)#2,803 |
| 55. | 48224 | 11.2% | 5.0%(+6.20)#55 | 4.9%(+6.30)#2,836 |
| 56. | 48217 | 11.0% | 5.0%(+6.00)#56 | 4.9%(+6.10)#2,969 |
| 57. | 48209 | 10.9% | 5.0%(+5.90)#57 | 4.9%(+6.00)#3,001 |
| 58. | 49238 | 10.9% | 5.0%(+5.90)#58 | 4.9%(+6.00)#3,027 |
| 59. | 49931 | 10.7% | 5.0%(+5.70)#59 | 4.9%(+5.80)#3,126 |
| 60. | 49022 | 10.6% | 5.0%(+5.60)#60 | 4.9%(+5.70)#3,173 |
| 61. | 49117 | 10.4% | 5.0%(+5.40)#61 | 4.9%(+5.50)#3,320 |
| 62. | 49963 | 10.2% | 5.0%(+5.20)#62 | 4.9%(+5.30)#3,481 |
| 63. | 49961 | 10.2% | 5.0%(+5.20)#63 | 4.9%(+5.30)#3,490 |
| 64. | 48341 | 10.1% | 5.0%(+5.10)#64 | 4.9%(+5.20)#3,501 |
| 65. | 49006 | 10.0% | 5.0%(+5.00)#65 | 4.9%(+5.10)#3,569 |
| 66. | 48340 | 10.0% | 5.0%(+5.00)#66 | 4.9%(+5.10)#3,571 |
| 67. | 48891 | 10.0% | 5.0%(+5.00)#67 | 4.9%(+5.10)#3,596 |
| 68. | 49303 | 10.0% | 5.0%(+5.00)#68 | 4.9%(+5.10)#3,615 |
| 69. | 49304 | 9.8% | 5.0%(+4.80)#69 | 4.9%(+4.90)#3,751 |
| 70. | 49879 | 9.8% | 5.0%(+4.80)#70 | 4.9%(+4.90)#3,775 |
| 71. | 48507 | 9.7% | 5.0%(+4.70)#71 | 4.9%(+4.80)#3,799 |
| 72. | 48223 | 9.7% | 5.0%(+4.70)#72 | 4.9%(+4.80)#3,802 |
| 73. | 49920 | 9.7% | 5.0%(+4.70)#73 | 4.9%(+4.80)#3,827 |
| 74. | 48105 | 9.6% | 5.0%(+4.60)#74 | 4.9%(+4.70)#3,870 |
| 75. | 49689 | 9.6% | 5.0%(+4.60)#75 | 4.9%(+4.70)#3,919 |
| 76. | 48207 | 9.5% | 5.0%(+4.50)#76 | 4.9%(+4.60)#3,962 |
| 77. | 48126 | 9.4% | 5.0%(+4.40)#77 | 4.9%(+4.50)#4,026 |
| 78. | 49812 | 9.4% | 5.0%(+4.40)#78 | 4.9%(+4.50)#4,068 |
| 79. | 48705 | 9.4% | 5.0%(+4.40)#79 | 4.9%(+4.50)#4,077 |
| 80. | 48506 | 9.3% | 5.0%(+4.30)#80 | 4.9%(+4.40)#4,103 |
| 81. | 48529 | 9.3% | 5.0%(+4.30)#81 | 4.9%(+4.40)#4,122 |
| 82. | 49780 | 9.3% | 5.0%(+4.30)#82 | 4.9%(+4.40)#4,150 |
| 83. | 49716 | 9.3% | 5.0%(+4.30)#83 | 4.9%(+4.40)#4,167 |
| 84. | 48602 | 9.2% | 5.0%(+4.20)#84 | 4.9%(+4.30)#4,205 |
| 85. | 48654 | 9.2% | 5.0%(+4.20)#85 | 4.9%(+4.30)#4,247 |
| 86. | 49874 | 9.2% | 5.0%(+4.20)#86 | 4.9%(+4.30)#4,270 |
| 87. | 48601 | 9.1% | 5.0%(+4.10)#87 | 4.9%(+4.20)#4,297 |
| 88. | 48637 | 9.0% | 5.0%(+4.00)#88 | 4.9%(+4.10)#4,442 |
| 89. | 49902 | 9.0% | 5.0%(+4.00)#89 | 4.9%(+4.10)#4,494 |
| 90. | 49283 | 8.9% | 5.0%(+3.90)#90 | 4.9%(+4.00)#4,539 |
| 91. | 49309 | 8.9% | 5.0%(+3.90)#91 | 4.9%(+4.00)#4,562 |
| 92. | 49883 | 8.9% | 5.0%(+3.90)#92 | 4.9%(+4.00)#4,597 |
| 93. | 49638 | 8.8% | 5.0%(+3.80)#93 | 4.9%(+3.90)#4,682 |
| 94. | 49925 | 8.8% | 5.0%(+3.80)#94 | 4.9%(+3.90)#4,692 |
| 95. | 48817 | 8.6% | 5.0%(+3.60)#95 | 4.9%(+3.70)#4,860 |
| 96. | 48889 | 8.6% | 5.0%(+3.60)#96 | 4.9%(+3.70)#4,884 |
| 97. | 48127 | 8.5% | 5.0%(+3.50)#97 | 4.9%(+3.60)#4,915 |
| 98. | 48750 | 8.5% | 5.0%(+3.50)#98 | 4.9%(+3.60)#4,946 |
| 99. | 48897 | 8.5% | 5.0%(+3.50)#99 | 4.9%(+3.60)#4,985 |
| 100. | 48745 | 8.4% | 5.0%(+3.40)#100 | 4.9%(+3.50)#5,106 |
Common Questions
What are the Top 10 Zip Codes with the Highest Percentage of Households with Income Below $10,000 in Michigan?
Top 10 Zip Codes with the Highest Percentage of Households with Income Below $10,000 in Michigan are:
What zip code has the Highest Percentage of Households with Income Below $10,000 in Michigan?
48743 has the Highest Percentage of Households with Income Below $10,000 in Michigan with 68.4%.
What is the Percentage of Households with Income Below $10,000 in the State of Michigan?
Percentage of Households with Income Below $10,000 in Michigan is 5.0%.
What is the Percentage of Households with Income Below $10,000 in the United States?
Percentage of Households with Income Below $10,000 in the United States is 4.9%.