Zip Codes with the Highest Percentage of Self-Employed / Not Incorporated in Omaha, NE

RELATED REPORTS & OPTIONS

Self-Employed / Not Incorporated
Population
Families and Households
Female Fertility
Female Fertility (Unmarried)
Race (Community Size)
Race (Percentage)
Ancestry (Community Size)
AfghanAfricanAlbanianAleutAmericanApacheArabArapahoArgentineanArmenianAustralianAustrianBangladeshiBasqueBelgianBhutaneseBlackfeetBolivianBrazilianBritishBulgarianBurmeseCajunCambodianCanadianCarpatho RusynCentral AmericanCentral American IndianCherokeeChickasawChileanChineseChippewaChoctawColombianComancheCosta RicanCreekCroatianCubanCzechCzechoslovakianDanishDominicanDutchEastern EuropeanEcuadorianEgyptianEnglishEthiopianEuropeanFilipinoFinnishFrenchFrench American IndianFrench CanadianGermanGerman RussianGhanaianGreekGuamanian / ChamorroGuatemalanGuyaneseHaitianHonduranHungarianIcelanderIndian (Asian)IndonesianInupiatIranianIraqiIrishIroquoisIsraeliItalianJamaicanJapaneseJordanianKenyanKiowaKoreanLaotianLatvianLebaneseLithuanianLuxembourgerMacedonianMalaysianMexicanMexican American IndianMoroccanNative HawaiianNavajoNicaraguanNigerianNorthern EuropeanNorwegianPakistaniPalestinianPanamanianPennsylvania GermanPeruvianPolishPortuguesePotawatomiPuebloPuerto RicanRomanianRussianSalvadoranSamoanScandinavianScotch-IrishScottishSeminoleSerbianSiouxSlavicSlovakSloveneSomaliSouth AfricanSouth AmericanSpaniardSpanishSri LankanSubsaharan AfricanSudaneseSwedishSwissSyrianThaiTlingit-HaidaTrinidadian and TobagonianTurkishUkrainianVenezuelanVietnameseWelshWest IndianYugoslavianZimbabwean
Ancestry (Percentage)
AfghanAfricanAlbanianAleutAmericanApacheArabArapahoArgentineanArmenianAustralianAustrianBangladeshiBasqueBelgianBhutaneseBlackfeetBolivianBrazilianBritishBulgarianBurmeseCajunCambodianCanadianCarpatho RusynCentral AmericanCentral American IndianCherokeeChickasawChileanChineseChippewaChoctawColombianComancheCosta RicanCreekCroatianCubanCzechCzechoslovakianDanishDominicanDutchEastern EuropeanEcuadorianEgyptianEnglishEthiopianEuropeanFilipinoFinnishFrenchFrench American IndianFrench CanadianGermanGerman RussianGhanaianGreekGuamanian / ChamorroGuatemalanGuyaneseHaitianHonduranHungarianIcelanderIndian (Asian)IndonesianInupiatIranianIraqiIrishIroquoisIsraeliItalianJamaicanJapaneseJordanianKenyanKiowaKoreanLaotianLatvianLebaneseLithuanianLuxembourgerMacedonianMalaysianMexicanMexican American IndianMoroccanNative HawaiianNavajoNicaraguanNigerianNorthern EuropeanNorwegianPakistaniPalestinianPanamanianPennsylvania GermanPeruvianPolishPortuguesePotawatomiPuebloPuerto RicanRomanianRussianSalvadoranSamoanScandinavianScotch-IrishScottishSeminoleSerbianSiouxSlavicSlovakSloveneSomaliSouth AfricanSouth AmericanSpaniardSpanishSri LankanSubsaharan AfricanSudaneseSwedishSwissSyrianThaiTlingit-HaidaTrinidadian and TobagonianTurkishUkrainianVenezuelanVietnameseWelshWest IndianYugoslavianZimbabwean
Immigrant Origin (Total)
AfghanistanAfricaArgentinaAsiaAustraliaBangladeshBarbadosBelarusBosnia and HerzegovinaBrazilBurma / MyanmarCameroonCanadaCaribbeanCentral AmericaChileChinaColombiaCongoCosta RicaCroatiaCubaCzechoslovakiaDominican RepublicEastern AfricaEastern AsiaEastern EuropeEgyptEl SalvadorEnglandEthiopiaEuropeFranceGermanyGhanaGreeceGuatemalaHondurasHong KongHungaryIndiaIndonesiaIranIraqIrelandIsraelItalyJamaicaJapanJordanKazakhstanKenyaKoreaKuwaitLaosLatin AmericaLatviaLithuaniaMalaysiaMexicoMiddle AfricaMoroccoNepalNetherlandsNicaraguaNigeriaNorthern AfricaNorthern EuropeOceaniaPakistanPanamaPeruPhilippinesPolandPortugalRomaniaRussiaSaudi ArabiaScotlandSierra LeoneSomaliaSouth AfricaSouth AmericaSouth Central AsiaSouth Eastern AsiaSouthern EuropeSpainSri LankaSudanSyriaTaiwanThailandTrinidad and TobagoTurkeyUgandaUkraineVenezuelaVietnamWestern AfricaWestern AsiaWestern EuropeZaireZimbabwe
Immigrant Origin (Percentage)
AfghanistanAfricaArgentinaAsiaAustraliaBangladeshBarbadosBelarusBosnia and HerzegovinaBrazilBurma / MyanmarCameroonCanadaCaribbeanCentral AmericaChileChinaColombiaCongoCosta RicaCroatiaCubaCzechoslovakiaDominican RepublicEastern AfricaEastern AsiaEastern EuropeEgyptEl SalvadorEnglandEthiopiaEuropeFranceGermanyGhanaGreeceGuatemalaHondurasHong KongHungaryIndiaIndonesiaIranIraqIrelandIsraelItalyJamaicaJapanJordanKazakhstanKenyaKoreaKuwaitLaosLatin AmericaLatviaLithuaniaMalaysiaMexicoMiddle AfricaMoroccoNepalNetherlandsNicaraguaNigeriaNorthern AfricaNorthern EuropeOceaniaPakistanPanamaPeruPhilippinesPolandPortugalRomaniaRussiaSaudi ArabiaScotlandSierra LeoneSomaliaSouth AfricaSouth AmericaSouth Central AsiaSouth Eastern AsiaSouthern EuropeSpainSri LankaSudanSyriaTaiwanThailandTrinidad and TobagoTurkeyUgandaUkraineVenezuelaVietnamWestern AfricaWestern AsiaWestern EuropeZaireZimbabwe
Income
Income (Families)
Income (Households)
Poverty
Poverty (Families)
Unemployment
Employment Occupations
Employment Industries
Employer Class
Commute Time
Commute Means
School Enrollment
Education by Degree Field
Occupancy
Finances
Physical Characteristics
Omaha
Compare Zip Codes
Comparison Subject

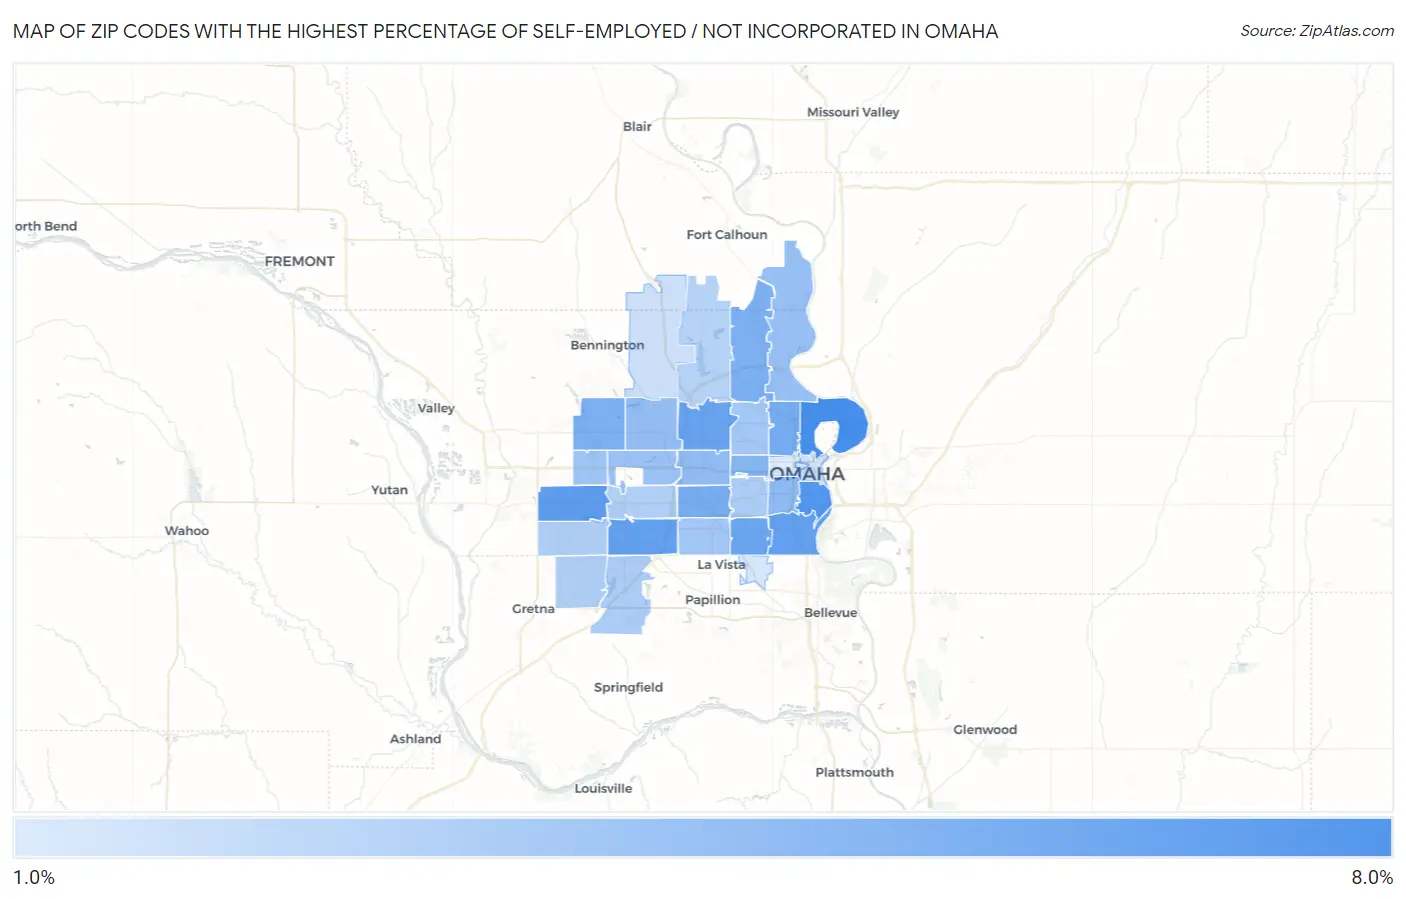
Map of Zip Codes with the Highest Percentage of Self-Employed / Not Incorporated in Omaha

0.0%
8.0%
Zip Codes with the Highest Percentage of Self-Employed / Not Incorporated in Omaha Map

Zip Codes with the Highest Percentage of Self-Employed / Not Incorporated in Omaha, NE

Zip Code % Self-Employed / Not Incorporated vs State vs National
1.681106.9%6.3%(+0.600)#3915.8%(+1.10)#13,277
2.681086.5%6.3%(+0.204)#4045.8%(+0.706)#14,406
3.681306.1%6.3%(-0.186)#4205.8%(+0.316)#15,637
4.681076.0%6.3%(-0.328)#4265.8%(+0.174)#16,113
5.681376.0%6.3%(-0.363)#4285.8%(+0.138)#16,214
6.681345.8%6.3%(-0.471)#4345.8%(+0.031)#16,561
7.681175.6%6.3%(-0.685)#4425.8%(-0.184)#17,295
8.681115.4%6.3%(-0.953)#4545.8%(-0.451)#18,273
9.681245.3%6.3%(-1.01)#4575.8%(-0.512)#18,510
10.681525.2%6.3%(-1.16)#4605.8%(-0.663)#19,105
11.681165.1%6.3%(-1.21)#4615.8%(-0.708)#19,264
12.681324.9%6.3%(-1.43)#4645.8%(-0.926)#20,080
13.681054.5%6.3%(-1.82)#4805.8%(-1.32)#21,588
14.681144.4%6.3%(-1.88)#4855.8%(-1.37)#21,812
15.681644.3%6.3%(-1.99)#4905.8%(-1.49)#22,223
16.681124.2%6.3%(-2.11)#4945.8%(-1.61)#22,667
17.681544.1%6.3%(-2.22)#4985.8%(-1.72)#23,049
18.681183.9%6.3%(-2.47)#5035.8%(-1.96)#23,887
19.681043.8%6.3%(-2.52)#5055.8%(-2.02)#24,083
20.681273.8%6.3%(-2.54)#5065.8%(-2.04)#24,144
21.681383.5%6.3%(-2.81)#5095.8%(-2.30)#24,957
22.681063.5%6.3%(-2.83)#5115.8%(-2.32)#25,031
23.681363.4%6.3%(-2.94)#5175.8%(-2.43)#25,363
24.681443.3%6.3%(-2.99)#5185.8%(-2.49)#25,537
25.681353.3%6.3%(-3.00)#5195.8%(-2.50)#25,555
26.681223.2%6.3%(-3.10)#5255.8%(-2.60)#25,826
27.681823.0%6.3%(-3.36)#5335.8%(-2.86)#26,479
28.681422.4%6.3%(-3.90)#5415.8%(-3.39)#27,552
29.681022.4%6.3%(-3.96)#5435.8%(-3.46)#27,657
30.681782.2%6.3%(-4.10)#5495.8%(-3.60)#27,926
31.681572.1%6.3%(-4.17)#5525.8%(-3.67)#28,036
32.681311.9%6.3%(-4.41)#5535.8%(-3.91)#28,366

Common Questions

What are the Top 10 Zip Codes with the Highest Percentage of Self-Employed / Not Incorporated in Omaha, NE?
Top 10 Zip Codes with the Highest Percentage of Self-Employed / Not Incorporated in Omaha, NE are:
#1
6.9%
#2
6.5%
#3
6.1%
#4
6.0%
#5
6.0%
#6
5.8%
#7
5.6%
#8
5.4%
#9
5.3%
#10
5.2%
What zip code has the Highest Percentage of Self-Employed / Not Incorporated in Omaha, NE?
68110 has the Highest Percentage of Self-Employed / Not Incorporated in Omaha, NE with 6.9%.
What is the Percentage of Self-Employed / Not Incorporated in Omaha, NE?
Percentage of Self-Employed / Not Incorporated in Omaha is 4.6%.
What is the Percentage of Self-Employed / Not Incorporated in Nebraska?
Percentage of Self-Employed / Not Incorporated in Nebraska is 6.3%.
What is the Percentage of Self-Employed / Not Incorporated in the United States?
Percentage of Self-Employed / Not Incorporated in the United States is 5.8%.