Zip Codes with the Highest Percentage of Households with Income Above $100,000 in Omaha, NE
RELATED REPORTS & OPTIONS
Household Income | $100k+
Omaha
Compare Zip Codes
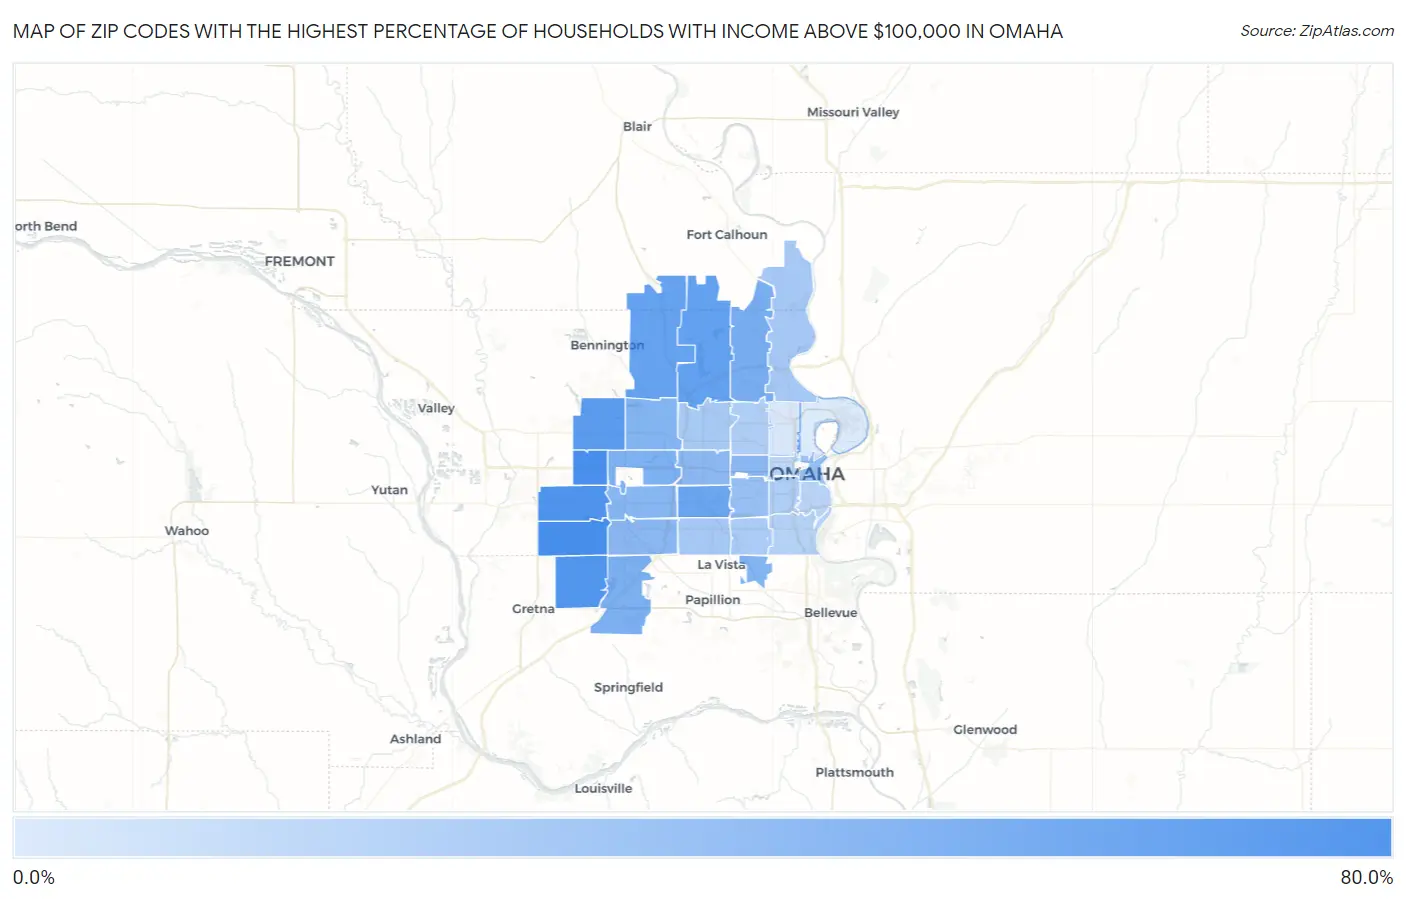
Map of Zip Codes with the Highest Percentage of Households with Income Above $100,000 in Omaha
6.7%
67.5%
Zip Codes with the Highest Percentage of Households with Income Above $100,000 in Omaha, NE
| Zip Code | Households with Income > $100k | vs State | vs National | |
| 1. | 68135 | 67.5% | 34.0%(+33.5)#7 | 37.3%(+30.2)#1,220 |
| 2. | 68118 | 66.1% | 34.0%(+32.1)#10 | 37.3%(+28.8)#1,398 |
| 3. | 68130 | 63.4% | 34.0%(+29.4)#14 | 37.3%(+26.1)#1,772 |
| 4. | 68136 | 62.1% | 34.0%(+28.1)#15 | 37.3%(+24.8)#1,985 |
| 5. | 68116 | 57.6% | 34.0%(+23.6)#25 | 37.3%(+20.3)#2,842 |
| 6. | 68122 | 54.2% | 34.0%(+20.2)#31 | 37.3%(+16.9)#3,670 |
| 7. | 68142 | 53.5% | 34.0%(+19.5)#34 | 37.3%(+16.2)#3,840 |
| 8. | 68124 | 49.4% | 34.0%(+15.4)#54 | 37.3%(+12.1)#5,060 |
| 9. | 68152 | 44.7% | 34.0%(+10.7)#75 | 37.3%(+7.40)#6,751 |
| 10. | 68138 | 43.2% | 34.0%(+9.20)#84 | 37.3%(+5.90)#7,337 |
| 11. | 68154 | 41.6% | 34.0%(+7.60)#100 | 37.3%(+4.30)#8,075 |
| 12. | 68164 | 39.9% | 34.0%(+5.90)#122 | 37.3%(+2.60)#8,955 |
| 13. | 68157 | 39.8% | 34.0%(+5.80)#125 | 37.3%(+2.50)#9,029 |
| 14. | 68144 | 38.1% | 34.0%(+4.10)#144 | 37.3%(+0.800)#9,924 |
| 15. | 68137 | 37.0% | 34.0%(+3.00)#157 | 37.3%(-0.300)#10,544 |
| 16. | 68132 | 37.0% | 34.0%(+3.00)#158 | 37.3%(-0.300)#10,550 |
| 17. | 68114 | 36.0% | 34.0%(+2.00)#169 | 37.3%(-1.30)#11,134 |
| 18. | 68106 | 31.3% | 34.0%(-2.70)#236 | 37.3%(-6.00)#14,381 |
| 19. | 68102 | 31.2% | 34.0%(-2.80)#237 | 37.3%(-6.10)#14,481 |
| 20. | 68127 | 26.3% | 34.0%(-7.70)#344 | 37.3%(-11.0)#18,594 |
| 21. | 68112 | 26.3% | 34.0%(-7.70)#345 | 37.3%(-11.0)#18,603 |
| 22. | 68134 | 25.2% | 34.0%(-8.80)#365 | 37.3%(-12.1)#19,564 |
| 23. | 68117 | 24.3% | 34.0%(-9.70)#383 | 37.3%(-13.0)#20,414 |
| 24. | 68104 | 23.0% | 34.0%(-11.0)#408 | 37.3%(-14.3)#21,556 |
| 25. | 68105 | 22.5% | 34.0%(-11.5)#417 | 37.3%(-14.8)#21,973 |
| 26. | 68107 | 20.4% | 34.0%(-13.6)#444 | 37.3%(-16.9)#23,706 |
| 27. | 68108 | 19.2% | 34.0%(-14.8)#465 | 37.3%(-18.1)#24,666 |
| 28. | 68131 | 17.2% | 34.0%(-16.8)#487 | 37.3%(-20.1)#26,094 |
| 29. | 68111 | 8.2% | 34.0%(-25.8)#546 | 37.3%(-29.1)#30,379 |
| 30. | 68110 | 6.7% | 34.0%(-27.3)#553 | 37.3%(-30.6)#30,731 |
1
Common Questions
What are the Top 10 Zip Codes with the Highest Percentage of Households with Income Above $100,000 in Omaha, NE?
Top 10 Zip Codes with the Highest Percentage of Households with Income Above $100,000 in Omaha, NE are:
What zip code has the Highest Percentage of Households with Income Above $100,000 in Omaha, NE?
68135 has the Highest Percentage of Households with Income Above $100,000 in Omaha, NE with 67.5%.
What is the Percentage of Households with Income Above $100,000 in Omaha, NE?
Percentage of Households with Income Above $100,000 in Omaha is 33.8%.
What is the Percentage of Households with Income Above $100,000 in Nebraska?
Percentage of Households with Income Above $100,000 in Nebraska is 34.0%.
What is the Percentage of Households with Income Above $100,000 in the United States?
Percentage of Households with Income Above $100,000 in the United States is 37.3%.