Zip Codes with the Highest Percentage of Population Employed in Legal Services & Support in Omaha, NE

RELATED REPORTS & OPTIONS

Legal Services & Support
Population
Families and Households
Female Fertility
Female Fertility (Unmarried)
Race (Community Size)
Race (Percentage)
Ancestry (Community Size)
AfghanAfricanAlbanianAleutAmericanApacheArabArapahoArgentineanArmenianAustralianAustrianBangladeshiBasqueBelgianBhutaneseBlackfeetBolivianBrazilianBritishBulgarianBurmeseCajunCambodianCanadianCarpatho RusynCentral AmericanCentral American IndianCherokeeChickasawChileanChineseChippewaChoctawColombianComancheCosta RicanCreekCroatianCubanCzechCzechoslovakianDanishDominicanDutchEastern EuropeanEcuadorianEgyptianEnglishEthiopianEuropeanFilipinoFinnishFrenchFrench American IndianFrench CanadianGermanGerman RussianGhanaianGreekGuamanian / ChamorroGuatemalanGuyaneseHaitianHonduranHungarianIcelanderIndian (Asian)IndonesianInupiatIranianIraqiIrishIroquoisIsraeliItalianJamaicanJapaneseJordanianKenyanKiowaKoreanLaotianLatvianLebaneseLithuanianLuxembourgerMacedonianMalaysianMexicanMexican American IndianMoroccanNative HawaiianNavajoNicaraguanNigerianNorthern EuropeanNorwegianPakistaniPalestinianPanamanianPennsylvania GermanPeruvianPolishPortuguesePotawatomiPuebloPuerto RicanRomanianRussianSalvadoranSamoanScandinavianScotch-IrishScottishSeminoleSerbianSiouxSlavicSlovakSloveneSomaliSouth AfricanSouth AmericanSpaniardSpanishSri LankanSubsaharan AfricanSudaneseSwedishSwissSyrianThaiTlingit-HaidaTrinidadian and TobagonianTurkishUkrainianVenezuelanVietnameseWelshWest IndianYugoslavianZimbabwean
Ancestry (Percentage)
AfghanAfricanAlbanianAleutAmericanApacheArabArapahoArgentineanArmenianAustralianAustrianBangladeshiBasqueBelgianBhutaneseBlackfeetBolivianBrazilianBritishBulgarianBurmeseCajunCambodianCanadianCarpatho RusynCentral AmericanCentral American IndianCherokeeChickasawChileanChineseChippewaChoctawColombianComancheCosta RicanCreekCroatianCubanCzechCzechoslovakianDanishDominicanDutchEastern EuropeanEcuadorianEgyptianEnglishEthiopianEuropeanFilipinoFinnishFrenchFrench American IndianFrench CanadianGermanGerman RussianGhanaianGreekGuamanian / ChamorroGuatemalanGuyaneseHaitianHonduranHungarianIcelanderIndian (Asian)IndonesianInupiatIranianIraqiIrishIroquoisIsraeliItalianJamaicanJapaneseJordanianKenyanKiowaKoreanLaotianLatvianLebaneseLithuanianLuxembourgerMacedonianMalaysianMexicanMexican American IndianMoroccanNative HawaiianNavajoNicaraguanNigerianNorthern EuropeanNorwegianPakistaniPalestinianPanamanianPennsylvania GermanPeruvianPolishPortuguesePotawatomiPuebloPuerto RicanRomanianRussianSalvadoranSamoanScandinavianScotch-IrishScottishSeminoleSerbianSiouxSlavicSlovakSloveneSomaliSouth AfricanSouth AmericanSpaniardSpanishSri LankanSubsaharan AfricanSudaneseSwedishSwissSyrianThaiTlingit-HaidaTrinidadian and TobagonianTurkishUkrainianVenezuelanVietnameseWelshWest IndianYugoslavianZimbabwean
Immigrant Origin (Total)
AfghanistanAfricaArgentinaAsiaAustraliaBangladeshBarbadosBelarusBosnia and HerzegovinaBrazilBurma / MyanmarCameroonCanadaCaribbeanCentral AmericaChileChinaColombiaCongoCosta RicaCroatiaCubaCzechoslovakiaDominican RepublicEastern AfricaEastern AsiaEastern EuropeEgyptEl SalvadorEnglandEthiopiaEuropeFranceGermanyGhanaGreeceGuatemalaHondurasHong KongHungaryIndiaIndonesiaIranIraqIrelandIsraelItalyJamaicaJapanJordanKazakhstanKenyaKoreaKuwaitLaosLatin AmericaLatviaLithuaniaMalaysiaMexicoMiddle AfricaMoroccoNepalNetherlandsNicaraguaNigeriaNorthern AfricaNorthern EuropeOceaniaPakistanPanamaPeruPhilippinesPolandPortugalRomaniaRussiaSaudi ArabiaScotlandSierra LeoneSomaliaSouth AfricaSouth AmericaSouth Central AsiaSouth Eastern AsiaSouthern EuropeSpainSri LankaSudanSyriaTaiwanThailandTrinidad and TobagoTurkeyUgandaUkraineVenezuelaVietnamWestern AfricaWestern AsiaWestern EuropeZaireZimbabwe
Immigrant Origin (Percentage)
AfghanistanAfricaArgentinaAsiaAustraliaBangladeshBarbadosBelarusBosnia and HerzegovinaBrazilBurma / MyanmarCameroonCanadaCaribbeanCentral AmericaChileChinaColombiaCongoCosta RicaCroatiaCubaCzechoslovakiaDominican RepublicEastern AfricaEastern AsiaEastern EuropeEgyptEl SalvadorEnglandEthiopiaEuropeFranceGermanyGhanaGreeceGuatemalaHondurasHong KongHungaryIndiaIndonesiaIranIraqIrelandIsraelItalyJamaicaJapanJordanKazakhstanKenyaKoreaKuwaitLaosLatin AmericaLatviaLithuaniaMalaysiaMexicoMiddle AfricaMoroccoNepalNetherlandsNicaraguaNigeriaNorthern AfricaNorthern EuropeOceaniaPakistanPanamaPeruPhilippinesPolandPortugalRomaniaRussiaSaudi ArabiaScotlandSierra LeoneSomaliaSouth AfricaSouth AmericaSouth Central AsiaSouth Eastern AsiaSouthern EuropeSpainSri LankaSudanSyriaTaiwanThailandTrinidad and TobagoTurkeyUgandaUkraineVenezuelaVietnamWestern AfricaWestern AsiaWestern EuropeZaireZimbabwe
Income
Income (Families)
Income (Households)
Poverty
Poverty (Families)
Unemployment
Employment Occupations
Employment Industries
Employer Class
Commute Time
Commute Means
School Enrollment
Education by Degree Field
Occupancy
Finances
Physical Characteristics
Omaha
Compare Zip Codes
Comparison Subject

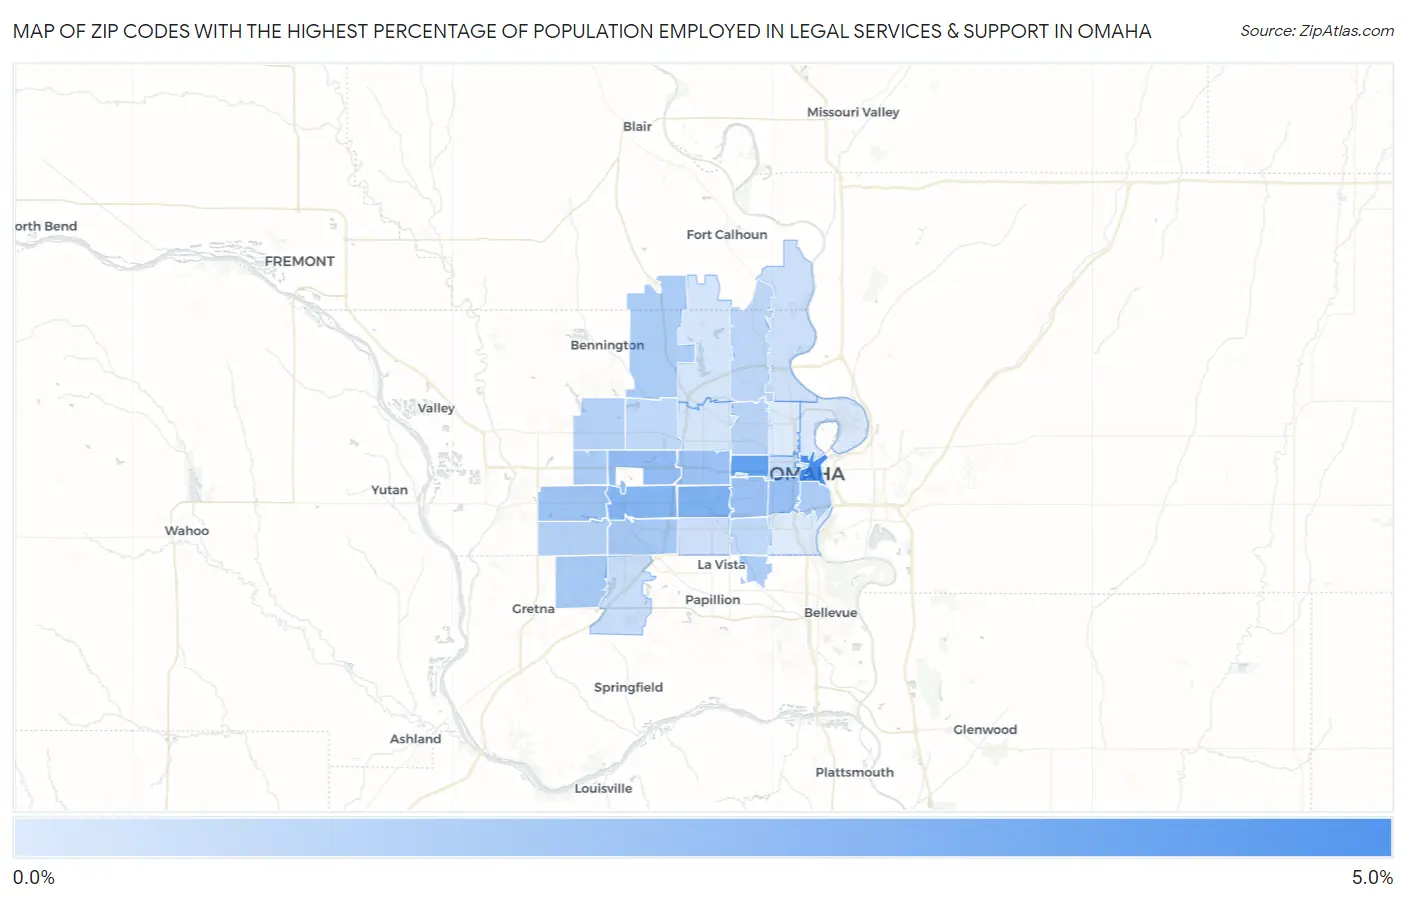
Map of Zip Codes with the Highest Percentage of Population Employed in Legal Services & Support in Omaha

0.0%
5.0%
Zip Codes with the Highest Percentage of Population Employed in Legal Services & Support in Omaha Map

Zip Codes with the Highest Percentage of Population Employed in Legal Services & Support in Omaha, NE

Zip Code % Employed vs State vs National
1.681024.5%0.82%(+3.70)#111.2%(+3.34)#887
2.681323.7%0.82%(+2.84)#141.2%(+2.48)#1,304
3.681242.8%0.82%(+1.99)#181.2%(+1.63)#2,064
4.681442.7%0.82%(+1.86)#191.2%(+1.49)#2,236
5.681542.2%0.82%(+1.42)#261.2%(+1.06)#2,943
6.681052.1%0.82%(+1.24)#281.2%(+0.877)#3,310
7.681142.0%0.82%(+1.13)#291.2%(+0.769)#3,589
8.681061.9%0.82%(+1.10)#301.2%(+0.734)#3,682
9.681301.9%0.82%(+1.05)#321.2%(+0.692)#3,789
10.681371.7%0.82%(+0.879)#391.2%(+0.517)#4,313
11.681361.6%0.82%(+0.766)#481.2%(+0.405)#4,712
12.681081.5%0.82%(+0.670)#531.2%(+0.309)#5,072
13.681421.5%0.82%(+0.658)#551.2%(+0.296)#5,123
14.681181.5%0.82%(+0.651)#571.2%(+0.289)#5,161
15.681571.4%0.82%(+0.614)#601.2%(+0.252)#5,310
16.681351.2%0.82%(+0.373)#741.2%(+0.012)#6,526
17.681161.2%0.82%(+0.372)#751.2%(+0.010)#6,536
18.681041.1%0.82%(+0.303)#821.2%(-0.058)#6,979
19.681520.96%0.82%(+0.142)#941.2%(-0.220)#8,094
20.681170.91%0.82%(+0.087)#981.2%(-0.275)#8,525
21.681640.90%0.82%(+0.077)#991.2%(-0.285)#8,608
22.681310.69%0.82%(-0.137)#1231.2%(-0.499)#10,552
23.681380.62%0.82%(-0.200)#1321.2%(-0.561)#11,216
24.681120.52%0.82%(-0.305)#1471.2%(-0.667)#12,415
25.681270.49%0.82%(-0.334)#1511.2%(-0.696)#12,776
26.681220.34%0.82%(-0.478)#1841.2%(-0.840)#14,536
27.681340.31%0.82%(-0.507)#1871.2%(-0.869)#14,861
28.681100.083%0.82%(-0.740)#2181.2%(-1.10)#17,250
29.681070.076%0.82%(-0.746)#2201.2%(-1.11)#17,300
30.681110.044%0.82%(-0.778)#2221.2%(-1.14)#17,452

Common Questions

What are the Top 10 Zip Codes with the Highest Percentage of Population Employed in Legal Services & Support in Omaha, NE?
Top 10 Zip Codes with the Highest Percentage of Population Employed in Legal Services & Support in Omaha, NE are:
#1
4.5%
#2
3.7%
#3
2.8%
#4
2.7%
#5
2.2%
#6
2.1%
#7
2.0%
#8
1.9%
#9
1.9%
#10
1.7%
What zip code has the Highest Percentage of Population Employed in Legal Services & Support in Omaha, NE?
68102 has the Highest Percentage of Population Employed in Legal Services & Support in Omaha, NE with 4.5%.
What is the Percentage of Population Employed in Legal Services & Support in Omaha, NE?
Percentage of Population Employed in Legal Services & Support in Omaha is 1.4%.
What is the Percentage of Population Employed in Legal Services & Support in Nebraska?
Percentage of Population Employed in Legal Services & Support in Nebraska is 0.82%.
What is the Percentage of Population Employed in Legal Services & Support in the United States?
Percentage of Population Employed in Legal Services & Support in the United States is 1.2%.