Zip Codes with the Highest Percentage of Population Employed in Life, Physical & Social Science in Omaha, NE

RELATED REPORTS & OPTIONS

Life, Physical & Social Science
Population
Families and Households
Female Fertility
Female Fertility (Unmarried)
Race (Community Size)
Race (Percentage)
Ancestry (Community Size)
AfghanAfricanAlbanianAleutAmericanApacheArabArapahoArgentineanArmenianAustralianAustrianBangladeshiBasqueBelgianBhutaneseBlackfeetBolivianBrazilianBritishBulgarianBurmeseCajunCambodianCanadianCarpatho RusynCentral AmericanCentral American IndianCherokeeChickasawChileanChineseChippewaChoctawColombianComancheCosta RicanCreekCroatianCubanCzechCzechoslovakianDanishDominicanDutchEastern EuropeanEcuadorianEgyptianEnglishEthiopianEuropeanFilipinoFinnishFrenchFrench American IndianFrench CanadianGermanGerman RussianGhanaianGreekGuamanian / ChamorroGuatemalanGuyaneseHaitianHonduranHungarianIcelanderIndian (Asian)IndonesianInupiatIranianIraqiIrishIroquoisIsraeliItalianJamaicanJapaneseJordanianKenyanKiowaKoreanLaotianLatvianLebaneseLithuanianLuxembourgerMacedonianMalaysianMexicanMexican American IndianMoroccanNative HawaiianNavajoNicaraguanNigerianNorthern EuropeanNorwegianPakistaniPalestinianPanamanianPennsylvania GermanPeruvianPolishPortuguesePotawatomiPuebloPuerto RicanRomanianRussianSalvadoranSamoanScandinavianScotch-IrishScottishSeminoleSerbianSiouxSlavicSlovakSloveneSomaliSouth AfricanSouth AmericanSpaniardSpanishSri LankanSubsaharan AfricanSudaneseSwedishSwissSyrianThaiTlingit-HaidaTrinidadian and TobagonianTurkishUkrainianVenezuelanVietnameseWelshWest IndianYugoslavianZimbabwean
Ancestry (Percentage)
AfghanAfricanAlbanianAleutAmericanApacheArabArapahoArgentineanArmenianAustralianAustrianBangladeshiBasqueBelgianBhutaneseBlackfeetBolivianBrazilianBritishBulgarianBurmeseCajunCambodianCanadianCarpatho RusynCentral AmericanCentral American IndianCherokeeChickasawChileanChineseChippewaChoctawColombianComancheCosta RicanCreekCroatianCubanCzechCzechoslovakianDanishDominicanDutchEastern EuropeanEcuadorianEgyptianEnglishEthiopianEuropeanFilipinoFinnishFrenchFrench American IndianFrench CanadianGermanGerman RussianGhanaianGreekGuamanian / ChamorroGuatemalanGuyaneseHaitianHonduranHungarianIcelanderIndian (Asian)IndonesianInupiatIranianIraqiIrishIroquoisIsraeliItalianJamaicanJapaneseJordanianKenyanKiowaKoreanLaotianLatvianLebaneseLithuanianLuxembourgerMacedonianMalaysianMexicanMexican American IndianMoroccanNative HawaiianNavajoNicaraguanNigerianNorthern EuropeanNorwegianPakistaniPalestinianPanamanianPennsylvania GermanPeruvianPolishPortuguesePotawatomiPuebloPuerto RicanRomanianRussianSalvadoranSamoanScandinavianScotch-IrishScottishSeminoleSerbianSiouxSlavicSlovakSloveneSomaliSouth AfricanSouth AmericanSpaniardSpanishSri LankanSubsaharan AfricanSudaneseSwedishSwissSyrianThaiTlingit-HaidaTrinidadian and TobagonianTurkishUkrainianVenezuelanVietnameseWelshWest IndianYugoslavianZimbabwean
Immigrant Origin (Total)
AfghanistanAfricaArgentinaAsiaAustraliaBangladeshBarbadosBelarusBosnia and HerzegovinaBrazilBurma / MyanmarCameroonCanadaCaribbeanCentral AmericaChileChinaColombiaCongoCosta RicaCroatiaCubaCzechoslovakiaDominican RepublicEastern AfricaEastern AsiaEastern EuropeEgyptEl SalvadorEnglandEthiopiaEuropeFranceGermanyGhanaGreeceGuatemalaHondurasHong KongHungaryIndiaIndonesiaIranIraqIrelandIsraelItalyJamaicaJapanJordanKazakhstanKenyaKoreaKuwaitLaosLatin AmericaLatviaLithuaniaMalaysiaMexicoMiddle AfricaMoroccoNepalNetherlandsNicaraguaNigeriaNorthern AfricaNorthern EuropeOceaniaPakistanPanamaPeruPhilippinesPolandPortugalRomaniaRussiaSaudi ArabiaScotlandSierra LeoneSomaliaSouth AfricaSouth AmericaSouth Central AsiaSouth Eastern AsiaSouthern EuropeSpainSri LankaSudanSyriaTaiwanThailandTrinidad and TobagoTurkeyUgandaUkraineVenezuelaVietnamWestern AfricaWestern AsiaWestern EuropeZaireZimbabwe
Immigrant Origin (Percentage)
AfghanistanAfricaArgentinaAsiaAustraliaBangladeshBarbadosBelarusBosnia and HerzegovinaBrazilBurma / MyanmarCameroonCanadaCaribbeanCentral AmericaChileChinaColombiaCongoCosta RicaCroatiaCubaCzechoslovakiaDominican RepublicEastern AfricaEastern AsiaEastern EuropeEgyptEl SalvadorEnglandEthiopiaEuropeFranceGermanyGhanaGreeceGuatemalaHondurasHong KongHungaryIndiaIndonesiaIranIraqIrelandIsraelItalyJamaicaJapanJordanKazakhstanKenyaKoreaKuwaitLaosLatin AmericaLatviaLithuaniaMalaysiaMexicoMiddle AfricaMoroccoNepalNetherlandsNicaraguaNigeriaNorthern AfricaNorthern EuropeOceaniaPakistanPanamaPeruPhilippinesPolandPortugalRomaniaRussiaSaudi ArabiaScotlandSierra LeoneSomaliaSouth AfricaSouth AmericaSouth Central AsiaSouth Eastern AsiaSouthern EuropeSpainSri LankaSudanSyriaTaiwanThailandTrinidad and TobagoTurkeyUgandaUkraineVenezuelaVietnamWestern AfricaWestern AsiaWestern EuropeZaireZimbabwe
Income
Income (Families)
Income (Households)
Poverty
Poverty (Families)
Unemployment
Employment Occupations
Employment Industries
Employer Class
Commute Time
Commute Means
School Enrollment
Education by Degree Field
Occupancy
Finances
Physical Characteristics
Omaha
Compare Zip Codes
Comparison Subject

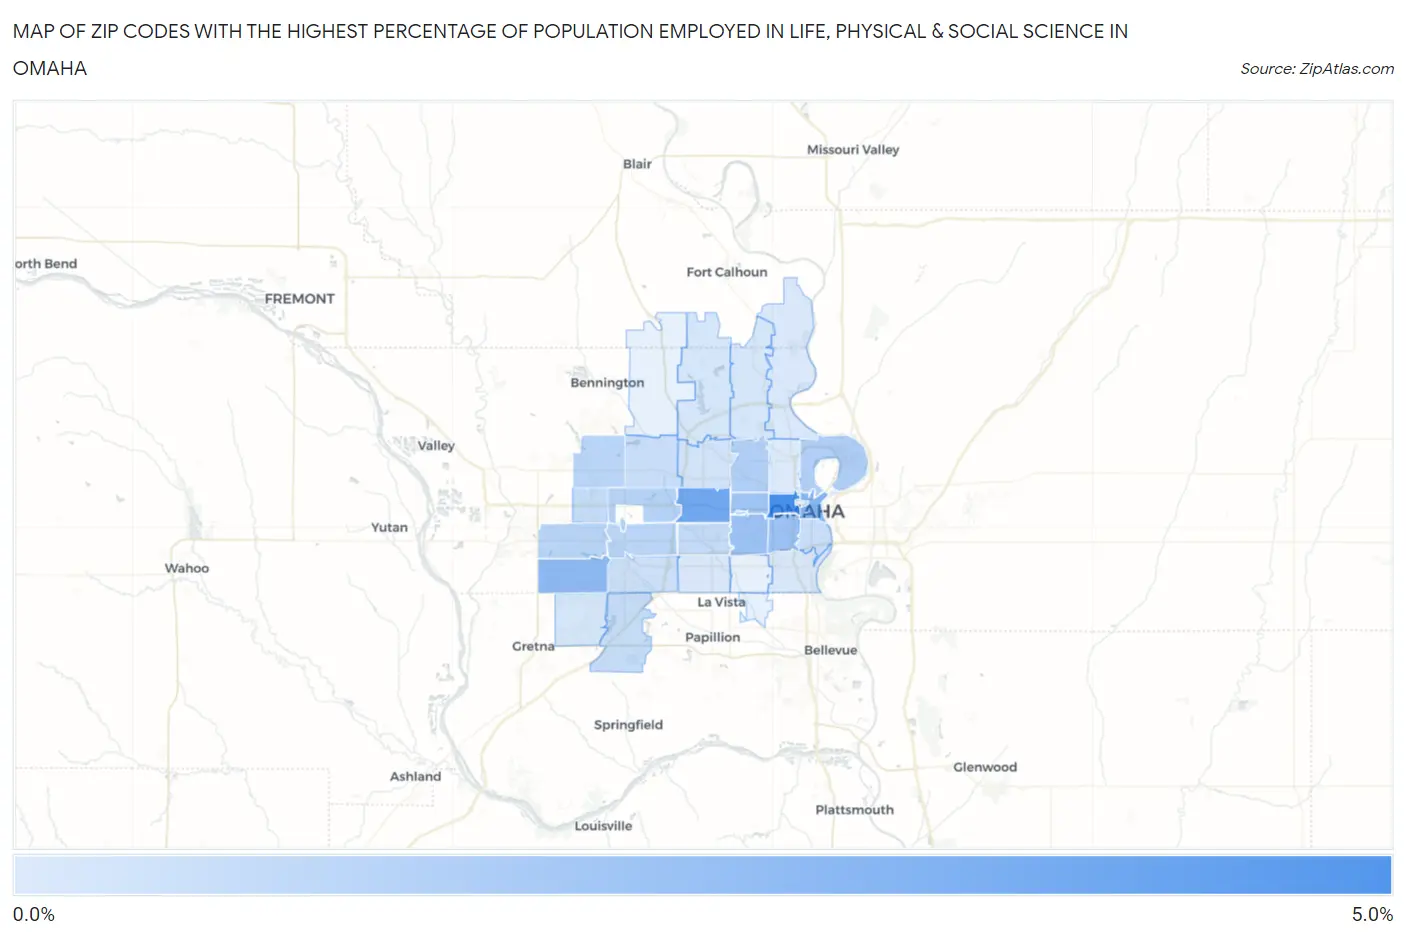
Map of Zip Codes with the Highest Percentage of Population Employed in Life, Physical & Social Science in Omaha

0.0%
5.0%
Zip Codes with the Highest Percentage of Population Employed in Life, Physical & Social Science in Omaha Map

Zip Codes with the Highest Percentage of Population Employed in Life, Physical & Social Science in Omaha, NE

Zip Code % Employed vs State vs National
1.681314.3%1.1%(+3.27)#211.1%(+3.23)#996
2.681143.1%1.1%(+2.08)#431.1%(+2.04)#1,721
3.681022.5%1.1%(+1.47)#531.1%(+1.43)#2,537
4.681352.3%1.1%(+1.23)#641.1%(+1.19)#2,999
5.681052.0%1.1%(+0.943)#751.1%(+0.905)#3,695
6.681062.0%1.1%(+0.929)#761.1%(+0.891)#3,742
7.681321.8%1.1%(+0.792)#841.1%(+0.754)#4,160
8.681101.3%1.1%(+0.269)#1331.1%(+0.231)#6,657
9.681041.3%1.1%(+0.267)#1341.1%(+0.229)#6,667
10.681541.2%1.1%(+0.141)#1451.1%(+0.103)#7,544
11.681441.1%1.1%(+0.027)#1541.1%(-0.011)#8,390
12.681301.1%1.1%(+0.022)#1551.1%(-0.016)#8,439
13.681161.1%1.1%(+0.019)#1581.1%(-0.019)#8,466
14.681240.86%1.1%(-0.194)#1841.1%(-0.232)#10,391
15.681180.79%1.1%(-0.266)#1971.1%(-0.304)#11,130
16.681380.78%1.1%(-0.274)#1981.1%(-0.313)#11,213
17.681640.68%1.1%(-0.371)#2081.1%(-0.409)#12,278
18.681080.67%1.1%(-0.381)#2111.1%(-0.419)#12,387
19.681370.56%1.1%(-0.495)#2321.1%(-0.534)#13,804
20.681340.44%1.1%(-0.613)#2481.1%(-0.652)#15,269
21.681520.34%1.1%(-0.711)#2681.1%(-0.749)#16,508
22.681220.33%1.1%(-0.722)#2701.1%(-0.760)#16,664
23.681360.31%1.1%(-0.738)#2741.1%(-0.777)#16,894
24.681070.29%1.1%(-0.765)#2791.1%(-0.803)#17,210
25.681270.25%1.1%(-0.804)#2871.1%(-0.843)#17,649
26.681120.22%1.1%(-0.834)#2891.1%(-0.872)#17,983
27.681110.13%1.1%(-0.921)#2991.1%(-0.960)#18,841

Common Questions

What are the Top 10 Zip Codes with the Highest Percentage of Population Employed in Life, Physical & Social Science in Omaha, NE?
Top 10 Zip Codes with the Highest Percentage of Population Employed in Life, Physical & Social Science in Omaha, NE are:
#1
4.3%
#2
3.1%
#3
2.5%
#4
2.3%
#5
2.0%
#6
2.0%
#7
1.8%
#8
1.3%
#9
1.3%
#10
1.2%
What zip code has the Highest Percentage of Population Employed in Life, Physical & Social Science in Omaha, NE?
68131 has the Highest Percentage of Population Employed in Life, Physical & Social Science in Omaha, NE with 4.3%.
What is the Percentage of Population Employed in Life, Physical & Social Science in Omaha, NE?
Percentage of Population Employed in Life, Physical & Social Science in Omaha is 1.2%.
What is the Percentage of Population Employed in Life, Physical & Social Science in Nebraska?
Percentage of Population Employed in Life, Physical & Social Science in Nebraska is 1.1%.
What is the Percentage of Population Employed in Life, Physical & Social Science in the United States?
Percentage of Population Employed in Life, Physical & Social Science in the United States is 1.1%.