Zip Codes with the Highest Poverty Level Among Single Mothers in Omaha, NE

RELATED REPORTS & OPTIONS

Highest Poverty | Single Mother
Population
Families and Households
Female Fertility
Female Fertility (Unmarried)
Race (Community Size)
Race (Percentage)
Ancestry (Community Size)
AfghanAfricanAlbanianAleutAmericanApacheArabArapahoArgentineanArmenianAustralianAustrianBangladeshiBasqueBelgianBhutaneseBlackfeetBolivianBrazilianBritishBulgarianBurmeseCajunCambodianCanadianCarpatho RusynCentral AmericanCentral American IndianCherokeeChickasawChileanChineseChippewaChoctawColombianComancheCosta RicanCreekCroatianCubanCzechCzechoslovakianDanishDominicanDutchEastern EuropeanEcuadorianEgyptianEnglishEthiopianEuropeanFilipinoFinnishFrenchFrench American IndianFrench CanadianGermanGerman RussianGhanaianGreekGuamanian / ChamorroGuatemalanGuyaneseHaitianHonduranHungarianIcelanderIndian (Asian)IndonesianInupiatIranianIraqiIrishIroquoisIsraeliItalianJamaicanJapaneseJordanianKenyanKiowaKoreanLaotianLatvianLebaneseLithuanianLuxembourgerMacedonianMalaysianMexicanMexican American IndianMoroccanNative HawaiianNavajoNicaraguanNigerianNorthern EuropeanNorwegianPakistaniPalestinianPanamanianPennsylvania GermanPeruvianPolishPortuguesePotawatomiPuebloPuerto RicanRomanianRussianSalvadoranSamoanScandinavianScotch-IrishScottishSeminoleSerbianSiouxSlavicSlovakSloveneSomaliSouth AfricanSouth AmericanSpaniardSpanishSri LankanSubsaharan AfricanSudaneseSwedishSwissSyrianThaiTlingit-HaidaTrinidadian and TobagonianTurkishUkrainianVenezuelanVietnameseWelshWest IndianYugoslavianZimbabwean
Ancestry (Percentage)
AfghanAfricanAlbanianAleutAmericanApacheArabArapahoArgentineanArmenianAustralianAustrianBangladeshiBasqueBelgianBhutaneseBlackfeetBolivianBrazilianBritishBulgarianBurmeseCajunCambodianCanadianCarpatho RusynCentral AmericanCentral American IndianCherokeeChickasawChileanChineseChippewaChoctawColombianComancheCosta RicanCreekCroatianCubanCzechCzechoslovakianDanishDominicanDutchEastern EuropeanEcuadorianEgyptianEnglishEthiopianEuropeanFilipinoFinnishFrenchFrench American IndianFrench CanadianGermanGerman RussianGhanaianGreekGuamanian / ChamorroGuatemalanGuyaneseHaitianHonduranHungarianIcelanderIndian (Asian)IndonesianInupiatIranianIraqiIrishIroquoisIsraeliItalianJamaicanJapaneseJordanianKenyanKiowaKoreanLaotianLatvianLebaneseLithuanianLuxembourgerMacedonianMalaysianMexicanMexican American IndianMoroccanNative HawaiianNavajoNicaraguanNigerianNorthern EuropeanNorwegianPakistaniPalestinianPanamanianPennsylvania GermanPeruvianPolishPortuguesePotawatomiPuebloPuerto RicanRomanianRussianSalvadoranSamoanScandinavianScotch-IrishScottishSeminoleSerbianSiouxSlavicSlovakSloveneSomaliSouth AfricanSouth AmericanSpaniardSpanishSri LankanSubsaharan AfricanSudaneseSwedishSwissSyrianThaiTlingit-HaidaTrinidadian and TobagonianTurkishUkrainianVenezuelanVietnameseWelshWest IndianYugoslavianZimbabwean
Immigrant Origin (Total)
AfghanistanAfricaArgentinaAsiaAustraliaBangladeshBarbadosBelarusBosnia and HerzegovinaBrazilBurma / MyanmarCameroonCanadaCaribbeanCentral AmericaChileChinaColombiaCongoCosta RicaCroatiaCubaCzechoslovakiaDominican RepublicEastern AfricaEastern AsiaEastern EuropeEgyptEl SalvadorEnglandEthiopiaEuropeFranceGermanyGhanaGreeceGuatemalaHondurasHong KongHungaryIndiaIndonesiaIranIraqIrelandIsraelItalyJamaicaJapanJordanKazakhstanKenyaKoreaKuwaitLaosLatin AmericaLatviaLithuaniaMalaysiaMexicoMiddle AfricaMoroccoNepalNetherlandsNicaraguaNigeriaNorthern AfricaNorthern EuropeOceaniaPakistanPanamaPeruPhilippinesPolandPortugalRomaniaRussiaSaudi ArabiaScotlandSierra LeoneSomaliaSouth AfricaSouth AmericaSouth Central AsiaSouth Eastern AsiaSouthern EuropeSpainSri LankaSudanSyriaTaiwanThailandTrinidad and TobagoTurkeyUgandaUkraineVenezuelaVietnamWestern AfricaWestern AsiaWestern EuropeZaireZimbabwe
Immigrant Origin (Percentage)
AfghanistanAfricaArgentinaAsiaAustraliaBangladeshBarbadosBelarusBosnia and HerzegovinaBrazilBurma / MyanmarCameroonCanadaCaribbeanCentral AmericaChileChinaColombiaCongoCosta RicaCroatiaCubaCzechoslovakiaDominican RepublicEastern AfricaEastern AsiaEastern EuropeEgyptEl SalvadorEnglandEthiopiaEuropeFranceGermanyGhanaGreeceGuatemalaHondurasHong KongHungaryIndiaIndonesiaIranIraqIrelandIsraelItalyJamaicaJapanJordanKazakhstanKenyaKoreaKuwaitLaosLatin AmericaLatviaLithuaniaMalaysiaMexicoMiddle AfricaMoroccoNepalNetherlandsNicaraguaNigeriaNorthern AfricaNorthern EuropeOceaniaPakistanPanamaPeruPhilippinesPolandPortugalRomaniaRussiaSaudi ArabiaScotlandSierra LeoneSomaliaSouth AfricaSouth AmericaSouth Central AsiaSouth Eastern AsiaSouthern EuropeSpainSri LankaSudanSyriaTaiwanThailandTrinidad and TobagoTurkeyUgandaUkraineVenezuelaVietnamWestern AfricaWestern AsiaWestern EuropeZaireZimbabwe
Income
Income (Families)
Income (Households)
Poverty
Poverty (Families)
Unemployment
Employment Occupations
Employment Industries
Employer Class
Commute Time
Commute Means
School Enrollment
Education by Degree Field
Occupancy
Finances
Physical Characteristics
Omaha
Compare Zip Codes
Comparison Subject

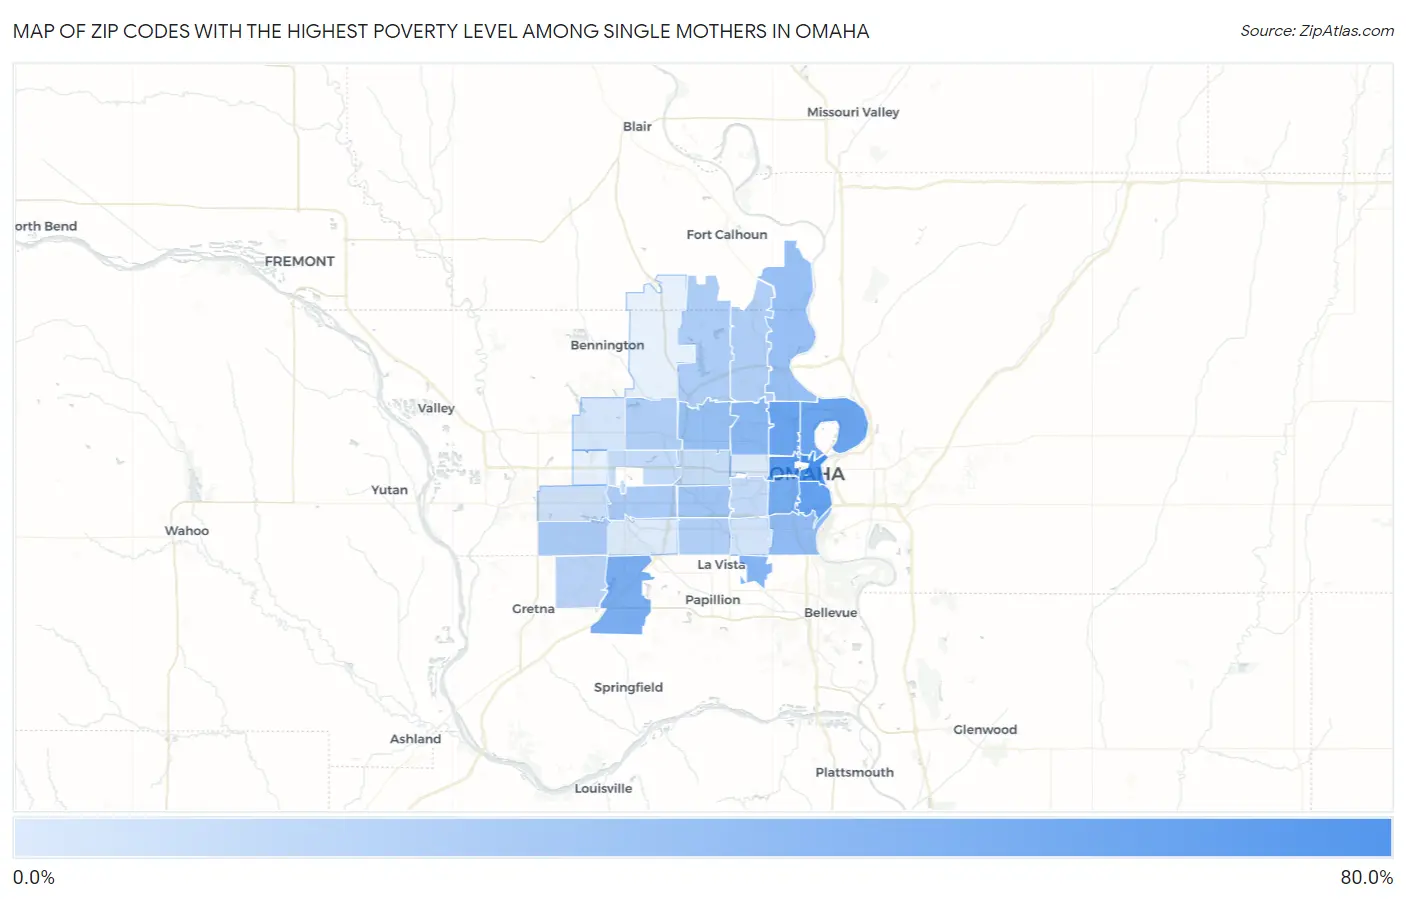
Map of Zip Codes with the Highest Poverty Level Among Single Mothers in Omaha

0.0%
80.0%
Zip Codes with the Highest Poverty Level Among Single Mothers in Omaha Map

Zip Codes with the Highest Poverty Level Among Single Mothers in Omaha, NE

Zip Code Single Mother Poverty vs State vs National
1.6810264.7%29.1%(+35.6)#7133.1%(+31.6)#3,745
2.6813156.8%29.1%(+27.7)#8633.1%(+23.7)#5,084
3.6810851.4%29.1%(+22.3)#9733.1%(+18.3)#6,246
4.6811148.4%29.1%(+19.3)#11533.1%(+15.3)#7,143
5.6811047.2%29.1%(+18.1)#11733.1%(+14.0)#7,491
6.6810542.2%29.1%(+13.1)#13733.1%(+9.02)#9,030
7.6813841.0%29.1%(+11.9)#14433.1%(+7.84)#9,429
8.6815735.6%29.1%(+6.52)#18033.1%(+2.46)#11,451
9.6810434.0%29.1%(+4.95)#19033.1%(+0.884)#12,014
10.6810730.5%29.1%(+1.42)#20933.1%(-2.65)#13,503
11.6813429.2%29.1%(+0.145)#21733.1%(-3.92)#14,025
12.6811228.0%29.1%(-1.09)#22033.1%(-5.16)#14,535
13.6812424.3%29.1%(-4.81)#23433.1%(-8.87)#16,000
14.6813520.5%29.1%(-8.59)#25233.1%(-12.7)#17,494
15.6814420.5%29.1%(-8.60)#25333.1%(-12.7)#17,496
16.6812220.0%29.1%(-9.03)#25533.1%(-13.1)#17,633
17.6816419.4%29.1%(-9.64)#26133.1%(-13.7)#17,932
18.6815219.3%29.1%(-9.74)#26233.1%(-13.8)#17,970
19.6812718.4%29.1%(-10.6)#26733.1%(-14.7)#18,313
20.6813616.0%29.1%(-13.0)#28033.1%(-17.1)#19,207
21.6810612.7%29.1%(-16.4)#28633.1%(-20.4)#20,380
22.6815411.4%29.1%(-17.6)#29433.1%(-21.7)#20,762
23.6811410.9%29.1%(-18.2)#29733.1%(-22.3)#20,957
24.681308.3%29.1%(-20.8)#30933.1%(-24.9)#21,656
25.681176.8%29.1%(-22.3)#31333.1%(-26.4)#22,036
26.681166.2%29.1%(-22.9)#31633.1%(-27.0)#22,150
27.681324.7%29.1%(-24.3)#32133.1%(-28.4)#22,447
28.681373.2%29.1%(-25.9)#32833.1%(-29.9)#22,684

Common Questions

What are the Top 10 Zip Codes with the Highest Poverty Level Among Single Mothers in Omaha, NE?
Top 10 Zip Codes with the Highest Poverty Level Among Single Mothers in Omaha, NE are:
#1
64.7%
#2
56.8%
#3
51.4%
#4
48.4%
#5
47.2%
#6
42.2%
#7
41.0%
#8
35.6%
#9
34.0%
#10
30.5%
What zip code has the Highest Poverty Level Among Single Mothers in Omaha, NE?
68102 has the Highest Poverty Level Among Single Mothers in Omaha, NE with 64.7%.
What is the Poverty Level Among Single Mothers in Omaha, NE?
Poverty Level Among Single Mothers in Omaha is 27.8%.
What is the Poverty Level Among Single Mothers in Nebraska?
Poverty Level Among Single Mothers in Nebraska is 29.1%.
What is the Poverty Level Among Single Mothers in the United States?
Poverty Level Among Single Mothers in the United States is 33.1%.