Zip Codes with the Highest Percentage of Households with Income Below $10,000 in Wyoming
RELATED REPORTS & OPTIONS
Household Income | $0-10k
Wyoming
Compare Zip Codes
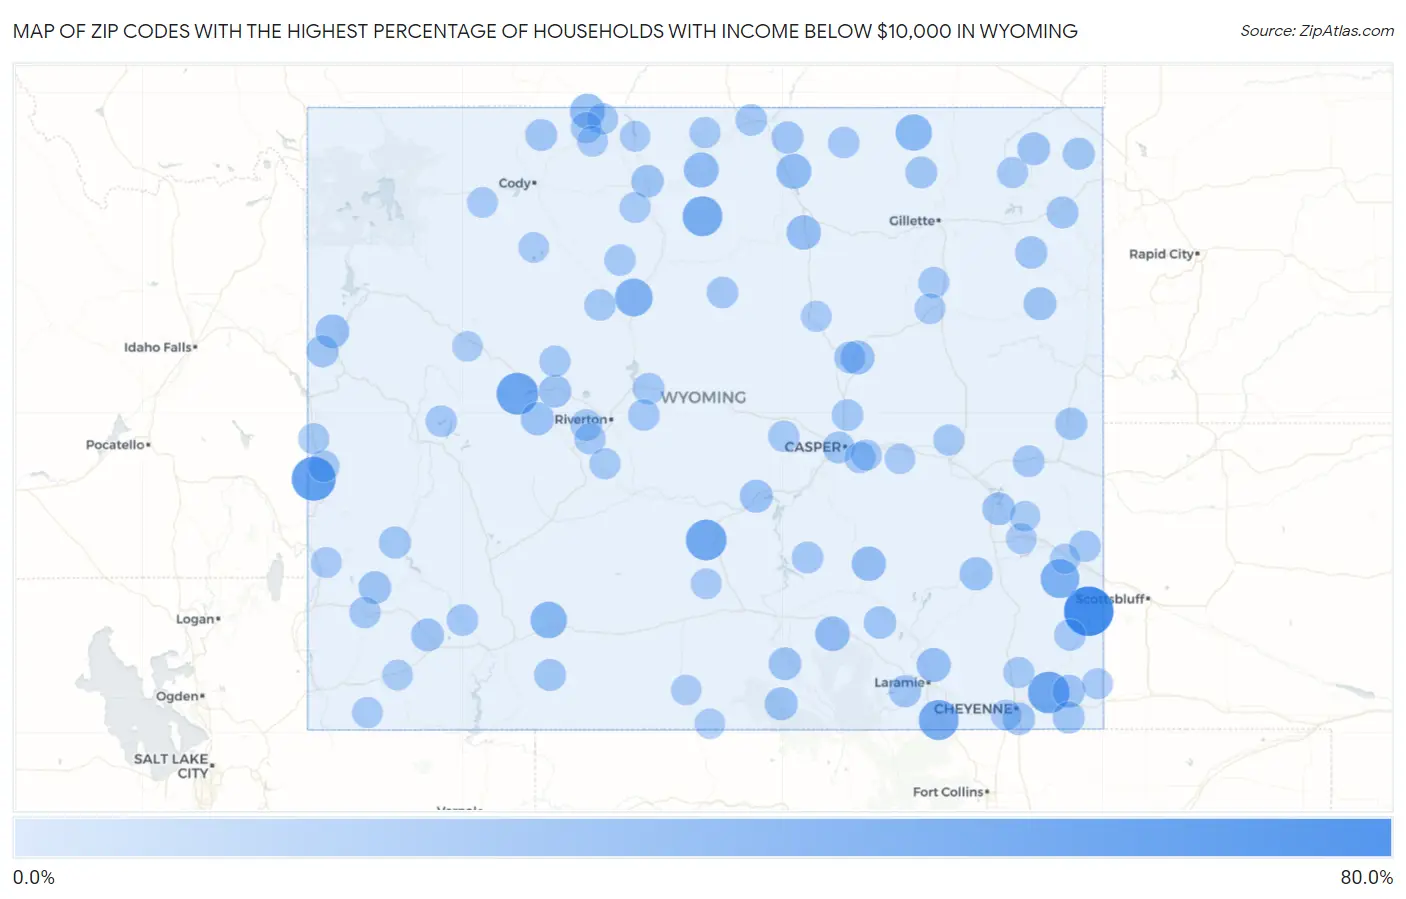
Map of Zip Codes with the Highest Percentage of Households with Income Below $10,000 in Wyoming
0.0%
80.0%
Zip Codes with the Highest Percentage of Households with Income Below $10,000 in Wyoming
| Zip Code | Households with Income < $10k | vs State | vs National | |
| 1. | 82217 | 61.5% | 4.6%(+56.9)#1 | 4.9%(+56.6)#72 |
| 2. | 83119 | 43.8% | 4.6%(+39.2)#2 | 4.9%(+38.9)#146 |
| 3. | 82512 | 36.6% | 4.6%(+32.0)#3 | 4.9%(+31.7)#202 |
| 4. | 82060 | 35.9% | 4.6%(+31.3)#4 | 4.9%(+31.0)#208 |
| 5. | 82322 | 33.3% | 4.6%(+28.7)#5 | 4.9%(+28.4)#248 |
| 6. | 82084 | 30.6% | 4.6%(+26.0)#6 | 4.9%(+25.7)#315 |
| 7. | 82428 | 30.2% | 4.6%(+25.6)#7 | 4.9%(+25.3)#326 |
| 8. | 82243 | 26.8% | 4.6%(+22.2)#8 | 4.9%(+21.9)#409 |
| 9. | 82430 | 24.2% | 4.6%(+19.6)#9 | 4.9%(+19.3)#526 |
| 10. | 82945 | 19.8% | 4.6%(+15.2)#10 | 4.9%(+14.9)#818 |
| 11. | 82725 | 19.5% | 4.6%(+14.9)#11 | 4.9%(+14.6)#850 |
| 12. | 82832 | 15.4% | 4.6%(+10.8)#12 | 4.9%(+10.5)#1,445 |
| 13. | 82423 | 15.3% | 4.6%(+10.7)#13 | 4.9%(+10.4)#1,468 |
| 14. | 82441 | 14.9% | 4.6%(+10.3)#14 | 4.9%(+10.00)#1,557 |
| 15. | 82324 | 14.3% | 4.6%(+9.70)#15 | 4.9%(+9.40)#1,708 |
| 16. | 82834 | 13.5% | 4.6%(+8.90)#16 | 4.9%(+8.60)#1,914 |
| 17. | 82329 | 12.9% | 4.6%(+8.30)#17 | 4.9%(+8.00)#2,144 |
| 18. | 82072 | 12.3% | 4.6%(+7.70)#18 | 4.9%(+7.40)#2,329 |
| 19. | 82635 | 12.2% | 4.6%(+7.60)#19 | 4.9%(+7.30)#2,402 |
| 20. | 83025 | 11.0% | 4.6%(+6.40)#20 | 4.9%(+6.10)#2,984 |
| 21. | 82514 | 9.9% | 4.6%(+5.30)#21 | 4.9%(+5.00)#3,685 |
| 22. | 82201 | 9.7% | 4.6%(+5.10)#22 | 4.9%(+4.80)#3,822 |
| 23. | 82620 | 9.1% | 4.6%(+4.50)#23 | 4.9%(+4.20)#4,382 |
| 24. | 82325 | 9.0% | 4.6%(+4.40)#24 | 4.9%(+4.10)#4,474 |
| 25. | 82053 | 8.6% | 4.6%(+4.00)#25 | 4.9%(+3.70)#4,887 |
| 26. | 82701 | 8.5% | 4.6%(+3.90)#26 | 4.9%(+3.60)#4,955 |
| 27. | 82213 | 8.5% | 4.6%(+3.90)#27 | 4.9%(+3.60)#5,002 |
| 28. | 82720 | 8.4% | 4.6%(+3.80)#28 | 4.9%(+3.50)#5,122 |
| 29. | 82331 | 8.3% | 4.6%(+3.70)#29 | 4.9%(+3.40)#5,223 |
| 30. | 82934 | 8.3% | 4.6%(+3.70)#30 | 4.9%(+3.40)#5,280 |
| 31. | 83101 | 8.1% | 4.6%(+3.50)#31 | 4.9%(+3.20)#5,476 |
| 32. | 82007 | 7.5% | 4.6%(+2.90)#32 | 4.9%(+2.60)#6,219 |
| 33. | 82426 | 7.5% | 4.6%(+2.90)#33 | 4.9%(+2.60)#6,269 |
| 34. | 82516 | 7.5% | 4.6%(+2.90)#34 | 4.9%(+2.60)#6,320 |
| 35. | 82083 | 7.4% | 4.6%(+2.80)#35 | 4.9%(+2.50)#6,461 |
| 36. | 82730 | 7.3% | 4.6%(+2.70)#36 | 4.9%(+2.40)#6,569 |
| 37. | 82225 | 6.5% | 4.6%(+1.90)#37 | 4.9%(+1.60)#8,028 |
| 38. | 82801 | 6.4% | 4.6%(+1.80)#38 | 4.9%(+1.50)#8,122 |
| 39. | 82070 | 6.4% | 4.6%(+1.80)#39 | 4.9%(+1.50)#8,130 |
| 40. | 83014 | 6.2% | 4.6%(+1.60)#40 | 4.9%(+1.30)#8,641 |
| 41. | 82054 | 6.1% | 4.6%(+1.50)#41 | 4.9%(+1.20)#8,919 |
| 42. | 82710 | 6.0% | 4.6%(+1.40)#42 | 4.9%(+1.10)#9,168 |
| 43. | 82729 | 5.9% | 4.6%(+1.30)#43 | 4.9%(+1.00)#9,345 |
| 44. | 83123 | 5.9% | 4.6%(+1.30)#44 | 4.9%(+1.00)#9,399 |
| 45. | 82716 | 5.6% | 4.6%(+1.000)#45 | 4.9%(+0.700)#10,009 |
| 46. | 82901 | 5.5% | 4.6%(+0.900)#46 | 4.9%(+0.600)#10,234 |
| 47. | 82435 | 5.3% | 4.6%(+0.700)#47 | 4.9%(+0.400)#10,815 |
| 48. | 82644 | 5.3% | 4.6%(+0.700)#48 | 4.9%(+0.400)#10,946 |
| 49. | 82649 | 4.9% | 4.6%(+0.300)#49 | 4.9%(=0.000)#12,219 |
| 50. | 82327 | 4.9% | 4.6%(+0.300)#50 | 4.9%(=0.000)#12,230 |
| 51. | 82227 | 4.8% | 4.6%(+0.200)#51 | 4.9%(-0.100)#12,582 |
| 52. | 82643 | 4.8% | 4.6%(+0.200)#52 | 4.9%(-0.100)#12,594 |
| 53. | 82935 | 4.6% | 4.6%(=0.000)#53 | 4.9%(-0.300)#13,093 |
| 54. | 82839 | 4.6% | 4.6%(=0.000)#54 | 4.9%(-0.300)#13,245 |
| 55. | 82221 | 4.6% | 4.6%(=0.000)#55 | 4.9%(-0.300)#13,290 |
| 56. | 82240 | 4.4% | 4.6%(-0.200)#56 | 4.9%(-0.500)#13,799 |
| 57. | 83110 | 4.4% | 4.6%(-0.200)#57 | 4.9%(-0.500)#13,841 |
| 58. | 82442 | 4.4% | 4.6%(-0.200)#58 | 4.9%(-0.500)#13,965 |
| 59. | 82601 | 4.3% | 4.6%(-0.300)#59 | 4.9%(-0.600)#14,095 |
| 60. | 82443 | 4.2% | 4.6%(-0.400)#60 | 4.9%(-0.700)#14,628 |
| 61. | 82510 | 4.2% | 4.6%(-0.400)#61 | 4.9%(-0.700)#14,733 |
| 62. | 82501 | 4.0% | 4.6%(-0.600)#62 | 4.9%(-0.900)#15,298 |
| 63. | 83116 | 4.0% | 4.6%(-0.600)#63 | 4.9%(-0.900)#15,528 |
| 64. | 82835 | 4.0% | 4.6%(-0.600)#64 | 4.9%(-0.900)#15,556 |
| 65. | 82941 | 3.9% | 4.6%(-0.700)#65 | 4.9%(-1.00)#15,784 |
| 66. | 82604 | 3.8% | 4.6%(-0.800)#66 | 4.9%(-1.10)#16,037 |
| 67. | 82515 | 3.8% | 4.6%(-0.800)#67 | 4.9%(-1.10)#16,333 |
| 68. | 82523 | 3.7% | 4.6%(-0.900)#68 | 4.9%(-1.20)#16,701 |
| 69. | 82609 | 3.6% | 4.6%(-1.000)#69 | 4.9%(-1.30)#16,890 |
| 70. | 82401 | 3.6% | 4.6%(-1.000)#70 | 4.9%(-1.30)#16,965 |
| 71. | 82420 | 3.5% | 4.6%(-1.10)#71 | 4.9%(-1.40)#17,555 |
| 72. | 82633 | 3.2% | 4.6%(-1.40)#72 | 4.9%(-1.70)#18,619 |
| 73. | 82836 | 3.1% | 4.6%(-1.50)#73 | 4.9%(-1.80)#19,194 |
| 74. | 82421 | 3.1% | 4.6%(-1.50)#74 | 4.9%(-1.80)#19,259 |
| 75. | 82009 | 2.9% | 4.6%(-1.70)#75 | 4.9%(-2.00)#19,817 |
| 76. | 82718 | 2.9% | 4.6%(-1.70)#76 | 4.9%(-2.00)#19,854 |
| 77. | 82520 | 2.9% | 4.6%(-1.70)#77 | 4.9%(-2.00)#19,931 |
| 78. | 82721 | 2.9% | 4.6%(-1.70)#78 | 4.9%(-2.00)#20,065 |
| 79. | 83127 | 2.8% | 4.6%(-1.80)#79 | 4.9%(-2.10)#20,447 |
| 80. | 82636 | 2.7% | 4.6%(-1.90)#80 | 4.9%(-2.20)#20,870 |
| 81. | 82082 | 2.5% | 4.6%(-2.10)#81 | 4.9%(-2.40)#21,836 |
| 82. | 83114 | 2.5% | 4.6%(-2.10)#82 | 4.9%(-2.40)#21,905 |
| 83. | 82412 | 2.5% | 4.6%(-2.10)#83 | 4.9%(-2.40)#21,919 |
| 84. | 82001 | 2.4% | 4.6%(-2.20)#84 | 4.9%(-2.50)#22,008 |
| 85. | 82930 | 2.4% | 4.6%(-2.20)#85 | 4.9%(-2.50)#22,100 |
| 86. | 82410 | 2.4% | 4.6%(-2.20)#86 | 4.9%(-2.50)#22,257 |
| 87. | 82732 | 2.4% | 4.6%(-2.20)#87 | 4.9%(-2.50)#22,289 |
| 88. | 82639 | 2.4% | 4.6%(-2.20)#88 | 4.9%(-2.50)#22,337 |
| 89. | 82301 | 2.2% | 4.6%(-2.40)#89 | 4.9%(-2.70)#22,980 |
| 90. | 82414 | 2.0% | 4.6%(-2.60)#90 | 4.9%(-2.90)#23,669 |
| 91. | 82937 | 1.9% | 4.6%(-2.70)#91 | 4.9%(-3.00)#24,166 |
| 92. | 82214 | 1.8% | 4.6%(-2.80)#92 | 4.9%(-3.10)#24,596 |
| 93. | 82637 | 1.7% | 4.6%(-2.90)#93 | 4.9%(-3.20)#24,844 |
| 94. | 82433 | 1.6% | 4.6%(-3.00)#94 | 4.9%(-3.30)#25,299 |
| 95. | 82431 | 1.5% | 4.6%(-3.10)#95 | 4.9%(-3.40)#25,554 |
| 96. | 82215 | 1.4% | 4.6%(-3.20)#96 | 4.9%(-3.50)#25,978 |
| 97. | 82513 | 1.3% | 4.6%(-3.30)#97 | 4.9%(-3.60)#26,182 |
| 98. | 82323 | 1.3% | 4.6%(-3.30)#98 | 4.9%(-3.60)#26,261 |
| 99. | 82321 | 1.0% | 4.6%(-3.60)#99 | 4.9%(-3.90)#26,976 |
| 100. | 82223 | 0.80% | 4.6%(-3.80)#100 | 4.9%(-4.10)#27,412 |
1
2Common Questions
What are the Top 10 Zip Codes with the Highest Percentage of Households with Income Below $10,000 in Wyoming?
Top 10 Zip Codes with the Highest Percentage of Households with Income Below $10,000 in Wyoming are:
What zip code has the Highest Percentage of Households with Income Below $10,000 in Wyoming?
82217 has the Highest Percentage of Households with Income Below $10,000 in Wyoming with 61.5%.
What is the Percentage of Households with Income Below $10,000 in the State of Wyoming?
Percentage of Households with Income Below $10,000 in Wyoming is 4.6%.
What is the Percentage of Households with Income Below $10,000 in the United States?
Percentage of Households with Income Below $10,000 in the United States is 4.9%.