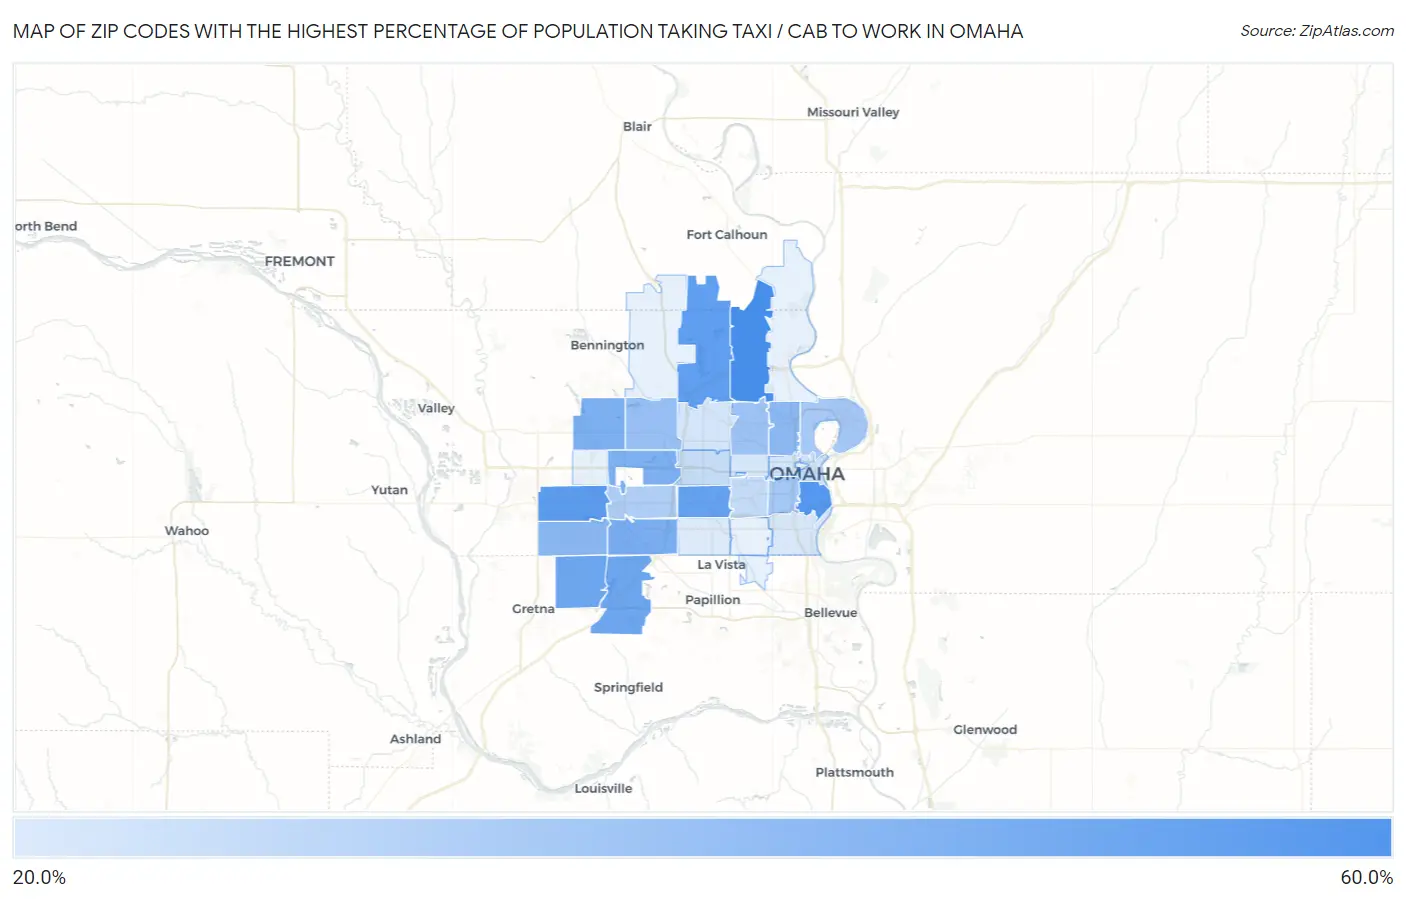
Zip Codes with the Highest Percentage of Population Taking Taxi / Cab to Work in Omaha, NE
RELATED REPORTS & OPTIONS
Taxi / Cab
Omaha
Compare Zip Codes
Map of Zip Codes with the Highest Percentage of Population Taking Taxi / Cab to Work in Omaha
23.8%
58.0%
Zip Codes with the Highest Percentage of Population Taking Taxi / Cab to Work in Omaha, NE
| Zip Code | % Take Taxi / Cab | vs State | vs National | |
| 1. | 68152 | 58.0% | 39.9%(+18.1)#14 | 38.2%(+19.8)#1,004 |
| 2. | 68108 | 54.5% | 39.9%(+14.6)#23 | 38.2%(+16.3)#1,707 |
| 3. | 68130 | 53.2% | 39.9%(+13.3)#28 | 38.2%(+15.0)#2,071 |
| 4. | 68122 | 51.7% | 39.9%(+11.8)#33 | 38.2%(+13.5)#2,455 |
| 5. | 68124 | 50.2% | 39.9%(+10.3)#35 | 38.2%(+12.0)#2,919 |
| 6. | 68138 | 48.3% | 39.9%(+8.40)#42 | 38.2%(+10.1)#3,510 |
| 7. | 68136 | 48.1% | 39.9%(+8.20)#43 | 38.2%(+9.90)#3,588 |
| 8. | 68137 | 45.6% | 39.9%(+5.70)#50 | 38.2%(+7.40)#4,414 |
| 9. | 68154 | 45.2% | 39.9%(+5.30)#52 | 38.2%(+7.00)#4,589 |
| 10. | 68116 | 44.8% | 39.9%(+4.90)#53 | 38.2%(+6.60)#4,713 |
| 11. | 68135 | 41.8% | 39.9%(+1.90)#61 | 38.2%(+3.60)#5,793 |
| 12. | 68111 | 41.2% | 39.9%(+1.30)#64 | 38.2%(+3.00)#6,090 |
| 13. | 68164 | 38.6% | 39.9%(-1.30)#71 | 38.2%(+0.400)#7,218 |
| 14. | 68104 | 37.3% | 39.9%(-2.60)#74 | 38.2%(-0.900)#7,804 |
| 15. | 68105 | 35.9% | 39.9%(-4.00)#79 | 38.2%(-2.30)#8,466 |
| 16. | 68110 | 35.4% | 39.9%(-4.50)#83 | 38.2%(-2.80)#8,755 |
| 17. | 68144 | 33.5% | 39.9%(-6.40)#88 | 38.2%(-4.70)#9,582 |
| 18. | 68106 | 29.2% | 39.9%(-10.7)#97 | 38.2%(-9.00)#11,215 |
| 19. | 68114 | 28.6% | 39.9%(-11.3)#99 | 38.2%(-9.60)#11,397 |
| 20. | 68102 | 26.6% | 39.9%(-13.3)#101 | 38.2%(-11.6)#11,939 |
| 21. | 68134 | 25.6% | 39.9%(-14.3)#102 | 38.2%(-12.6)#12,122 |
| 22. | 68131 | 25.6% | 39.9%(-14.3)#103 | 38.2%(-12.6)#12,130 |
| 23. | 68132 | 25.4% | 39.9%(-14.5)#104 | 38.2%(-12.8)#12,175 |
| 24. | 68107 | 24.7% | 39.9%(-15.2)#107 | 38.2%(-13.5)#12,302 |
| 25. | 68127 | 23.8% | 39.9%(-16.1)#110 | 38.2%(-14.4)#12,487 |
1
Common Questions
What are the Top 10 Zip Codes with the Highest Percentage of Population Taking Taxi / Cab to Work in Omaha, NE?
Top 10 Zip Codes with the Highest Percentage of Population Taking Taxi / Cab to Work in Omaha, NE are:
What zip code has the Highest Percentage of Population Taking Taxi / Cab to Work in Omaha, NE?
68152 has the Highest Percentage of Population Taking Taxi / Cab to Work in Omaha, NE with 58.0%.
What is the Percentage of Population Taking Taxi / Cab to Work in Omaha, NE?
Percentage of Population Taking Taxi / Cab to Work in Omaha is 34.4%.
What is the Percentage of Population Taking Taxi / Cab to Work in Nebraska?
Percentage of Population Taking Taxi / Cab to Work in Nebraska is 39.9%.
What is the Percentage of Population Taking Taxi / Cab to Work in the United States?
Percentage of Population Taking Taxi / Cab to Work in the United States is 38.2%.