Zip Codes with the Highest Percentage of Population with a Degree in Visual and Performing Arts in Omaha, NE

RELATED REPORTS & OPTIONS

Visual and Performing Arts
Population
Families and Households
Female Fertility
Female Fertility (Unmarried)
Race (Community Size)
Race (Percentage)
Ancestry (Community Size)
AfghanAfricanAlbanianAleutAmericanApacheArabArapahoArgentineanArmenianAustralianAustrianBangladeshiBasqueBelgianBhutaneseBlackfeetBolivianBrazilianBritishBulgarianBurmeseCajunCambodianCanadianCarpatho RusynCentral AmericanCentral American IndianCherokeeChickasawChileanChineseChippewaChoctawColombianComancheCosta RicanCreekCroatianCubanCzechCzechoslovakianDanishDominicanDutchEastern EuropeanEcuadorianEgyptianEnglishEthiopianEuropeanFilipinoFinnishFrenchFrench American IndianFrench CanadianGermanGerman RussianGhanaianGreekGuamanian / ChamorroGuatemalanGuyaneseHaitianHonduranHungarianIcelanderIndian (Asian)IndonesianInupiatIranianIraqiIrishIroquoisIsraeliItalianJamaicanJapaneseJordanianKenyanKiowaKoreanLaotianLatvianLebaneseLithuanianLuxembourgerMacedonianMalaysianMexicanMexican American IndianMoroccanNative HawaiianNavajoNicaraguanNigerianNorthern EuropeanNorwegianPakistaniPalestinianPanamanianPennsylvania GermanPeruvianPolishPortuguesePotawatomiPuebloPuerto RicanRomanianRussianSalvadoranSamoanScandinavianScotch-IrishScottishSeminoleSerbianSiouxSlavicSlovakSloveneSomaliSouth AfricanSouth AmericanSpaniardSpanishSri LankanSubsaharan AfricanSudaneseSwedishSwissSyrianThaiTlingit-HaidaTrinidadian and TobagonianTurkishUkrainianVenezuelanVietnameseWelshWest IndianYugoslavianZimbabwean
Ancestry (Percentage)
AfghanAfricanAlbanianAleutAmericanApacheArabArapahoArgentineanArmenianAustralianAustrianBangladeshiBasqueBelgianBhutaneseBlackfeetBolivianBrazilianBritishBulgarianBurmeseCajunCambodianCanadianCarpatho RusynCentral AmericanCentral American IndianCherokeeChickasawChileanChineseChippewaChoctawColombianComancheCosta RicanCreekCroatianCubanCzechCzechoslovakianDanishDominicanDutchEastern EuropeanEcuadorianEgyptianEnglishEthiopianEuropeanFilipinoFinnishFrenchFrench American IndianFrench CanadianGermanGerman RussianGhanaianGreekGuamanian / ChamorroGuatemalanGuyaneseHaitianHonduranHungarianIcelanderIndian (Asian)IndonesianInupiatIranianIraqiIrishIroquoisIsraeliItalianJamaicanJapaneseJordanianKenyanKiowaKoreanLaotianLatvianLebaneseLithuanianLuxembourgerMacedonianMalaysianMexicanMexican American IndianMoroccanNative HawaiianNavajoNicaraguanNigerianNorthern EuropeanNorwegianPakistaniPalestinianPanamanianPennsylvania GermanPeruvianPolishPortuguesePotawatomiPuebloPuerto RicanRomanianRussianSalvadoranSamoanScandinavianScotch-IrishScottishSeminoleSerbianSiouxSlavicSlovakSloveneSomaliSouth AfricanSouth AmericanSpaniardSpanishSri LankanSubsaharan AfricanSudaneseSwedishSwissSyrianThaiTlingit-HaidaTrinidadian and TobagonianTurkishUkrainianVenezuelanVietnameseWelshWest IndianYugoslavianZimbabwean
Immigrant Origin (Total)
AfghanistanAfricaArgentinaAsiaAustraliaBangladeshBarbadosBelarusBosnia and HerzegovinaBrazilBurma / MyanmarCameroonCanadaCaribbeanCentral AmericaChileChinaColombiaCongoCosta RicaCroatiaCubaCzechoslovakiaDominican RepublicEastern AfricaEastern AsiaEastern EuropeEgyptEl SalvadorEnglandEthiopiaEuropeFranceGermanyGhanaGreeceGuatemalaHondurasHong KongHungaryIndiaIndonesiaIranIraqIrelandIsraelItalyJamaicaJapanJordanKazakhstanKenyaKoreaKuwaitLaosLatin AmericaLatviaLithuaniaMalaysiaMexicoMiddle AfricaMoroccoNepalNetherlandsNicaraguaNigeriaNorthern AfricaNorthern EuropeOceaniaPakistanPanamaPeruPhilippinesPolandPortugalRomaniaRussiaSaudi ArabiaScotlandSierra LeoneSomaliaSouth AfricaSouth AmericaSouth Central AsiaSouth Eastern AsiaSouthern EuropeSpainSri LankaSudanSyriaTaiwanThailandTrinidad and TobagoTurkeyUgandaUkraineVenezuelaVietnamWestern AfricaWestern AsiaWestern EuropeZaireZimbabwe
Immigrant Origin (Percentage)
AfghanistanAfricaArgentinaAsiaAustraliaBangladeshBarbadosBelarusBosnia and HerzegovinaBrazilBurma / MyanmarCameroonCanadaCaribbeanCentral AmericaChileChinaColombiaCongoCosta RicaCroatiaCubaCzechoslovakiaDominican RepublicEastern AfricaEastern AsiaEastern EuropeEgyptEl SalvadorEnglandEthiopiaEuropeFranceGermanyGhanaGreeceGuatemalaHondurasHong KongHungaryIndiaIndonesiaIranIraqIrelandIsraelItalyJamaicaJapanJordanKazakhstanKenyaKoreaKuwaitLaosLatin AmericaLatviaLithuaniaMalaysiaMexicoMiddle AfricaMoroccoNepalNetherlandsNicaraguaNigeriaNorthern AfricaNorthern EuropeOceaniaPakistanPanamaPeruPhilippinesPolandPortugalRomaniaRussiaSaudi ArabiaScotlandSierra LeoneSomaliaSouth AfricaSouth AmericaSouth Central AsiaSouth Eastern AsiaSouthern EuropeSpainSri LankaSudanSyriaTaiwanThailandTrinidad and TobagoTurkeyUgandaUkraineVenezuelaVietnamWestern AfricaWestern AsiaWestern EuropeZaireZimbabwe
Income
Income (Families)
Income (Households)
Poverty
Poverty (Families)
Unemployment
Employment Occupations
Employment Industries
Employer Class
Commute Time
Commute Means
School Enrollment
Education by Degree Field
Occupancy
Finances
Physical Characteristics
Omaha
Compare Zip Codes
Comparison Subject

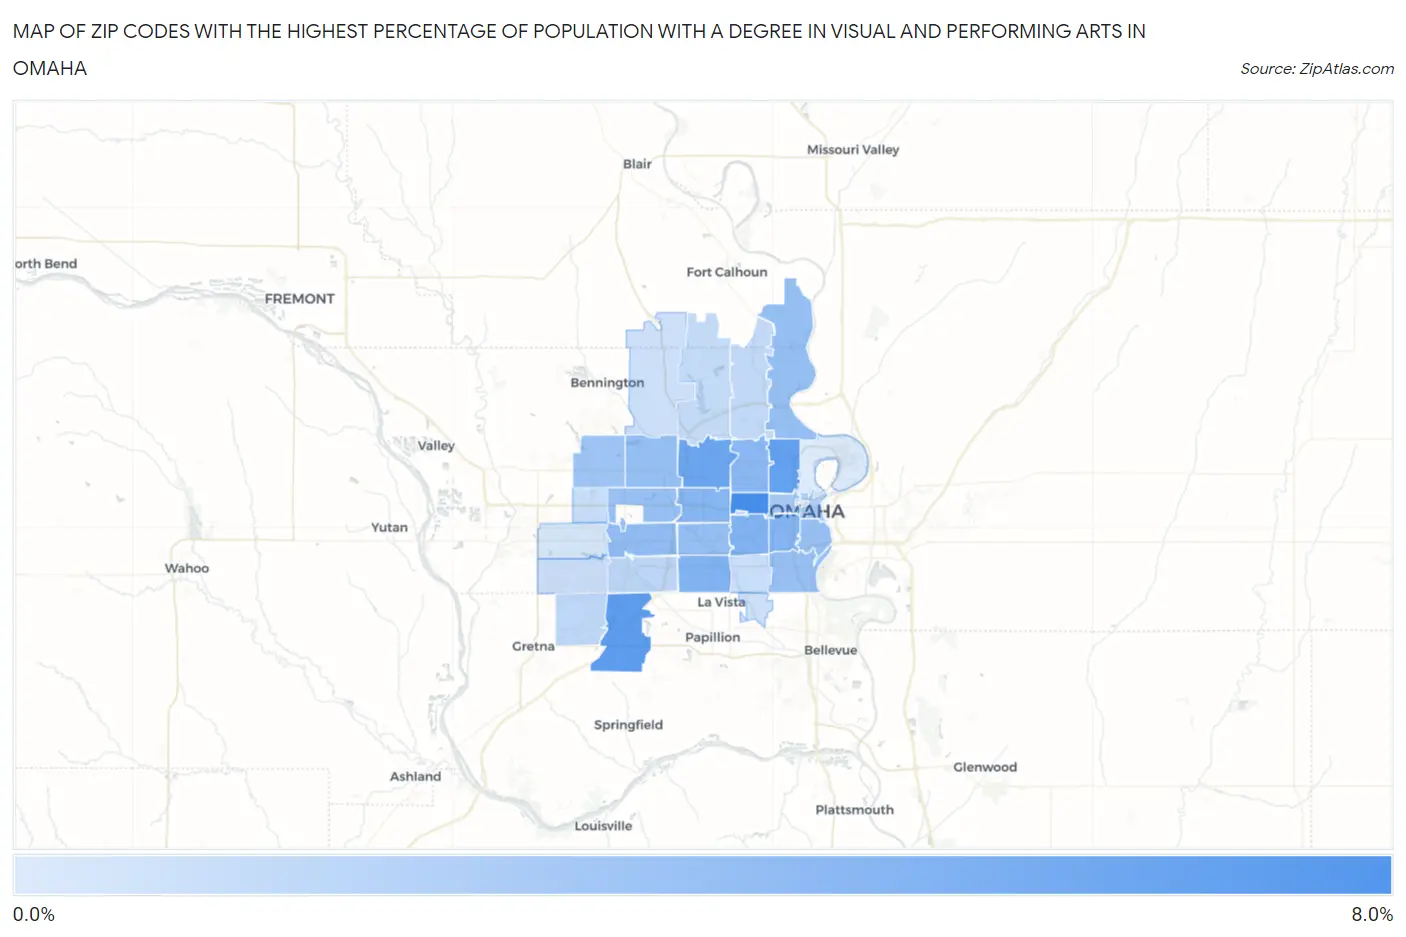
Map of Zip Codes with the Highest Percentage of Population with a Degree in Visual and Performing Arts in Omaha

0.0%
8.0%
Zip Codes with the Highest Percentage of Population with a Degree in Visual and Performing Arts in Omaha Map

Zip Codes with the Highest Percentage of Population with a Degree in Visual and Performing Arts in Omaha, NE

Zip Code % Graduates vs State vs National
1.681327.5%3.3%(+4.21)#334.3%(+3.23)#3,225
2.681386.5%3.3%(+3.25)#494.3%(+2.27)#4,201
3.681116.3%3.3%(+3.05)#504.3%(+2.06)#4,455
4.681345.9%3.3%(+2.62)#574.3%(+1.64)#5,021
5.681065.1%3.3%(+1.80)#744.3%(+0.821)#6,477
6.681275.0%3.3%(+1.75)#774.3%(+0.767)#6,586
7.681054.9%3.3%(+1.59)#814.3%(+0.611)#6,940
8.681144.7%3.3%(+1.45)#834.3%(+0.466)#7,262
9.681044.7%3.3%(+1.41)#844.3%(+0.429)#7,345
10.681444.4%3.3%(+1.14)#864.3%(+0.153)#8,079
11.681124.2%3.3%(+0.898)#954.3%(-0.085)#8,724
12.681244.1%3.3%(+0.868)#964.3%(-0.116)#8,812
13.681644.1%3.3%(+0.855)#984.3%(-0.129)#8,861
14.681544.1%3.3%(+0.850)#1004.3%(-0.134)#8,876
15.681084.1%3.3%(+0.845)#1014.3%(-0.139)#8,891
16.681074.1%3.3%(+0.839)#1024.3%(-0.145)#8,919
17.681163.7%3.3%(+0.473)#1154.3%(-0.511)#10,027
18.681313.4%3.3%(+0.137)#1294.3%(-0.847)#11,239
19.681023.1%3.3%(-0.188)#1394.3%(-1.17)#12,407
20.681372.5%3.3%(-0.756)#1634.3%(-1.74)#14,569
21.681362.4%3.3%(-0.846)#1704.3%(-1.83)#14,908
22.681522.4%3.3%(-0.907)#1744.3%(-1.89)#15,137
23.681222.2%3.3%(-1.02)#1774.3%(-2.00)#15,536
24.681172.1%3.3%(-1.18)#1834.3%(-2.16)#16,101
25.681182.1%3.3%(-1.20)#1864.3%(-2.18)#16,174
26.681352.0%3.3%(-1.25)#1904.3%(-2.23)#16,392
27.681421.9%3.3%(-1.37)#1944.3%(-2.35)#16,792
28.681571.8%3.3%(-1.47)#2064.3%(-2.46)#17,154
29.681301.5%3.3%(-1.72)#2244.3%(-2.71)#18,017
30.681101.2%3.3%(-2.03)#2394.3%(-3.02)#18,954

Common Questions

What are the Top 10 Zip Codes with the Highest Percentage of Population with a Degree in Visual and Performing Arts in Omaha, NE?
Top 10 Zip Codes with the Highest Percentage of Population with a Degree in Visual and Performing Arts in Omaha, NE are:
#1
7.5%
#2
6.5%
#3
6.3%
#4
5.9%
#5
5.1%
#6
5.0%
#7
4.9%
#8
4.7%
#9
4.7%
#10
4.4%
What zip code has the Highest Percentage of Population with a Degree in Visual and Performing Arts in Omaha, NE?
68132 has the Highest Percentage of Population with a Degree in Visual and Performing Arts in Omaha, NE with 7.5%.
What is the Percentage of Population with a Degree in Visual and Performing Arts in Omaha, NE?
Percentage of Population with a Degree in Visual and Performing Arts in Omaha is 4.0%.
What is the Percentage of Population with a Degree in Visual and Performing Arts in Nebraska?
Percentage of Population with a Degree in Visual and Performing Arts in Nebraska is 3.3%.
What is the Percentage of Population with a Degree in Visual and Performing Arts in the United States?
Percentage of Population with a Degree in Visual and Performing Arts in the United States is 4.3%.